
94% of researchers rate our articles as excellent or good
Learn more about the work of our research integrity team to safeguard the quality of each article we publish.
Find out more
ORIGINAL RESEARCH article
Front. Earth Sci. , 03 November 2023
Sec. Geoinformatics
Volume 11 - 2023 | https://doi.org/10.3389/feart.2023.1292945
This article is part of the Research Topic Coal and Rock Dynamic Disasters: Advances of Physical and Numerical Simulation in Monitoring, Early Warning, and Prevention, volume II View all 29 articles
 Chengheng Hou1,2*
Understanding the characteristics and mechanism of slope deformation caused by slope excavation and water storage is very important in the stability analysis of slope engineering. Therefore, based on similarity theory, a physical model test of excavation and water storage was established, and the deformation characteristics of the slope (three-stage excavation and five-stage water storage) were studied by using the monitoring technology of multiple measuring devices. The variation characteristics of the displacement, stress and pore water pressure in the slope were revealed. The results show that the contents of cement and yellow sand can regulate the physical, mechanical and hydrological properties and that gypsum and hydraulic oil have an effect on the permeability. Excavation leads to deformation of the rock mass in the middle and lower slope to the outside of the slope. This is attributed to the stress release, and local stress concentration occurs at the foot of the slope after redistribution. Moreover, the rock mass located in the fault zone shows nonglobal movement because the hanging wall rock mass will produce relative dislocation along the fault zone under self-gravity. Under water storage, the slope body is affected by the hydrostatic pressure, and transient compaction deformation occurs first. As water permeates into the slope body, the water weakens the rock mass, resulting in the gradual deformation of the rock mass near the slope surface to the outside of the slope. The above model test results can provide a valuable reference for slopes stability analysis in construction and subsequent operation.
In the process of excavation and water storage of underground structures, the deformation and sliding damage of rock will bring serious economic losses and personnel safety accidents (Tang et al., 2016; Yin et al., 2019; Yu et al., 2019; Yin et al., 2021a; Yang et al., 2022). To study the cause and formation process of these hazards, a large number of indoor physical model tests based on the physical and mechanical properties of similar materials have appeared (Zhang et al., 2007; Tang et al., 2017; Yang et al., 2019; Prodan et al., 2023). These physical model tests have great guiding value for simulating the deformation process and failure of complex structures in hydraulic slope engineering the field. A large number of monitoring values from model tests can intuitively provide the deformation characteristics of the slope in different environments and reveal its influencing factors (Tang et al., 2018b; Zheng et al., 2018; Tao et al., 2020; Yin et al., 2021b). And numerical simulation methods are also used to study the failure and deformation process of rock (Tang et al., 2006; Tang and Tang, 2015; Tang et al., 2020). Many scholars have established physical models under different geological conditions to identify and monitor the stress and strain field data inside a slope and the change law of the pore water pressure to study the deformation mechanism and instability process of the slope during excavation and water storage.
Zhu et al. (2020) established a physical model of slope excavation in anti-dip strata and studied the evolution characteristics of the displacement field and strain field of the excavation process model by using a variety of monitoring methods. Adhikary et al. (1997) used a sand-gypsum mixture and a fiber cement board to carry out centrifugal experiments on a horizontal slope with a jointed appearance to study the bending failure mechanism of the slope. Ding et al. (2020) simulated the deformation law of slope rock mass by constructing a geological engineering model, defined the main influencing factors of slope instability, and analyzed the movement and failure characteristics of the rock mass. Huang et al. (2023) carried out model tests to monitor the whole displacement field and failure sequence of the slope and analysed the influence mechanism of a water level change on the slope deformation and failure mechanism under excavation. Cao et al. (2022) used formal simulation materials to construct a similar shape of a dump and studied the failure characteristics and model landslide mechanism under different loads based on the monitoring data. Sun and Zhao (2014) established different physical models of a slope and studied different evolution stages of the slope according to the proposed simplified geomechanical model. Lo and Weng (2017) studied the deformation process and failure characteristics of fractured slopes under complex conditions through field investigation and physical model experiments and believed that the facet dip angle was the key factor determining slope deformation.
Wu et al. (2015) employed a series of physical models to simulate experiments of water infiltration into slopes under different conditions and analysed the main factors leading to slope instability and failure. Hu et al. (2019) studied the influence mechanism of slope deformation and stability under reservoir filling and believed that the increase in the pore water pressure was a critical period in the occurrence of large deformation of landslides based on physical model tests. (Tang, 2018; Tang et al., 2018a; Tang et al., 2022) analysed the influence of water on rock failure characteristics and damage mechanism in the long-term and short-term environment. Tang et al. (2021) also studied the influence relationship of water on rock fracture toughness based on the edge-cracked semicircular bend (SCB) testing. Liang et al. (2021) and Liang et al. (2023) Liang et al. studied the triaxial and shear characteristics of sandstone, and established an empirical equation for the change of mechanical characteristics of sandstone with water content and immersion time. Chen et al. (2021) analyzed the long-term and short-term failure mechanism of rock caused by water level height. Ding et al. (2023) studied the failure characteristics and damage mechanism of sandstone under different water absorption time. In recent years, the model tests of slopes under the common conditions of slope excavation and water storage have been different from the actual working conditions, and most of them only include surface deformation observation. Moreover, the understanding of the deformation mechanism and instability failure of slopes under different conditions needs to be further improved. To better guide the construction and later operation of actual engineering projects, it is necessary to study the variation characteristics of the deformation, stress and pore water pressure of the slope and internal broken body under unloading and water storage conditions.
Based on the selection principle of similar materials and similarity theory, this study determines the appropriate model materials and the optimal material ratio through physical and mechanical tests. First, a physical model of slope excavation is established based on the geological structure of the on-site rock stratum and fault zone, and the three excavation processes of the slope are simulated. The slope stability (deformation, surface settlement and internal stress) by each excavation disturbance are monitored and analysed. Then, the whole process of water storage is simulated by changing the water storage level (five water levels), and the slope deformation, surface subsidence, slope internal stress and pore water pressure changes in each storage period are studied and discussed.
In a simulated geomechanical model, three main factors affect the results of the test: the geometric size of the physical simulation test, the mechanical properties of the rock mass material and the boundary conditions of the physical model. In the model test, it is necessary to ensure that the physical model is similar to the original structure in physical phenomena to ensure that the results obtained by the test can be replicated by the prototype. According to similarity theory, geometric similarity of the model is a prerequisite for similar physical phenomena (Wu et al., 2020a; Wu et al., 2020b), so the geometrically similar condition is a key in the design of the structural model. The similarity scale is obtained by comparing the sizes of the model and the prototype, and the corresponding proportions of the mechanical parameters between the physical model materials and the prototype slope materials should also be equal or proportional (Shi et al., 2015). Therefore, according to the similarity principle and test requirements, the length of the model, the bulk density of the materials, the uniaxial compressive strength, the tensile strength, the cohesion, the internal friction angle, the Poisson’s ratio, and the displacement and stress, which reflect physical phenomena, are selected to describe the change process in slope excavation and water storage.
In this study, considering the accuracy of the test, the workload and economic indicators in making the model and performing the test, the difficulty of finding the model materials and the scope of the simulated prototype (Huang et al., 2013), the geometric similarity ratio of rock and soil mass was selected as 1000 in the excavation and water storage test (Cl=1000). At the same time, to ensure that the landslide thrust generated by the rock and soil mass under the action of the self-gravity stress field was highly consistent with the actual situation, the similarity ratio of the rock and soil mass was 1.3 (Cγ=Cρ=1000). Therefore, the theoretical physical and mechanical parameters of the corresponding model test materials were calculated as shown in Table 1.
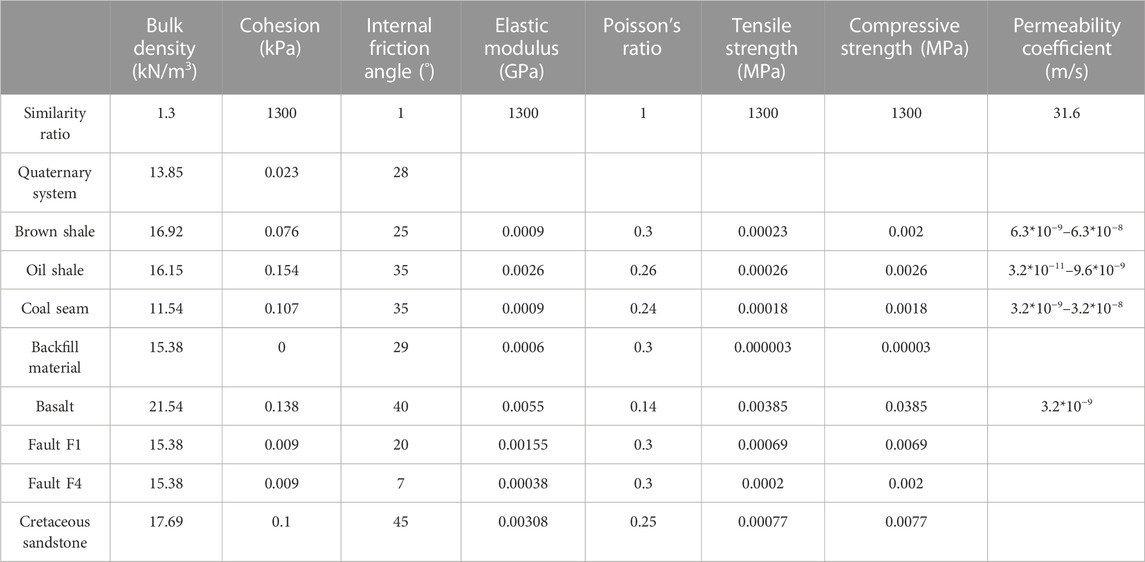
TABLE 1. Model parameters in the excavation and water storage simulation test.
Based on the elastic modulus, Poisson’s ratio, creep, thermal conductivity and other factors, similar materials are generally composed of three components: aggregate, adhesive and additive (Zuo et al., 2004; Zhang et al., 2008). Based on the comparison of the performance, advantages and disadvantages of similar material combinations (Cheng et al., 2016; Zhang et al., 2019), the selection principle and physical-mechanical parameters of similar materials are also considered for the model test object of this study. Finally, yellow sand, gypsum, cement and water were used as raw materials of similar materials, as shown in Figure 1. Different materials play different roles, for example, yellow sand, as a filling material, is used to adjust the weight, with a certain cohesion; gypsum and cement, as cementing materials, are used to control the material mechanical properties; water, with a mixing function, is used to meet the process requirements; hydraulic oil, as a regulator, is used to adjust the permeability, which does not affect the other material properties; and coloured iron powder dye is used to distinguish different rock and soil layers.
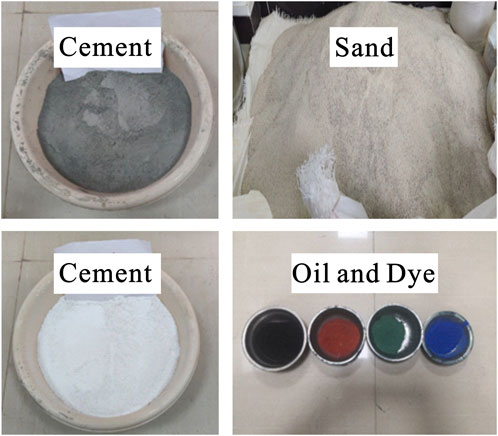
FIGURE 1. Similar materials of samples for physical models.
According to the materials selected above and previous studies (Wen et al., 2020; Shi et al., 2021), we designed 24 groups of ratio tests and made samples for uniaxial compressive strength tests (50 mm × 100 mm), standard samples for direct shear tests (61.8 mm × 20 mm) and standard samples for percolation tests (61.8 mm × 40 mm) with different ratios, as shown in Figure 2. The process of making standard specimens of similar materials was as follows:
1. Preparation of raw materials: Yellow sand was screened with a standard screen of 2.36 mm, and cement, gypsum, water and hydraulic oil were accurately weighed according to the test scheme.
2. Preparation of the mould: The tray and cylinder of the mould were installed, and whether the mould was installed in place and whether the cylinder and tray were tightly clamped were checked. At the same time, for convenience of demoulding, the inner wall of the mould needed to be coated with hydraulic oil and allowed to sit for a period of time before being coated with petroleum jelly.
3. Mixing of materials: The proportionally weighed yellow sand was poured into the mixing container and evenly stirred. Then, cement and gypsum were evenly added, and water and hydraulic oil were added. The mixture was evenly stirred during addition of the materials, fully stirred and set aside.
4. Weighing and feeding: An electronic balance was used to weigh a certain quantity of the mixed material, and a funnel was used to add the material into the mould cylinder. Material falling was avoided in the process of feeding.
5. Material pounding: The materials were crushed in layers with a compactor after adding the materials into the cylinder.
6. Demoulding and labelling: After 2 days of natural drying, the sample was demoulded. After completion of the mould, the specimen was carefully removed, and each specimen was labelled.
7. Natural curing: The moulded specimen was placed indoors for natural curing, and the curing time was 2 days.
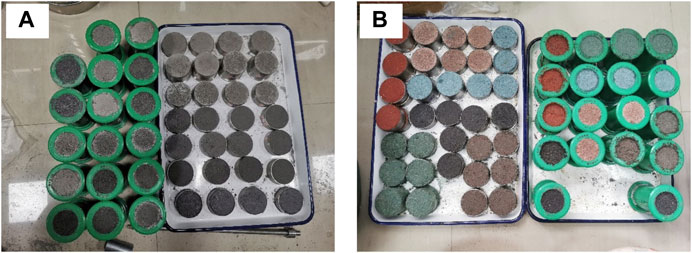
FIGURE 2. Mechanical sample preparation of similar materials with different ratios.
After curing, the uniaxial compressive strength, elastic modulus, Poisson’s ratio, tensile strength, permeability, heavy weight, cohesion and internal friction angle of similar materials with different proportions were measured by laboratory tests. Referring to the above, the relative ratios of the physical and mechanical parameters of the corresponding model test materials were calculated, and the similar material ratio schemes of the final excavation and water storage physical models are shown in Table 2.
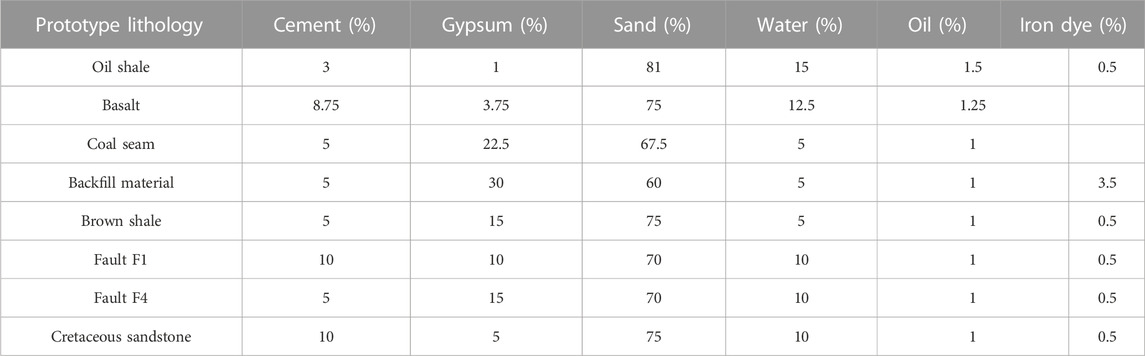
TABLE 2. Similar material ratios in excavation and water storage simulation tests.
The size of the model box in this study is 200 cm × 50 cm × 100 cm. The box is composed of five 2.5 cm thick transparent acrylic plates, a fixed frame and angle steel fixtures. The highly transparent acrylic plate can withstand the heavy filling of the model, and because of its high transparency, it is easy to observe and record the deformation of the model from all angles during the test. The fixed frame is made of aluminium alloy and fixed through screws to the angle steel fixtures, which are used to fix four stress plates. Considering the compression of the model body and mutual interference caused by the loading process between the adjacent loading plates. Angle steel is placed between the adjacent loading plates to close the gap between the loading plates during the filling of the model. So that the force plate neither expands outwards nor overturns in the filling and compaction of the material, which is conducive to filling of the material. At the same time, three beams are added at the bottom. They are used to support the deformation of the bottom bearing plate when the model is loaded.
In this physical simulation test, the geometric similarity ratio is determined according to the similarity relationship between the original slope and the test model, and the geometric similarity ratio of the excavation and water storage simulation test model is 1:1000. The model slope design is shown in Figures 3A, B. After the preliminary preparation of the test model is completed, the packing is started, the thickness of each rock and soil layer is converted to the model box according to similarity theory, and different matching schemes are determined according to the physical and mechanical parameters of different rock layers after the similarity theory conversion. According to the required proportions of similar materials in each layer, the similar materials are weighed in proportion by an electronic balance and evenly stirred. The mixed materials are loaded into the filling box and crushed. Sensors are installed at the corresponding positions according to the test requirements during the filling process. After the filling is completed, the test can be carried out after a week of maintenance in the natural state (Figure 3C).
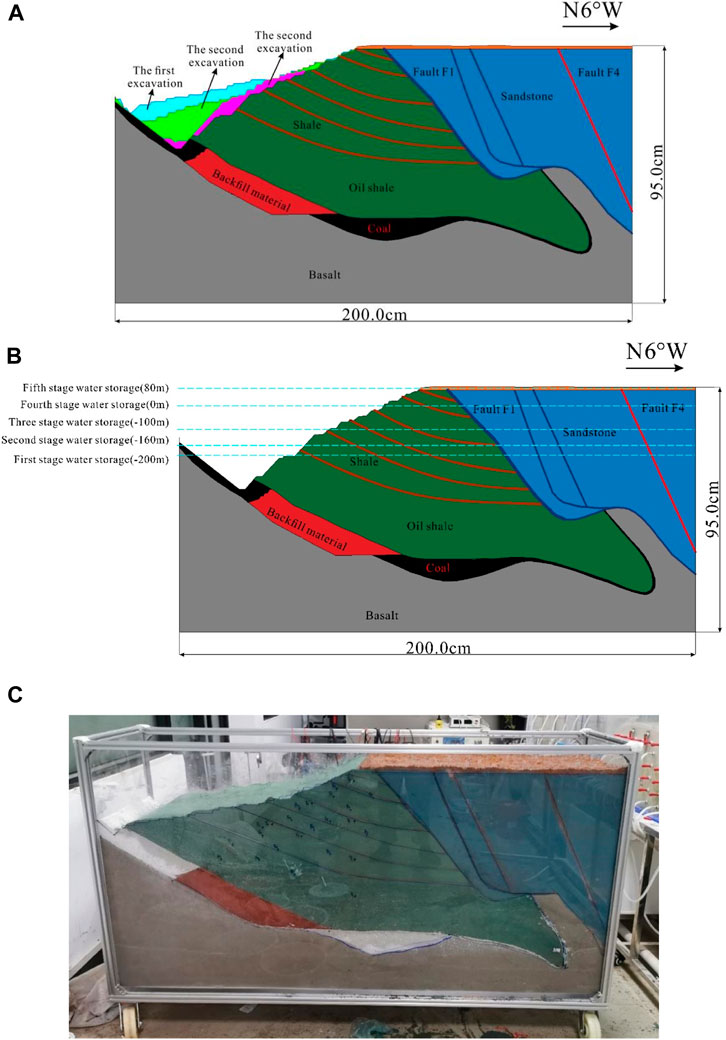
FIGURE 3. Design drawing of the simulation test and slope model: (A) excavation, (B) water storage, (C) slope physical model.
In this study, a TST3827E static strain acquisition instrument is used to monitor the stress (Figure 4A), and a sensor system composed of dial indicator displacement meters, earth pressure boxes, seepage meters and a digital image detection device is used to collect the stress change and deformation data of the slope model. The dial indicator displacement meters and ZBL-V6O0 multipoint digital image detection device are used to observe the macroscopic deformation characteristics (Figures 4B, C). YLH17 miniature earth pressure boxes (with a size of 17*10 mm, a range of 30 kPa and 0.05% Fs) and KXYL20-type pore water lysimeters (with a size of 20*13 mm, a range of 30 kPa and 0.5%–0.05% Fs) are used to collect soil pressure and pore water pressure data of different parts, respectively (Figures 4D, E). To simulate the slope water storage test and keep the water storage level stable, a stable head water supply device was made. The device comprises a pumping tank, a simple connector and two pumping pumps. The water level is controlled by changing the height of the water supply tank (Figure 4F).
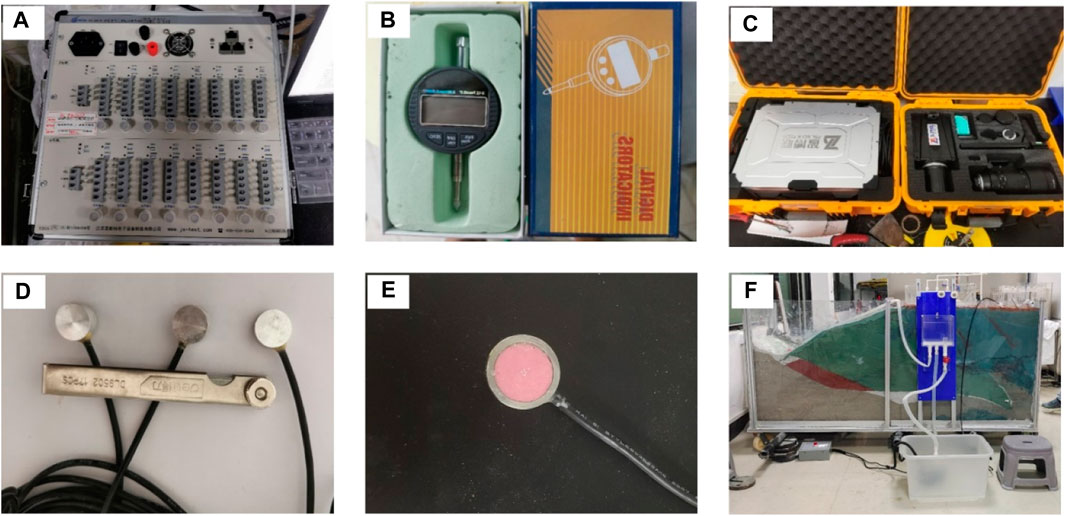
FIGURE 4. Data acquisition system: (A) TST3827E static strain acquisition instrument, (B) dial indicator displacement meter, (C) ZBL-V6O0 multipoint digital image detection device, (D) YLH17 miniature earth pressure box, (E) KXYL20-type pore water lysimeter, (F) stable head water supply device.
According to the annual slope contour, excavation was carried out three times in this test (Figure 3A). The excavation simulation test was mainly performed to observe the slope deformation, ground surface settlement and slope stress changes during and after the excavation.
A digital image detection device is used for slope deformation observation. The arrangement of measurement points is shown in Figure 5A, where observation points M1-5 are parallel to the slope and mainly observe the displacement of the lower part of the excavation slope. Observation points M6-10 are parallel to the surface and mainly observe surface subsidence. Observation points M11-13 are located in the interior of the slope and mainly observe the change in the weak interlayer in the interior of the slope. Observation points M14 to 18 are located on both sides of fault F1 and fault F4 and mainly observe the difference in the displacement change on both sides of fault F1 and fault F4.
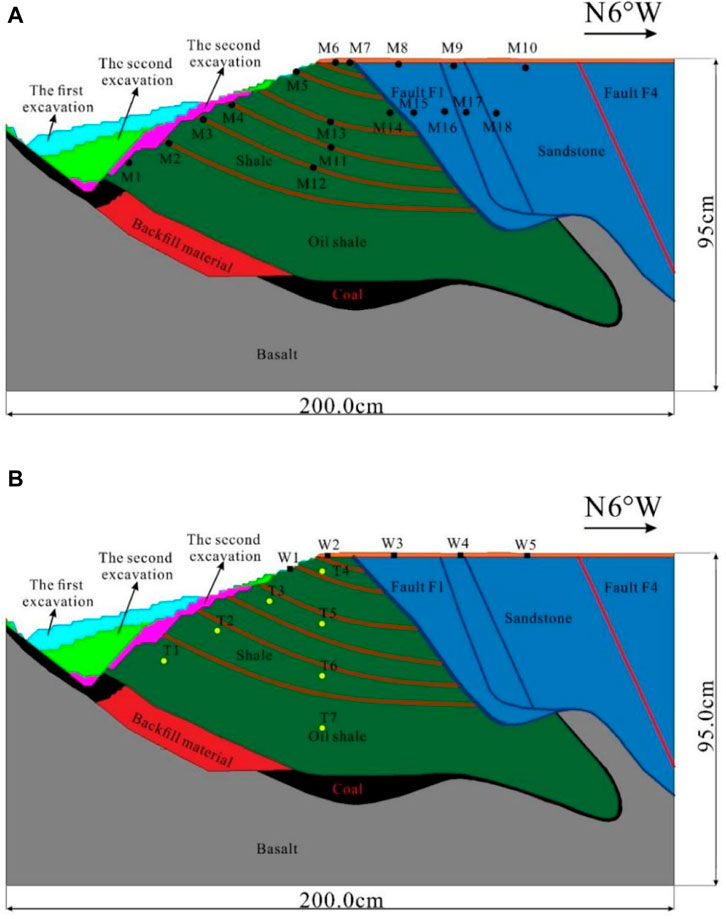
FIGURE 5. Layout diagram of slope deformation observation points in the excavation simulation test: (A) observation schematic diagram, (B) monitoring device layout.
Five dial indicator displacement meters are arranged in the model slope, among which two dial indicator displacement meters are arranged on the upper slope of the slope body, located at the central axis of the slope body; the spacing is 10 cm, and the numbers are W1 and W2. Three dial indicator displacement meters are arranged at the top of the slope, located at the central axis of the slope body, with a spacing of 20 cm, which are numbered W3-W5 (Figure 5B).
Seven earth pressure boxes are arranged in the model slope, all of which are arranged on the longitudinal section of the central axis of the slope body (see Figure 5B). Among them, the pressure surfaces of T5 and T7 face the surface, and the other five earth pressure boxes are buried with their surfaces facing the normal direction outside the stratum plane. Four earth pressure boxes are arranged parallel to the slope surface, with a transverse interval of 15.7 cm–16.0 cm, numbered T1-T4. Three earth pressure boxes are arranged perpendicular to the top of the slope from top to bottom, with an interval of 15.0 cm, numbered T5 to T7. Since the earth pressure boxes have a certain size and thickness, embedded parts with the same size as the earth pressure boxes are placed at the corresponding positions, fixed, packed, and compacted twice during the installation process. Before tamping the lower material, the embedded parts are slowly dug out, and the earth pressure boxes are placed, fixed, packed and gently tamped.
In the test preparation stage, the earth pressure boxes and the dynamic and static strain acquisition instruments are connected, the data acquisition frequency is 0.1 Hz, and the connection mode is full bridge. After the normal debugging operation of the instruments, the initial value is set to zero. After confirming that the dial indicator is set to zero, the displacement monitoring device can work normally and collect data, formal monitoring is started, and the slope is excavated. After the excavation, dial indicator displacement meter readings are first recorded every 1 min. After 1 h, dial indicator displacement meter readings are recorded every 5 min. After 2 hours, dial indicator displacement meter readings are recorded every 10 min, and to confirm that the model reaches a completely stable state inside, the actual single monitoring duration is more than 3 h. After the data of the sensors and the dial indicator displacement meters are stable, the next excavation is carried out, and the test is finished when the data of the three excavation simulation tests are stable.
This test was mainly performed to study the slope deformation, surface settlement, slope stress and pore water pressure in the process of water storage. Water storage was mainly divided into five stages, and the specific scheme was designed as follows:
First stage of water storage: Water is stored at the foot of the slope up to 28 cm from the surface (equivalent to the prototype level of −200 m), and the water level is kept stable. Continuous observation and monitoring are carried out for 6 h to record the changes in slope deformation, surface settlement, slope stress and pore water pressure.
Second stage of water storage: On the basis of the first-stage water level, the second-stage water level is increased by 4 cm–24 cm from the surface (equivalent to the prototype level of −160 m), and the water level is kept stable. Continuous observation and monitoring are carried out for 18 h to record the changes in slope deformation, surface settlement, slope stress and pore water pressure.
Third stage of water storage: On the basis of the second-stage water level, the third-stage water level is increased by 6 cm–18 cm from the surface (equivalent to the prototype level of −100 m), and the water level is kept stable. Continuous observation and monitoring are carried out for 36 h to record the changes in slope deformation, surface settlement, slope stress and pore water pressure.
Fourth stage of water storage: On the basis of the third-stage water level, the fourth-stage water level is increased 10 cm–8 cm from the surface (equivalent to the original ±0 m level), and the water level is kept stable. Continuous observation and monitoring are carried out for 60 h to record the changes in slope deformation, surface settlement, slope stress and pore water pressure.
Fifth stage of water storage: On the basis of the fourth-stage water level, the fifth-stage water level is increased by 8 cm–0 cm from the surface (equivalent to the prototype Quaternary system level), and the water level is kept stable. Continuous observation and monitoring are carried out for 96 h to record the changes in slope deformation, surface settlement, slope stress and pore water pressure.
The stable head water supply system was used in the test to realize raising and stability of the storage water level. The water storage simulation test was mainly performed to observe the slope deformation and surface settlement under different water storage levels and to monitor slope stress and pore water pressure changes.
The slope deformation observation adopts a multipoint digital image detection device, and the arrangement of measurement points is shown in Figure 6A. Observation points M1-5 are parallel to the slope and mainly observe the displacement of the lower part of the excavation slope. Observation points M6-10 are parallel to the surface and mainly observe surface subsidence. Observation points M11-13 are located in the interior of the slope and mainly observe the change in the weak interlayer in the interior of the slope. Observation points M14-18 are located on both sides of fault F1 and fault F4 and mainly observe the difference in the displacement change on both sides of fault F1 and fault F4.
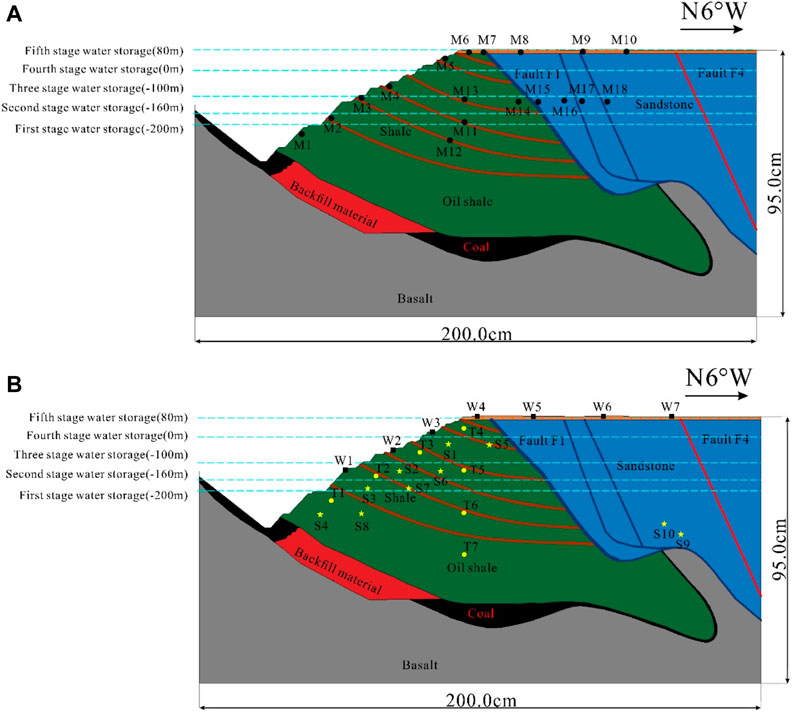
FIGURE 6. Layout diagram of slope deformation observation points in the water storage simulation test: (A) observation schematic diagram, (B) monitoring device layout.
A total of 7 dial indicator displacement meters are arranged in the model slope, among which 3 dial indicator displacement meters are arranged on the surface of the slope body, located at the central axis of the slope body. The spacings are 17 cm and 14 cm, and the numbers are W1, W2 and W3. Four dial indicator displacement meters are arranged at the top of the slope, located at the central axis of the slope body. The spacings are 19.7 cm, 25.5 cm, and 24.6 cm, and the numbers are W4-W7 (Figure 6B). Because the water storage level rises to above the dial indicator displacement meter, W1 is removed from the third stage of water storage, W2 is removed from the fourth stage of water storage, and W3 is removed from the fifth stage of water storage.
A total of 7 earth pressure boxes are arranged in the model slope, all of which are arranged on the longitudinal section of the central axis of the slope body (Figure 6B). Among them, the T5 and T7 compression surfaces are towards the surface, and the other 5 earth pressure boxes are buried with their surfaces facing the normal direction outside the rock plane. Among them, four earth pressure boxes are arranged parallel to the slope surface, with a transverse interval of 15.7 cm–16.0 cm, numbered T1-T4. Three earth pressure boxes are arranged perpendicular to the top of the slope from top to bottom with an interval of 15.0 cm, numbered T5-T7. Since the earth pressure boxes have a certain size and thickness, embedded parts with the same size as the earth pressure boxes are placed at the corresponding positions, fixed, packed, and compacted twice during the installation process. Before tamping the lower material, the embedded parts are slowly dug out, and the earth pressure boxes are placed, fixed, packed and gently tamped.
A total of 10 seepage gauges are arranged in the model slope, all of which are arranged below the periodically changing water level elevation. S1-S4 and S5-S8 are alternately arranged on both sides of the longitudinal section of the central axis of the slope body, 12 cm from the central axis. The longitudinal spacings are 9.4 cm, 6.2 cm, and 9.3 cm. Two seepage gauges are arranged at the same horizontal position. S9 and S10 are arranged on both sides of the longitudinal section of the central axis of the slope body, 12 cm from the central axis, and the longitudinal spacings are 25.8 cm and 21.3 cm, respectively (Figure 6B). The lysimeters are saturated in water before burial, and the burial method is the same as that of the earth pressure boxes.
According to the design of the water storage simulation test scheme, the water level of the first stage of water storage is controlled at 280 m below the surface of the prototype, which is 28 cm below the surface of the model. After confirming that the dial indicator displacement meters are set to 0, the acquisition system, sensors and displacement detection devices can work normally and collect data. The stable head water supply device is turned on for water storage. The observation time of each stage of the water storage simulation test is successively increased and is 6 h, 18 h, 36 h, 60 h and 96 h. After reaching the required observation time, the numerical changes in the sensors and dial indicator displacement meters are observed. After the changes in the sensors and dial indicator displacement meters tend to be stable, the height of the water supply tank is changed to the water storage level of the next stage, and the next stage of water storage is carried out. When the observation time of the last stage of the water storage simulation test is reached and the values of the sensors and dial indicator displacement meters are stable, the water storage simulation test is finished.
The collected observation point deformation data are processed by MATLAB to obtain the relationship curve between the horizontal displacement, vertical displacement and time, as shown in Figure 7, where the horizontal displacement is positive when the observation point moves to the left and negative when it moves to the right. The horizontal and vertical displacements of M1-18 indicate obvious deformation in the same direction in both the horizontal and vertical directions, indicating the overall load unloading deformation of the slope to the outside of the slope.
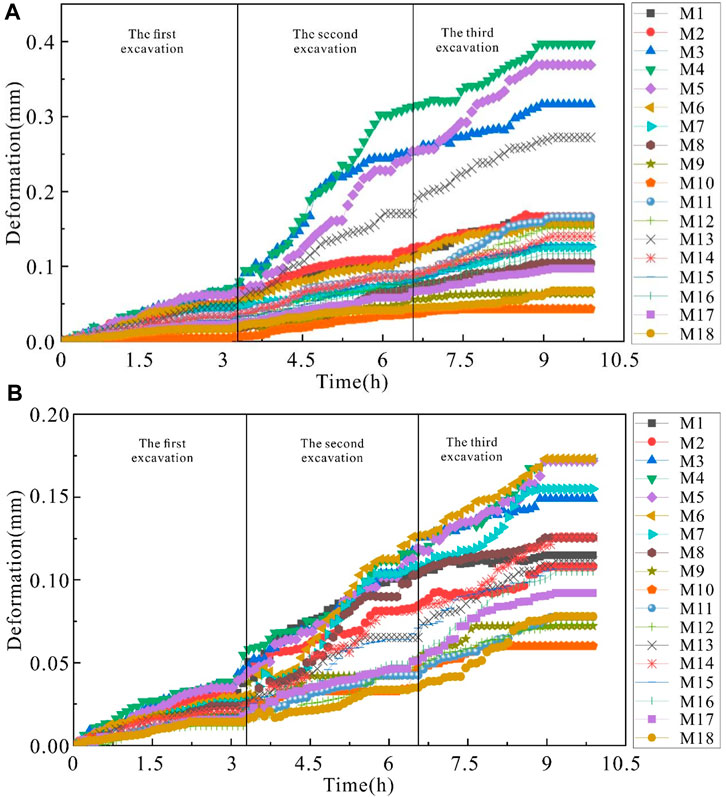
FIGURE 7. Change in the deformation at M1-18 during excavation: (A) horizontal deformation, (B) vertical deformation.
After each excavation, unloading deformation occurs at M4with the largest changes, and then the deformation gradually increased and the amplitude gradually decreased due to the continuous adjustment of the stress of slope. M1 is deformed first, and M2-18 begin to respond to deformation later because M1 is located at the foot of the slope and has an obvious response to the excavation disturbance stress concentration. The horizontal deformation (Figure 7A) in the area near the slope surface is greater than the vertical deformation (Figure 7B), the side slope angle formed by excavation is small, the horizontal stress change of the excavated slope surface is greater than the vertical stress change, and the horizontal deformation in the area near the oil shale in the slope is greater than the vertical deformation. These phenomena all occur in the weak layer of brown shale, and the horizontal stress change is greater than the vertical stress change.
The excessive excavation of rock mass in the middle and lower parts of the slope makes the slope angle in this area the largest, resulting in the largest deformation near the slope surface. In the interbed area of oil shale and brown shale in the slope body, the overall deformation is small, and the deformation is minimal near the fault F1 and fault F4. With increasing excavation depth, deformation of the internal rock mass to the slope surface is generated, and the variation range is gradually expanded. The deformation of the slope surface is much larger than that of the internal rock mass, and the deformation is significantly reduced with extension into the interior of the slope. The influence zone of slope excavation is located on the left side of the fault F1 from the slope to the interior of the slope body. The deformation zone on the surface of the slope body is within a certain range. With increasing excavation depth, the redistribution of unloading stress caused by excavation produces macroscopic creep deformation on the surface of the slope body. Due to the excavation, the surface of the slope rock mass in the region has been displaced to different degrees over a large range, and the initial displacement is small and then increases.
According to the cumulative deformation in the excavation test (Figure 7). The origin is at the lower left corner (Figure 3A), and the coordinates are (N200, -875). The horizontal deformation near the middle of the slope (N890, 817) reaches the maximum (0.3973 mm). This area is above the excavation line and in the soft brown shale rock layer, so the maximum horizontal deformation occurs here. The rock mass located in the compound fold structure area below the fracture zone of the F1 fault has a large vertical displacement, which indicates that this part of the rock mass is misaligned along the weak plane under the action of the self-gravity stress and the self-gravity of the toppling rock mass of the hanging wall. The deformation curves of M14 and 15 on the two sides of the hanging wall and footwall zones of fault F1 show a great difference. The vertical displacement of the hanging wall zone is larger than that of the footwall zone, and overall dislocation occurs compared with the footwall rock mass. This trend is also observed at M17 and 18 on the two sides of the hanging wall and footwall zones of fault F4. The deformation direction of the footwall zone of the fault is roughly the same, but the fault does not move as a whole. The vertical displacement of the footwall zone is larger than that of the hanging wall zone, and overall stagger sliding occurs compared with the hanging wall rock mass. It can be considered that the fault fracture zone has an obvious influence on the slope deformation in the whole study area, resulting in compressive dislocation deformation.
The surface cumulative settlement deformation curves of the three excavation tests are shown in Figure 8. The surface of the ground is uniformly decreased during excavation, the deformation trends of the dial indicator displacement meters are the same as the vertical deformation at M6-10, and the deformation amounts are similar. After the first excavation, the initial deformation of W1 at the shoulder and W2 at the top of the slope is small and then rapidly increases, which is caused by the increase in the slope angle due to slope excavation and the unloading deformation at the top of the slope. W4 and W5 are basically not deformed, and they are located furthest from the excavated slope surface and are minimally affected. In the second excavation test, overall subsidence deformation occurs. W1 at the shoulder and W2 at the top of the slope begin to exhibit a decline first, and the change is the largest near the slope surface to the top of the slope. During the excavation process, the lower part of the slope forms a large slope angle, the middle of the slope surface forms part of the void, and the upper slope body undergoes large deformation towards the foot of the slope. Since this excavation has the largest depth and the largest slope angle, the surface settlement changes the fastest. In the third excavation test, the same W1 at the shoulder and W2 at the top of the slope first begin to exhibit a decline, the excavation produces an overhead surface, and the shoulder and top of the slope undergo unloading deformation. W4 and W5 are basically unchanged because they are located at the furthest distance from the excavation slope and are least affected by the excavation.
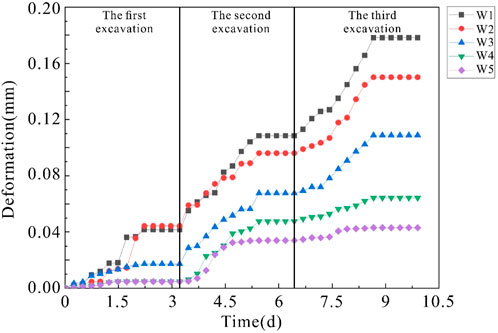
FIGURE 8. Change in the ground surface settlement deformation in excavation.
In this excavation simulation test, after sorting the data observed in the three excavation simulation tests, the final surface settlement of the geological prototype after the three excavations can be deduced according to the similarity ratio. Among them, the cumulative settlement at the slope shoulder (N1043,900) is the largest at 0.1782 mm. The farther the surface is from the slope surface, the smaller the surface settlement.
The stress changes during excavation are shown in Figure 9. It can be seen that at T5, T6 and T7, which are buried deep inside the slope, the earth pressure values are relatively large, and the overall change trend is relatively stable. The maximum earth pressure value of T7 (N1143,450) is 3.77 MPa. While the T6 compression surface faces the outer normal direction of the rock stratum plane, the T5 and T7 compression surfaces are towards the surface, and the earth pressure values are larger than that of T6. A data drop phenomenon of T1-T4 located below the slope surface is found. There is a short-term increase in stress at the three times of the three excavation processes, indicating that the slope surface is affected by excavation, and the reason is due to the stress adjustment of each point in the slope. The stress at the measurement point temporarily increases, but over time, the overall stress in the slope is reduced. The largest stress release is mainly near the excavation slope, and although there are changes at other places, the changes are not large. The variation range of earth pressure values from T1-T4 is larger than that from T5-T7, indicating that with increasing depth, the pressure is increasingly less affected by excavation. Among T1-T4, the minimum earth pressure is 0.05 MPa for T4 (N1143,900), indicating that the foot of the slope is the most affected and that the change is the largest. In the slope excavation process, the stress change in the slope is a complex process. After the excavation is completed, the stress at the measurement point near the empty surface of the slope is not instantly released, and this release is not completed in a short time such as displacement but is a long-term process.
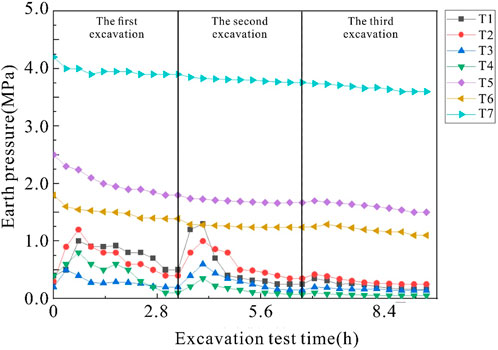
FIGURE 9. Change in stress at T1-7 in excavation.
Similar to the excavation model, the cumulative deformation curve of M1-18 in the five-stage water storage test is shown in Figure 10. The deformation rapidly changes near the water storage level adjustment time, slows down as time goes by, and finally enters a plateau area with a relatively small displacement change. For each water storage period, M1 exhibits a change first, and M2-18 begin to respond to deformation later. Because M1 is located at the foot of the slope, the stress changes first. In the early stage of water storage, the slope is squeezed by the hydrostatic pressure of the surface water, and the stress decreases. The stress change at M5 is the largest, and the amplitude is the largest. Then, because of the continuous adjustment of the stress in the slope, the deformation gradually increases, but the amplitude decreases. The horizontal deformation (Figure 10A) near the slope surface is greater than the vertical deformation (Figure 10B), which is caused by the surface water flowing into the internal slope and squeezing the slope to hinder vertical deformation. The vertical deformation of the near-ground surface is greater than the horizontal deformation, the surface is affected by gravity stress, and the vertical stress change is greater than the horizontal stress change.
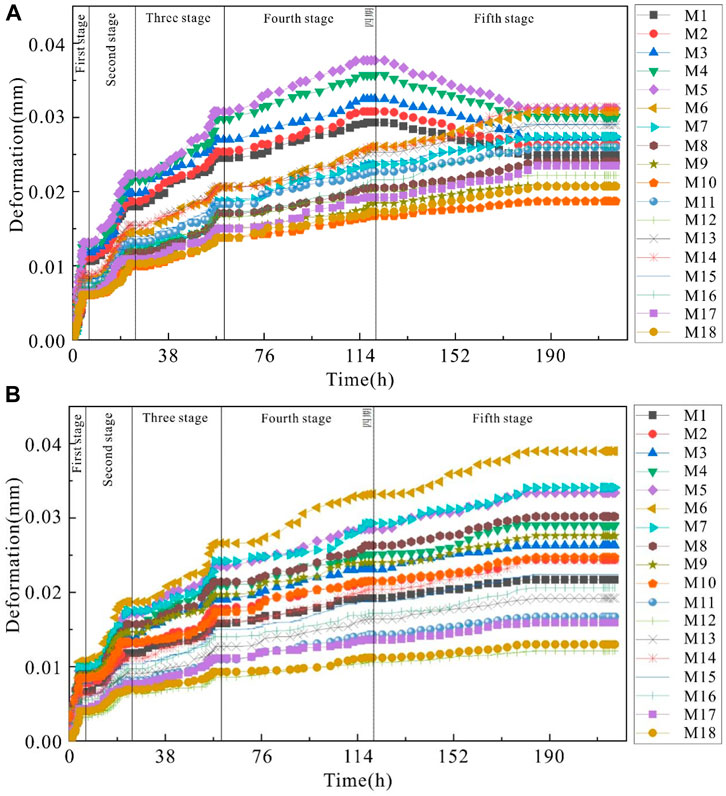
FIGURE 10. Change in deformation at M1-18 in water storage: (A) horizontal deformation, (B) vertical deformation.
In the early stage of water level change, the pore water inside the slope is constantly adjusted. The hydrodynamic pressure generated by pore water flow has a stronger influence on slope deformation than the hydrostatic pressure of relatively stable water. That is, large deformation of the slope is often caused by hydrodynamic pressure, that is, is driven by hydrodynamic pressure, and then, progressive failure occurs under hydrostatic pressure. At the same time, observing the occurrence time of the maximum displacement at each observation point (Figure 10), it can be seen that the rock mass deformation at the low elevation of the slope is earlier than that at the high elevation, indicating that the failure of the slope caused by water storage starts from the foot of the slope and gradually moves to the middle part of the slope, forming progressive failure. In the early stage, the rock mass below the water level is subjected to the load inside the slope body, and the deformation is mainly compaction deformation, which enhances the stability of the slope body to a certain extent. However, this phenomenon is only temporary. After that, the rock mass is damaged under the action of dynamic and hydrostatic pressure, and each data point tends to stabilize, indicating that the slope deformation tends to converge. In particular, the deformation direction of the area near the slope in the fifth stage is opposite to that in the previous four stages (Figure 10A), indicating that when the water level is raised to the surface (80 m), the pore water pressure exerts a greater extrusion effect on the surface of the slope body. As a result, the slope body produces a slanting downward edge, and the horizontal cumulative deformation decreases. The cumulative vertical deformation data in the near-surface area are similar to the surface subsidence data.
According to the cumulative deformation in the water storage test (Figure 10). The origin is at the lower left corner (Figure 3A), and the coordinates are (N200, -875). Under the action of staged water storage, the surface of the slope (M4-6) is subjected to greater tensile and compressive stress due to the total dynamic and hydrostatic pressure, so the maximum deformation occurs. The horizontal cumulative deformation in the interbed zone within the slope body is greater than the vertical deformation (M1-M13), and the horizontal slip in this zone is mainly along the weak brown shale layer. The vertical deformation near fault F1 and F4 in the slope body is greater than the horizontal deformation (M14-M18), indicating that settlement deformation mainly occurs in this zone.
The ground surface settlement deformation curve of the five-stage water storage test is shown in Figure 11. W1-W3 were removed before the third, fourth, and fifth stages of the storage test, respectively. During the water storage process, the monitoring point nearest to the water level (W1 in figure A, W2 in figure B, W3 in figureC, and W4 in figure D) exhibits a change first. The deformation continues to increase but the amplitude of variation gradually decreases as the test proceeds. The monitoring point at the farthest distance from the slope surface shows the smallest stress change, so the deformations at W5, W6, and W7 decrease in turn. In the early stage (Figures 11A, B), the surface water flows along the pores of the slope to the interior of the slope body, resulting in large deformation. The subsequent deformation is progressive deformation, which is transmitted from the deformation at the foot of the slope. In the later stage (Figures 11C, D), the pore water pressure in the middle part of the slope body increases, the internal stress of the slope body decreases, and the stress in the slope body is redistributed, leading to deformation at the top of the slope. The deformation starts from the middle part and is progressive, with the maximum deformation occurring at the top of the slope. This result is the same as the observed results of slope deformation and the same as the data collected by the digital image monitoring device (Figure 10), indicating that the fault affects the ground surface settlement, and the settlement at the foot is larger.
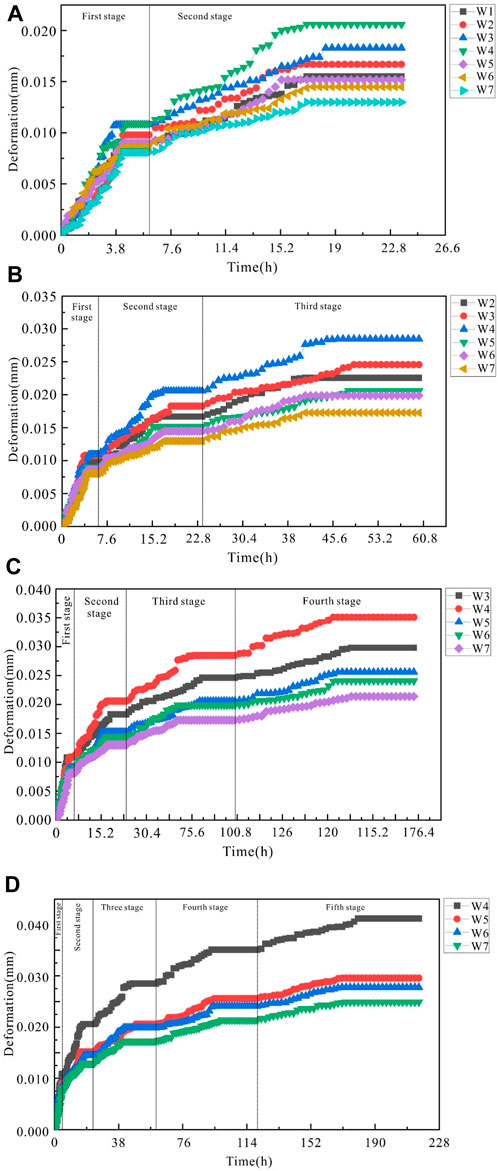
FIGURE 11. Change in the ground surface settlement deformation in water storage: (A) second stage, (B) third stage, (C) fourth stage, (D) fifth stage.
According to Figure 11, the final settlement of the ground surface was obtained. Since W1, W2, and W3 were removed before the third, fourth, and fifth stages of the storage test, respectively, their values cannot represent the final deformation. The maximum cumulative settlement of W4 (N1190,950) located at the top of the slope is 0.0412 mm. Due to the rise in the water storage level, the hydrostatic pressure on the surface of the slope body increases, and the stress inside the slope body is redistributed. Finally, under the action of hydrostatic pressure and hydrodynamic pressure, slope top subsidence deformation occurs. W5 (N1390, 950), W6 (N1640, 950) and W7 (N1890, 950) are farther from the slope surface, and the settlement amounts at the three places are 0.0296 mm, 0.0278 mm and 0.0249 mm, respectively. The surface deformation of the slope body is much larger than the internal deformation of the slope body, and the deformation far from the slope surface is significantly reduced.
The changes in the pore water pressure are shown in Figure 12. The change in the pore pressure in the whole process basically maintains synchronization with the progress of the water storage stage, while the monitoring points located in the depth of the slope slightly lag, and the overall curves present a step-like feature. The change order of the pore water pressure is consistent with the rule that the values change from the slope surface to the deep slope body, from bottom to top. The stability of the pore water pressure is consistent with the trend of gradually decreasing from low elevation to high elevation and from the slope surface to the deep slope body.
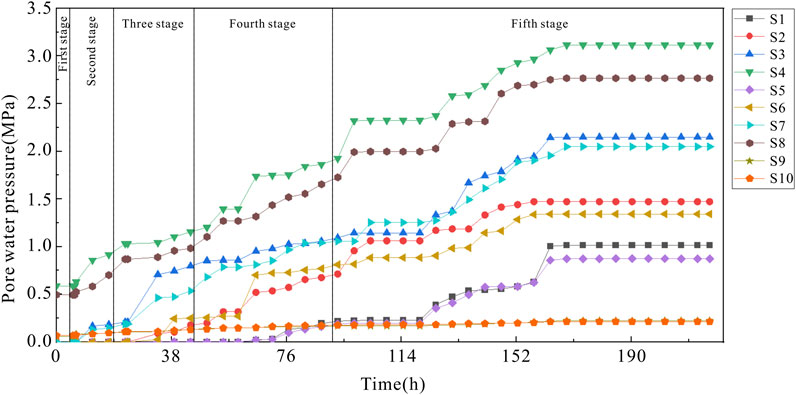
FIGURE 12. Change in the pore water pressure in water storage.
In the first stage, the values at S4 and S8-S10 gradually increase and remain stable in order. The pore water pressure at S4 near the foot of the slope increases first, and the pressure at S8-S10 near the water level elevation of the first stage also gradually increase. In the second stage, S4 and S8, which are located at the lowest location, are the first to respond after a period of time. S3, S7, S9, and S10 slightly lag behind the S4 and S8 responses, and the increase is small. In the third stage, the increase in the pore pressure at S3 and S7 is greater than the response in the second stage. S2 and S6 show a small increase due to the water level exceeding their embedding height. In the fourth stage, the change in the pore pressures of S2 and S6 in the middle is greater than the response in the third stage. S1 and S5 show a small increase because the water level exceeds the embedding height. In the fifth stage, the increase in the pore pressure of S1 and S5 in the middle is greater than the response in the fourth stage. Finally, S4 has the largest pore pressure value, reaching 3.11 MPa, which is in the region closest to the slope surface. The minimum is at S10, only 0.21 MPa, which is the farthest point from the slope surface. This indicates that the pore water pressure decreases when extending into the slope body interior.
The variation in earth pressure is shown in Figure 13. By observing the change characteristics of the curve, it is found that the values at T1-T4 in the shallow surface of the slope foot decrease in the early stage of water level rise, corresponding to the same time point as the pore pressure rise. This is because with the rise in the reservoir level, the dry rock mass at the foot of the slope is submerged by water. The buoyance of the water will make the rock mass below the water level subject to the buoyance force, and the water penetrates into the interior of the slope body from the slope surface. Therefore, the pore water pressure between the rock plate and the cracks at the slope foot increases, which reduces the effective stress at the slope foot. According to the distribution of the earth pressure, the value in the slope is 0.34–6.88 MPa. The earth pressures at T1 and T2 located at a lower elevation of the slope body and T5-T7 located in a deeper part of the slope body are relatively large, with a maximum value of 6.88 MPa at T7 (N1143,450) and a minimum value of 0.34 MPa at T4 (N1143,900). This shows that under the effect of water storage, the rock mass at the slope foot supports the upper rock mass, the pressure is the largest, and the stress concentration phenomenon exists. With the stress release of the rock mass at the foot of the slope and the loss of support of the upper rock mass, the stress concentration site gradually shifts to the high rock mass. The internal stress of the slope body finally stabilizes, slightly slower than the pore water pressure.
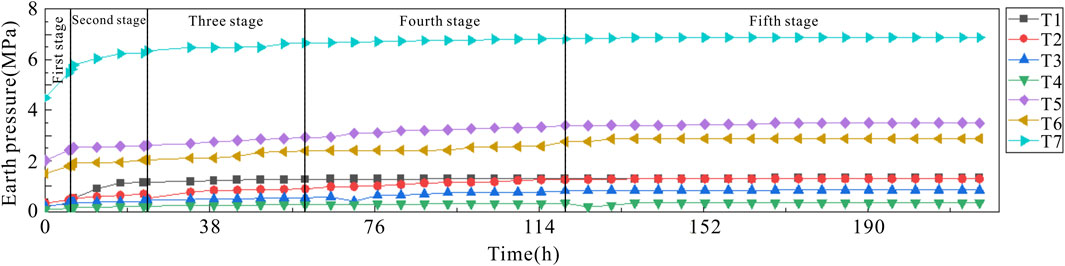
FIGURE 13. Change in stress at T1-7 in water storage.
Based on an analysis of the engineering geological conditions of the slope, this study carries out a simulation test of slope excavation disturbance and water storage according to the similarity principle and similarity criterion. The stability of the slope body and fault structural zone are analysed and discussed, and the following conclusions are obtained:
1. According to the principle of similar material selection, yellow sand is selected as an aggregate, gypsum and cement are used as cementing agents, water is used as a solvent, hydraulic oil is used as a filling agent, and coloured iron powder is used to distinguish different rock layers. The contents of cement and yellow sand can regulate the physical and mechanical properties and hydrological properties. Gypsum has a certain regulation effect on the strength and permeability. Hydraulic oil has a great regulatory effect on the permeability.
2. Excavation causes stress release of the slope and unloading deformation of the slope rock mass. The local slope rock mass deforms to the outside of the slope body, and the deformation is mainly concentrated near the middle and lower parts of the slope surface. This is caused by the excavation and unloading of the rock mass, which causes stress redistribution of the slope rock mass. The stress greatly changes near the slope surface, and the stress is locally concentrated at the foot of the slope.
3. During excavation, the rock mass located in the fault structural zone shows nonglobal movement, and the vertical displacement of the footwall rock mass is larger than that of the hanging wall rock mass, indicating that the rock mass at this place has a tendency to produce relative dislocation along the fault fracture zone under the action of excavation disturbance and self-gravity of the hanging wall rock mass.
4. In the early stage of water storage, the surface rock mass of the slope body below the water level is subjected to dynamic and hydrostatic pressure inside the slope body, resulting in transient compaction deformation. However, with the infiltration of water into the slope body, the pore water pressure inside the slope body increases, the water weakens the slope rock mass, the rock mass near the slope surface gradually deforms to the outside of the slope, and the slope top shows a certain settlement trend. According to the simulation model, the maximum deformation of the slope can reach 0.0312 mm, and the surface settlement can reach 0.0412 mm.
The data analyzed in this study is subject to the following licenses/restrictions: The data sets are proprietary and subject to a confidentiality agreement. Requests to access these datasets should be directed to Chengheng Hou, NDkyNjc0MzgyQHFxLmNvbQ==.
CH: Formal Analysis, Investigation, Methodology, Writing–original draft, Writing–review and editing.
The author declare that no financial support was received for the research, authorship, and/or publication of this article.
Author CH was employed by China Coal Technology and Engineering Group Shenyang Research Institute Co, Ltd.
All claims expressed in this article are solely those of the authors and do not necessarily represent those of their affiliated organizations, or those of the publisher, the editors and the reviewers. Any product that may be evaluated in this article, or claim that may be made by its manufacturer, is not guaranteed or endorsed by the publisher.
Adhikary, D. P., Dyskin, A. V., Jewell, R. J., and Stewart, D. P. (1997). A study of the mechanism of flexural toppling failure of rock slopes. Rock Mech. Rock Eng. 30, 75–93. doi:10.1007/BF01020126
Cao, C., Feng, J., Zhang, Z., Lu, L., and Tao, Z. (2022). Characteristics and mechanism of dump landslides under compound loads based on physical model test. Bull. Eng. Geol. Enviro 81, 350. doi:10.1007/s10064-022-02825-6
Chen, P., Tang, S., Liang, X., Zhang, Y., and Tang, C. (2021). The influence of immersed water level on the short-and long-term mechanical behavior of sandstone. Int. J. Rock Mech. Min. 138, 104631. doi:10.1016/j.ijrmms.2021.104631
Cheng, W. M., Sun, L. L., Wang, G., Du, W. Z., and Qu, H. Y. (2016). Experimental research on coal seam similar material proportion and its application. Int. J. Min. Sci. Technol. 26, 913–918. doi:10.1016/j.ijmst.2016.05.034
Ding, S., Tang, S., Jia, H., and Li, Y. (2023). The influence of water on the failure characteristics of sandstone under uniaxial compression conditions by acoustic emission and NMR observation. Eng. Geol. 322, 107173. doi:10.1016/j.enggeo.2023.107173
Ding, X., Li, F., Wang, Z., Sang, S., and Cao, M. (2020). Physical model experimental study on the coalface overburden movement law on the end slope of an open-pit mine. Geotech. Geol. Eng. 40, 4859–4877. doi:10.1007/s10706-022-02206-6
Hu, X., He, C., Zhou, C., Xu, C., Zhang, H., Wang, Q., et al. (2019). Model test and numerical analysis on the deformation and stability of a landslide subjected to reservoir filling. Geofluids 2019, 1–15. doi:10.1155/2019/5924580
Huang, B. L., Wang, S. C., and Chen, X. T. (2013). Prototype physical similarity experimental study of impulsive wave generated by cataclastic rockmass failure. Chin. J. Rock. Mech. Eng. 32, 1417–1425.
Huang, H., Zhao, J., Liu, S., and Ke, H. (2023). Centrifuge model test study on the mutual effect of water level variation and excavation on the deformation and failure of slopes. KSCE J. Civ. Eng. 27, 521–534. doi:10.1007/s12205-022-2082-1
Liang, X., Tang, S., Tang, C., and Wang, J. (2021). The influence of water on the shear behaviors of intact sandstone. Bull. Eng. Geol. Environ. 80 (8), 6077–6091. doi:10.1007/s10064-021-02315-1
Liang, X., Tang, S., Tang, C. A., Hu, L., and Chen, F. (2023). Influence of water on the mechanical properties and failure behaviors of sandstone under triaxial compression. Rock Mech. Rock Eng. 56 (2), 1131–1162. doi:10.1007/s00603-022-03121-1
Lo, C. M., and Weng, M. C. (2017). Identification of deformation and failure characteristics in cataclinal slopes using physical modeling. Landslides 14, 499–515. doi:10.1007/s10346-016-0735-1
Prodan, M. V., Peranić, J., Pajalić, S., and Arbanas, Ž. (2023). Physical modelling of rainfall-induced sandy and clay-like slope failures. Adv. Mater. Sci. Eng. 3234542. doi:10.1155/2023/3234542
Shi, X. M., Liu, B. G., and Xiao, J. (2015). A method for determining the ratio of similar materials with cement and plaster as bonding agents. Rock Soil Mech. 36, 1357–1362. doi:10.16285/j.rsm.2015.05.017
Shi, Y. B., Ye, Y. C., Hu, N. Y., Huang, X., and Wang, X. H. (2021). Experiments on material proportions for similar materials with high similarity ratio and low strength in multilayer shale deposits. Appl. Sci. 11, 9620. doi:10.3390/app11209620
Sun, L. N., and Zhao, Z. H. (2014). The Study on movement of underground water and its effect on the stability of surrounding rocks. Adv. Mater. Res. 838, 726–732. doi:10.4028/www.scientific.net/AMR.838-841.726
Tang, S., Huang, R., Wang, S., Bao, C., and Tang, C. (2017). Study of the fracture process in heterogeneous materials around boreholes filled with expansion cement. Int. J. Solids. Struct. 112, 1–15. doi:10.1016/j.ijsolstr.2017.03.002
Tang, S., Li, J., Ding, S., and Zhang, L. (2022). The influence of water-stress loading sequences on the creep behavior of granite. Bull. Eng. Geol. Environ. 81 (11), 482. doi:10.1007/s10064-022-02987-3
Tang, S., Li, J., Zhang, L., Liu, Z., Wang, S., Dong, L., et al. (2021). Study on the static critical stress intensity factors of sandstone in a water environment based on semicircular bending specimens. Theor. Appl. Fract. Mec. 116, 103106. doi:10.1016/j.tafmec.2021.103106
Tang, S., and Tang, C. (2015). Crack propagation and coalescence in quasi-brittle materials at high temperatures. Eng. Fract. Mech. 134, 404–432. doi:10.1016/j.engfracmech.2015.01.001
Tang, S., Tang, C., Zhu, W., Wang, S., and Yu, Q. (2006). Numerical investigation on rock failure process induced by thermal stress. Chin. J. Rock. Mech. Eng. 25 (10), 2071. doi:10.3321/j.issn:1000-6915.2006.10.019
Tang, S., Wang, J., and Chen, P. (2020). Theoretical and numerical studies of cryogenic fracturing induced by thermal shock for reservoir stimulation. Int. J. Rock. Mech. Min. 125, 104160. doi:10.1016/j.ijrmms.2019.104160
Tang, S., Zhang, H., Tang, C., and Liu, H. (2016). Numerical model for the cracking behavior of heterogeneous brittle solids subjected to thermal shock. Int. J. Solids. Struct. 80, 520–531. doi:10.1016/j.ijsolstr.2015.10.012
Tang, S. (2018). The effects of water on the strength of black sandstone in a brittle regime. Eng. Geol. 239, 167–178. doi:10.1016/j.enggeo.2018.03.025
Tang, S. B., Yu, C. Y., Heap, M. J., Chen, P. Z., and Ren, Y. G. (2018a). The influence of water saturation on the short-and long-term mechanical behavior of red sandstone. Rock Mech. Rock Eng. 51, 2669–2687. doi:10.1007/s00603-018-1492-3
Tang, S., Yu, C., and Tang, C. (2018b). Numerical modeling of the time-dependent development of the damage zone around a tunnel under high humidity conditions. Tunn. Undergr. Sp. Tech. 76, 48–63. doi:10.1016/j.tust.2018.03.012
Tao, Z., Shu, Y., Yang, X., Peng, Y., Chen, Q., and Zhang, H. (2020). Physical model test study on shear strength characteristics of slope sliding surface in Nanfen open-pit mine. Int. J. Min. Sci. Technol. 30, 421–429. doi:10.1016/j.ijmst.2020.05.006
Wen, C. X., Jia, S. P., Fu, X. F., Meng, L. D., Zhao, Z. Y., and Riccio, A. (2020). Experimental research and sensitivity analysis of mudstone similar materials based on orthogonal design. Adv. Mater. Sci. Eng. 9, 1–14. doi:10.1155/2020/2031276
Wu, L. Z., Huang, R. Q., Xu, Q., Zhang, L. M., and Li, H. L. (2015). Analysis of physical testing of rainfall-induced soil slope failures. Environ. Earth Sci. 73, 8519–8531. doi:10.1007/s12665-014-4009-8
Wu, T., Chuanbo, Z., Nan, J., Yuqing, X., and Zhu, B. (2020a). Study on the mechanical cumulative damage model of slope fault fracture zone under the cumulative effect of blasting vibration. Polytech. Civ. Eng. 64, 845–858. doi:10.3311/PPci.16030
Wu, T., Zhou, C., Jiang, N., Xia, Y., and Zhang, Y. (2020b). Stability analysis for high-steep slope subjected to repeated blasting vibration. Arab. J. Geosci. 13, 828. doi:10.1007/s12517-020-05857-y
Yang, G., Leung, A. K., Xu, N., Zhang, K., and Gao, K. (2019). Three-dimensional physical and numerical modelling of fracturing and deformation behaviour of mining-induced rock slopes. Appl. Sci. 9, 1360. doi:10.3390/app9071360
Yang, Z. Q., Fan, X. L., Yang, Y., Hou, K. P., Du, J., Chen, X. G., et al. (2022). Deformation patterns and failure mechanism of high and steep stratified rock slopes with upper steep and lower gentle style induced by step-by-step excavations. Environ. Earth Sci. 81, 229. doi:10.1007/s12665-022-10327-7
Yin, Q., Liu, R., Jing, H., Su, H., Yu, L., and He, L. (2019). Experimental study of nonlinear flow behaviors through fractured rock samples after high-temperature exposure. Rock Mech. Rock Eng. 52, 2963–2983. doi:10.1007/s00603-019-1741-0
Yin, Q., Wu, J., Zhu, C., He, M., Meng, Q., and Jing, H. (2021a). Shear mechanical responses of sandstone exposed to high temperature under constant normal stiffness boundary conditions. Geomech. Geophys. Geo. 7, 35–17. doi:10.1007/s40948-021-00234-9
Yin, Q., Wu, J., Zhu, C., Wang, Q., Zhang, Q., Jing, H., et al. (2021b). The role of multiple heating and water cooling cycles on physical and mechanical responses of granite rocks. Geomech. Geophys. Geo. 7 (3), 69. doi:10.1007/s40948-021-00267-0
Yu, C., Tang, S., Duan, D., Zhang, Y., Liang, Z., Ma, K., et al. (2019). The effect of water on the creep behavior of red sandstone. Eng. Geol. 253, 64–74. doi:10.1016/j.enggeo.2019.03.016
Zhang, J., Chen, Z., and Wang, X. (2007). Centrifuge modeling of rock slopes susceptible to block toppling. Rock Mech. Rock Eng. 40, 363–382. doi:10.1007/s00603-006-0112-9
Zhang, Q. Y., Li, S. C., Guo, X. H., Li, Y., and Wang, H. P. (2008). Research and development of new typed cementitious geotechnical similar material for iron crystal sand and its application. Rock Soil Mech. 29, 2126–2130.
Zhang, S., Fan, G., Zhang, D., Chen, M., and Zhang, C. (2019). Study on material properties and similar material proportion of weakly cemented water-resisting strata. Arab. J. Geosci. 12, 340. doi:10.1007/s12517-019-4521-y
Zheng, Y., Chen, C. X., Liu, T. T., Zhang, W., and Song, Y. F. (2018). Slope failure mechanisms in dipping interbedded sandstone and mudstone revealed by model testing and distinct–element analysis. Bull. Eng. Geol. Environ. 77, 49–68. doi:10.1007/s10064-017-1007-6
Zhu, C., He, M., Karakus, M., Cui, X., and Tao, Z. (2020). Investigating toppling failure mechanism of anti-dip layered slope due to excavation by physical modelling. Rock Mech. Rock Eng. 53, 5029–5050. doi:10.1007/s00603-020-02207-y
Keywords: physical model, slope excavation, water storage, deformation, similar material
Citation: Hou C (2023) Study on slope stability under excavation and water storage based on physical model tests. Front. Earth Sci. 11:1292945. doi: 10.3389/feart.2023.1292945
Received: 12 September 2023; Accepted: 20 October 2023;
Published: 03 November 2023.
Edited by:
Xuelong Li, Shandong University of Science and Technology, ChinaReviewed by:
Dong Duan, Taiyuan University of Technology, ChinaCopyright © 2023 Hou. This is an open-access article distributed under the terms of the Creative Commons Attribution License (CC BY). The use, distribution or reproduction in other forums is permitted, provided the original author(s) and the copyright owner(s) are credited and that the original publication in this journal is cited, in accordance with accepted academic practice. No use, distribution or reproduction is permitted which does not comply with these terms.
*Correspondence: Chengheng Hou, NDkyNjc0MzgyQHFxLmNvbQ==
Disclaimer: All claims expressed in this article are solely those of the authors and do not necessarily represent those of their affiliated organizations, or those of the publisher, the editors and the reviewers. Any product that may be evaluated in this article or claim that may be made by its manufacturer is not guaranteed or endorsed by the publisher.
Research integrity at Frontiers
Learn more about the work of our research integrity team to safeguard the quality of each article we publish.