 Martin Hasenhündl
 Lena Sophie Bauernberger
 Christoph Böhm
94% of researchers rate our articles as excellent or good
Learn more about the work of our research integrity team to safeguard the quality of each article we publish.
Find out more
ORIGINAL RESEARCH article
Front. Earth Sci., 29 November 2023
Sec. Marine Geoscience
Volume 11 - 2023 | https://doi.org/10.3389/feart.2023.1290509
Subaquatic channels, situated in lakes, fjords, submarine canyons and on deep-sea fan systems, exhibit diverse morphometric characteristics controlled by sediment transport processes, particularly turbidity currents. These processes play a significant role in transporting sediment, organic carbon, nutrients, and pollutants and pose hazards to critical infrastructure. This study examines a balanced set of subaquatic channels across various settings, sizes, and locations, employing novel data harmonization techniques to address biases toward larger channels. The analysis reveals consistent scaling relationships, particularly the dominant role of bankfull width, influencing bankfull depth, cross-sectional area, wavelength, and amplitude. The aspect ratio (width-to-depth) emerges as a significant parameter, reflecting a necessary channel compactness to maintain turbidity currents. Meandering development reveals relations between width, wavelength, and amplitude, with a preference for specific ratios. Meandering is most pronounced at channel beginnings, transitioning to straighter forms downstream, potentially influenced by flow dynamics and flow confinement. The study broadens the understanding of subaquatic channel evolution, emphasizing the importance of bankfull width and providing insights applicable across settings and scales.
Submarine canyons and channels, among the largest morphological features on Earth (Harris and Whiteway, 2011), are shaped by the longest sediment flows, termed turbidity currents, fostering immense scientific interest (Talling et al., 2022). These turbidity currents bear a significant role in transporting sediment, organic carbon, nutrients, and pollutants to the deep-sea (Galy et al., 2007; Kane and Clare, 2019; Pierdomenico et al., 2023). They also pose a potential hazard to critical infrastructure like undersea cables, which requires an in-depth understanding of their behaviors (Piper et al., 1988; Talling et al., 2022).
Turbidity currents are not limited to the deep sea alone; they also shape canyons and channels in fjords and lakes, leading to their broader classification as subaquatic sediment conduits (Talling, 2014). While advancements in measurement techniques in the last decades have provided insights into these flows, their direct observation remains a challenge (Paull et al., 2018; Talling et al., 2023). Therefore, for most subaquatic sediment conduits, only bathymetric data of varying resolution is available (Bührig et al., 2022b). Thus, the analysis of their morphology, enabled by the ever-growing amount of bathymetric data, emerges as a crucial approach for understanding the evolution of these subaquatic sediment conduits and their associated turbidity currents (Peakall et al., 2012; Konsoer et al., 2013; Shumaker et al., 2018; Lemay et al., 2020; Bührig et al., 2022b).
Taking inspiration from the morphometric analysis of river systems, where planform characteristics (wavelength, amplitude, sinuosity) and cross-sectional characteristics (bankfull width, bankfull depth, cross-sectional area) correlate and follow power law scaling relationships (Leopold and Maddock, 1953; Leopold and Wolman, 1960; Schumm, 1979), a similar avenue has been pursued for submarine sediment conduits. Notably, the biggest comparative studies have primarily focused on submarine canyons, encompassing entire incised cross-sections without differentiating between channelized sediment conduits within the canyons (Harris and Whiteway, 2011; Bührig et al., 2022a). These channelized sediment conduits, both within canyons and valleys (defined up to the first distinct terrace or levee crest) and outside as leveed or incised channels, hold particular interest due to their connection with bankfull geometries and scaling relationships related to the activity of channel-forming turbidity currents (Lemay et al., 2020; Covault et al., 2021). Within this context, the aspect ratio, representing the width-to-depth ratio, exhibits remarkable similarity across various channelized sediment conduits, further called channels, following a power law trend (Konsoer et al., 2013; Shumaker et al., 2018; Lemay et al., 2020) and implying a preferred geometry shaped by self-correcting feedback mechanisms in the process of channel formation, particularly for deep-sea leveed channels (Shumaker et al., 2018).
However, the relationship between bankfull width and cross-sectional area shows some discrepancy, with contradictory findings suggesting both decreasing (Shumaker et al., 2018) and increasing downstream trends (Lemay et al., 2020). Moreover, a width-wavelength relationship is evident in submarine channels (Clark et al., 1992; Covault et al., 2021), but debates continue concerning whether channel sinuosity is more influenced by thalweg gradient (Clark et al., 1992; Sylvester et al., 2013) or latitudinal settings (Peakall et al., 2012).
It is important to note that small submarine channels, typically narrower than 1,000 m and/or shallower than 10 m, are scarcely reported, leading to a well-recognized bias favoring larger channels. Consequently, larger channels tend to contribute more data points to trends than smaller ones, further accentuating this bias (Konsoer et al., 2013; Lemay et al., 2020). Additionally, data on lake channels are conspicuously absent from these analyses.
This study seeks to expand the scope of morphometric analyses beyond the traditionally focused uniform submarine channels, encompassing a well-balanced selection of subaquatic systems with varying settings, sizes, sediment supplies, and locations. To achieve this, crucial methodological improvements are introduced, employing a consistent analytical approach across all systems without relying on measurements from different sources (Konsoer et al., 2013; Lemay et al., 2020; Bührig et al., 2022a) and employing a novel data harmonization technique to counteract the aforementioned bias towards larger channels and ensure equitable representation of different system types (Konsoer et al., 2013; Lemay et al., 2020).
The primary objectives of this study are to outline the scaling relationships prevalent across diverse subaquatic channelized sediment conduits, determine the validity of known relationships in differing system types, and ultimately gain insights into the evolution of subaquatic channels through a comprehensive and consistent comparative analysis.
The focus of this study revolves around the analysis of subaquatic channels, integral components of subaquatic sediment conduits shaped by turbidity currents. These subaquatic channels can be situated inside canyons and valleys (channel therefore defined up to the first distinct terrace or levee crest) or as leveed and incised formations on deep-sea fans (Lemay et al., 2020). Geographic settings vary widely, spanning lakes, fjords, and deep-sea domains, in combination with different attributes such as proximity to the equator, diverse continental margins, and the spectrum of flow activity states. In selecting subaquatic channels for analysis, attention was dedicated to equitable representation, often in pairs, encompassing a diverse spectrum of settings. This spectrum included small channels (narrower than 1,000 m and/or shallower than 10 m) in lakes, Greenland fjords, Canadian fjords and larger channels such as sea channels, river-associated canyons, canyons influenced by longshore drift, equatorial canyon-channel-fan systems, and those distanced from the equator (Figure 1; Table 1). The bathymetric datasets were sourced from diverse open sources (given in Table 1), with exclusive reliance on bathymetric data, avoiding literature-derived measurements. Geographic coordinates were standardized to the WGS 84 (EPSG:4326) format, establishing a uniform reference point at the center of each system.
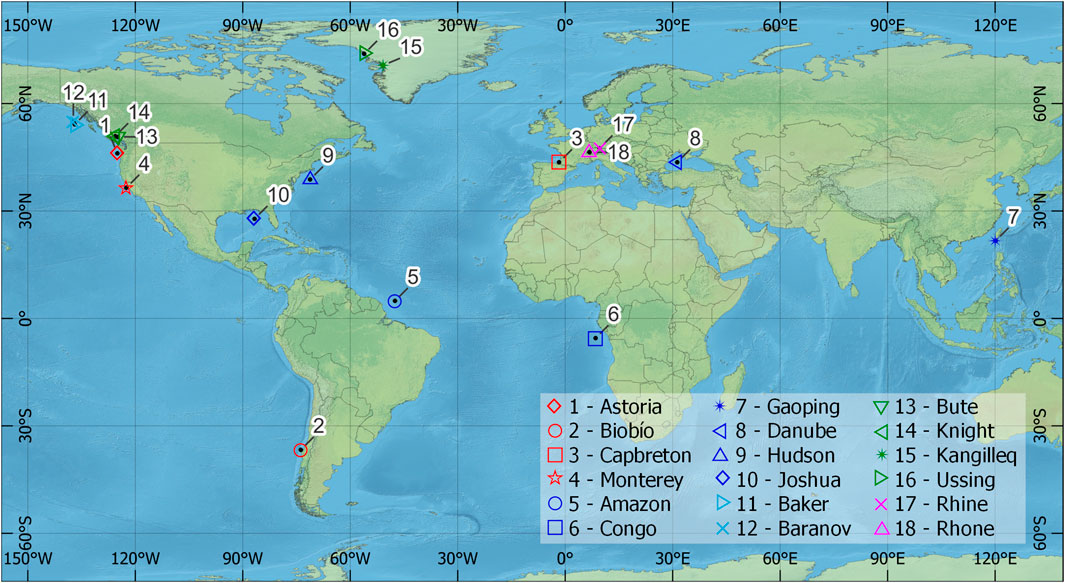
FIGURE 1. Overview map of the distribution of the 18 subaquatic systems studied (World map from www.naturalearthdata.com).

TABLE 1. Overview und description of the 18 subaquatic systems studied.
The determination of morphometric characteristics in subaquatic channels was conducted using a modified Matlab script, building upon the methodology outlined by Hasenhündl and Blanckaert (2022). This script used a centerline of the subaquatic channels based on the midpoints of bankfull channel crests (manually mapped, in canyon/valley settings up to the first distinct terrace or levee crest) (Konsoer et al., 2013; Shumaker et al., 2018; Lemay et al., 2020). Along the centerline, a channel-centered curvilinear reference system (s, n, z) was established, characterized by the s-coordinate corresponding to the downstream distance from the beginning of each system’s bathymetric data (Hasenhündl and Blanckaert, 2022) as shown in Figure 2. At the channel head, the s-coordinate starts at zero, and at the end of the confined channel, s reaches its maximum value, which also corresponds to the measured system length (Table 1), as far as bathymetric data are available. The spatial step size (Δs) along the s-coordinate was chosen individually for each system, according to the recommendation of half the bankfull width (Hasenhündl and Blanckaert, 2022), spanning an interval from 50 m to 2,400 m (refer to Table 1).
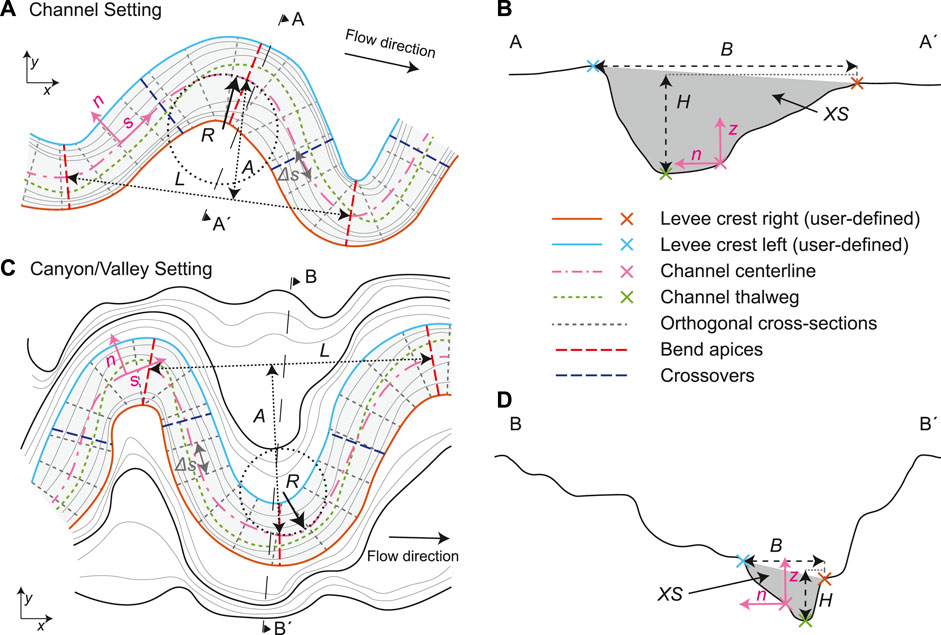
FIGURE 2. Definition of the morphometric characteristics [modified from Hasenhündl and Blanckaert (2022)]: user-defined levee or bank crests (right in red, left in blue) for bankfull channel in a channel (A,B) and canyon/valley setting (C,D). Main morphometric characteristics provided by script: centerline (magenta) with channel-centered curvilinear (s, n, z) reference system, thalweg (green), cross-sections (grey), bend apices (red dashed), crossovers (blue dashed), wavelength (L), amplitude (A) bankfull width (B), bankfull depth (H) and cross-sectional area (XS).
The channel-centered curvilinear reference system provided cross-sections at Δs intervals, enabling the computation of characteristics including bankfull width (B), bankfull channel depth (H), and cross-sectional area (XS) (Figure 2). Longitudinal characteristics were calculated along the centerline such as radius of curvature (R), bend apices (where by definition 1/R attains its maximum magnitude), crossovers (where by definition curvature is zero), sinuosity (SI, the ratio between the distance along centerline and the straight distance between two points for the step-length of 20 times median B), wavelength (L) and amplitude (A) (see Figure 2). The thalweg (automatically determined by the lowest bed elevation within the cross-section) was used to calculate the longitudinal bottom profile, along which the thalweg gradient (S) was derived. An overview of all parameters, morphometric characteristics and their definitions is detailed within Table 2.
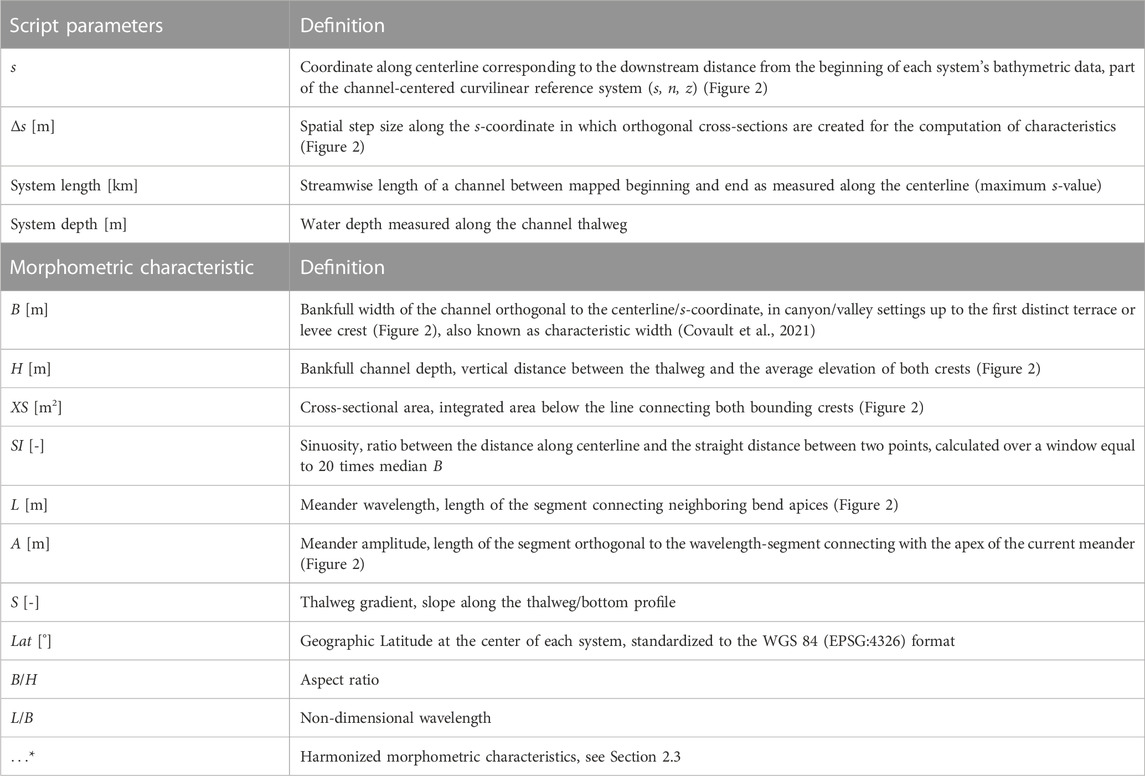
TABLE 2. Overview of parameters, morphometric characteristics and their definitions.
In order to address data-size discrepancies (1-Astoria Canyon: 60 measurement cross-sections; 6-Congo Channel: 2,236 measurement cross-sections) and to afford unbiased representation to all systems, data harmonization was introduced. For this process, each system was divided into deciles based on its measured length along the centerline (Tables 1, 2), resulting in median values per deciles (assigned to the midpoint of each decile). This effectively condensed each system into ten median values for each morphometric characteristic.
Given the variation in system dimensions, additional normalization was only required for system lengths and system depths (Table 2). This normalization extended from the in the data recognizable channel head (0) to the end of the visible confined channel (1). Three systems, due to insufficient bathymetric coverage, underwent individual normalization ranges, to position the obtained data correctly within the context of other systems: 3-Capbreton Canyon between 0 and 0.17, 5-Amazon Channel between 0.19 and 0.82 and 10-Joshua Channel between 0.5 and 0.8.
Morphometric characteristic relationships were established through the application of least-square linear regressions, undertaken on log-transformed harmonized data (Lansey, 2023). This resulted in power-law equations (Clark et al., 1992; Konsoer et al., 2013; Shumaker et al., 2018; Lemay et al., 2020), with exceptions for sinuosity and latitude. These were examined using untransformed linear data, concluding in regression analysis on semi-logarithmic transformed harmonized data or linear data. The threshold of coefficient of determination (R2) exceeding 0.1 and a p-value ≤0.01 (t-statistic, rejecting the non-correlation hypothesis) was designated as indicative of relevance (Lemay et al., 2020; Bührig et al., 2022a), as represented by a continuous line, whereas regressions failing this threshold were delineated with dashed lines. Relationships with R2 values greater 0.3 were recognized as meaningful following previous studies (Clark et al., 1992; Konsoer et al., 2013; Shumaker et al., 2018; Lemay et al., 2020) and thus treated in detail.
Some limitations need to be considered within the context of this study. Careful consideration was dedicated to assembling a balanced set of systems with varied settings. Nevertheless, any selection, no matter how careful, can introduce human bias. While increasing the system count could enhance result reliability and reduce the risk of human bias, this was hindered by the current data constraints. Using exclusively open bathymetric data could extend in specific settings like canyons and fjords, but not universally, due to limitations in systems like lakes and equatorial fans. The attempt to expand to more systems was hindered by limited data accessibility, motivated to maintain equilibrium across settings.
The integration of data from diverse sources introduces differences in resolution, ranging from 2 × 2 m for the 18-Rhone Channel (133 data points per median width) to 145 × 145 m for the 8-Danube Channel (8 data points per median width). The potential impact of resolution variation cannot be disregarded, as long as there is no uniform bathymetric database. Consequently, morphometric characteristics highly sensitive to resolution, such as levee slopes and thalweg position (Hasenhündl and Blanckaert, 2022), were omitted from the analysis.
It is essential to recognize that certain relationships might be influenced by factors beyond the scope of this study. Factors such as geological context and sea level fluctuations, among other unexplored elements, could potentially contribute to the observed relationships, but these aspects remain unexplored within the confines of this study.
The comparative analysis of harmonized morphometric characteristics shows the broad range of diverse system settings. Longitudinal profiles demonstrate distinctive system groups (Figure 3A); the lake systems show concave profiles, while the canyon-channel systems and fjord systems manifest slightly concave forms. In contrast, the canyon systems present more varied profiles, with the 2-Biobío Canyon as the only case of a convex profile (Covault et al., 2011). The thalweg gradient analysis (S*, Figure 3B) positions lake systems with the steepest thalweg gradients, followed by fjord systems and canyon systems. In contrast, sea channels showcase the lowest gradients. Notably, the 2-Biobío Canyon appears as an outlier, featuring a rising gradient downstream due to its convex longitudinal profile.
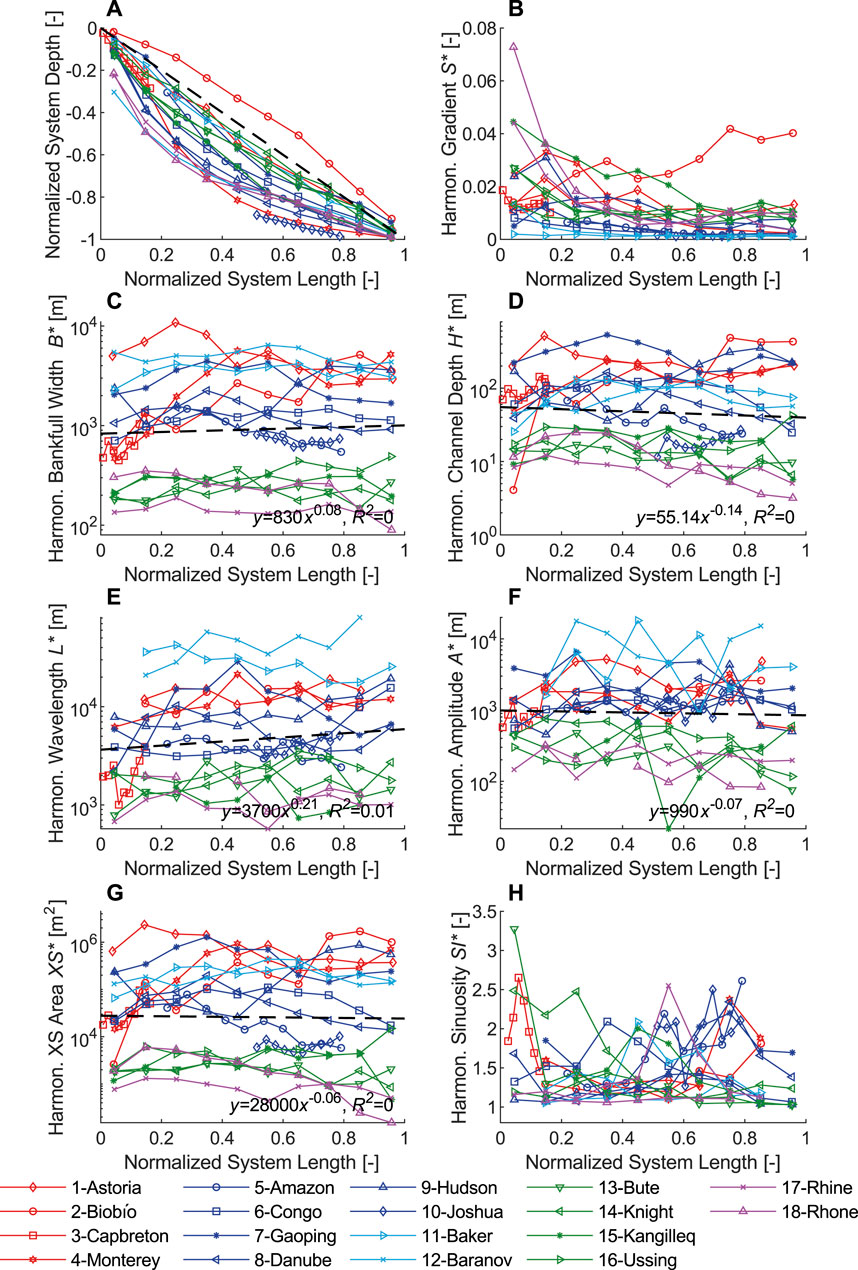
FIGURE 3. Harmonized morphometric characteristics along normalized system length: (A) normalized system depth (longitudinal profile), (B) harmonized thalweg gradient (S*), (C) harmonized bankfull width (B*), (D) harmonized bankfull depth (H*), (E) harmonized wavelength (L*), (F) harmonized amplitude (A*), (G) harmonized cross-sectional area (XS*), (H) harmonized sinuosity (SI*) (red–canyons, blue–canyon-channel systems, cyan–sea channels, green–fjord settings and pink–lake settings).
In terms of geometric characteristics including bankfull width (B*, Figure 3C), bankfull depth (H*, Figure 3D), wavelength (L*, Figure 3E), amplitude (A*, Figure 3F) and cross-sectional area (XS*, Figure 3G), consistent patterns emerge within similar system settings. Lake systems, characteristically, exhibit the smallest dimensions, succeeded by fjord systems. A mix of canyon-channel systems, canyon systems, and sea channels covers dimensions of intermediate magnitude. The regression analyses, regardless of coefficients of determination (R2) resultant from the variability of unit characteristics, expose noticeable trends. Noteworthy constants are observed in bankfull width and amplitude (Figures 3C, F), whereas bankfull depth (Figure 3D) experiences visible decrease towards the channel ends. Contrarily, wavelengths (Figure 3E) exhibit noticeable increase towards the channel ends. Cross-sectional areas (Figure 3G) demonstrate slight decrease, dictated by the comparatively more effective influence of bankfull width in contrast to the stronger decrease in bankfull depth.
Sinuosity patterns (SI*, Figure 3H) reveal Canadian fjord systems marked by higher values at channel beginning, separating from the majority which peak in mid-system lengths.
Comprehensive regressions present significant correlations, predominantly involving bankfull width (Tables 3, 4). Such correlations span width-to-depth (Figure 4A, R2 = 0.48), depth-to-width (Figure 4B, R2 = 0.46), wavelength-to-width (Figure 4C, R2 = 0.49), amplitude-to-width (Figure 4D, R2 = 0.30) and cross-sectional area-to-width (Figure 4E, R2 = 0.59) relationships. The cross-sectional area shows substantial correlations to both bankfull width (Figure 4E, R2 = 0.59) and bankfull depth (Figure 4F, R2 = 0.77), a logical outcome given its determination by these two characteristics. While significant correlations between wavelength and amplitude occur (Figure 4G, R2 = 0.55), they fall slightly short of the correlations demonstrated in existing literature (in Lemay et al. (2020) R2 = 0.90, Table 5).
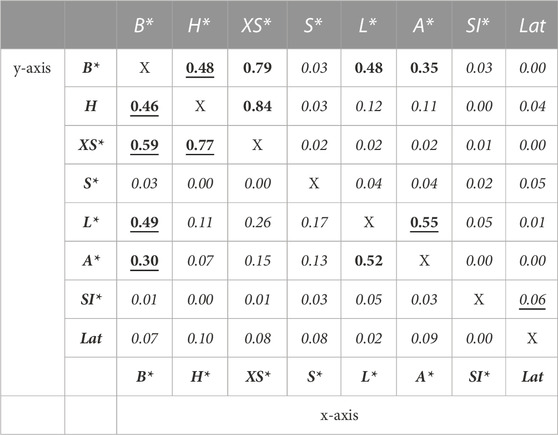
TABLE 3. Coefficient of determination R2 for the regressions performed on the relationships between harmonized morphometric characteristics. Bold values indicate a coefficient of determinations R2 higher than 0.3 and the plots for the underlined values are shown in Figure 4. The full corresponding plots can be found in the Supplementary Material.
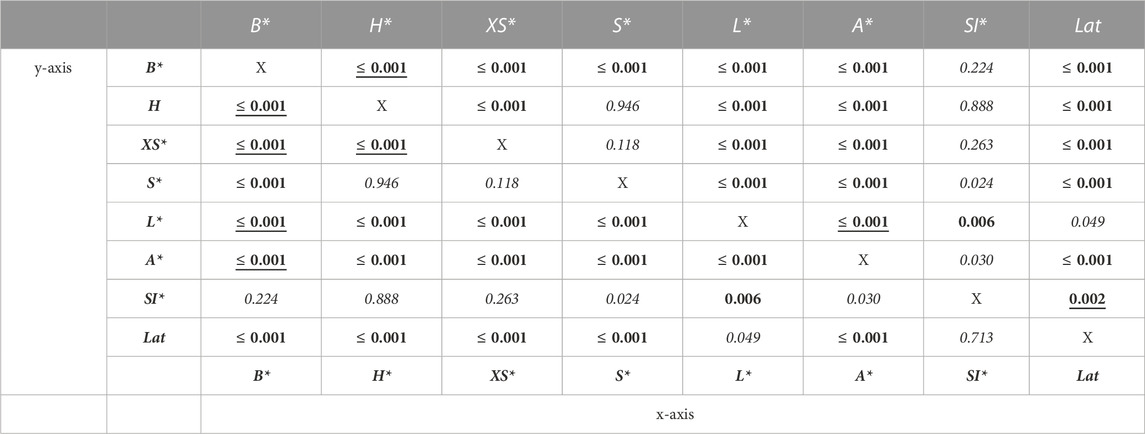
TABLE 4. p-values for the regressions performed on the relationships between harmonized morphometric characteristics. Bold values indicate a p-value ≤ 0.01 (statistically significant) and the plots for the underlined values (selected in combination with coefficient of determinations R2 in Table 3) are shown in Figure 4. The full corresponding plots can be found in the Supplementary Material.
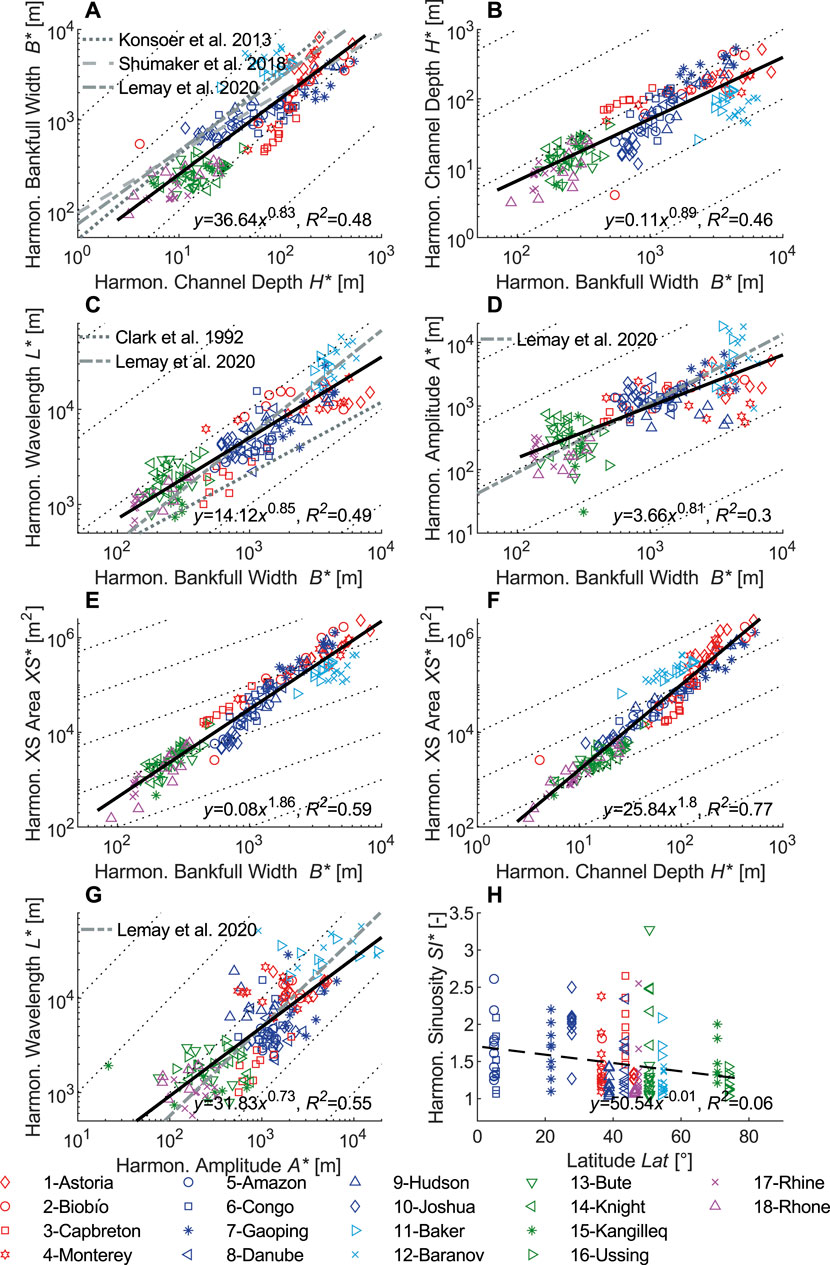
FIGURE 4. Overview of significant relationships of morphometric characteristics (complete relationships figures according to Table 3 can be found in the Supplementary Material): (A) harmonized bankfull width (B*) versus harmonized bankfull depth (H*), (B) harmonized bankfull depth (H*) versus harmonized bankfull width (B*), (C) harmonized wavelength (L*) versus harmonized bankfull width (B*), (D) harmonized amplitude (A*) versus harmonized bankfull width (B*), (E) harmonized cross-sectional area (XS*) versus harmonized bankfull width (B*), (F) harmonized cross-sectional area (XS*) versus harmonized bankfull depth (H*), (G) harmonized wavelength (L*) versus harmonized amplitude (A*), (H) harmonized sinuosity (SI*) versus latitude (Lat) (red–canyons, blue–canyon-channel systems, cyan–sea channels, green–fjord settings and pink–lake settings).
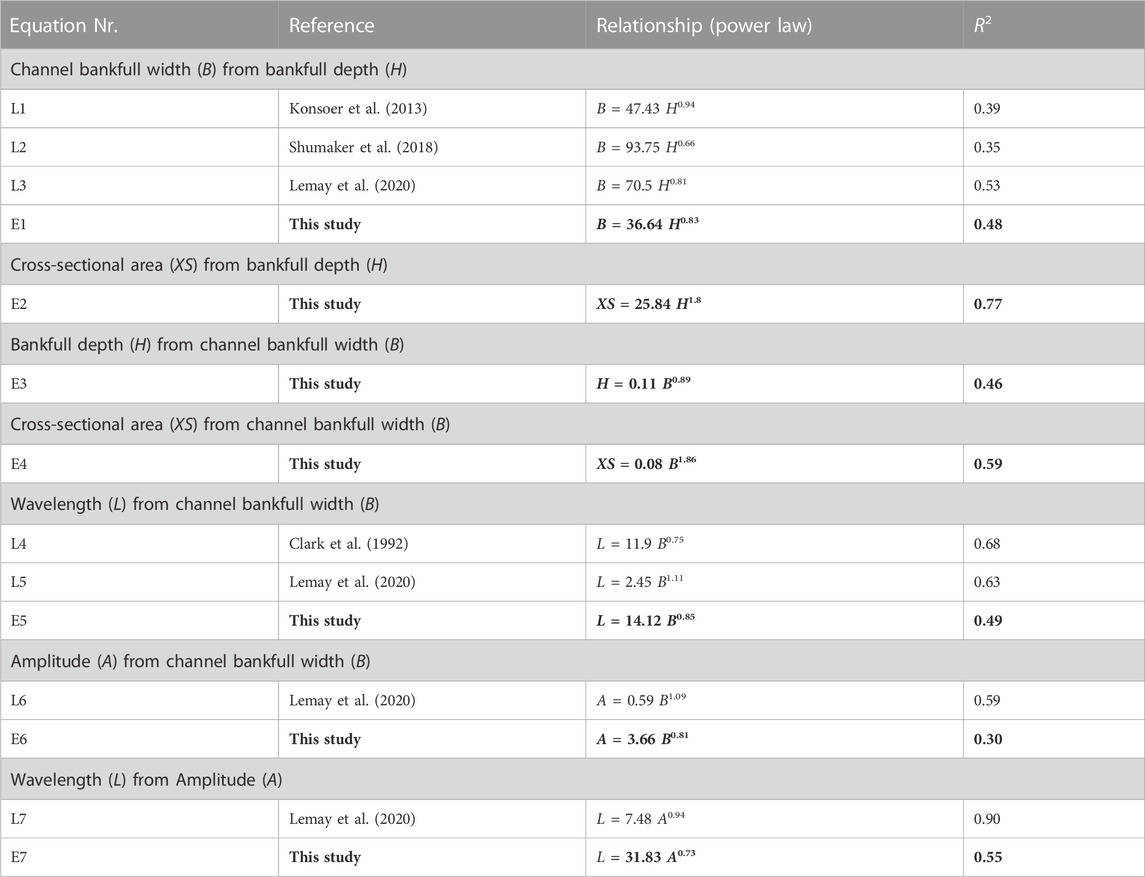
TABLE 5. Summary of subaquatic morphometric characteristics relationships.
Due to the different gradient ranges of the respective system types (Figure 3B), the association with slope showcases a lack of correlations (Table 3) in comparison to existing literature (Lemay et al., 2020), exemplified by the width-to-slope relationship featuring an R2 of 0.03 (in Lemay et al. (2020) R2 = 0.35 for leveed channels). Notably, correlations of no significance are visible in both sinuosity and latitude, with R2 values ranging between 0.00 and 0.10 and most of the p-values ≥0.01 (Tables 3, 4; Figure 4H).
Figure 5 enables a comparison, contrasting harmonized data (Figures 4A, C) with non-harmonized data (Figures 5A, B), both of which were derived using the same method for determining characteristics as detailed in Section 2.2. This comparison shows a shift of regressions towards larger canyon-channel systems, attributed to the bigger number of cross-sectional measurement points (blue markers). Consequently, these regressions converge with existing literature-derived equations (width-to-depth coefficient harmonized 36.6 (Figure 4A), non-harmonized 59.2 (Figure 5A), according Shumaker et al. (2018) 93.6–L2, Konsoer et al. (2013) 47.4–L1 and Lemay et al. (2020) 70.5–L3, Table 5). The coefficients of determination (R2) do not appear to be significantly influenced by non-harmonized data. For width-to-depth, R2 increases by 0.01 when using non-harmonized data (Figures 4A, 5A) while for wavelength-to-width, it decreases by 0.06 (Figures 4C, 5B). As a result, harmonization is not the primary factor contributing to the differences in coefficients of determination (R2) observed in Table 5 (E5, E6, E7) when compared to the existing literature. These lower R2 values can be attributed to the greater diversity of systems compared to the literature.
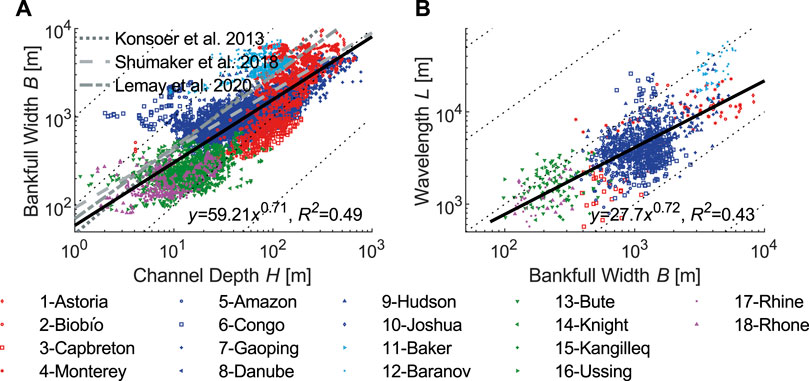
FIGURE 5. Exemplary relationships of morphometric characteristics with original data (not harmonized): (A) bankfull width (B) versus bankfull depth (H), (B) wavelength (L) versus bankfull width (B) (red–canyons, blue–canyon-channel systems, cyan–sea channels, green–fjord settings and pink–lake settings).
Regressions within the cross plots along system lengths lack significant coefficients of determination (R2), due to the variance in ratios across different channels (Figures 6A, C, E, G). However, the exponents of these regressions illustrate noticeable trends. These trends are also influenced by the systems that do not cover the entire length (3-Capbreton Canyon, 5-Amazon Channel and 10-Joshua Channel). Disregarding these systems results in only slight changes to the exponents of these regressions, but it does not alter the overall direction (whether it’s increasing or decreasing). Consequently, the indicative trend remains consistent, notwithstanding the acknowledged bias in the system selection.
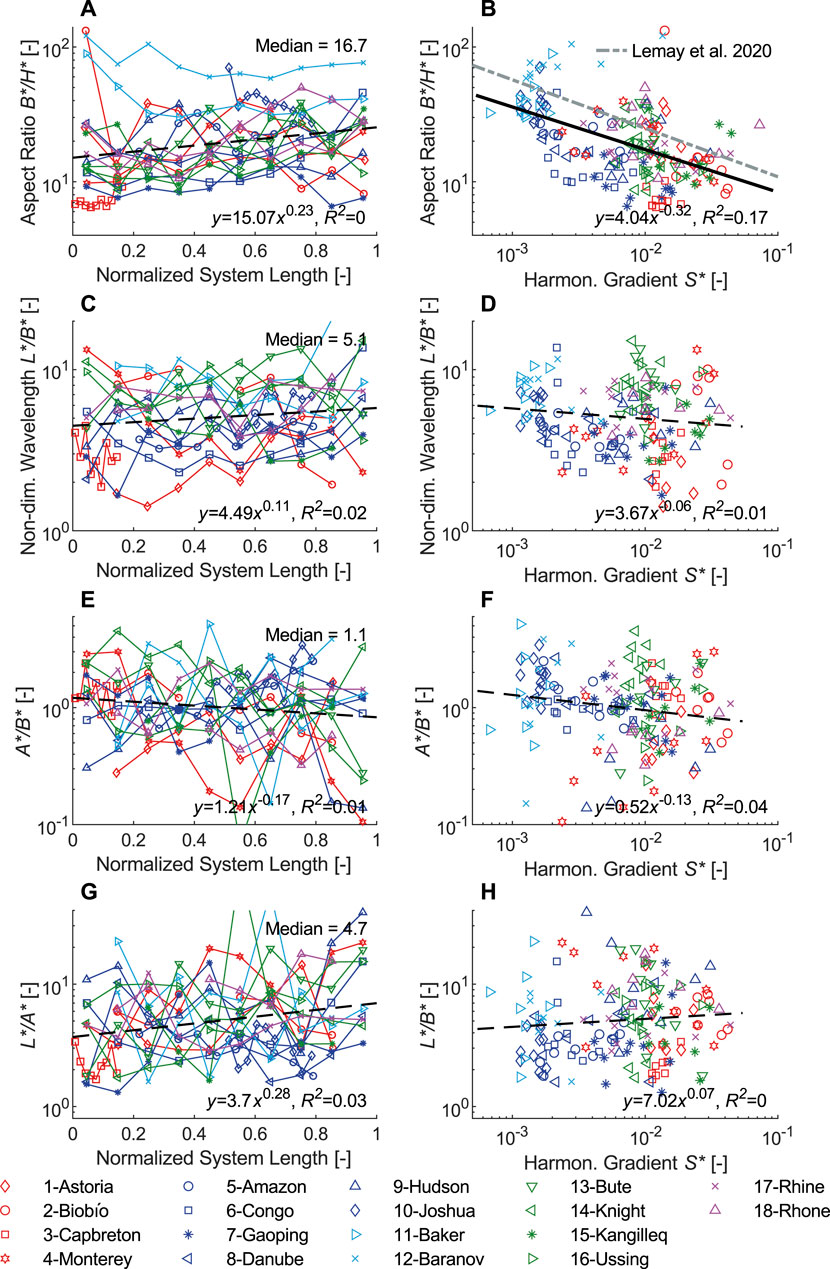
FIGURE 6. Cross plots of harmonized nondimensional ratios along normalized system length and versus harmonized thalweg gradient: (A) aspect ratio (B*/H*) along system and (B) versus harmonized thalweg gradient (S*), (C) wavelength-to-width ratio (L*/B*) along system and (D) versus harmonized thalweg gradient (S*), (E) amplitude-to-width ratio (A*/B*) along system and (F) versus harmonized thalweg gradient (S*), (G) wavelength -to- amplitude ratio (L*/A*) along system and (H) versus harmonized thalweg gradient (S*) (red–canyons, blue–canyon-channel systems, cyan–sea channels, green–fjord settings and pink–lake settings).
The aspect ratio (B*/H*, Figure 6A) increases toward the end of the channels. This is despite the initially high ratios observed at the sea channels and some canyons. In the case of the sea channels (11-Baker Channel, 12-Baranov Channel), these can be explained by their inactivity and consequently the channel head is no longer clearly defined. Nevertheless, even in these cases, the aspect ratios increase slightly towards the end, and they are the only ones that are notably higher than those in other system settings (Figure 7A). At the same time the aspect ratio shows a negative correlation with thalweg gradient, i.e., decreases with increasing thalweg gradient (Figure 6B, R2 = 0.17).
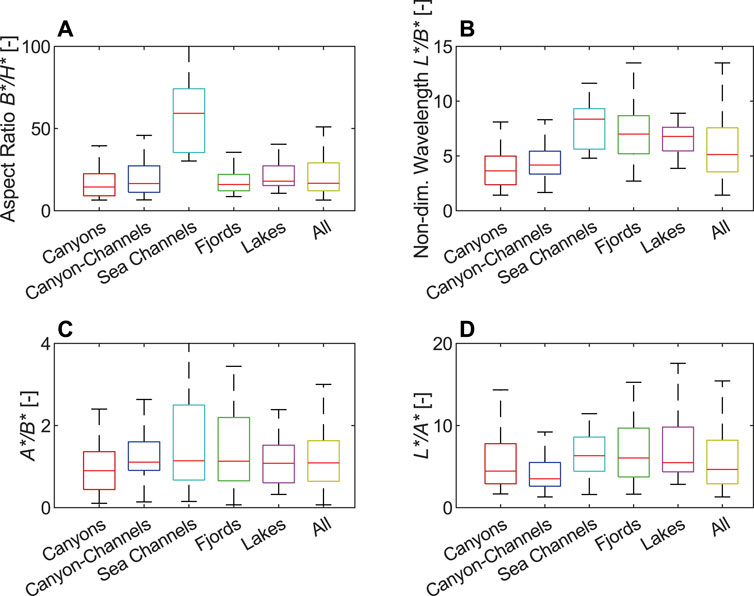
FIGURE 7. Box-plot of harmonized nondimensional ratios for different system settings and for all systems: (A) aspect ratio (B*/H*), (B) wavelength-to-width ratio (L*/B*), (C) amplitude-to-width ratio (A*/B*) and (D) wavelength-to-amplitude ratio (L*/A*). Lower and upper box boundaries 25th and 75th percentiles, respectively, line inside box median, whiskers extend to the most extreme data points.
Conversely, the non-dimensional wavelength (wavelength-to-width ratio L*/B*, Figure 6C) records a modest increase with negligible correlation to thalweg gradient (Figure 6D). Likewise, the amplitude-to-width ratio exhibits no pronounced correlation with thalweg gradient (Figure 6F) but demonstrates a slight decline across system lengths (Figure 6E). The increase in the wavelength-to-amplitude ratio along the length of the systems is significant (Figure 6G), indicative of enhanced meandering at system beginnings transitioning towards straighter channels at the end of the systems. No correlations with slope are evident in this context for wavelength-to-amplitude ratios (Figure 6H). In contrast to the aspect ratio (Figure 7A), for the non-dimensional wavelength (Figure 7B), amplitude-to-width ratio (Figure 7C) and wavelength-to-amplitude ratio (Figure 7D), consistent values are evident across diverse system settings.
The matter of overrepresentation in the dataset, primarily coming from systems with more measurement cross-sections, particularly the larger canyon-channel-fan systems, has been an ongoing concern in previous studies (Konsoer et al., 2013; Shumaker et al., 2018; Lemay et al., 2020). This problem is especially relevant in studies spanning across systems of all scales. It is evident from the comparison between Figures 4A, 5A that non-harmonized data produces regressions more aligned with literature-derived trends (Konsoer et al., 2013; Shumaker et al., 2018; Lemay et al., 2020). The harmonization process, represented in Figure 4, prevents this bias by ensuring equal weighting to each system.
It is worth highlighting that variations in the number of subdivisions for harmonization lead to minimal impact on regressions, a conclusion validated by investigations involving different subdivisions (e.g., 6 parts, 20 parts), as detailed in the Supplementary Material. The selection of ten subdivisions, based on their representativeness and computational feasibility, proves robust for harmonization in the present analysis.
Evident from the results is the prominence of bankfull width as a dominant characteristic in scaling relationships spanning diverse system settings. Table 5; Figure 4 underscores the robust scaling relationships between bankfull width and characteristics like bankfull depth, cross-sectional area, wavelength, and amplitude.
The aspect ratio (width-to-depth ratio), appears as a dominant ratio (Konsoer et al., 2013; Shumaker et al., 2018). While no pronounced grouping among different system types is observed, sea channels distinguish with high ratios (median aspect ratio 59.2), nearing 100:1 (Figures 6A, 7A). This observation extends Shumaker et al. (2018) identification of a minimum ratio of ∼10:1 to a maximum of ∼100:1, spanning diverse settings such as canyons (median aspect ratio 14.4) deep-sea canyon-channel systems (median aspect ratio 16.5), fjords (median aspect ratio 16.0), and lakes (median aspect ratio 18.0). The median aspect ratio, at 16.7 lower than known so far (Konsoer et al., 2013; Lemay et al., 2020), potentially reflects the balanced system selection and the occurrence of narrower subaquatic conduits (width <1,000 m), especially in fjords.
For the non-dimensional wavelength (wavelength-to-width ratio, Figures 6C, 7B, medians: canyons–3.6, canyon-channels–4.2, sea channels–8.4, fjords–7.0, lakes–6.8), amplitude-to-width ratio (Figures 6E, 7C, medians: canyons–0.9, canyon-channels–1.1, sea channels–1.1, fjords–1.1, lakes–1.1), and wavelength-to-amplitude ratio (Figures 6G, 7D, medians: canyons–4.4, canyon-channels–3.5, sea channels–6.3, fjords–6.1, lakes–5.5), consistent values are evident across diverse systems, indicative of uniformity in planform appearance of subaquatic channels. Median values align with those reported by Lemay et al. (2020). Additionally, the lack of correlation with gradient (Figures 6D, F, H) suggests that system settings exert minimal influence on planform characteristics.
The hypothesized influence of latitude on sinuosity, proposed by Peakall et al. (2012), remains unconfirmed. The current results, lacking of any correlation between these characteristics (Figure 4H; Tables 3, 4), imply the importance of other factors, like flow dynamics (dense basal layer) (Sylvester et al., 2013; Paull et al., 2018; Pope et al., 2022) in determining sinuous channel forms. Furthermore, no dominant influences can be identified from the different sediment conditions (Table 1) in the systems. Sandy systems, including lakes, fjords and some canyons, show similar ratios to those observed in mud-sand and mud-rich systems found in canyons and canyon-channel systems (Figure 7).
Collectively, these trends in morphometric scaling lay a groundwork for subaquatic channel models, highlighting similarities of channel morphology across diverse settings, irrespective of location, latitude or sediment supply.
The analysis suggests that a certain compactness of channel is necessary for sustaining turbidity currents across all systems, indicated by aspect ratios ranging from ∼10:1 to ∼100:1 (Figures 4A, 6A, 7A). This implies a balance between bankfull channel width, where erosion occurs due to dense basal layers (Paull et al., 2018; Pope et al., 2022), and channel depth, characterized by clear water entrainment and possible overspill. At these aspect ratios, erosion and deposition is probably in balance to maintain turbidity currents in autosuspension (Parker et al., 1986; Heerema et al., 2020; Talling et al., 2022). This equilibrium parallels the interaction between channel geometry and flow discharge, similar to fluvial systems, as postulated in prior research (Konsoer et al., 2013; Traer et al., 2018).
Contrary to previous interpretations, the correlation between aspect ratio and thalweg gradient does not reflect a downslope widening of channels (Lemay et al., 2020). Instead, it captures a mosaic of separate systems situated across different gradient ranges, indicating individual system variations rather than uniform downstream development (Figure 6B). The observed aspect ratio increase downstream (Figure 6A) is attributed not to widening, but to decreasing bankfull depth (Figure 3D). This study, like Lemay et al. (2020), is based on unit channels and not composite systems, differs in that it considers channel evolution along with cross plots (Figure 6), allowing interpretation along systems, which is not possible with cross plots alone (Lemay et al., 2020).
Consequently, width arises as a relatively stable morphometric characteristic, unchanging through channel evolution. Width dictates other characteristics such as maximum bankfull depth (Figure 3B), wavelength (Figure 3C), and amplitude (Figure 3D) (Shumaker et al., 2018). Gentle increases in non-dimensional wavelength (wavelength-to-width ratio, Figure 6C), coupled with pronounced decreases in the amplitude-to-width ratio (Figure 6E) and noticeable increases in the wavelength-to-amplitude ratio (Figure 6G), suggest that meanders are more pronounced at the channel beginning, evolving over its lifespan. This evolution is pronounced in older parts that are frequently traversed by turbidity currents. Further downslope, where not all turbidity currents pass through (Heerema et al., 2020) and which are also younger by possible avulsions (Kolla, 2007), planform shapes gradually become straighter, and their depths decrease.
This channel evolution, previously attributed to large canyon-channel-fan systems (Pirmez and Flood, 1995; Babonneau et al., 2002), occurs as a more widespread phenomenon encompassing channelized sediment conduits across various settings, such as canyons, fjords, and lakes. Notably, the growth of meanders is constrained to wavelengths around 10 times the width (median 5.1, Figures 6C, 7B) and amplitude ratios of up to 3 times the width (median 1.1, Figures 6E, 7C), irrespective of system size or setting. Factors like sediment supply (sandy: fjord, lakes, some canyons; mud rich: canyon-channel systems), which influence clay content (Lemay et al., 2020), or sediment-related turbidity current speed (Talling et al., 2023) appear insignificant, while flow stratification or secondary cell changes (Peakall and Sumner, 2015; Azpiroz-Zabala et al., 2017) appear as potential driving factors. In fjord and lake systems, confinement within these settings could additionally limit meander expansion compared to deep-sea systems.
In essence, these findings support existing theories concerning the age and development of subaquatic channels (Konsoer et al., 2013; Shumaker et al., 2018; Jobe et al., 2020). Subaquatic channels, marked by an initially straight course defined by a fixed bankfull width, evolve by deepening due to recurrent overspills of turbidity currents. Meandering initiates once a certain bankfull depth is reached, at which the turbidity current is confined by the channel. Lateral movements start with the development of meanders, as can be seen further upstream the channel in higher amplitude-to-width ratio (Figure 6E) and lower wavelength-to-amplitude ratio (Figure 6G). This insight expands the understanding of channel development, applicable universally across different settings and scales.
The morphometric characteristics of 18 subaquatic channels have been analyzed, covering diverse systems, from lakes, fjords, canyons to deep-sea channels, aiming to reveal scaling relationships, validate existing ones, and gain insights into the evolution of these diverse systems. The methodology introduced critical advancements, including novel data harmonization to mitigate size-based bias, and an analytical approach applicable across diverse systems without relying on literature-derived measurements. This enabled a balanced selection of subaquatic systems encompassing varied settings, sizes, and locations, spanning a wide-ranging set from lakes to deep-sea channels.
Bankfull width emerged as a dominant morphometric characteristic in scaling relationships, exhibiting strong correlations with bankfull depth, cross-sectional area, wavelength, and amplitude. The aspect ratio, representing width-to-depth ratio, demonstrated consistent trends across various systems, reflecting a certain compactness of channels is necessary for turbidity currents to sustain (minimum aspect ratio of ∼10:1 to a maximum aspect ratio of ∼100:1). Planform ratios like non-dimensional wavelength, amplitude-to-width ratio, and wavelength-to-amplitude ratio displayed uniformity across systems, constrained by specific ratios of wavelength and amplitude, irrespective of settings.
Moreover, the channel width remains stable during evolution. Meanders are more pronounced at the channel’s start and evolve over time, particularly in sections older and frequently flown through by turbidity currents. Further downstream, channels straighten and become shallower but not wider. Meander growth is constrained by specific ratios of width to wavelength (around 10 times the width) and amplitude (up to 3 times the width). These findings support existing theories about subaquatic channel development, where meandering begins after a certain channel depth is reached. This evolution is not limited to large systems but applies to various settings and scales.
The findings underline the universal significance of bankfull width in shaping subaquatic channels and suggest common mechanisms driving channel evolution. The study methodology and insights pave the way for more precise models and deepen the understanding of diverse subaquatic channels.
The modified Matlab script (original version by Hasenhündl and Blanckaert (2022), CC BY-SA 4.0) and the Matlab function for harmonization for this study can be found at https://gitlab.tuwien.ac.at/martin.hasenhuendl/matlab-script-for-the-morphometric-analysis. The raw bathymetric data for this study can be found in the sources mentioned in Table 1.
MH: Conceptualization, Data curation, Formal Analysis, Methodology, Software, Writing–original draft. LB: Conceptualization, Data curation, Formal Analysis, Methodology, Writing–review and editing. CB: Data curation, Formal Analysis, Writing–review and editing.
The author(s) declare that no financial support was received for the research, authorship, and/or publication of this article.
The authors thank John Fenton and David Lun for their all-time mathematical and statistical advice and for constructive criticism of the manuscript. Additionally, the authors acknowledge the contribution of DeepL and ChatGPT (3 August 2023 Version) for their assistance in formulating and phrasing various paragraphs of this manuscript. The authors acknowledge TU Wien Bibliothek for financial support through its Open Access Funding Programme.
The authors declare that the research was conducted in the absence of any commercial or financial relationships that could be construed as a potential conflict of interest.
All claims expressed in this article are solely those of the authors and do not necessarily represent those of their affiliated organizations, or those of the publisher, the editors and the reviewers. Any product that may be evaluated in this article, or claim that may be made by its manufacturer, is not guaranteed or endorsed by the publisher.
The Supplementary Material for this article can be found online at: https://www.frontiersin.org/articles/10.3389/feart.2023.1290509/full#supplementary-material
Azpiroz-Zabala, M., Cartigny, M. J. B., Sumner, E. J., Clare, M. A., Talling, P. J., Parsons, D. R., et al. (2017). A general model for the helical structure of geophysical flows in channel bends. Geophys. Res. Lett. 44 (11), 932–941. doi:10.1002/2017GL075721
Babonneau, N., Savoye, B., Cremer, M., and Klein, B. (2002). Morphology and architecture of the present canyon and channel system of the Zaire deep-sea fan. Mar. Pet. Geol. 19, 445–467. doi:10.1016/S0264-8172(02)00009-0
Batchelor, C. L., Dowdeswell, J. A., and Rignot, E. (2018). Submarine landforms reveal varying rates and styles of deglaciation in North-West Greenland fjords. Mar. Geol. 402, 60–80. doi:10.1016/j.margeo.2017.08.003
Bernhardt, A., Melnick, D., Jara-Muñoz, J., Argandoña, B., González, J., and Strecker, M. R. (2015). Controls on submarine canyon activity during sea-level highstands: the Biobío canyon system offshore Chile. Geosphere 11, 1226–1255. doi:10.1130/GES01063.1
Brocheray, S., Cremer, M., Zaragosi, S., Schmidt, S., Eynaud, F., Rossignol, L., et al. (2014). 2000years of frequent turbidite activity in the capbreton canyon (bay of biscay). Mar. Geol. 347, 136–152. doi:10.1016/j.margeo.2013.11.009
Bührig, L. H., Colombera, L., Patacci, M., Mountney, N. P., and McCaffrey, W. D. (2022a). A global analysis of controls on submarine-canyon geomorphology. Earth-Science Rev. 233, 104150. doi:10.1016/j.earscirev.2022.104150
Bührig, L. H., Colombera, L., Patacci, M., Mountney, N. P., and McCaffrey, W. D. (2022b). Tectonic influence on the geomorphology of submarine canyons: implications for deep-water sedimentary systems. Front. Earth Sci. 10, 1–30. doi:10.3389/feart.2022.836823
Chiang, C., and Yu, H. (2011). Sedimentary erosive processes and sediment dispersal in Kaoping submarine canyon. Sci. China Earth Sci. 54, 259–271. doi:10.1007/s11430-010-4076-y
Clark, J., Kenyon, N., and Pickering, K. (1992). Quantitative analysis of the geometry of submarine levees. Geology 60, 877–910. doi:10.1130/0091-7613(1992)020<0633
Conway, K. W., Barrie, J. V., Picard, K., and Bornhold, B. D. (2012). Submarine channel evolution: active channels in fjords, British Columbia, Canada. Geo-Marine Lett. 32, 301–312. doi:10.1007/s00367-012-0280-4
Corella, J. P., Loizeau, J. L., le Dantec, N., Hilbe, M., Gerard, J., le Dantec, N., et al. (2016). The role of mass-transport deposits and turbidites in shaping modern lacustrine deepwater channels. Mar. Pet. Geol. 77, 515–525. doi:10.1016/j.marpetgeo.2016.07.004
Covault, J. A., Fildani, A., Romans, B. W., and McHargue, T. (2011). The natural range of submarine canyon-and-channel longitudinal profiles. Geosphere 7, 313–332. doi:10.1130/GES00610.1
Covault, J. A., Sylvester, Z., Ceyhan, C., and Dunlap, D. B. (2021). Giant meandering channel evolution, Campos deep-water salt basin, Brazil. Geosphere 17, 1869–1889. doi:10.1130/GES02420.1
Dennielou, B., Droz, L., Babonneau, N., Jacq, C., Bonnel, C., Picot, M., et al. (2017). Morphology, structure, composition and build-up processes of the active channel-mouth lobe complex of the Congo deep-sea fan with inputs from remotely operated underwater vehicle (ROV) multibeam and video surveys. Deep Sea Res. Part II Top. Stud. Oceanogr. 142, 25–49. doi:10.1016/j.dsr2.2017.03.010
EMODnet Bathymetry Consortium (2022). EMODnet digital bathymetry (DTM 2022) - tile E7. Available at: https://emodnet.ec.europa.eu/geonetwork/srv/api/records/82fcc7b7-1e93-4dfa-a264-b05b4e4f1813 (Accessed June 12, 2023).
Gales, J. A., Talling, P. J., Cartigny, M. J. B., Hughes Clarke, J., Lintern, G., Stacey, C., et al. (2019). What controls submarine channel development and the morphology of deltas entering deep-water fjords? Earth Surf. Process. Landforms 44, 535–551. doi:10.1002/esp.4515
Galy, V., France-Lanord, C., Beyssac, O., Faure, P., Kudrass, H., and Palhol, F. (2007). Efficient organic carbon burial in the Bengal fan sustained by the Himalayan erosional system. Nature 450, 407–410. doi:10.1038/nature06273
Geological Survey of Canada (2005). Knight Inlet western section 2005, British Columbia central coast, offshore western Canada. MapServer. Available at: https://geoappext.nrcan.gc.ca/arcgis/rest/services/GSCA/multibeam_west_e/MapServer/13 (Accessed June 12, 2023).
Geological Survey of Canada (2008). Bute Inlet 2008, British Columbia central coast, offshore western Canada. MapServer. Available at: https://geoappext.nrcan.gc.ca/arcgis/rest/services/GSCA/multibeam_west_e/MapServer/2 (Accessed June 12, 2023).
Girardclos, S., Hilbe, M., Corella, J. P., Loizeau, J. L., Kremer, K., Delsontro, T., et al. (2012). Searching the rhone delta channel in lake Geneva since françois alphonse FOREL. Arch. Des. Sci. 65, 103–118. doi:10.7892/boris.45630
Goldfinger, C., Nelson, C. H., Morey, A. E., Johnson, J. E., Patton, J. R., Karabanov, E. B., et al. (2012). Turbidite event history—methods and implications for Holocene paleoseismicity of the Cascadia subduction zone. Reston (Virginia): U.S. Geological Survey Professional. Paper 1661–F. doi:10.3133/pp1661F
Guiastrennec-Faugas, L., Gillet, H., Silva Jacinto, R., Dennielou, B., Hanquiez, V., Schmidt, S., et al. (2020). Upstream migrating knickpoints and related sedimentary processes in a submarine canyon from a rare 20-year morphobathymetric time-lapse (Capbreton submarine canyon, Bay of Biscay, France). Mar. Geol. 423, 106143. doi:10.1016/j.margeo.2020.106143
Harris, P. T., and Whiteway, T. (2011). Global distribution of large submarine canyons: geomorphic differences between active and passive continental margins. Mar. Geol. 285, 69–86. doi:10.1016/j.margeo.2011.05.008
Hasenhündl, M., and Blanckaert, K. (2022). A Matlab script for the morphometric analysis of subaerial, subaquatic and extra-terrestrial rivers, channels and canyons. Comput. Geosci. 162, 105080. doi:10.1016/j.cageo.2022.105080
Heerema, C. J., Talling, P. J., Cartigny, M. J., Paull, C. K., Bailey, L., Simmons, S. M., et al. (2020). What determines the downstream evolution of turbidity currents? Earth Planet. Sci. Lett. 532, 116023. doi:10.1016/j.epsl.2019.116023
Ifremer Geo-Ocean (2018). Bathymétrie - canyon de Capbreton (synthèse, édition 2007). doi:10.12770/72e2f750-c255-11df-a9b6-005056987263
Internationale Gewässerschutzkommission für den Bodensee (IGKB) (2015). IGKB-Tiefenschärfe-Bodensee digitale Geländemodelle mit 10 m und 3 m Auflösung. doi:10.1594/PANGAEA.855987
Jobe, Z. R., Howes, N. C., Straub, K. M., Cai, D., Deng, H., Laugier, F. J., et al. (2020). Comparing aggradation, superelevation, and avulsion frequency of submarine and fluvial channels. Front. Earth Sci. 8. doi:10.3389/feart.2020.00053
Kane, I. A., and Clare, M. A. (2019). Dispersion, accumulation, and the ultimate fate of microplastics in deep-marine environments: a review and future directions. Front. Earth Sci. 7. doi:10.3389/feart.2019.00080
Kolla, V. (2007). A review of sinuous channel avulsion patterns in some major deep-sea fans and factors controlling them. Mar. Pet. Geol. 24, 450–469. doi:10.1016/j.marpetgeo.2007.01.004
Konsoer, K., Zinger, J., and Parker, G. (2013). Bankfull hydraulic geometry of submarine channels created by turbidity currents: relations between bankfull channel characteristics and formative flow discharge. J. Geophys. Res. Earth Surf. 118, 216–228. doi:10.1029/2012JF002422
Lansey, J. C. (2023). Power law, exponential and logarithmic fit. Available at: https://www.mathworks.com/matlabcentral/fileexchange/29545-power-law-exponential-and-logarithmic-fit (Accessed June 28, 2023).
Lemay, M., Grimaud, J.-L., Cojan, I., Rivoirard, J., and Ors, F. (2020). Geomorphic variability of submarine channelized systems along continental margins: comparison with fluvial meandering channels. Mar. Pet. Geol. 115, 104295. doi:10.1016/j.marpetgeo.2020.104295
Leopold, L. B., and Maddock, T. J. (1953). The hydraulic geometry of stream channels and some physiographic implications. Geol. Surv. Prof. Pap. 252, 57. doi:10.3133/pp252
Leopold, L. B., and Wolman, M. G. (1960). River meanders. Bull. Geol. Soc. Am. 71, 769–793. doi:10.1130/0016-7606(1960)71[769:RM]2.0.CO;2
Liu, J. T., Hsu, R. T., Hung, J. J., Chang, Y. P., Wang, Y. H., Rendle-Bühring, R. H., et al. (2016). From the highest to the deepest: the Gaoping River-Gaoping Submarine Canyon dispersal system. Earth-Science Rev. 153, 274–300. doi:10.1016/j.earscirev.2015.10.012
Maier, K. L., Gales, J. A., Paull, C. K., Rosenberger, K., Talling, P. J., Simmons, S. M., et al. (2019). Linking direct measurements of turbidity currents to submarine canyon-floor deposits. Front. Earth Sci. 7, 1–18. doi:10.3389/feart.2019.00144
Morris, P. D., Sylvester, Z., Covault, J. A., Mohrig, D., and Dunlap, D. (2024). Fluvial-style migration controls autogenic aggradation in submarine channels: joshua Channel, eastern gulf of Mexico. Geol. Soc. Lond. Spec. Publ. 540. doi:10.1144/SP540-2022-123
Mürle, U., Ortlepp, J., Rey, P., and Hydra - Büro Rey, (2004). Der Bodensee Zustand-Fakten-Perspektiven. Bregenz: internationale Gewässerschutzkommission für den Bodensee (IGKB).
Nelson, C. H., Carlson, P. R., Byrne, J. V., and Alpha, T. R. (1970). Development of the Astoria Canyon-Fan physiography and comparison with similar systems. Mar. Geol. 8, 259–291. doi:10.1016/0025-3227(70)90047-2
NOAA National Centers for Environmental Information (2004). Multibeam bathymetry database (MBBDB). NOAA Natl. Centers Environ. Inf. doi:10.7289/V56T0JNC
Parker, G., Fukushima, Y., and Pantin, H. M. (1986). Self-accelerating turbidity currents. J. Fluid Mech. 171, 145–181. doi:10.1017/S0022112086001404
Paull, C. (2011). High-resolution bathymetry of the axial channels within Monterey and Soquel submarine canyons, offshore central California. Geosphere 7, 1077. doi:10.1130/GES00636.1
Paull, C. K., Talling, P. J., Maier, K. L., Parsons, D., Xu, J., Caress, D. W., et al. (2018). Powerful turbidity currents driven by dense basal layers. Nat. Commun. 9, 4114–4119. doi:10.1038/s41467-018-06254-6
Peakall, J., Kane, I. A., Masson, D. G., Keevil, G., Mccaffrey, W., and Corney, R. (2012). Global (latitudinal) variation in submarine channel sinuosity. Geology 40, 11–14. doi:10.1130/G32295.1
Peakall, J., and Sumner, E. J. (2015). Submarine channel flow processes and deposits: a process-product perspective. Geomorphology 244, 95–120. doi:10.1016/j.geomorph.2015.03.005
Pierdomenico, M., Bernhardt, A., Eggenhuisen, J. T., Clare, M. A., Lo Iacono, C., Casalbore, D., et al. (2023). Transport and accumulation of litter in submarine canyons: a geoscience perspective. Front. Mar. Sci. 10, 1–22. doi:10.3389/fmars.2023.1224859
Piper, D. J. W., Shor, A. N., and Hughes Clarke, J. E. (1988). The 1929 Grand Banks earthquake, slump, and turbidity current. Spec. Pap. Geol. Soc. Am. 229, 77–92. doi:10.1130/SPE229-p77
Pirmez, C., and Flood, R. D. (1995). Morphology and structure of Amazon Channel. Proc. Ocean. Drill. Program 155. Initial Reports 155. doi:10.2973/odp.proc.ir.155.103.1995
Pirmez, C., and Imran, J. (2003). Reconstruction of turbidity currents in Amazon Channel. Mar. Pet. Geol. 20, 823–849. doi:10.1016/j.marpetgeo.2003.03.005
Pope, E. L., Cartigny, M. J. B., Clare, M. A., Talling, P. J., Lintern, D. G., Vellinga, A., et al. (2022). First source-to-sink monitoring shows dense head controls sediment flux and runout in turbidity currents. Sci. Adv. 8, eabj3220. doi:10.1126/sciadv.abj3220
Pope, E. L., Normandeau, A., Ó Cofaigh, C., Stokes, C. R., and Talling, P. J. (2019). Controls on the formation of turbidity current channels associated with marine-terminating glaciers and ice sheets. Mar. Geol. 415, 105951. doi:10.1016/j.margeo.2019.05.010
Popescu, I., Lericolais, G., Panin, N., Normand, A., Dinu, C., and Le Drezen, E. (2004). The Danube submarine canyon (Black Sea): morphology and sedimentary processes. Mar. Geol. 206, 249–265. doi:10.1016/j.margeo.2004.03.003
Popescu, I., Lericolais, G., Panin, N., Wong, H. ., and Droz, L. (2001). Late quaternary channel avulsions on the danube deep-sea fan, black sea. Mar. Geol. 179, 25–37. doi:10.1016/S0025-3227(01)00197-9
Posamentier, H. W. (2003). Depositional elements associated with a basin floor channel-levee system: case study from the Gulf of Mexico. Mar. Pet. Geol. 20, 677–690. doi:10.1016/j.marpetgeo.2003.01.002
Reece, R. S., Gulick, S. P. S., Horton, B. K., Christeson, G. L., and Worthington, L. L. (2011). Tectonic and climatic influence on the evolution of the surveyor fan and channel system, gulf of Alaska. Geosphere 7, 830–844. doi:10.1130/GES00654.1
Rona, P., Guida, V., Scranton, M., Gong, D., Macelloni, L., Pierdomenico, M., et al. (2015). Hudson submarine canyon head offshore New York and New Jersey: a physical and geochemical investigation. Deep Sea Res. Part II Top. Stud. Oceanogr. 121, 213–232. doi:10.1016/j.dsr2.2015.07.019
Schumm, S. A. (1979). Geomorphic thresholds: the concept and its applications. Trans. Inst. Br. Geogr. 4, 485–515. doi:10.2307/622211
Shumaker, L. E., Jobe, Z. R., Johnstone, S. A., Pettinga, L. A., Cai, D., and Moody, J. D. (2018). Controls on submarine channel-modifying processes identified through morphometric scaling relationships. Geosphere 14, 2171–2187. doi:10.1130/GES01674.1
Stanley, D. J., and Freeland, G. L. (1978). The erosion—deposition boundary in the head of Hudson Submarine Canyon defined on the basis of submarine observations. Mar. Geol. 26, M37–M46. doi:10.1016/0025-3227(78)90055-5
Swisstopo, P. (2016). swissBATHY3D. Available at: https://www.swisstopo.admin.ch/de/geodata/height/bathy3d.html (Accessed June 12, 2023).
Sylvester, Z., Pirmez, C., Cantelli, A., and Jobe, Z. R. (2013). Global (latitudinal) variation in submarine channel sinuosity: COMMENT. Geology 41, e287. doi:10.1130/G33548C.1
Talling, P. J. (2014). On the triggers, resulting flow types and frequencies of subaqueous sediment density flows in different settings. Mar. Geol. 352, 155–182. doi:10.1016/j.margeo.2014.02.006
Talling, P. J., Baker, M. L., Pope, E. L., Ruffell, S. C., Jacinto, R. S., Heijnen, M. S., et al. (2022). Longest sediment flows yet measured show how major rivers connect efficiently to deep sea. Nat. Commun. 13, 4193. doi:10.1038/s41467-022-31689-3
Talling, P. J., Cartigny, M. J. B., Pope, E., Baker, M., Clare, M. A., Heijnen, M., et al. (2023). Detailed monitoring reveals the nature of submarine turbidity currents. Nat. Rev. Earth Environ. 4, 642–658. doi:10.1038/s43017-023-00458-1
Thornburg, T. M., Kulm, L. D., and Hussong, D. M. (1990). Submarine-fan development in the southern Chile Trench: a dynamic interplay of tectonics and sedimentation. Geol. Soc. Am. Bull. 102, 1658–1680. doi:10.1130/0016-7606(1990)102<1658:SFDITS>2.3.CO;2
Traer, M. M., Fildani, A., Fringer, O., McHargue, T., and Hilley, G. E. (2018). Turbidity current dynamics: 2. Simulating flow evolution toward equilibrium in idealized channels. J. Geophys. Res. Earth Surf. 123, 520–534. doi:10.1002/2017JF004202
U.S. Bureau of Ocean Energy Management (2023). Gulf of Mexico deepwater bathymetry grid. Available at: https://www.boem.gov/oil-gas-energy/mapping-and-data/map-gallery/northern-gom-deepwater-bathymetry-grid-3d-seismic (Accessed June 12, 2023).
Keywords: subaquatic channels, morphometric analysis, scaling relationships, turbidity currents, channel evolution, bathymetric data, bankfull width
Citation: Hasenhündl M, Bauernberger LS and Böhm C (2023) Extending morphometric scaling relationships: the role of bankfull width in unifying subaquatic channel morphologies. Front. Earth Sci. 11:1290509. doi: 10.3389/feart.2023.1290509
Received: 07 September 2023; Accepted: 10 November 2023;
Published: 29 November 2023.
Edited by:
Francisca Martinez-Ruiz, Spanish National Research Council (CSIC), SpainReviewed by:
Elda Miramontes, University of Bremen, GermanyCopyright © 2023 Hasenhündl, Bauernberger and Böhm. This is an open-access article distributed under the terms of the Creative Commons Attribution License (CC BY). The use, distribution or reproduction in other forums is permitted, provided the original author(s) and the copyright owner(s) are credited and that the original publication in this journal is cited, in accordance with accepted academic practice. No use, distribution or reproduction is permitted which does not comply with these terms.
*Correspondence: Martin Hasenhündl, bS5oYXNlbmh1ZW5kbEBnbXgubmV0
Disclaimer: All claims expressed in this article are solely those of the authors and do not necessarily represent those of their affiliated organizations, or those of the publisher, the editors and the reviewers. Any product that may be evaluated in this article or claim that may be made by its manufacturer is not guaranteed or endorsed by the publisher.
Research integrity at Frontiers
Learn more about the work of our research integrity team to safeguard the quality of each article we publish.