 Xin Wang
 Lailiang Cai
 Bingjie Zhang
94% of researchers rate our articles as excellent or good
Learn more about the work of our research integrity team to safeguard the quality of each article we publish.
Find out more
ORIGINAL RESEARCH article
Front. Earth Sci., 28 December 2023
Sec. Geohazards and Georisks
Volume 11 - 2023 | https://doi.org/10.3389/feart.2023.1287981
Coal mining subsidence leads to frequent surface ecological and environmental problems. Due to the unique topographic conditions within gully areas, the deformation and damage characteristics, along with the evolution laws of the surface, have been difficult to analyze. To explore the surface movement and deformation law of shallow-buried coal seam mining in a gully area, this study designed a three-dimensional similar-material simulation test simulating the complete movement and deformation of the ground surface under real terrain conditions and proposed a complete data acquisition and processing scheme. Combined with the numerical simulation analysis, we utilized this scheme to analyze the dynamic influence law of coal seam mining in a gully area on the distribution of ground surface stress and displacement as well as on the dynamic characteristics of the ground surface damage. The results show that the existence of gully topography affects the stress distribution of the ground surface and the raw rock of the coal seams underneath and that there exists a stress concentration in the gully area of the ground surface. Furthermore, the mining activities of the coal seams lead to an increase in the degree of stress concentration in the gully area of the ground surface, and the slopes enter into the process of energy accumulation and sudden release, which makes the region prone to the occurrence of geological disasters such as landslides and collapses. In addition, the surface movement and deformation in the gully area are more intense, exceeding the plain area, and the surface movement is affected by the spatial location relationship between the mining area and the slope body, causing the center of the mining area to show obvious eccentricity characteristics. The results of this study provide a reference basis for the safe mining of coal mines in gully topography.
With the westward shift in the focus of China’s coal resource development, the scale of shallow-buried coal seam mining in the western region is expanding (Zhao et al., 2022). Intensive mining activities have increased the extent of transport of overlying rock strata in mining areas, exacerbated surface damage, and seriously affected fragile ecological environments (Cui et al., 2014; Tang et al., 2015; Li G. et al., 2022; Zhang et al., 2022a; Wang et al., 2022), giving rise to a series of geological and ecological issues, including surface subsidence and fissure development, the depletion of groundwater, the degradation of vegetation, and the frequent occurrence of geologic disasters such as landslides (Xu et al., 2016; Liu et al., 2018; Tang et al., 2019; Wang et al., 2020). Compared with other coal seam mining areas, the overlying rock layer in gully areas is thin and mechanically fragile, and the distribution of mining stress on the overlying rock is affected by both coal seam mining and the surface gully topography. Therefore, shallow-buried coal seam mining in gully areas is a three-dimensional spatial activity involving both the surface and subsurface, and understanding the mechanism of surface deformation and damage in this area is crucial for disaster prediction and prevention (Das and Mohanty, 2016; Xu et al., 2017a; Costea, 2018).
In order to safely and sustainably mine shallow-buried coal seams in gully areas, many scholars have conducted in-depth research on the development law of fissure, stress evolution characteristics, dynamic changes in the ground surface, and the overburden destruction mechanism in gully areas employing on-site measurements, similar-material simulation, numerical simulation, and theoretical analysis, achieving varied results. Zhang et al. (2022b) divided fissures in a valley mining area into dynamic in-plane fissures and boundary fissures, revealing the contraction and closure characteristics of the dynamic in-plane fissures. Yang et al. (2021) and Li J. W. et al. (2022) analyzed the development characteristics of mining-induced fissures in a valley region and divided the overlying strata into three zones: the collapse fissure zone, the compacted fissure zone, and the vertical fissure zone. Li et al. (2019) and Wang et al. (2021) analyzed the mechanism of mine pressure manifestation and its mutual influence on surface geological hazards, revealing that the variation of stress in the gully area is among the necessary conditions for the occurrence of working face impact pressure. Wang et al. (2023) analyzed the macroscopic stress propagation path of the mining area through numerical simulation and found that the maximum horizontal stress at the bottom of the analyzed valley is approximately 20 MPa and the maximum tensile stress in the reverse-slope section is approximately 1.5 MPa. Zhang et al. (2011) and Xu et al. (2012) pointed out that the key layer in a valley terrain is an important factor affecting the generation of dynamic mining pressure. When the slope angle is less than 15°, the working face generally does not experience dynamic mining pressure disasters. Li et al. (2020) concluded that the maximum influence range of surface subsidence in a valley mining area increases to a ratio of 3.35 to the goaf area, then decreases and eventually reaches a constant value of 2.1. Mu et al. (2021) and Zhang et al. (2022c) analyzed the deformation and failure characteristics of Loess gully areas under different mining directions and slope angles. When the slope angle exceeds 60°, it is prone to landslides; when the slope angle is less than 30°, a sliding surface is formed on the bedrock surface and develops toward the surface, reducing the possibility of landslides. Ma and Kang (2022) and Miao et al. (2022) used a similar material simulation to analyze the movement characteristics of working faces under different coal mining methods and the evolution of overlying strata fissures under different mining heights. The simulation revealed that the main factor determining the height of the goaf is the mining height, and the evolution process of overlying strata fissures is divided into the rising stage, fluctuation stage, and stable stage. Tan et al. (2022) studied the spatiotemporal evolution law of overlying strata movement caused by high-intensity mining in shallow-buried coal seams in gully areas, and the ratio of permeable fissure zone to mining thickness was found to be 43.75. Wei et al. (2022) simulated and analyzed the macroscopic characteristics and laws of rock mass damage, such as overlying strata failure and fissure development in Loess gully areas, illustrating the cyclic deformation and damage characteristics of overlying strata, including layer detachment, collapse of detached layers, and the formation of high-level detached layers. Starting from the spatial relationship between the working face and the slope in a gully area. Zhang et al. (2023) conducted a systematic analysis of the influences of slope angle, slope height, coal seam mining height, and coal seam burial depth, providing a theoretical basis for disaster prevention and control.
More realistic and reliable conclusions can be obtained through on-site measurement research, however, a lot of human, material, and financial resources need to be integrated, and the observation cycle is lengthy, making it difficult to meet the requirements of economic efficiency (Mondal et al., 2020). Similar theoretical analysis also needs to establish a large number of assumptions and simplify the relevant geological factors. However, it is difficult to make judgments about the dynamic process of change under complex terrain conditions (Rezaei, 2016; Lai et al., 2021; Yan et al., 2022). A similar-material simulation has a short testing period, and the simulation of mining subsidence can be artificially controlled so that complete rock movement and deformation laws can be observed (Wang et al., 2016; Xu et al., 2017b; Zhu et al., 2018; Qin et al., 2021). At the same time, a numerical simulation can help study the surface movement law of the whole basin more comprehensively and accurately, and the influence of complex geological condition factors can be taken into account (Cao et al., 2018; Kong et al., 2019; Liu et al., 2022; Cao et al., 2023). Therefore, the use of a similar-material simulation in conjunction with a numerical simulation can allow for an in-depth study of the rock movement characteristics of the extraction zone, and help obtain the dynamic development law that cannot be obtained through theory and practice.
In previous studies, most two-dimensional similar-material simulations were used to study the local overlying rock damage characteristics, which explains the transport mechanism of the overlying rock layer to a certain extent. However, related research results could not reveal the complete movement and deformation law of the surface under the complex terrain, which has certain limitations. In this paper, we designed a three-dimensional similar-material simulation test to replicate the real surface using topographic contour maps, and at the same time combined it with an FLAC3D numerical simulation to systematically study the stress and displacement characteristics, and surface subsidence laws of the overlying rock of the main coal seam mined in the working face of a mine, aiming to provide theoretical support for the control of the surface subsidence disaster in the mining of shallow-buried thick coal seams in a gully area, the design of safe working face mining, and protection of the ground surfaces. The main contributions of this paper are as follows:
1. A complete set of three-dimensional similar-material simulation test schemes, data acquisition, and processing procedures were designed, which realized the complete simulation of the impact of coal seam mining on the ground surface through the real reproduction of the terrain, and revealed the evolution process of sudden instabilities in a gully area.
2. The combination of three-dimensional similar-material and numerical simulations produced an in-depth analysis of the stress evolution characteristics and surface transport law in a gully area. The simulation results were mutually corroborated, and the combination of the two simulations was an effective method to analyze surface deformation and damage law.
The analyzed mining area is located in the inland arid and semi-arid region of northwest China, and most of the surface is covered by loose sediments of the fourth system, mainly wind-deposited sand. The topography of the mining area is highly undulating, with long gullies and ravines, which is a typical erosive Loess Plateau landform (Figure 1). The coal resources in the well field are endowed with good conditions, simple geological and tectonic conditions, a large proportion of shallow and thin bedrocks in the distribution area, a gentle inclination of coal-bearing strata, and uncomplicated hydrogeological conditions. The overlying rocks of the coal beds in the study area are mainly sandy mudstone, medium- and fine-grained sandstone, and fine sandstone, most belonging to the medium fallout roof, and the bottom plate of the coal seams is a fine-grained sandstone layer with a thickness of more than 4.0 m (Figure 2). The working face adopts one-time full-height mining, a longwall-integrated mechanized coal mining method, and a collapsed method to deal with the mining area. The advance speed is approximately 10 m/d, the high-intensity mining activities make the coal seam mining range expand rapidly, and the overburden and surface activities are intense and result in more dynamic change characteristics.

FIGURE 1. Location map of the study area.
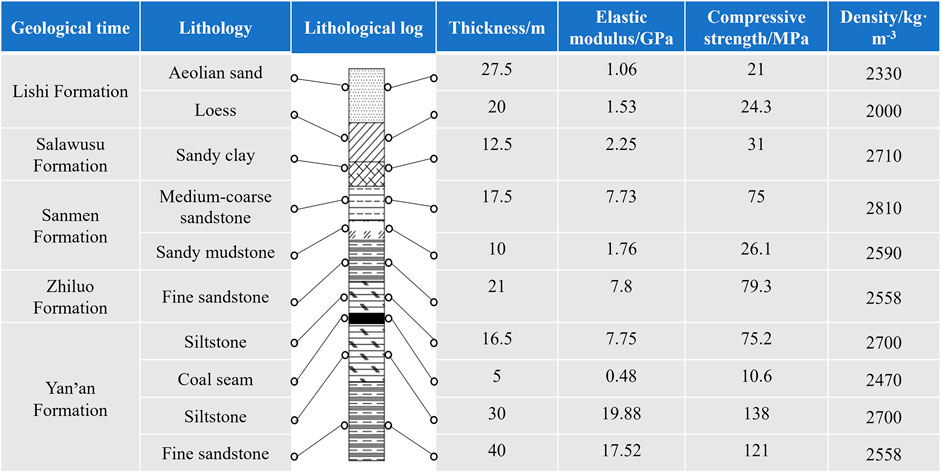
FIGURE 2. Overburden properties and mechanical parameters.
As shown in Figure 3, the two typical working faces in the mine area were the objects of the study. The strike length of both working faces is 350m, and the dip length is 400 m. From the contour distribution of the surface area, it can be seen that working face I is relatively flat, while the surface of working face II is covered by a gully terrain, with a “herringbone” distribution and obvious changes in the elevation values. The overall ground elevation of the study area is 1,114.3–1,148.1 m, the mining depth varies between 1,021 m and 1,030 m, and the average mining thickness is 5.0 m. The topography above the working face II is undulating, and the overall slope is steep, with an average slope of approximately 38°. The maximum difference between the top and the bottom of the slope is approximately 28 m, making it very easy to produce destabilization damage as underground coal mining continues. Test work was carried out for the simulated area shown in the figure.
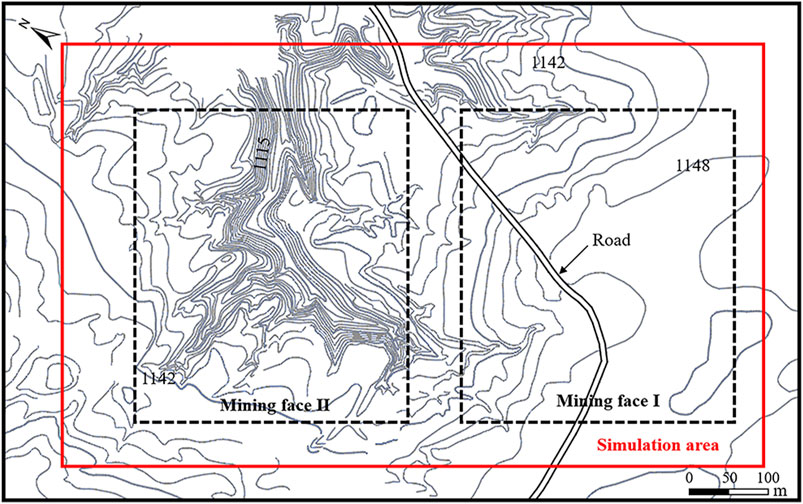
FIGURE 3. Mining area topography.
In this paper, a three-dimensional similar-material simulation device developed by the group was selected. The device consisted of a steel frame, a tempered glass protection plate, and a simulated mining device at the bottom as the main structure, and the lifting and sinking of the coal seam was simulated by adjusting the knob below the device.
The design of the model was combined with the geological fugitive conditions and mining situation of the working face of the mine, taking into account the actual dimensions of the model box. The model size was 2,000 mm×1,200 mm×250 mm (length × width × height), and the similarity constants were determined based on the similarity theorem, as follows:
1) Geometric similarity ratio:
Where
2) Time similarity ratio:
Where
3) Capacity ratio:
Where
4) Stress ratio:
Where
The selection of similar materials needed to meet the following criteria: 1) Some mechanical properties of the material should be similar to rocks. 2) The mechanical performance of the material should be relatively stable during the simulation process. 3) Changing the material composition should result in significant variations in its mechanical properties. 4) The material should be easy to fabricate into models and have a short setting time. 5) The raw materials should be widely available and cost-effective. Based on the relevant geological data of the mining area and the abovementioned requirements, sand was selected as the main material for the simulation test, calcium carbonate and gypsum as the cementing material, crushed mica as the layering material, and borax as the retarder. In order to ensure the physical and mechanical properties of the similar materials to the simulated rock layers, a series of proportioning tests were conducted before fabricating the similar material models to determine the appropriate ratios. At the beginning of the test, the bottom coal pillar was elevated by adjusting the knob to simulate the coal seam (Figure 5A), and then the sand, calcium carbonate, gypsum, water, and borax were mixed according to a certain proportion to simulate the overlying rock layer. Then, mica crumbles were added in between the rock layers to simulate the layering in a better way, and the model was laid with reference to the geological section map of the mine (Figure 5B).
The material used in each layer was calculated using the following equation:
Where
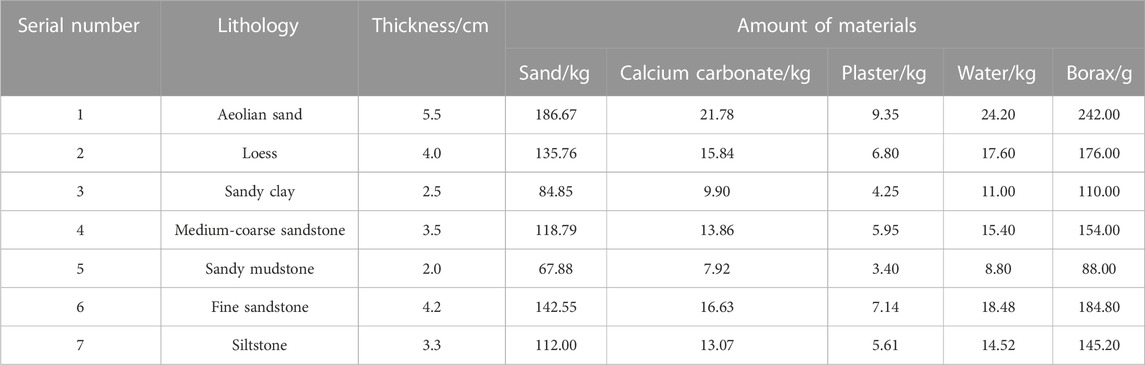
TABLE 1. The amount and ratio of materials for three-dimensional similar material simulation experiments.
The model surface was replicated based on the contour lines of the mining area’s surface topography, following these steps: 1) Print the contour map of the valley region’s topography, ensuring that the scale matches that of the three-dimensional similar-material model surface. 2) Place the printed contour map on the model surface and use pushpins to mark the key locations along the contour lines, piercing through the paper. 3) Use a ruler to connect the marked points in a sequential manner, outlining the topographic features on the model surface. The flowchart for this process is shown in Figure 4. The interlacing distribution of the gully topography and the road was well represented in the model (Figure 5C). Then, a layer of calcium carbonate powder was evenly sprinkled on the surface of the model. Finally, coded and non-coded points were laid on the surface of the model and around the device (Figure 5D), which were used for coordinate conversion and deformation analysis at the later stage, and the laying of the test model was completed at this point.
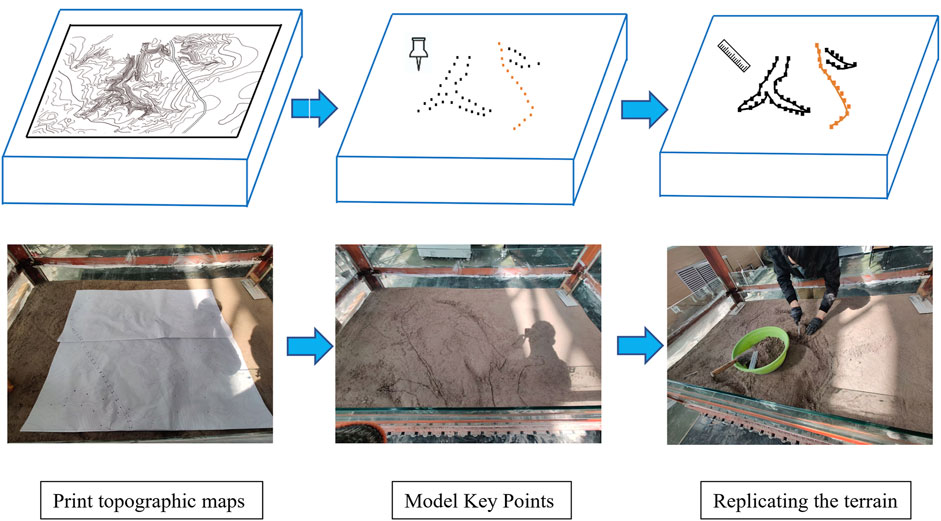
FIGURE 4. Replicating the terrain process.
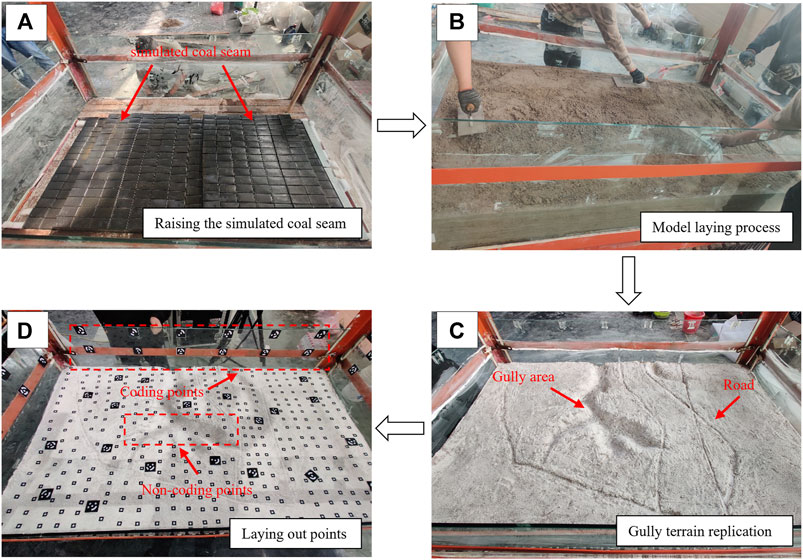
FIGURE 5. Model building process, (A) raising the bottom of the device to simulate coal seams, (B) laying simulated rock layers, (C) replicating real topography, (D) laying coded and non-coded points.
The mining process was simulated by adjusting the knob at the bottom of the device to make the coal seam sink, and the model was mined every 5 h, advancing 10 cm each time, mining working face I first and then working face II, divided into a total of 14 mining stages. The longer and the shorter sides of the device were aligned with the strike and the tendency of the coal seam. As shown in Figure 6, the deformation damage of the ground surface during coal seam mining was continuously observed using a 3D optical photogrammetry system and a non-contact 3D optical surface scanning system, with the 3D optical photogrammetry system observing every 10 cm of advancement and the 3D optical surface scanning system observing every 30 cm of advancement; a total of 2,514 photographs, as well as 6 periods of point cloud data were obtained. Each phase of the point cloud data contained approximately 28 million points, and the average point spacing was concentrated at about 0.5 mm. The point observation accuracy of the 3D optical photogrammetry system was up to 0.064 mm, and that of the 3D optical surface scanning system was up to 0.05 mm, which was at a sub-millimeter level and met the test requirements.
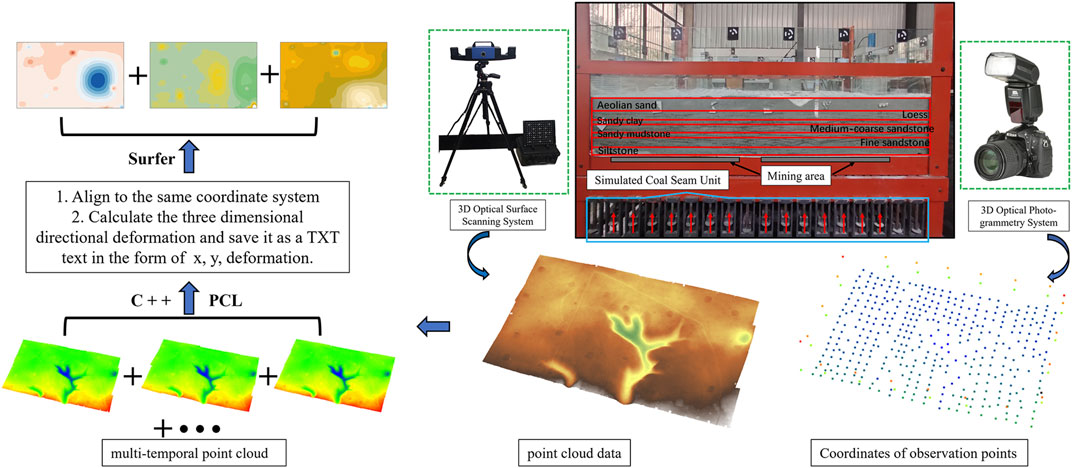
FIGURE 6. Data acquisition and analysis process.
The collected point cloud data were within different local coordinate systems. We selected three or more pairs of corresponding points from the 3D optical photogrammetry system global point coordinates obtained through calculations to calculate the rotation and translation matrix. This matrix was then applied to the point cloud data to achieve a unified coordinate reference system. On this basis, three-dimensional deformation quantities were calculated and output in the form of a TXT file. These data were imported into Surfer software to generate displacement contour maps. The workflow for generating contour maps from point clouds is shown in Figure 6.
In order to study the moving and deformation law of the mine in three-dimensional space more deeply, FLAC3D (Fast Lagrangian Analysis of Continua) software was used to simulate and analyze the shallow-buried coal seam mining in the gully area. The similarity ratio between the numerical model and the prototype of the mining area was 1:1, and the model was built according to the actual situation in the study area, where the rock dip was small and close to horizontal, so the model stratum was set to be horizontal. Figure 7 shows the model-building process, which was pre-processed and model-layered using Rhinoceros software, and then imported into FLAC3D. We excluded the parts of the model reconstruction that resulted in distorted effects due to missing contour lines. The model region included two complete working faces. The final model dimensions were 930m × 465m × 197 m (length × width × height), with a tetrahedral mesh type consisting of 142,920 grid points and 798,446 cells. The simulated coal seam depth was 127m, with a mining thickness of 5 m. According to the stratigraphy revealed by the geological section map of the mining area, and by synthesizing the parameters of the physical and mechanical indexes of the rock materials, the numerical model strata in the study area were divided into 10 rock groups according to lithological properties and completeness. The distribution of the numerical model stratigraphy and the main mechanical parameters are shown in Table 2.
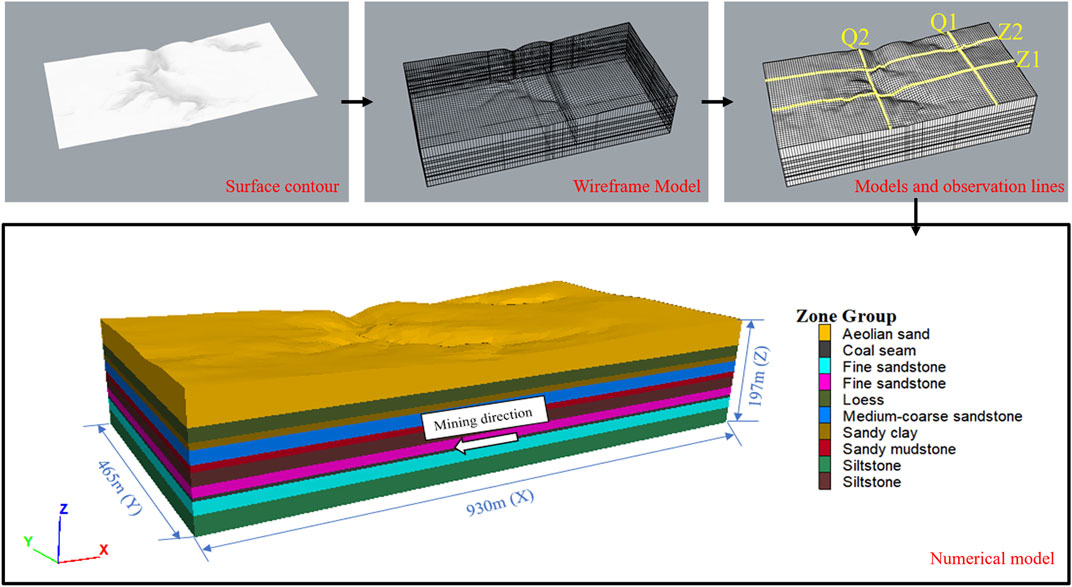
FIGURE 7. Numerical model building process.
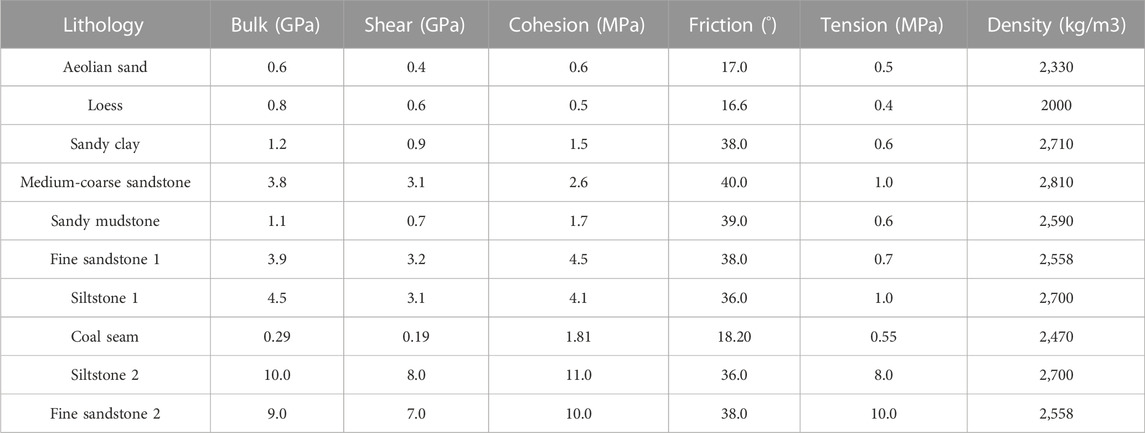
TABLE 2. Rock formation physical and mechanical parameters.
The model had fixed boundaries at the bottom and all around, and free boundaries at the top. The initial ground stress was dominated by self-gravity stress, and the gravitational acceleration was set to 9.8 m/s2. Static equilibrium calculation was performed before mining. The calculation was conducted using the Mohr-Coulomb constitutive model under large deformation stress mode. The simulation process adopted distributed excavation, consistent with the three-dimensional similar-material simulation experiment. It was divided into 14 different mining stages, with a coal pillar of 50 m left between the two working faces. The solid elements corresponding to each stage were transformed into empty elements to simulate the extraction of the coal seam.
The test results show that there was no significant change in the surface of the model at the early stage of the mining of working face I. As shown in Figure 8A, when working face I was mined to 30 cm, the surface of the model edge produced tensile cracks, which extended about 10 cm along the direction of the working face advancement and developed only on the south side of the model (the south side was nearer to the air-mining area). At the same time, due to the influence of mining, the road on the surface of the model developed radiating cracks along the edge of the road with lengths ranging from 0.6 to 3 cm, and the development was especially intense where there was a bend in the road. When mining continued to 50 cm, the length of the surface edge fissure extended to 24 cm, the width increased slightly, and four scattered development fissures were formed at the convergence of the three roads (Figure 8B); the longest length extended to 2.2 cm. When the working face was advanced to 60 cm, the fissures at the convergence of the three roads continued to develop, and the extension length reached 4.1 cm; the edge fissures were not only confined to the roadsides but also generated fissures in the road surface (Figure 8C). When advanced to 70 cm, the mining of working face I ended, and there was a tendency to widen the model edge fissures, which extended to about 7 cm (Figure 8D).
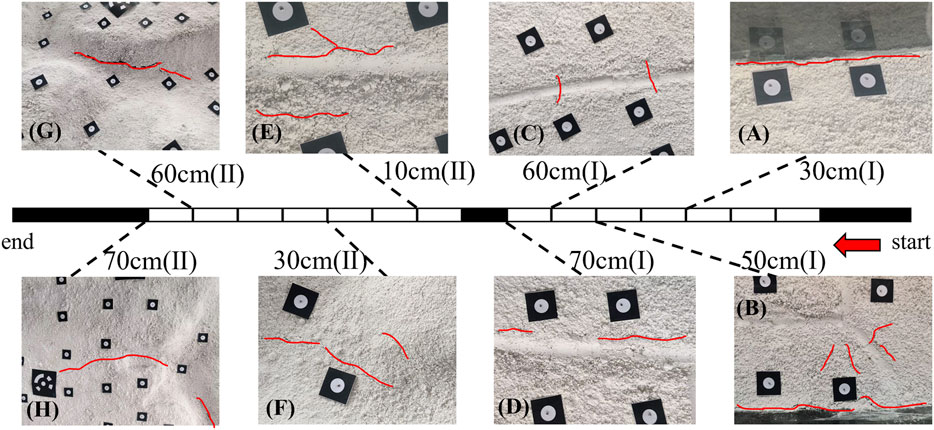
FIGURE 8. Fracture development process, (A) model edge crack, (B) quadratic development fractures, (C) pavement through fractures, (D) road edge fractures, (E) road edge fractures, (F) gully bottom fractures, (G) side slope cracking, (H) gully location extension fractures.
After the model was rested for 5 h, the mining of working face II was carried out, and the gully terrain was densely distributed in this area. At the initial stage of mining, the surface directly above the area of coal pillars left between the working faces produced tensile cracks that developed along the edge of the road with a length of approximately 3.5 cm due to the influence of mining on both sides (Figure 8E). When working face II advanced to 30 cm, the gully area produced tiny cracks at the bottom of the gully, extending about 1 cm or so along the gully trend (Figure 8F). Until the working face II was mined to 60 cm, the surface gully area underwent drastic changes. The fissure was generated from the middle of the critical surface of the slope body, resulting in the cracking of the slope, and the development was extremely rapid, increasing from 3.2 cm to 12 cm within a short period of time, with a tendency to extend and develop to both sides and gradually approach the bottom of the gully (Figure 8G). The width of the fissure in the initially developed position during the extension process increased significantly to approximately 0.5 cm. During the advancement interval, the fissure slowly developed to 17 cm, extended north to the bottom area of the ditch at the boundary of the extraction zone, and then developed to the west along the gully for approximately 3 cm. The mining continued to 70 cm, and the fissure continued to develop upwards along the gully to the surface, with a length of approximately 11 cm (Figure 8H); the other side of the fissure continued to extend and develop along the gully topography to the south. The fissure had a total length of up to 35 cm, which basically penetrates through the entire gully area. Figure 9 showed the model surface fractures at the end of the mining.
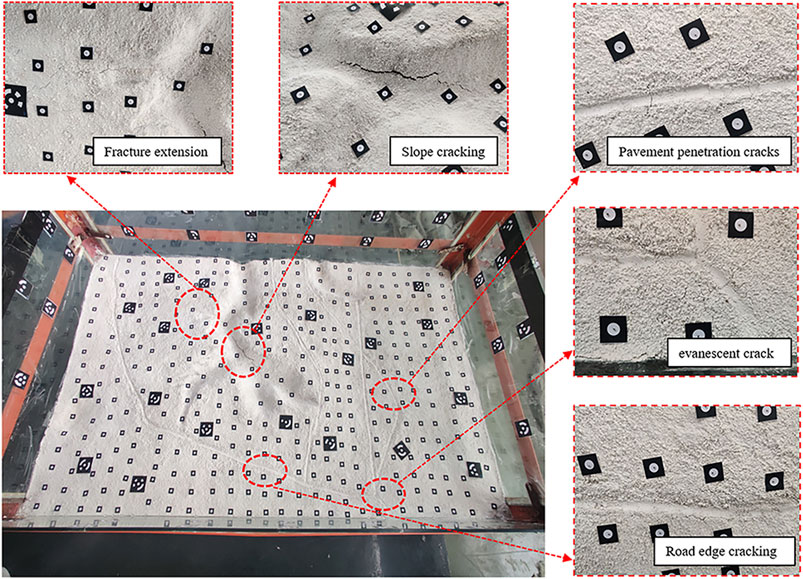
FIGURE 9. Model surface fractures.
The mining of the coal seams will inevitably cause movement and destruction of the overlying rock layers, resulting in subsidence and horizontal movement of the ground surface. During the mining process of working face I, with the continuous advancement of the working face, the amount of surface subsidence continued to increase, and the scope of subsidence continued to expand. After the end of the mining of working face I, the maximum subsidence value of the surface reached 3.42 mm, and the surface movement basin was located directly above the mining area. The subsidence contour was approximately distributed in an ellipse shape, and the subsidence value gradually decreased from the center of the basin to the edge of the basin (Figure 10C). At the same time, the horizontal movement direction of each point in the surface movement basin pointed to the center of the basin, and there were two horizontal movement extremes with opposite directions, forming two horizontal movement centers symmetrically distributed at the central axis of the mining area. The positive and negative horizontal displacement extremes of the surface strike (Figure 11C) were +1.1 mm (at 60 cm advance) and −0.9 mm (at 20 cm advance), respectively, and the positive and negative horizontal displacement extremes of the inclination (Figure 12C) were, respectively, +1.3 mm and −0.9 mm (both located at 40 cm advance).
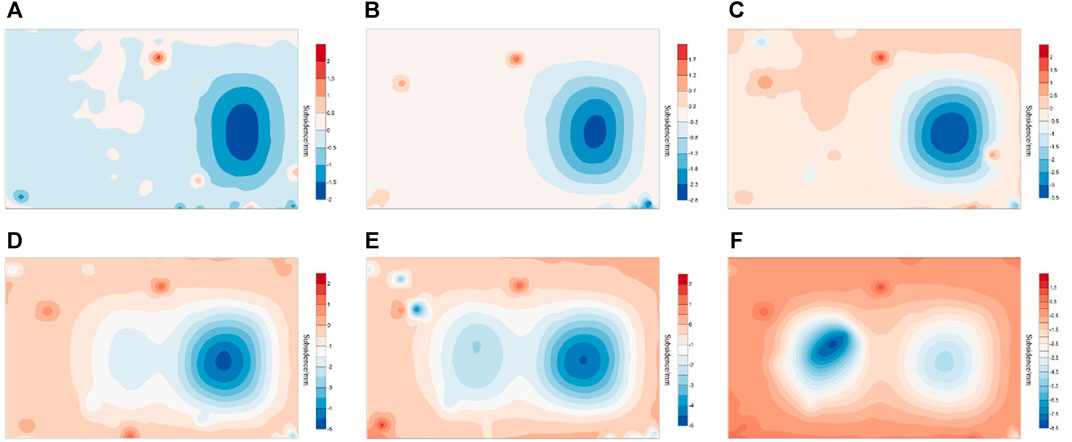
FIGURE 10. Contour maps of model surface subsidence, (A) coal mining face I advance 200 m, (B) coal mining face I advance 250 m, (C) coal mining face I advance 350 m, (D) coal mining face II advance 200 m, (E) coal mining face II advance 250 m, (F) coal mining face II advance 350 m.
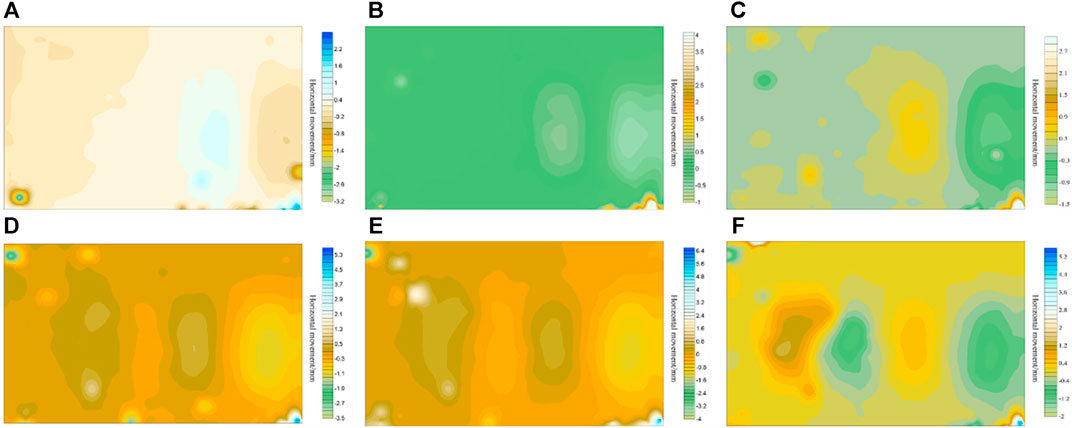
FIGURE 11. Contour maps of model horizontal displacement of the surface strike, (A) coal mining face I advance 200 m, (B) coal mining face I advance 250 m, (C) coal mining face I advance 350 m, (D) coal mining face II advance 200 m, (E) coal mining face II advance 250 m, (F) coal mining face II advance 350 m.
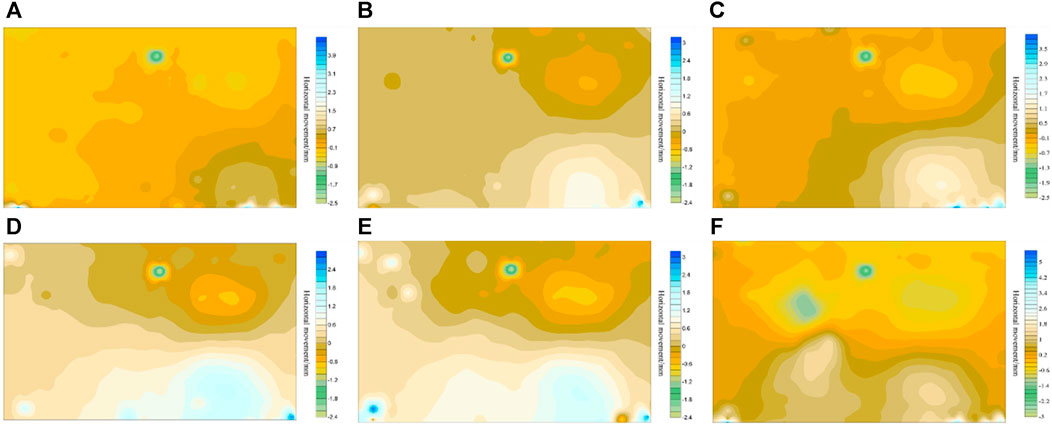
FIGURE 12. Contour maps of model horizontal displacement of the surface tendency, (A) coal mining face I advance 200 m, (B) coal mining face I advance 250 m, (C) coal mining face I advance 350 m, (D) coal mining face II advance 200 m, (E) coal mining face II advance 250 m, (F) coal mining face II advance 350 m.
During the mining process of working face II, the boundary of the subsidence basin expanded continuously based on mining in working face I, and a second surface moving basin appeared. When advancing to 70 cm, the surface moving deformation was intense, and the maximum subsidence of the surface increased from 2.8 mm to 8.3 mm, accompanied by the cracking of the surface slope. The fissure of the slope surface developed rapidly and the center of the mining area showed obvious “deviation” characteristics not directly above the mining area. The center of the mining zone showed obvious “eccentric” characteristics, favoring the north side of the gully area, which was not directly above the mining zone, and the subsidence contour was not an elliptical curve with regular spacing but was densely distributed in the gully area (Figure 10F). Compared with this, the subsidence in the plain area above working face I was slow, and the maximum subsidence was only 5.1 mm, due to the lower topography of the gully area. The underground mining impacts were transmitted to the surface more quickly than in the plain area, and the gully area comprises complicated topography, which makes it easier for violent movement and deformation of the slope in the loose layer to occur.
After the end of working face II mining, the positive and negative dividing lines of the horizontal displacement of the surface above were no longer located in the central axis of the mining area but were offset by the influence of the topography of the gully and distributed along the topographic trend. The horizontal displacement centers were all located in the position of the slope body in the gully area, showing a trend of offset to the gully area. The positive and negative horizontal displacement extremes of the surface strike (Figure 11F) were +2.3 mm (at 60 cm advance) and −1.8 mm (at 20 cm advance), respectively, and the positive and negative horizontal displacement extremes of the inclination (Figure 12F) were, respectively, +2.1 mm and −2.8 mm (both located at 40 cm advance). Compared with the mining of working face I, the horizontal movement of the surface increased significantly and concentrated in the distribution area of the gully topography, indicating that in the process of transferring the influence of coal seam mining to the surface, the greater the surface elevation, the smaller the influence of mining on it, and the surface was easy to slip as the area for the slope gradient was larger, making it easy to produce destabilization damage, which was confirmed by the simulation process in the formation of tensional fissures in the side slopes and the rapid development of the fissures.
An analysis of the stress field in the surface area during coal seam mining revealed the evolution of surface stresses up to a specific stage, as shown in Figure 13. In the early stages of coal seam mining, the original rock stress changed, leading to the collapse and failure of the overlying strata in the goaf, which affected the surface. This resulted in a concentrated area of compressive stress above the goaf on the surface (Figure 13A), with a maximum compressive stress of 0.4 MPa. At the same time, the presence of the gully area also influenced the distribution of original rock stress, causing a concentrated area of compressive stress in the gully area, despite it not being directly affected by the mining activities at the initial stages. As the working face advanced and coal continued to be extracted, the stress concentration in the gully area gradually diminished, and the surface stress distribution became concentrated above the goaf, reaching up to 2 MPa (Figure 13B). With the continued mining, the volume of the goaf increased, leading to stress release in the surrounding rock and its transmission to the surface area. The area of surface stress variation expanded as coal seam mining continued, and was roughly similar to the movement basin of the surface. The stress values gradually increased from the edges to the center of the basin, mainly in the form of compressive stress, with the maximum value occurring at the center of the basin, at approximately 3 MPa (Figure 13C). During this stage, the terrain was relatively flat, and the overall distribution of surface stress exhibited a concentric circular pattern.
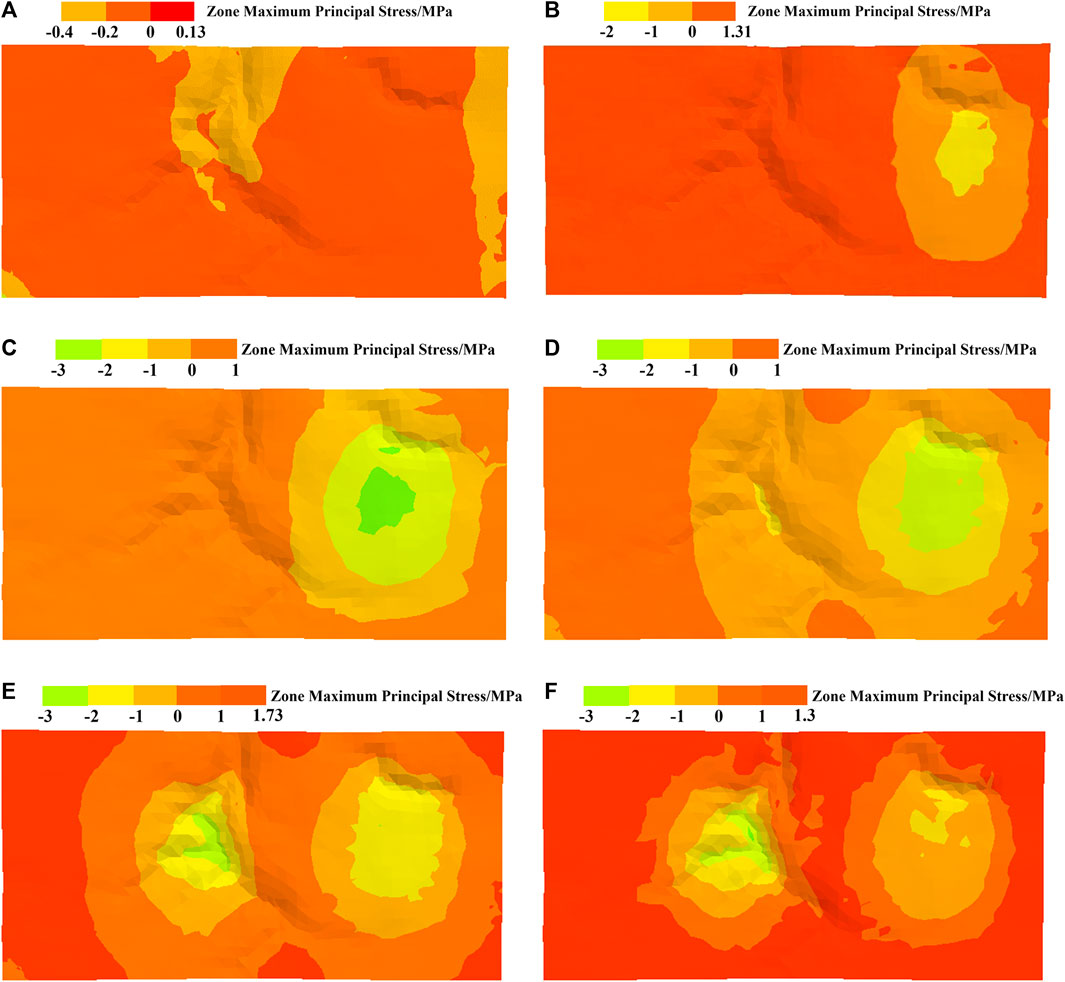
FIGURE 13. Stress field evolution under different mining progress, (A) coal mining face I advance 100 m, (B) coal mining face I advance 250 m, (C) coal mining face I advance 350 m, (D) coal mining face II advance 100 m, (E) coal mining face II advance 250 m, (F) coal mining face II advance 350 m.
Continuing to simulate the mining process of working face II, when working face II advanced to 100 m (Figure 13D), compressive stresses were concentrated in the gully area above the mining area, and the concentration increased in the gully bottom area, with a maximum value of approximately 3 MPa. When working face II continued to advance to 200 m and 350 m (Figures 13E,F), with the further expansion of the coal seam mining area, the surface stress value increased continuously, and the stress concentration in the gully area, especially in the bottom of the trench, was the greatest. In contrast to the surface compressive stress above the relatively flat working face I, which was fairly stabilized at around 3 MPa, the maximum compressive stress at the bottom of the trench could be up to 5 MPa once the mining of working face II finished. In the process of stress field change, it could be seen that the tensile stress area gradually expanded, and the compressive stress boundary showed a contraction trend. When the ultimate strength of the geotechnical body was exceeded under the joint action of tensile and compressive stresses, the rock body in the stress superposition area was more prone to instability damage.
The displacement field changes at each stage of the coal seam mining process are shown in Figure 14. In the early stage of coal seam mining (Figure 14A), the mining out of the ore body caused the deformation and destruction of the overlying rock layer, which made the roof rock overhang and collapse. The overlying rock far from the mining hollow area was less affected by mining, and the surface subsidence deformation gradually developed. With the advancement of the mining area, the displacement amount increased continuously, and the influence of mining was transferred to the surface and formed a subsidence basin (Figure 14B). The maximum displacement amount of the roof plate in the mining area was 0.81 m, the influence area was directly above the mining area, and the maximum value of surface subsidence was approximately 0.65 m. After the mining of working face I was finished (Figure 14C), the area of surface movement and deformation continued to expand, the maximum displacement of the roof plate in the mining area was 2.01 m, the maximum subsidence value of the surface was 1.8 m, and the subsidence basin contours were distributed in concentric circles, so the subsidence value decreased from the center to the edge of the basin.
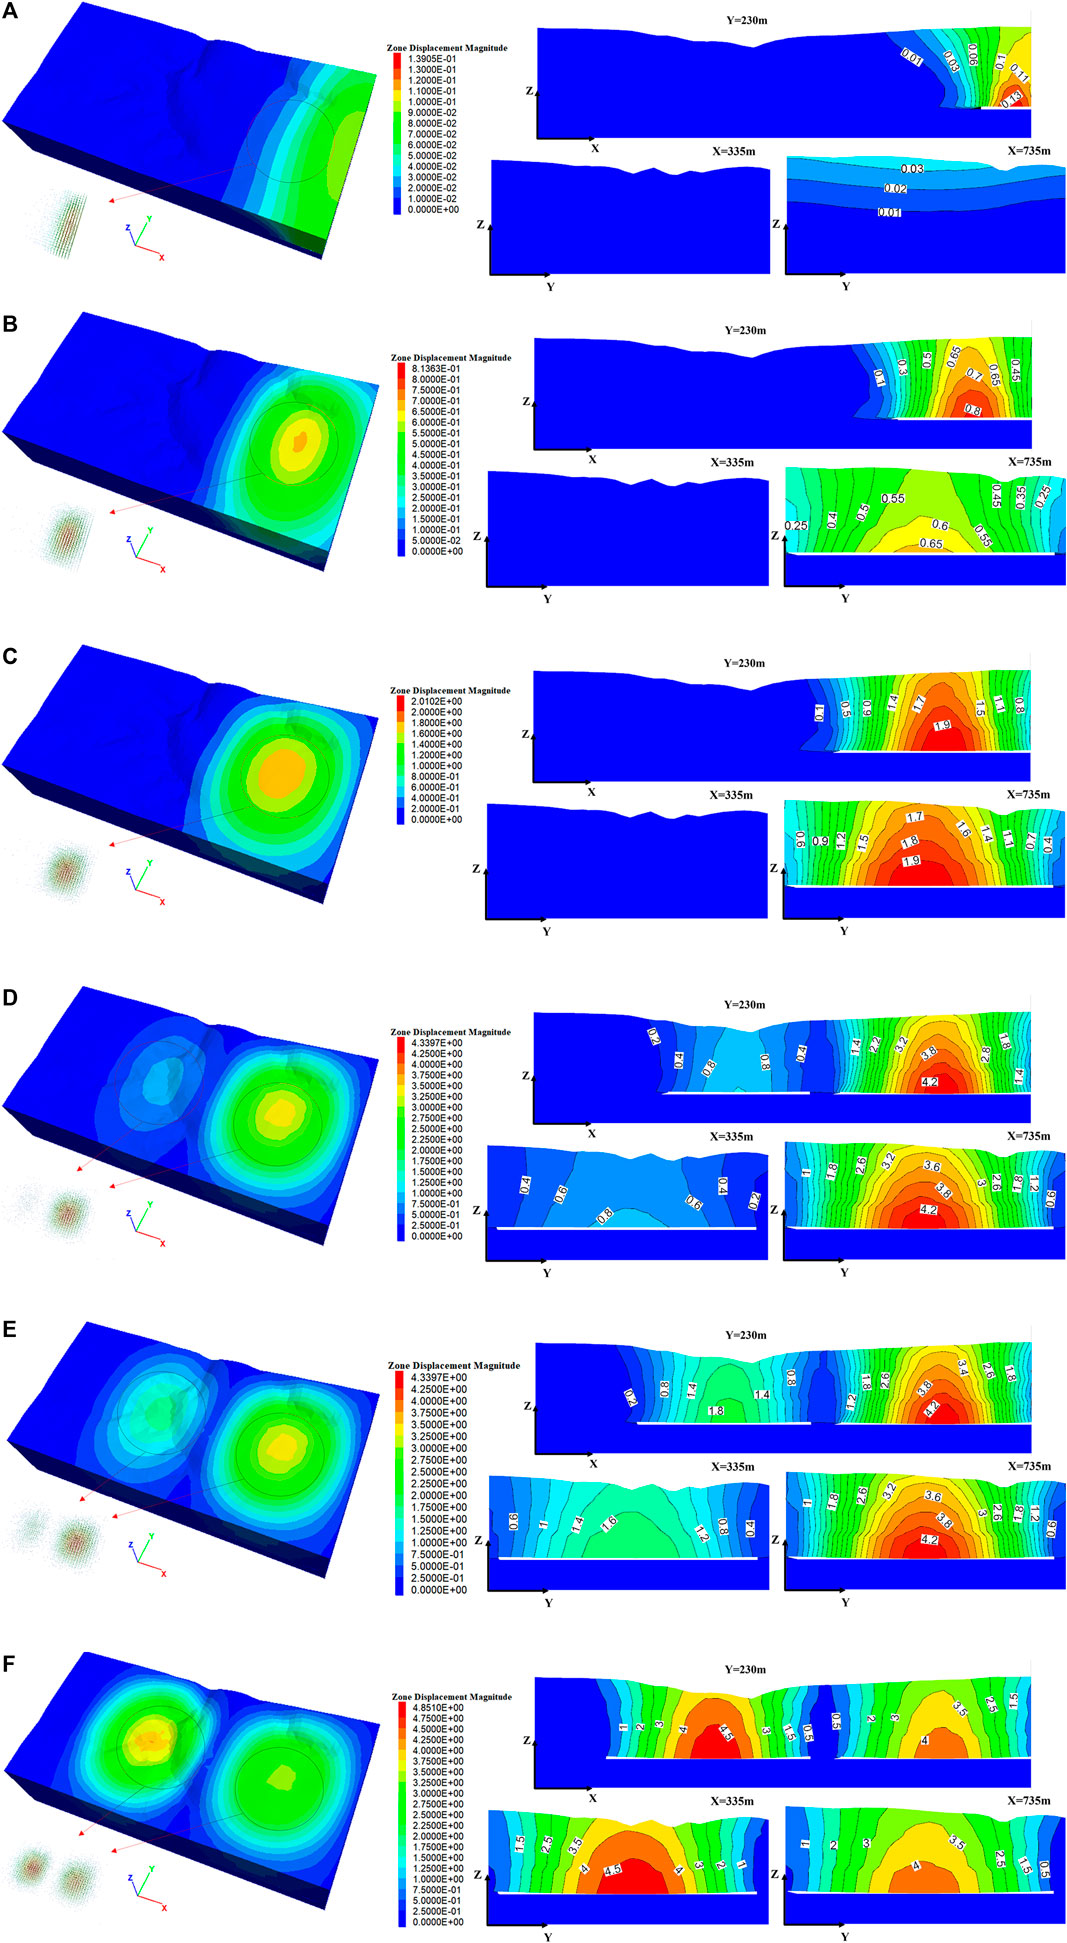
FIGURE 14. (Continued).
When workface II was advanced to 150 m (Figure 14D), the peak displacement of the top plate was 1.25 m, and the maximum settlement of the surface was approximately 0.75 m. On the other hand, the surface of workface I continued to sink and deform, and the maximum settlement reached 3.5 m; the peak displacement of the top plate was 4.34 m. As workface II continued to advance to 300 m (Figure 14E), the peak displacement of the top plate reached 2.5 m, the maximum surface settlement was approximately 1.75 m, and the overburden displacement around the mining area was the largest. The further away from the mining area was, the smaller the displacement. However, there was no significant change in the surface of working face I; the settlement basically tended to stabilize. At the last mining stage, working face II advanced to 350 m (Figure 14F), the overlying rock layer in the mining area moved and deformed sharply, the peak displacement of the top plate increased from 2.5 m to 4.85 m, and the amount of surface settlement also increased from 1.75 m to 4.25 m. Combined with the stress field analysis at the early stage and the displacement vector diagram at the current stage, it can be seen that under the current mining process, the settlement rate of the slope in the gully area under the superposition of tensile and compressive stress, the slope body did not collapse immediately after mining but entered the energy accumulation state first in the mining process, and when the bearing limit of the slope body was exceeded, it was suddenly released, and the stress equilibrium of the surface slope body was broken, resulting in the violent deformation and damage of the slope.
The surface deformation characteristics of the trench area under the shallow buried coal seam mining were obtained by combining the observations of the three-dimensional similar-material and numerical simulations. The locations of the two tendency lines Q1 and Q2, and the two strike lines, Z1 and Z2, were the same in the three-dimensional similar-material simulation test and numerical simulation, both of which were located on the model surface. From Figure 15A, it can be seen that the numerical simulation results were consistent with the three-dimensional similar-material simulation results, and the trends of the sinking curve, the value of the maximum sinking amount, and the location of the occurrence were all relatively consistent. The sinking curve showed an “inverted peak type”, and the value of surface subsidence gradually increased from the edge of the mining area to the middle of the mining area and reached the peak at the center of the mining area, causing an increase in the gully. This increase was more obvious in the gully area, and the overall amount of surface subsidence in the gully area was larger than that in the plain area. The observation results of the inclination line also confirm that after mining, the surface subsidence influence range of the two working faces was approximately the same (Figure 15B), and the maximum subsidence value was 3.76 m (7.65 mm for similar material simulation) in the gully area and 3.2 m (6.45 mm for similar material simulation) in the plain area, both located in the center above the extraction area.
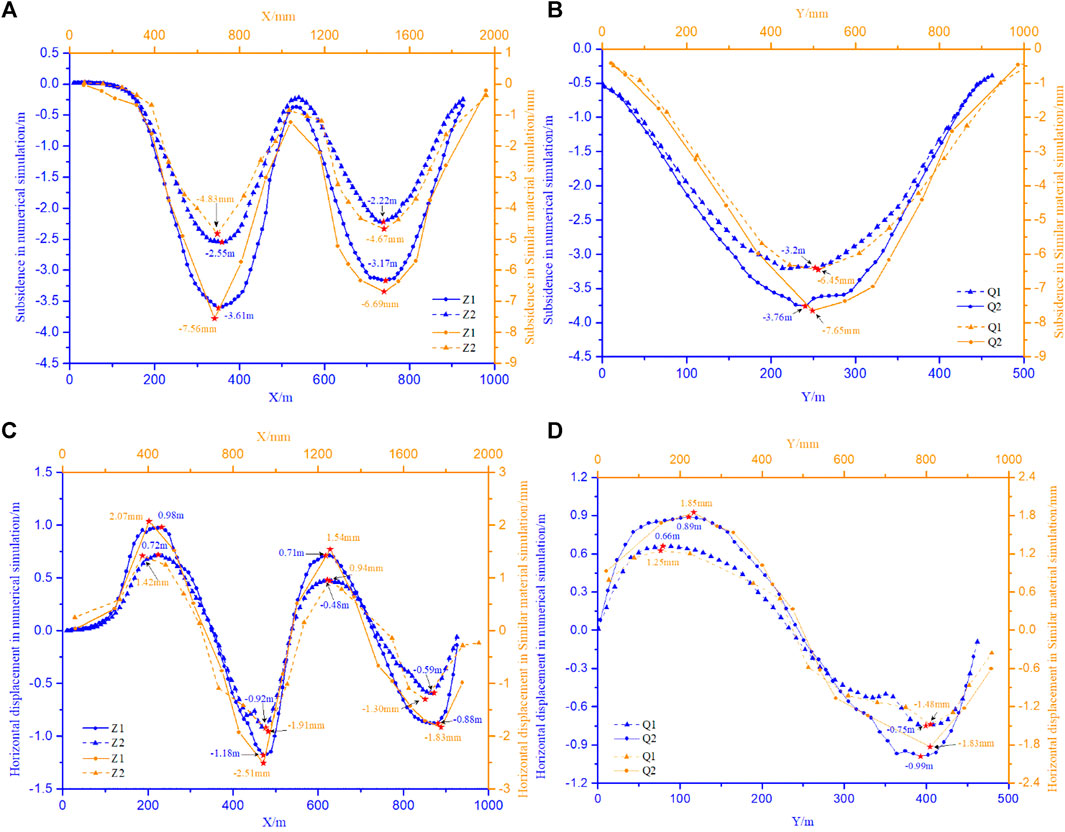
FIGURE 15. Monitoring data in the three-dimensional similar material simulation and numerical simulation, (A) directional subsidence, (B) tendency subsidence, (C) directional horizontal displacement, (D) tendency horizontal displacement.
After mining the underground workings in the gully area, the horizontal displacements in the surface area all pointed to the center of the extraction zone, and there were two positive and negative horizontal displacement extremes on the surface above the extraction zone. The monitoring data of the strike and tendency observation lines showed that the horizontal displacement from the boundary of the extraction zone to the center of the extraction zone increased and then decreased, and the horizontal displacement was zero at the maximum subsidence point (Figures 15C,D). The horizontal displacement in the gully area was larger than that in the plain area, and the slopes within the influence area were more prone to landslides and other geologic hazards under the dual effects of the topographic factors of the gully and the mining hollow area. At the same time, the monitoring results of the three-dimensional similar-material and numerical simulations were consistent, and the combination of the two was an effective method to analyze the surface deformation and damage law.
In the three-dimensional similar-material simulation test, the damage process was evaluated by monitoring the displacement change in the ground surface. Then we used numerical simulation to analyze the stress change characteristics of the model surface. The monitoring data of the strike line in Figure 16A showed that the mining of coal seams affected the stress distribution in the surface area, and the stress value showed a trend of gradual increase from the boundary of the mining area to the center of the mining area. The stress in the gully area was significantly changed by the influence of topography, and the stress value was up to 6.88 MPa. The drastic increase in the stress value in the gully area reflects the formation of subsidence tensile cracks, also corroborated by the monitoring data of the tendency line in Figure 16B. The Q2 monitoring line was located at the surface of the gully area, and its stress value also showed significant changes; it was up to 4.48 MPa. The steep increase in the stress value indicates that the slope was under compression and shear damage, which produced instability and slip.
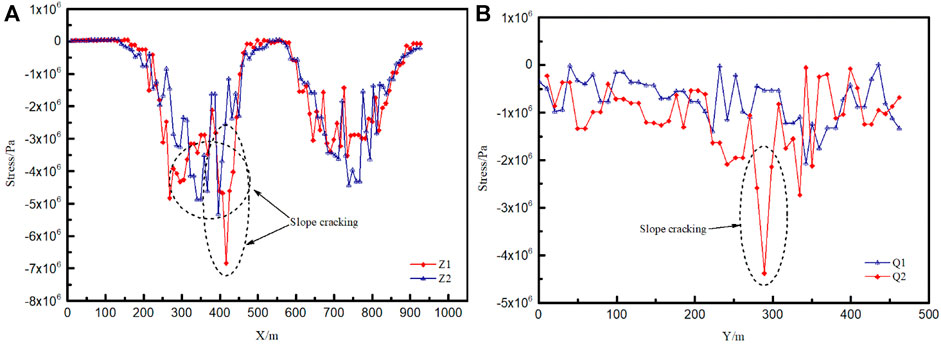
FIGURE 16. Stress monitoring data in the numerical simulation, (A) strike stress variation, (B) tendency stress variation.
This study focused on shallow-buried coal seam mining in a gully area and presents a comprehensive study that includes the design and implementation of a three-dimensional similar-material simulation test. The primary objective was to understand the macro-scale change patterns of the surface in the mining area. The test platform provided the necessary conditions for a global analysis of surface deformation and damage. Additionally, effective solutions were proposed for model observation, data processing, and analysis. To monitor the model, a combination of a 3D optical photogrammetry system and a non-contact 3D optical surface scanning system were employed. This approach integrated digital close-up photogrammetry and structural grating spatial coding measurement, offering the advantages of both efficient photogrammetry and accurate grating measurement. The combination of these two methods met the requirement for continuous observation during the model test, improving observation efficiency. This approach allowed for the quick and accurate acquisition of surface deformation information and the reproduction of the three-dimensional characteristics of the model surface.
In the three-dimensional similar-material model test, the actual size of the model frame was taken into consideration, leading to a similarity ratio of 1:500 to accurately replicate the real terrain. This allowed for the investigation of the surface movement and deformation patterns on a global scale. However, due to the size limitations of the simulated coal seam unit, the simulated mining speed exceeded the actual speed. It is important to note that the focus of this paper is on a comprehensive analysis of the surface movement and deformation patterns rather than individual mining sessions. Consequently, the mining progress was reclassified to ensure ease of test operability and data collection. In future studies, appropriate improvements in the device should be considered to achieve better simulation results.
In this paper, taking the shallow-buried coal seam mining in the gully area of a mining area as the engineering background, three-dimensional similar material simulation experiments and numerical simulations were designed and implemented to study the surface fissure development and expansion process in detail, as well as the damage characteristics of the slopes in the process of coal seam mining. The main conclusions are as follows:
(1) The three-dimensional similar-material simulation revealed the evolution of sudden instability in the gully area. When coal-mining to a certain stage, the gully area sloped from the central part of the critical surface to produce tensile damage, the fissure suddenly appeared and rapidly developed, and the gully topographic trend extended to the boundary of the mining area. Coupled with the overlying rock transport effect of the mining area, the damage range was rapidly expanding and was very prone to large-scale landslides destabilizing damage and affecting the ground surface ecological environment.
(2) The numerical simulation showed the stress propagation process of shallow-buried coal seam mining in a gully area. The existence of gully topography affects the stress distribution of the original rock, making the gully area a stress-concentration phenomenon. During the advancement of the working face, the surface compressive stress boundaries showed a contraction trend, the bottom of the gully increased the degree of concentration of stress, and the tensile and compressive stresses worked together to cause shear damage, resulting in slope destabilization or collapse of the bottom of the slope.
(3) The gully area was subject to the double influence of the mining area and the spatial location of the slope body, and the surface movement change was more intense. Ahead of the plain area, the displacement contour map showed a trend of offset to the gully topography. Under high-intensity mining activities, the slope body in the gully area became a potential damage area.
(4) The evolution of the slope in the gully area had a staged character; this was not collapsed due to mining but was caused by the mining effect of energy accumulation and sudden release. The continuous extraction of coal seams exacerbates the deformation damage of the overlying rock, changes the physical and mechanical properties of the geotechnical body, and reduces the stability and strength of the slope. When the slope reaches critical instability, the displacement of the slope will increase drastically, and the destruction of the surface will gradually occur through the final triggering of the destabilization of the damage.
The original contributions presented in the study are included in the article/Supplementary Material, further inquiries can be directed to the corresponding author.
XW: Conceptualization, Methodology, Software, Validation, Investigation, Data curation, Writing–original draft, Visualization. LC: Conceptualization, Methodology, Software, Validation, Investigation, Resources, Data curation, Writing–review and editing, Supervision, Project administration, Funding acquisition. BZ: Investigation, Data curation, Writing–review and editing. JW: Investigation, Data curation, Writing–review and editing. QZ: Investigation, Data curation, Writing–review and editing. ZC: Investigation, Data curation, Writing–review and editing.
The authors declare financial support was received for the research, authorship, and/or publication of this article. This research was supported by the National Natural Science Foundation of China (grant Number 41701597) and the China Postdoctoral Science Foundation (grant Number 2018M642746).
The authors declare that the research was conducted in the absence of any commercial or financial relationships that could be construed as a potential conflict of interest.
All claims expressed in this article are solely those of the authors and do not necessarily represent those of their affiliated organizations, or those of the publisher, the editors and the reviewers. Any product that may be evaluated in this article, or claim that may be made by its manufacturer, is not guaranteed or endorsed by the publisher.
Cao, M. H., Wang, T. X., and Li, K. S. (2023). A numerical analysis of coal burst potential after the release of the fault-slip energy. Rock. Mech. Rock. Eng. 56, 3317–3337. doi:10.1007/s00603-023-03224-3
Cao, W. Z., Shi, J. Q., Si, G. Y., Durucan, S., and Korre, A. (2018). Numerical modelling of microseismicity associated with longwall coal mining. Int. J. Coal. Geol. 193, 30–45. doi:10.1016/j.coal.2018.04.010
Costea, M. (2018). Impact of floodplain gravel mining on landforms and processes: a study case in Orlat gravel pit (Romania). Environ. Earth. Sci. 77, 119–133. doi:10.1007/s12665-018-7320-y
Cui, X. M., Gao, Y. G., and Yuan, D. B. (2014). Sudden surface collapse disasters caused by shallow partial mining in Datong coalfield, China. Nat. Hazards. 74, 911–929. doi:10.1007/s11069-014-1221-5
Das, P., and Mohanty, P. R. (2016). Resistivity imaging technique to delineate shallow subsurface cavities associated with old coal working: a numerical study. Environ. Earth. Sci. 75, 661–673. doi:10.1007/s12665-016-5404-0
Kong, D. Z., Cheng, Z. B., and Zheng, S. S. (2019). Study on the failure mechanism and stability control measures in a large-cutting-height coal mining face with a deep-buried seam. B. Eng. Geol. Environ. 78, 6143–6157. doi:10.1007/s10064-019-01523-0
Lai, X. P., Liu, B. W., Shan, P. F., Cui, F., Zhang, Y., Zhang, X. D., et al. (2021). Study on the prediction of the height of two zones in the overlying strata under a strong shock. Geofluids 2021, 1–14. doi:10.1155/2021/4237061
Li, G., Wan, Y., Guo, J., Ma, F. S., Zhao, H. J., and Li, Z. Q. (2022a). A case study on ground subsidence and backfill deformation induced by multi-stage filling mining in a steeply inclined ore body. Remote Sens. 14, 4555–4569. doi:10.3390/rs14184555
Li, J. W., Guo, X. W., Wu, X. Y., Chen, S. J., and Zhang, N. B. (2022b). Fractal characteristics of overburden fissures in shallow thick coal seam mining in loess gully areas. PLoS ONE 17, e0274209. doi:10.1371/journal.pone.0274209
Li, J. W., Li, X. T., Liu, C. Y., and Wu, X. Y. (2020). Dynamic changes in surface damage induced by high-intensity mining of shallow, thick coal seams in gully areas. Adv. Civ. Eng. 2020, 1–16. doi:10.1155/2020/5151246
Li, J. W., Liu, C. Y., Wang, W. C., and Wang, C. Y. (2019). Linkage-induced mechanism and control technology of pressure bump and surface geological damage in shallow coal seam mining of gully area. Arab. J. Geosci. 12, 349–359. doi:10.1007/s12517-019-4511-0
Liu, C., Li, H. M., and Mitri, H. (2018). Effect of strata conditions on shield pressure and surface subsidence at a longwall top coal caving working face. Rock. Mech. Rock. Eng. 52, 1523–1537. doi:10.1007/s00603-018-1601-3
Liu, G. C., Zou, Y. F., Zhang, W. Z., and Chen, J. J. (2022). Characteristics of overburden and ground failure in mining of shallow buried thick coal seams under thick aeolian sand. Sustainability 14, 4028–4044. doi:10.3390/su14074028
Ma, S. J., and Kang, Y. M. (2022). Characteristics of mining-induced slope movement and ground behavior under gully landforms. Sustainability 14, 13941–13957. doi:10.3390/su142113941
Miao, K. J., Tu, S. H., Tu, H. S., Lin, X., Li, W. L., Zhao, H. B., et al. (2022). Research on fractal evolution characteristics and safe mining technology of overburden fissures under gully water body. Fractal. Fract. 6, 486–501. doi:10.3390/fractalfract6090486
Mondal, D., Roy, P. N. S., and Kumar, M. (2020). Monitoring the strata behavior in the Destressed Zone of a shallow Indian longwall panel with hard sandstone cover using Mine-Microseismicity and Borehole Televiewer data. Eng. Geol. 271, 105593. doi:10.1016/j.enggeo.2020.105593
Mu, C., Yu, X. Y., Zhao, B. C., Zhang, D. D., Mao, X. W., and Zhu, J. (2021). The formation mechanism of surface landslide disasters in the mining area under different slope angles. Adv. Civ. Eng. 2021, 1–13. doi:10.1155/2021/6697790
Qin, Y., Xu, N. X., Zhang, Z. J., and Zhang, B. (2021). Failure process of rock strata due to multi-seam coal mining: insights from physical modelling. Rock. Mech. Rock. Eng. 54, 2219–2232. doi:10.1007/s00603-021-02415-0
Rezaei, M. (2016). Development of an intelligent model to estimate the height of caving–fracturing zone over the longwall gobs. Neural. comput. Appl. 30, 2145–2158. doi:10.1007/s00521-016-2809-3
Tan, Y., Xun, H., Yan, W. T., Guo, W. B., Bai, E. H., Qi, T. Y., et al. (2022). Study on the overburden failure law of high-intensity mining in gully areas with exposed bedrock. Front. Earth Sci. 10, 1–10. doi:10.3389/feart.2022.833384
Tang, J. X., Dai, Z. Y., Wang, Y. L., and Zhang, L. (2019). Fracture failure of consequent bedding rock slopes after underground mining in mountainous area. Rock. Mech. Rock. Eng. 52, 2853–2870. doi:10.1007/s00603-019-01876-8
Tang, Z. S., An, H., and Shangguan, Z. P. (2015). The impact of desertification on carbon and nitrogen storage in the desert steppe ecosystem. Ecol. Eng. 84, 92–99. doi:10.1016/j.ecoleng.2015.07.023
Wang, G., Wu, M. M., Wang, R., Xu, H., and Song, X. (2016). Height of the mining-induced fractured zone above a coal face. Eng. Geol. 2016, 140–152. doi:10.1016/j.enggeo.2016.11.024
Wang, H. W., Jiang, B. L., Jiao, J. Q., and Li, Y. J. (2023). Overburden stress evolution characteristics and prediction of disasters with across-gully mining. Front. Earth Sci., 11, 1–15. doi:10.3389/feart.2023.1115323
Wang, J. A., Yang, L., Li, F., and Wang, C. (2020). Force chains in top coal caving mining. Int. J. Rock. Mech. Min. 127, 104218. doi:10.1016/j.ijrmms.2020.104218
Wang, R., Wu, K., He, Q. M., He, Y. B., Gu, Y. Y., and Wu, S. (2022). A novel method of monitoring surface subsidence law based on probability integral model combined with active and passive remote sensing data. Remote Sens. 14, 299–324. doi:10.3390/rs14020299
Wang, Z. Q., Li, J. K., Wu, C., Lv, W. Y., Zhang, J., Wang, P., et al. (2021). Study on influence laws of strata behaviors for shallow coal seam mining beneath gully terrain. Shock. Vib. 2021, 1–12. doi:10.1155/2021/3954659
Wei, J. B., Wang, S. M., Song, S. J., Sun, Q., and Yang, T. (2022). Experiment and numerical simulation of overburden and surface damage law in shallow coal seam mining under the gully. B. Eng. Geol. Environ. 81, 207–224. doi:10.1007/s10064-022-02706-y
Wei, W. S., Zhang, G. J., Li, C. Y., Zhang, W. S., and Shen, Y. P. (2023). Mechanism and control of asymmetric floor heave in deep roadway disturbed by roof fracture. J. Min. Sustain. 15, 6357. doi:10.3390/su15086357
Xu, J. L., Zhu, W. B., Wang, X. Z., and Zhang, Z. Q. (2012). Influencing mechanism of gully terrain on ground pressure behaviors in shallow seam longwall mining. J. China. Coal. Soc. 37, 179–185. doi:10.13225/j.cnki.jccs.2012.02.016
Xu, N. X., Zheng, J. Y., Tian, H., Mei, G., and Ge, Q. (2016). Discrete element modeling of strata and surface movement induced by mining under open-pit final slope. Int. J. Rock. Mech. Min. 88, 61–76. doi:10.1016/j.ijrmms.2016.07.006
Xu, Y. K., Wu, K., Bai, Z. H., and Hu, Z. Q. (2017a). Theoretical analysis of the secondary development of mining-induced surface cracks in the Ordos region. Environ. Earth. Sci. 76, 703–712. doi:10.1007/s12665-017-7050-6
Xu, Y. K., Wu, K., Li, L., Zhou, D. W., and Hu, Z. Q. (2017b). Ground cracks development and characteristics of strata movement under fast excavation: a case study at Bulianta coal mine, China. B. Eng. Geol. Environ. 78, 325–340. doi:10.1007/s10064-017-1047-y
Yan, W. T., Guo, J. T., Chen, J. J., Tan, Y., Yan, S. G., and Yan, Y. G. (2022). Severe damage law on the ground surface induced by high-strength mining: a case study from the Shendong coal field in China. Front. Earth Sci. 10, 1–10. doi:10.3389/feart.2022.827826
Yang, T., Yang, Y. R., Zhang, J., Gao, S. S., and Li, T. (2021). Study on development law of mining-induced slope fracture in gully mining area. Adv. Civ. Eng. 2021, 1–9. doi:10.1155/2021/9990465
Zhang, Y. F., Qian, C. L., Wang, X. F., Chen, X. Y., Chang, Z. C., Wang, J. Y., et al. (2023). Study on prevention and control mechanism of runoff water hazard in thick coal seam mining in valley terrain. Front. Earth Sci. 11, 1–14. doi:10.3389/feart.2023.1140491
Zhang, Y. J., Kong, J. Y., Long, S. F., Zhu, Y. H., Zhu, W. X., and Wu, T. H. (2022a). Study on the ground fissure development law of coal mining based on UAV photogrammetry and the particle flow theory. Front. Env. Sci. 10, 1–15. doi:10.3389/fenvs.2022.915645
Zhang, Y. J., Kong, J. Y., Zhu, Y. H., Zhu, W. X., He, F. S., Wang, L. F., et al. (2022b). Influence of underground mining direction based on particle flow on deformation and failure of loess gully area. Comput. Intell. Neurosci. 2022, 1–13. doi:10.1155/2022/1698220
Zhang, Y. J., Lian, X. G., Yan, Y. G., Zhu, Y. H., and Dai, H. Y. (2022c). Study on the development law of mining-induced ground cracks under gully terrain. Remote Sens. 14, 5985. doi:10.3390/rs14235985
Zhang, Z. Q., Xu, J. L., Wang, L., and Zhu, W. B. (2011). Study on influencing laws of gully slope angle on ground pressure of working face in shallow coal seam. J. Min. Saf. Eng. 28, 560–565. doi:10.3969/j.issn.1673-3363.2011.04.011
Zhao, B. C., Guo, Y. X., Mao, X. W., Zhai, D., Zhu, D. F., Huo, Y. M., et al. (2022). Prediction method for surface subsidence of coal seam mining in loess Donga based on the probability integration model. Energies 15, 2282–2303. doi:10.3390/en15062282
Keywords: gully area, three-dimensional similar-material simulation, numerical simulation, stress distribution, surface deformation
Citation: Wang X, Cai L, Zhang B, Wu J, Zhu Q and Cui Z (2023) Simulation study on surface deformation of shallow buried coal seam mining in a gully area. Front. Earth Sci. 11:1287981. doi: 10.3389/feart.2023.1287981
Received: 03 September 2023; Accepted: 07 November 2023;
Published: 28 December 2023.
Edited by:
Hans-Balder Havenith, University of Liège, BelgiumReviewed by:
Yuming Huo, Taiyuan University of Technology, ChinaCopyright © 2023 Wang, Cai, Zhang, Wu, Zhu and Cui. This is an open-access article distributed under the terms of the Creative Commons Attribution License (CC BY). The use, distribution or reproduction in other forums is permitted, provided the original author(s) and the copyright owner(s) are credited and that the original publication in this journal is cited, in accordance with accepted academic practice. No use, distribution or reproduction is permitted which does not comply with these terms.
*Correspondence: Lailiang Cai, Y2xsQGhwdS5lZHUuY24=
†These authors have contributed equally to this work and share first authorship
Disclaimer: All claims expressed in this article are solely those of the authors and do not necessarily represent those of their affiliated organizations, or those of the publisher, the editors and the reviewers. Any product that may be evaluated in this article or claim that may be made by its manufacturer is not guaranteed or endorsed by the publisher.
Research integrity at Frontiers
Learn more about the work of our research integrity team to safeguard the quality of each article we publish.