 Xianfu Bai
 Yuqian Dai3
 Qingyun Zhou
 Zhiquan Yang
94% of researchers rate our articles as excellent or good
Learn more about the work of our research integrity team to safeguard the quality of each article we publish.
Find out more
ORIGINAL RESEARCH article
Front. Earth Sci. , 18 October 2023
Sec. Geohazards and Georisks
Volume 11 - 2023 | https://doi.org/10.3389/feart.2023.1287577
This article is part of the Research Topic Monitoring, Early Warning and Mitigation of Natural and Engineered Slopes, volume III View all 17 articles
In mountainous areas, roads are often damaged by earthquake-induced landslides (EL). The degree of road damage and the existing functional state will have a very important impact on the whole earthquake relief work. However, this question has long been plaguing scientists engaged in the risk assessment. Now, an MDT-based rapid assessment method for the spatial distribution of trafficable sections of roads (TSR) hit by EL is proposed. The method mainly consists of three procedures: 1) Demarcate the road sections in the evaluated region; 2) Create the data for earthquake-induced landslide sensitivity level for the evaluated region; 3) Use the sample data to devise the MDT model for the TSR hit by EL and calculate the trafficability of road sections. This method was applied in the study of the 2008 Wenchuan Ms 8.0, the 2014 Ludian Ms 6.5, the 2012 Yiliang Ms 5.6 and Ms 5.7 earthquake-stricken regions. The case of Wenchuan earthquake was adopted to establish the method. The cares of Ludian and Yiliang were used to evaluate whether the method could be transplanted into similar regions. The p-value and the kappa coefficient were used to test and evaluate the significance and the consistence of the actual situation. Our results suggest: ⅰ) The Wenchuan evaluated region had the p-value 2.52 × 10−203 and the kappa coefficient 0.91. Less than 1% of the road sections that were inferred to be trafficable with the established method were actually interrupted by EL. The interruptions in the road sections that were inferred to be un-trafficable were 12 times of those in the other road sections. ⅱ) The Ludian and Yiliang earthquake-stricken regions had the p-value 9.7 × 10−107 and the kappa coefficient 0.81. Only 1.31% of the road sections that were trafficable according to the calculation results of the model had been actually interrupted by EL. The interruptions caused by EL in the un-trafficable road sections according to the calculation results were 5.2 times of those in the trafficable road sections. This method could be applied in other similar regions when a certain error was permitted.
The spatial distribution of trafficable sections of roads (TSR) significantly affects emergency rescue decision-making, which impacts both the reduction of earthquake disaster losses and the regional planning for mitigating earthquake disasters. For instance, if the roads are damaged during an emergency rescue, the rescue team may be delayed, which can seriously delay the rescue of the injured in a timely manner (Lan et al., 2009; Chang, 2013; Yang et al., 2023a). An important part of earthquake emergency response is drawing up a plan of action for emergency rescue within a short time after the earthquake. Planning can be enhanced if it is supported by the simulation and analysis of seismic disasters including the prediction of expected road blockage caused by earthquake-induced landslides (EL). The Ministry of Emergency Management of the People’s Republic of China undertakes rapidly assessing the impact of significant earthquakes occurring on the Chinese mainland before eyewitness reports have come in and informs the government in earthquake-stricken areas (including the transportation department, armies, and other departments) of the potential effects. The government’s immediate plan for rescue and evacuation requires information about road blockage in the disaster area and suggestions from the Ministry of Emergency Management of the People’s Republic of China about traffic management. Facing the need for information concerning a large area (the Chinese mainland), the assessment of EL disasters implemented by the Ministry of Emergency Management of the People’s Republic of China must adopt methods based on correlation analysis and can at present only provide information on EL sensitivity. Recently, Dai achieved good results in rapid assessment of human death by landslide sensitivity information (Dai et al., 2022). This paper aims to add the capability of being able to predict road blockage using the existing earthquake-induced landslide sensitivity (ELS) data. Road trafficability (RT) during an earthquake event depends mainly on two natural factors. One factor is the ground motion, which causes direct damage to bridges, tunnels, and roadbeds. The other factor is the secondary geological disaster resulting from ELS and mud-rock flow, which destroys or buries roads. Substantial progress has been made in the development of techniques for the rapid assessment of roads directly damaged by ground motion. However, few studies have focused on the rapid assessment of TSR according to the secondary effects of earthquakes such as ELS. The C4.5 method based on the maximum information gain in the decision tree was introduced to explore the risk assessment of road interruptions based on the ELS in the high-intensity areas during the Wenchuan earthquake (An et al., 2015). The study revealed that the ELS level could be used to assess the trafficability of roads. In the C4.5 method, the ELS level was based on the intensity as a parameter of ground motion influence. Five levels of intensity corresponded with the values 1–5 in the landslide cell attribute. The study used the 90 m × 90 m raster data. In the study of the high-intensity areas during the Wenchuan earthquake, the influence on the number of cells was however tested only at a single ELS level for each child node in the decision tree. At the same time, the correlation between attributes, which existed extensively in an information system, was ignored, but it led to costly pruning in the decision tree model. The largest shortcoming was the poor universality of the findings in the study because of the absence of focus on low-intensity areas. To overcome the shortcoming wholly or partially, an MDT (Multivariate Decision Tree)-based rapid assessment method is proposed in this paper for the spatial distribution of TSR based on the ELS. In the method used in the study, the seismic intensity envelope of an assessed region is used to calculate and determine the spatial distribution of ELS levels. Subsequently, the number of cells in the raster data for each ELS level is calculated within the 180 m buffer zone on both sides of each road section. The MDT correlation between the number of cells at each landslide sensitivity level within the buffer zones of each road section and the trafficability of the road section is established to infer the spatial distribution of TSR. This method is established to provide a more universal and accurate way for quickly assessing the spatial distribution of TSR hit by EL. It is hoped that this method can meet the urgent need for quantitative information on the spatial distribution of TSR hit by EL while making decisions on emergency aid in an earthquake and for quantitatively assessing earthquake disasters. In some major projects such as the National Earthquake Social Service Engineering Emergency Response Program, the National Support Plan for Science and Technology, and the Earthquake Disaster Scenario Construction in Large and Medium Cities of China, the ELS was studied to generate the data set for the prediction of ELS level according to the influence of seismic intensities (Bai et al., 2015; Bai et al., 2021). The data set was used in the rapid assessment of ELS after an earthquake. It has 90 m × 90 m raster data displayed as cells in the computer. In terms of landslide probability, the landslide sensitivity of cells was categorized into five levels, that is, very low, low, medium, high, and very high, which correspondingly represent the cell attribute values 1, 2, 3, 4, and 5. The data for the prediction of landslide sensitivity had three key features: 1) it was 90 m × 90 m raster data; 2) it was predicted with the intensity as the parameter influencing ground motion; 3) landslide sensitivity was divided into five levels representing the cell attribute values 1–5 correspondingly. When the landslide sensitivity level of a region was higher, that is, there were more cells with high values, it would be more likely that the earthquake would cause landslides on a larger scale.
This paper is divided into six sections. In the second section, we describe the research areas and available data. The third section presents the basic idea of the rapid assessment method for the spatial distribution of TSR hit by the EL, as well as the MDT theoretical model. In the fourth section, the main results obtained with the method are described. The fifth section discusses the change to parameters and scope of applicability of the constructed method. The sixth section draws conclusions about the method and highlights the matters to which special attention should be paid.
Situated at the southeast edge of the Qinghai–Tibet Plateau, the Sichuan–Yunnan region is affected by the eastward movement of crustal materials in the Tibet Plateau and the wedging Assam peak, causing its complicated crustal activity and intense neotectonic deformation and seismic activity. It is, therefore, the region most noticeably exposed to strong seismic activity in mainland China (Su et al., 2001). At 14:28 (Beijing time) on 12 May 2008, a strong earthquake of Ms 8.0 occurred in Sichuan, China. The epicenter of the earthquake was located at 31.01 N, 103.42 E in Wenchuan County. The area affected by the Wenchuan earthquake, with intensities up to degree Ⅺ, was within the active Longmen Mountain fault zone. This is a zone of active tectonics that separates the Chengdu Plain and Sichuan Basin to the southeast from the Longmen Mountain area and the Tibetan Plateau to the northwest. A significant difference exists between the topography of the two areas, and the major disaster area following the earthquake was in the mountainous area, an area prone to landslides. The earthquake caused severe landslides, and almost all of the roads leading to the worst-hit areas were affected to varying degrees. The road breaks caused by the EL have seriously delayed the rescue progress. Ludian County and Yiliang County, are located in the southwest of Zhaotong City, Yunnan Province, China. On 3 August 2014, an earthquake of Ms6.5 occurred in Ludian, Yunnan, China. The earthquake occurred east of the Xiaojiang fault zone and south of the Lianfeng fault zone. The epicenter was located in the urban area of Longtoushan Town, southwest of Ludian County. A severe landslide occurred at the junction of Huodehong Town and Longtoushan Town on the north bank of the Niulan River. Although the magnitude of the Ludian earthquake was not high, the earthquake intensity in the extreme earthquake area reached Ⅸ, the surrounding landforms in the area were complex, the accessibility was extremely poor, and the resource and environmental carrying capacity were fragile. The Ludian earthquake caused the worst landslides in the region’s history. Dense landslides have blocked rural roads leading to settlements in the Niulanjiang Valley region, as well as aftershocks and heavy rains in the disaster area, resulting in repeated disruptions to the road. On 7 September 2012, the Ms 5.7 and Ms 5.6 Yiliang earthquakes occurred in Yiliang, Yunnan Province, triggering numerous landslides and causing significant impact on the locals. Many roads around the Luoze River in Yiliang County have been blocked by earthquake landslides.
Identifying the extent and degree of interruption of roads hit by the EL is vital for the development of post-earthquake traffic control strategies in Yunnan and Sichuan (Ouyang, 2013). In this study, a rapid assessment model of the TSR hit by the EL is constructed for the evaluated regions, including the 2008 Wenchuan Ms 8.0 earthquake-stricken region, the 2014 Ludian Ms 6.5 earthquake-stricken region, and the 2012 Yiliang Ms 5.6 and Ms 5.7 earthquakes-stricken region. The earthquake-stricken region is a region with the seismic intensity VI and above based on the post-earthquake field survey (Figure 1). The three earthquake-stricken regions mentioned are typical of the mountainous areas in the Sichuan–Yunnan region and Southwest China, and analyses of these are also applicable in other mountainous areas of China. Among these evaluated regions, the Wenchuan earthquake-stricken region has the most comprehensive set of samples for the interruption of roads hit by the EL. These samples can be used to establish the rapid assessment method for the TSR hit by the EL and thereby evaluate the effectiveness of the method. The Ludian-Yiliang earthquake-stricken region is used to evaluate the extensibility and applicability of the constructed method in similar regions.
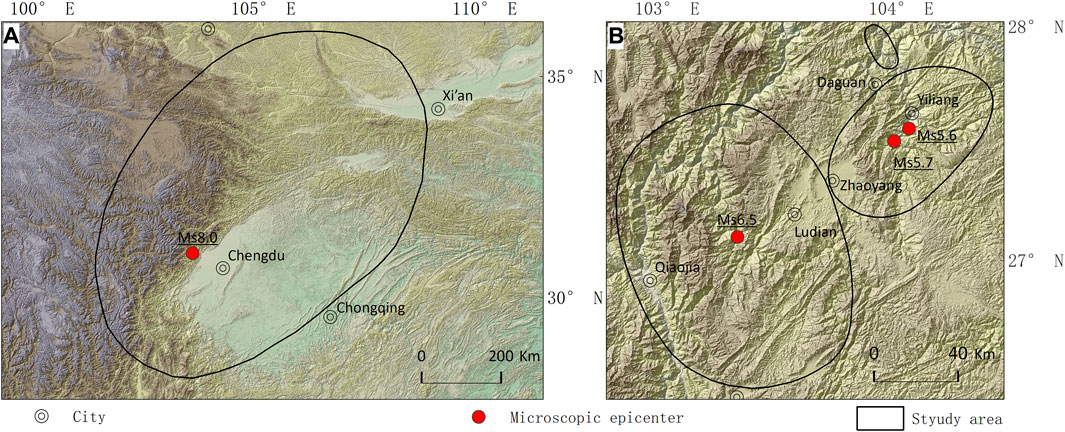
FIGURE 1. Location of the evaluated regions. (A) Wenchuan evaluated region; (B) Ludian-Yiliang evaluated region.
In this study, the data of roads and seismic intensities were provided by the basic database for earthquake emergency response of Yunnan Province and the basic database for earthquake emergency response of Sichuan Province. The data of the roads in the year immediately preceding the occurrence of an earthquake in a region were taken as the basis for creating the spatial data of the road. The format of road date and intensities date is shapefile. Roads date’s feature type is polyline, and the intensities date’s feature type is polygon. The analysis of roads took into account only higher levels of classification of roads (including expressways, national highways, and provincial highways) but left out lower levels of roads such as county-level and town-level roads. However, the trafficability of the roads of lower levels is also important in real-life crisis management.
The EL data involved in this study were sourced from the Department of Natural Resources of Yunnan Province (DNRYP). After these earthquakes, the DNRYP conducted extensive field investigations and combined remote sensing image interpretation to determine the spatial distribution of EL. The feature type of Yiliang EL date is point, but the others are polygon. Immediately after the Wenchuan earthquake, we carried out a large field investigation in the disaster area to assess the impact of landslides on roads. The field investigation was enhanced by the use of high-resolution images. After the Ludian and Yiliang earthquakes, we also carried out similar work. We used these data to determine which roads in the research area were blocked owing to EL. In this study, the results of the basic vector data we collected are shown in Figure 2.
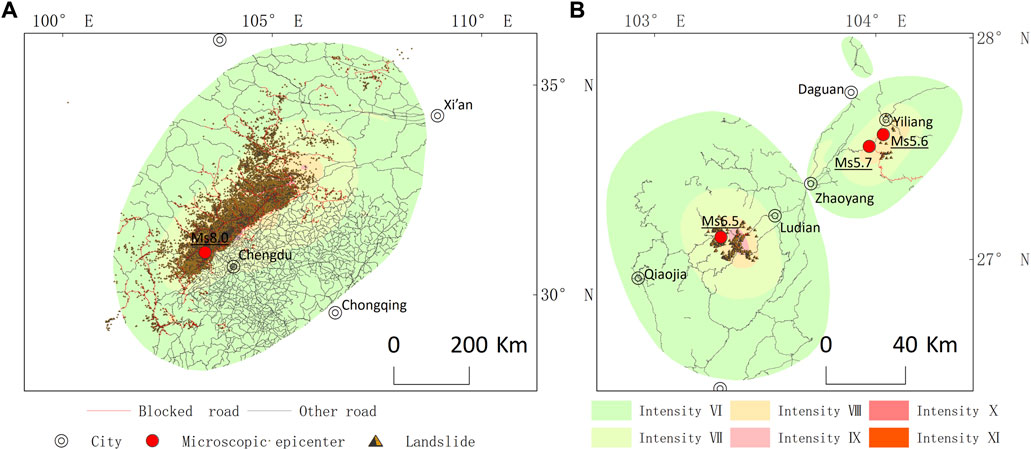
FIGURE 2. Basic vector data of the evaluated regions. (A) Wenchuan evaluated region; (B) Ludian-Yiliang evaluated region.
The trafficability of roads hit by the EL is closely related to the road condition and the scale of the landslide. Based on the current research findings, the ELS level was selected to represent the influence of landslides on the trafficability of roads in this study. There have been previous studies that focused on the ELS assessment around the world, but the methods developed in these studies that applied to rapid assessment were mainly divided into two categories. One category comprised studies where the methods were based on the Newmark displacement model and its derived models (Capolongo et al., 2002; Havenith et al., 2006; Gaudio et al., 2012; James et al., 2013; Rajabi et al., 2013; Chousianitis et al., 2014), and the other category contained studies that used analysis methods based on landslide sensitivity (Havenith et al., 2006; Kamp et al., 2008; Kamp et al., 2010; Xu et al., 2012a; Xu et al., 2012b; Xu et al., 2012c; Xu et al., 2014). The Newmark models applied to the assessment of smaller regions (Jibson, 2007; Yang et al., 2023b; Pei et al., 2023; Zhao et al., 2023) and not suitable for assessing the potential landslides caused by earthquakes extensively (Qiu et al., 2022; Wang et al., 2022; Yang et al., 2023c; Ma et al., 2023). In the early stage, the studies in China relied on the activity and occurrence conditions of secondary geological disasters in the past earthquakes for the preliminary judgment on the ELS in a specific region, for some time to come (Tang et al., 2001; Liu et al., 2006). The findings in these studies played a significant role in China’s land planning and control for a long time, but they could not be easily applied to the rapid assessment of ELS levels during an emergency. After the Wenchuan earthquake occurred, many studies in China explored ELS from the approach of mathematical regression. The methods used in these studies mainly included information quantity (Zhuang et al., 2010), logical regression (Tao et al., 2010; Bai et al., 2015; Xu et al., 2019), analytic hierarchy process (Wang et al., 2012), fuzzy mathematics (Wang et al., 2011), artificial neural network (Xu et al., 2012b), and certainty factor analysis (Xu et al., 2013). A great number of theories, methods, and data have been accumulated in these studies for the research of ELS. In this study, a module was borrowed from a research initiative to rapidly assess the ELS level and formulate the ELS distribution map of the evaluated region. The module was the latest product of the “Research on the analysis methods for ELS” (No. 2016QJGJ09), a special project on earthquake disaster scenario construction in large and medium cities. The method was used to draft the spatial distribution of landslide sensitivity levels on the land of China according to earthquakes of different intensities (Figure 3). It generated the 90 m × 90 m prediction data set of ELS levels with intensity VI–XI. After calculating the probability of EL in each cell for the given intensity, it divided the probability into five levels by natural breaks, that is, very high, high, medium, low, and very low. The cell values for these ELS levels are 5–1, respectively. A higher cell value implies higher ELS (Bai et al., 2021). In Figure 3, each cell value represents the ELS level at the corresponding position. The cell values are highlighted in different colors. When tested with the historical data of EL, the prediction data set of ELS levels is a good indicator for the occurrence of EL (Bai et al., 2021; Zhang et al., 2022).
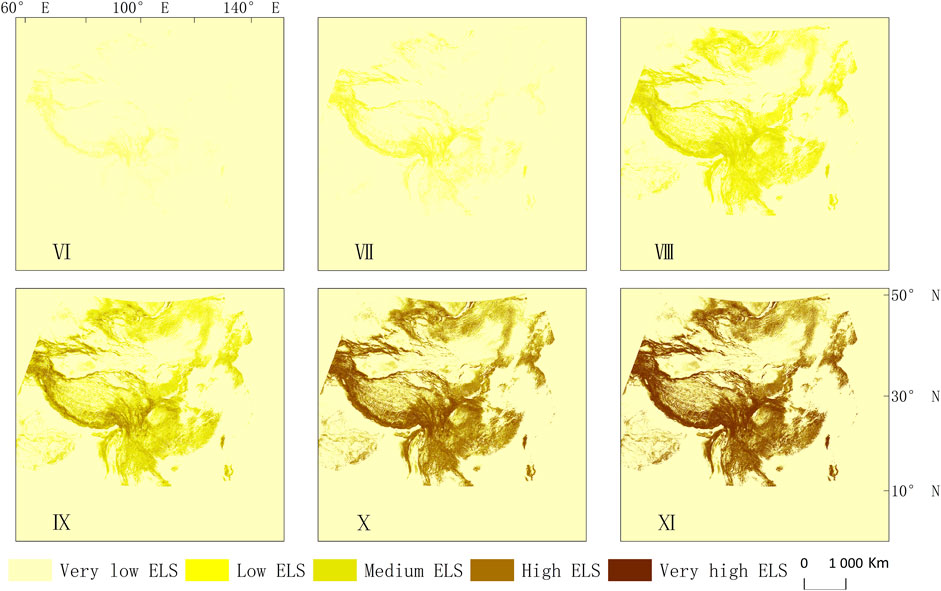
FIGURE 3. Prediction data set of ELS levels with intensity VI–XI (90 m × 90 m raster data).
The MDT-based rapid assessment method for the spatial distribution of TSR hit by the EL is employed to evaluate the road sections, which are then categorized into trafficable and un-trafficable sections. TSR allows vehicles to ply during an earthquake as they are not damaged by EL, while un-trafficable sections are buried or destroyed by EL, making it impossible for vehicles to drive on them. The rapid assessment of the spatial distribution of TSR hit by the EL is meant to classify the TSR by identifying the number of cells at different landslide sensitivity levels within the buffer zones of these sections with the MDT model. The method is implemented in three basic steps (Figure 4): 1) Demarcate the road sections in the evaluated region, that is, partition a road into sections by virtue of the geographic information system (GIS), and make a 180 m buffer zone on both sides of each road section; 2) Create the data for ELS level for the evaluated region. The data is extracted for the spatial distribution of ELS levels in terms of seismic intensity for the evaluated region. The numbers of cells at different landslide sensitivity levels are recorded within each buffer zone. Seismic intensity is determined in the rapid assessment while we quickly evaluate the spatial distribution of trafficable sections of roads hit by earthquake-induced landslides. The seismic intensity is usually conducted by the model of area attenuation features of earthquake intensity, shakemap, aftershock, and any other methods in the process of rapid assessment after a significant earthquake occurs. A system of seismic intensity rapid assessment technology has been given by Bai et al. (2014) and other researchers. 3) Use the sample data to devise the MDT model for the TSR hit by EL and calculate the trafficability of road sections. The results of the rapid assessment are taken for mapping the spatial distribution of TSR according to conditions of EL in the evaluated region.
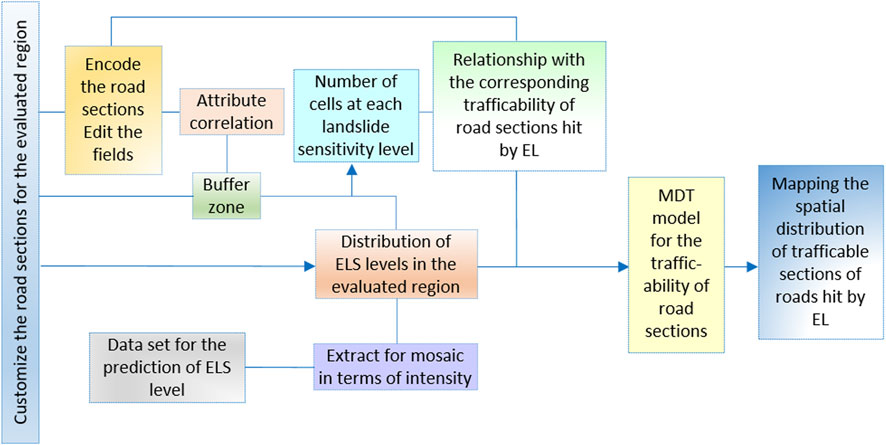
FIGURE 4. Process of the MDT-based rapid assessment for the spatial distribution of TSR hit by the EL.
Road layout normally forms a networked system with some nodes connected by different traffic lines. One or several traffic lines exist between two nodes. A line connecting two nodes in a road network is defined as a road section (Figure 5), which is taken as the basic unit to assess the trafficability of a road hit by the EL. The nodes at both ends of a road section may be cities, towns, villages, ramp entrances and exits, highway intersections (including crossings), roundabouts, stations, or other highway beginning and endpoints (Figure 6). A road section is taken as the basic unit in the assessment since an interruption at any position of the section makes it impossible to transport people and goods between two nodes through that section. Under this circumstance, a GIS is employed to partition a road into vector sections, encode these road sections, and process the relevant fields. For this purpose, the field for trafficability of sections is Boolean or logical; that is, the sections of the roads are classified according to the influence of the EL into either trafficable or un-trafficable sections.
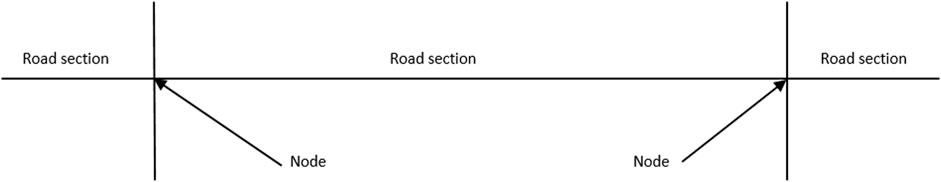
FIGURE 5. A sketch map of road sections.
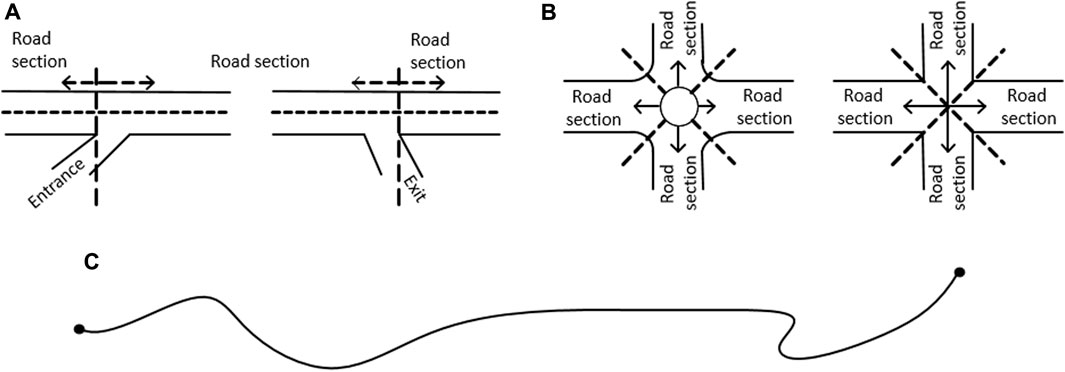
FIGURE 6. A sketch map of some nodes in the traffic network. (A) Ramp entrance and exit; (B) Roundabout and crossing; (C) Road start and end.
A road becomes un-trafficable when it is buried or destroyed by the EL or by the descent of the EL above the road. When a landslide occurs above a road, it may interrupt the road only if its radius goes beyond or reaches the road. As for 5,928 landslides induced in the Wenchuan earthquake (Figure 7), the horizontal projection distance of their movement ranged from 90 to 190 m; the maximum was recorded as 1,201 m and the average was 136.6 m. Among them, 386 samples had a distance larger than 180 m, accounting for only 6.51% of total samples. The average turned out to be 168.8 m if the repeated distances were taken out from the sample data. The roads in the mountainous areas of China normally extend along the valleys with higher elevations on both sides. Based on the statistical results of EL distance, a space of 180 m on both sides of a road is defined as the influence of EL on the trafficability of the road. This aims to lower the subsequent statistical redundancy in this study. Therefore, the buffer zone of road sections was made 180 m on both sides of the roads but not provided at the ends of a road section (Figure 8).
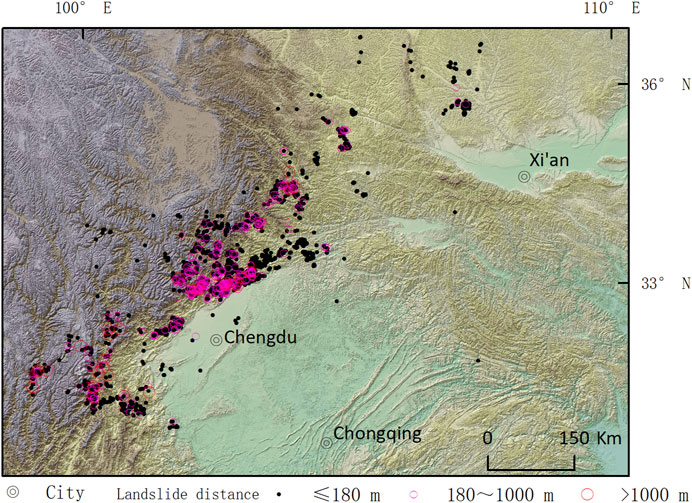
FIGURE 7. Spatial distribution of the landslide distances in the Wenchuan earthquake. To determine the extent of earthquake-induced landslides, we randomly selected 5,928 samples from the landslides triggered by the Wenchuan earthquake. The plotted dots in the figure represent the locations of the selected landslides, while the color of the dots indicates the distance of their movement.
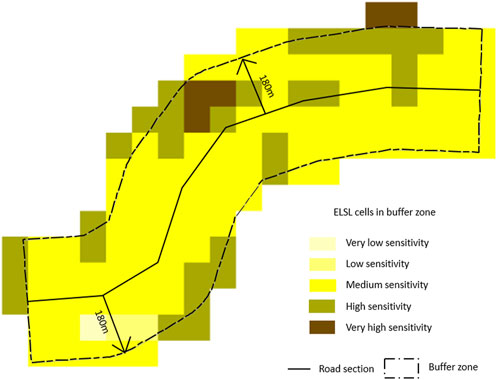
FIGURE 8. The sketch map of the road section buffer zones and cells.
Using the module (described in Section 2.3 above), the ELS level for the whole evaluated region area can be created. The process (Figure 9) is as follows: 1) Acquire the disaster areas and the seismic intensity in each area for the current earthquake from the seismic intensity map determined in the rapid assessment (Sometimes it can also be obtained through on-site investigation or other means too). 2) Extract the ELS level distributions in the intensity-specified areas from the ELS dataset for China according to the corresponding seismic intensity. 3) Acquire the ELS distribution for the whole evaluated area affected by the earthquake through the mosaicking of the previously extracted ELS distributions under each seismic intensity.
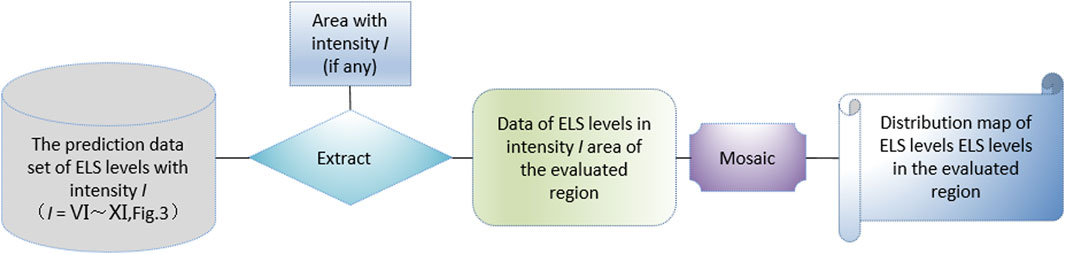
FIGURE 9. Process of the ELS assessment in the evaluated region.
If the spatial distribution of ELS levels is predicted with the data set, the parameter representing the influence of ground motion in the evaluated region should be seismic intensity or converted into it.
The cell information of ELS levels in buffer zones is extracted by counting the number of cells at different landslide sensitivity levels in buffer zones based on the data generated in Section 3.3.1. The cells are covered, as indicated in Figure 8. The number of cells is assigned as the earthquake-induced landslide attributes (ELA) of the buffer zone. In the buffer zone attribute table, Ai (i=1, 2, 3, 4, 5) denotes the number of cells at the ELS level i in a buffer zone.
After extracting the information as given in Section 3.3.2, the ELA of each buffer zone is assigned to the corresponding road sections based on the data correlation, and these become the ELA for these road sections. After this assignment, the road sections share the same ELA as the buffer zones.
Decision tree modeling is a method commonly used in machine learning. For instance, we may desire to obtain a model from a given training data set for the classification of new samples in a binary classification task. The task can be regarded as a process of “deciding” or “judging” whether a sample is “positive.” As its name suggests, the decision tree has the decision made in a treelike structure. The result of the decision-making process is the judgment we desire. Normally, a decision tree contains a root node, several internal nodes, and several leaf nodes. The leaf nodes reflect the results of the decision, while each of the other nodes represents an attribute test. The sample set for each node is categorized into the child node based on the result of the attribute test. The root node contains the entire set of samples. The path from the root node to each leaf node represents a sequence that is subjected to a judgment test. Decision tree learning generates a decision tree that is highly capable of generalization, i.e., processing new samples. It basically follows the simple and direct strategy of “divide-and-conquer.” It is evident that a decision tree is generated in the process of recursion. In the basic algorithm of the decision tree, the return leads to recursion in three circumstances: 1) all the samples contained in a node belong to the same category and are not further classified; 2) the attribute set is empty, or all the samples cannot be classified since their attribute values are identical; 3) the sample set contained in a node is empty, making it impossible to classify. In the second circumstance, the node can be marked as a leaf node, and its category is set as the category containing the most samples of the node. In the third circumstance, the node is also marked as a leaf node, but its category is set as the category containing the most samples of its parent node. There is a substantial difference between them. The posterior distribution of the node is utilized in the second circumstance, while the sample distribution of the parent node is taken as the prior distribution of the node in the third circumstance. A decision tree involves a variety of models and algorithms. Most of the decision tree models require the testing of only one attribute at each node, e.g., CART, ID3, and C4.5. These univariate decision trees assume that the conditional attributes in the information system are immune to the effect of decision attributes. Nevertheless, the correlation between the attributes in various information systems is universal in real life. It is therefore often impossible to reflect such a correlation in a univariate decision tree. Additionally, pruning is costly for a univariate decision tree and causes the loss of some attributes that seem futile but contain important and relevant information. This turns into a bottleneck in improving the classification accuracy of the decision tree. For this reason, Murthy et al. (1994) put forward the Multivariate Decision Tree (MDT) model in 1994. In the MDT model, the nodes that were not leaf nodes, were not used exclusively to decide on a specific attribute but to test the linear combination of attributes. In other words, each node (other than a leaf node) appeared as a line classifier, e.g.,
The calculation of the TSR subjected to the EL in a given region is actually the classification of road sections based on MDT in terms of trafficability. The road sections in a region to be evaluated are taken as samples to analyze the correlation between RT and the ELS on both sides of the roads. At the same time, the attributes of these samples are represented by the number of cells at different landslide sensitivity levels on both sides of the road sections (i.e., road section landslide attributes). The road sections are classified into trafficable and un-trafficable sections. The RT is obtained in a field survey and then used to determine the actual trafficable sections in these samples. The trafficability of the roads hit by EL T is expressed as:
In Eq. 1, the value of T is 0 when a road section is interrupted by EL, i.e., it is un-trafficable. The value 1 is awarded when the road section is not interrupted by EL, i.e., it is trafficable. The number of cells at the ELS level in the buffer zones on both sides of the road section indicates the possibility of EL. Consequently, each sample has five attributes in correspondence with the five levels of ELS. The five attributes represent the number of cells at each level of ELS in that sample. The value of Eq. 1 is determined by whether the attributes of a road section satisfy Eq. 2:
In the linear expression, t represents for the threshold of judgment; Ai stands for the number of cells at the landslide sensitivity level i in the buffer zone; wi denotes the weight of the landslide sensitivity level i. Normally, wi varies with nodes in the decision tree. In this study, five ELS levels are used so that the line classifier d=5. The C4.5 model considers the number of cells at only one ELS level for each node, but the MDT model uses the number of cells at all ELS levels for each node. In other words, the products of the number of cells at each ELS level and the weight of the corresponding sensitivity level should be aggregated for this purpose.
The MDT model was mainly used to find out the optimal linear expression for each node, but a parameter was still needed to judge the linear relationship for the most suitable MDT. Generally, the samples contained in the branch nodes of the tree were desired to be in the same category along with the progress of classification in the decision process. It implied that the purity of nodes became higher and higher. The Gini index was the commonest indicator for the purity of the sample set. If the proportion of the samples in the kth category of the sample set D was pk (k=1,2, … … ,|y|), the Gini index of D was defined as:
The lower the value of the Gini(D), the higher the purity of D. Apart from Gini index, information gain, and information entropy was used to measure the purity of nodes. These measures for purity did not exert any significantly different effect on the model. In this study, we evaluated the classification in terms of the Gini index. When the value of Gini(D) was the smallest, it was believed that the corresponding classifier must be the best.
The MDT model must guarantee the statistical significance of the assessment results and meet the actual needs at work while ensuring that each node has the smallest Gini index but the largest purity. The statistical significance of results is a method for estimating the authenticity of results (representing the whole). In the statistical test, the p-value (p-value, Probability, Pr) is an indicator of the declining credibility of the results. With greater p-values, the correlation of the variables for samples becomes a less reliable indicator for the correlation of variables overall. In many fields, the p-value is statistically obtained by virtue of a significance test. However, it is normally believed that 0.05 is the margin of acceptable error for the p-value. Under normal circumstances, p<0.05 indicates the existence of a statistical difference, p<0.01 significant statistical difference, and p<0.001 highly significant statistical difference. This means that the probability of sample error caused by the difference between samples is less than 0.05, 0.01, and 0.001. Moreover, the correctness rate of assessment can be considered, or the kappa test may be conducted for the model to meet the actual needs. The correctness rate represents the percentage of the assessment results that comply with the actual condition of samples, while the kappa coefficient shows the consistency of simulation results with the actual condition. The calculated kappa coefficient ranges from −1 to 1, but the kappa value normally falls into the range of 0–1. It is common to divide the kappa values into five categories for the consistency of different levels. Among them, 0.0–0.20 is the range for slight consistency, 0.21–0.40 for fair consistency, 0.41–0.60 for moderate consistency, 0.61–0.80 for substantial consistency, and 0.8–1 for almost perfect consistency.
The data of the roads in the year immediately preceding the occurrence of an earthquake in a region were taken as the basis for creating the spatial data of road sections. The details regarding the spatial distribution of road interruptions caused by EL in these earthquake-stricken regions were obtained from a field survey (Figure 2). By using the above method (Section 3.1), we have divided the roads in the evaluation areas into 29,204 sections, of which 2,254 sections are defined as blocked due to earthquake-induced landslides. The exclusive numbering scheme and fields were designed for each of these road sections. The road sections destroyed or buried by EL were defined as un-trafficable sections, and others as trafficable sections. In this study, we focused only on how EL affected the trafficability of roads and ignored the influence of other disasters. Therefore, some road sections that were inferred to be trafficable may be un-trafficable for other reasons.
For a better comparison with the actual situation, the data of seismic intensity from the field survey (i.e., spatial vector attribute data) was used to extract the data of ELS levels in the evaluated regions. We followed the ELS assessment process (Figure 9) to extract the data of the corresponding intensity from the prediction data set of ELS level (Figure 3) and prepared a mosaic of the spatial distribution data of ELS levels for the three earthquake-stricken regions (Figure 10). After the data of ELS levels for the evaluated regions were extracted for the spatial distribution data of ELS levels of the evaluated regions, the ELA was assigned to the road sections in the evaluated regions as per the methodology given in Section 3.3.2 and Section 3.3.3. Finally, the data of road sections were obtained for the trafficability of roads hit by EL as well as the ELA.
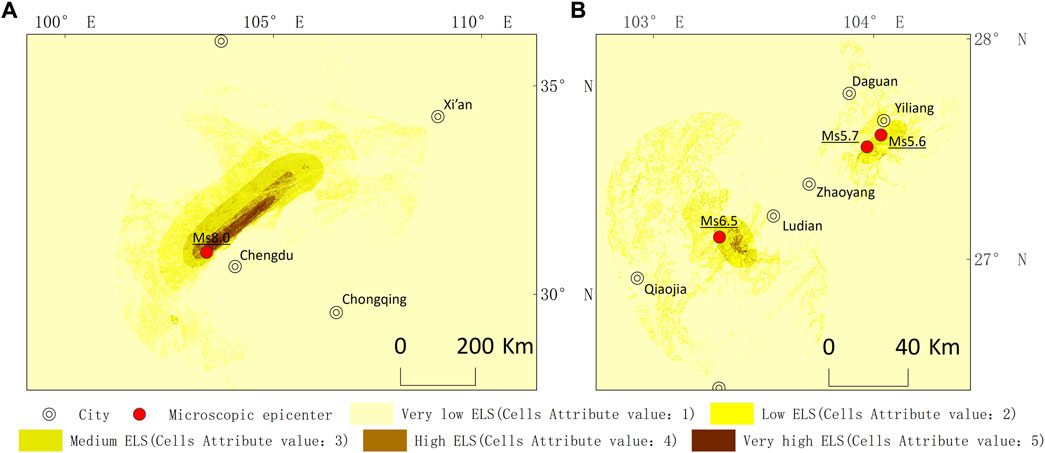
FIGURE 10. Spatial distribution inversion of ELS levels in the evaluated regions. (A) Wenchuan evaluated region; (B) Ludian-Yiliang evaluated region.
In this paper, we construct a rapid assessment method for the TSR subjected to the EL and then use it to infer the trafficability of road sections based on their ELA. The road sections in the Wenchuan earthquake-stricken region were classified into two categories. One category contained the road sections interrupted by EL, which were defined as un-trafficable. The other category included the other road sections that were not interrupted by EL, and these were defined as trafficable. The ELA of the road sections interrupted by EL in the Wenchuan evaluated region (i.e., the number of cells at different ELS levels in buffer zones as discussed above) (Figure 11) were compared with the ELA of other road sections (Figure 12). This comparison revealed that the number of cells at the very high or high level of ELS within the 180 m buffer zones on both sides of the road sections that were interrupted by EL was significantly higher than that of other unaffected road sections. Almost all cells were at a very low or low level of ELS within the 180 m buffer zones on both sides of other road sections. The number of cells at a very high or high level of ELS for these roads was very few or even zero. It is evident that roads were more easily interrupted when there were more cells at a high level of ELS on both sides of the roads. On the contrary, there was a greater possibility of roads not being affected by EL if the majority of the cells were at low levels of ELS on both sides of the roads. As shown in Figure 11 and Figure 12, the number of cells at different ELS levels on both sides of road sections could be taken as an important basis for judging the trafficability of roads hit by the EL. This indirectly revealed that the prediction data set of ELS levels was a good indicator for the possible occurrence of EL.
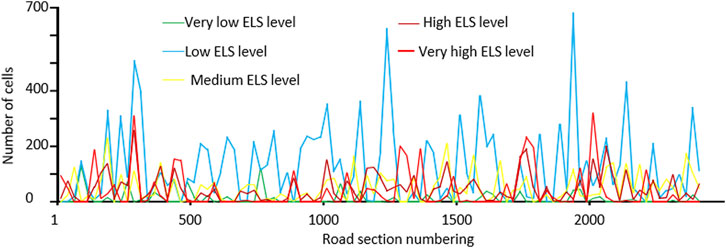
FIGURE 11. Statistical diagram of the landslide attributes of the road sections interrupted by EL in the Wenchuan evaluated region.
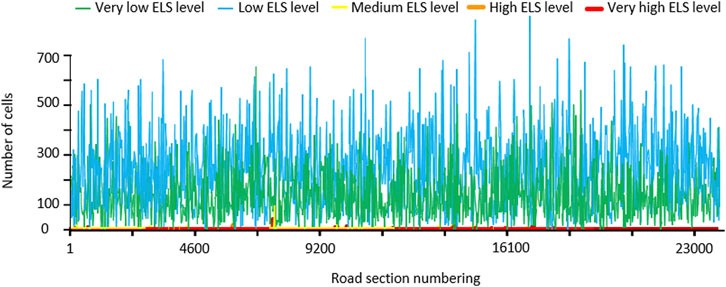
FIGURE 12. Statistical diagram of the landslide attributes of the road sections uninterrupted by the EL in the Wenchuan evaluated region.
Contingency analysis was carried out to qualitatively identify the correlation between the ELA of road sections and their trafficability. This was intended to infer the correlation between the trafficability of roads subjected to the EL and the number of cells at each ELS level within their buffer zones, i.e., whether they were independent of each other. A contingency table was employed to analyze and infer the correlation between the trafficability of 26,151 road sections hit by the EL and their ELA for the Wenchuan evaluated region (Table 1). In the table, T denotes the trafficability of roads according to EL. The roads are un-trafficable if the value of T is 0 or trafficable if it is 1. Moreover, Ai represents the number of cells at the landslide sensitivity level i in buffer zones. In the contingency analysis, the number of cells at each landslide sensitivity level equaled to or exceeded 0. The number of road sections reflected the number of trafficable road sections for ELA.
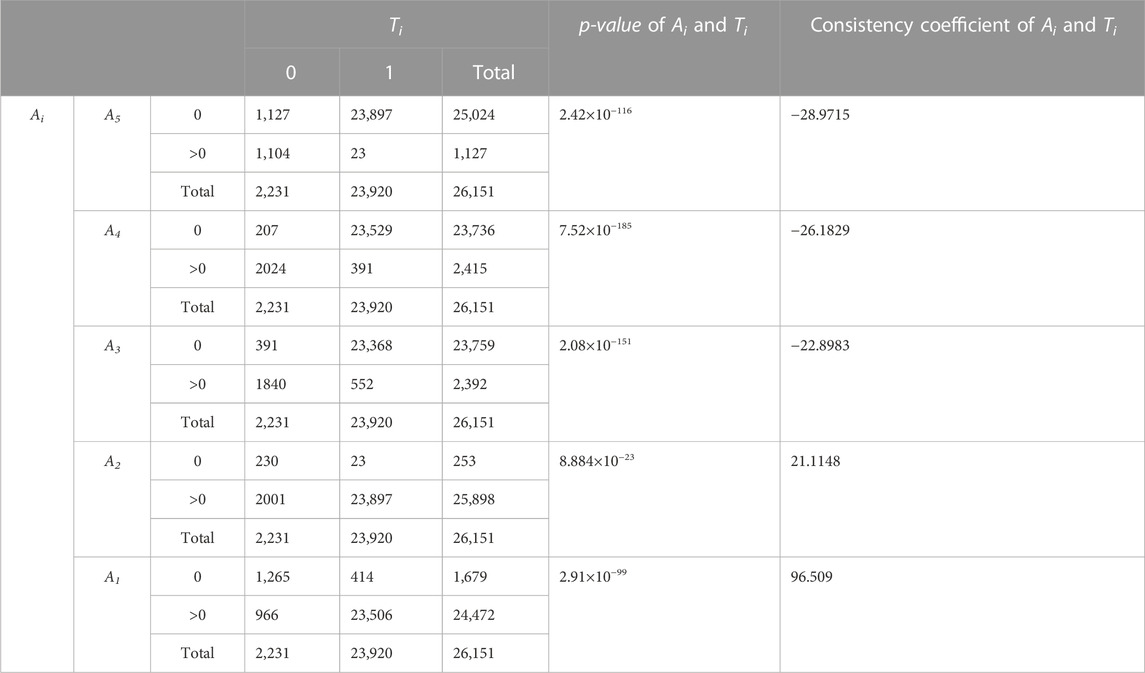
TABLE 1. Contingency of the ELS and the RT.
In the contingency analysis, we used the null hypothesis H0 that A1 and T were independent of each other, and the alternative hypothesis H1 that A1 and T were consistent with each other. The contingency table analysis showed that the p-value in the test of each group was much lower than 0.001. It was revealed that the null hypothesis, where the ELA of road sections and their trafficability were independent of each other, was untenable. In other words, the number of cells at different ELS levels within the 180 m buffer zones on both sides of road sections is related to the interruption caused by EL to the road sections. The correlation coefficient indicated a significantly negative consistency between A1–A5 and T. When A3–A5 were greater than 0, the value of T tended to be 0. In other words, if the number of cells at the medium to very high landslide sensitivity levels in the buffer zones of a road section was larger, the road section had a stronger tendency to be interrupted by EL. Moreover, there was a significantly positive consistency between A1–A2 and T. When the value of A1–A2 in the ELA of the road section was greater than 0, the value of T tended to be 1. Therefore, a road section had a stronger tendency of not being interrupted by EL when the numbers of cells at the very low and low landslide sensitivity levels in the buffer zones of the road section were larger. The positive or negative consistency between Ai and T depended on the agreement on the trafficability of road sections but always proved that they were not independent of each other. The number of cells at the very high ELS level was the least consistent with the trafficability of roads. It implies that the cells at the very high ELS level made the highest contribution to the un-trafficable roads hit by the EL. At the same time, the number of cells at the very low ELS level was the most consistent with the trafficability of roads, and its absolute value was the largest. It is revealed that the number of cells at the very low ELS level exerted the highest effect on the trafficability of roads hit by the EL. The p-value and consistency coefficient prove that the trafficability of road sections could be inferred by using their ELA.
The road sections in the Wenchuan evaluated region were classified into two categories. Among them, 8,717 pieces of data for the road sections were taken as the training set to construct the MDT model for the TSR hit by the EL. The remaining 17,434 pieces formed the test set to check the reasonableness of the model. Selecting the optimal classification attribute from the data set was crucial to decision tree learning. Following the above constraints, the statistical software R was utilized to build the MDT model. The branching rules of the MDT for the trafficability of the roads hit by the EL were developed according to the output of the R software.
The MDT model for the trafficability of the roads hit by the EL started from the root node, which contained 8,717 training samples. The samples included 739 un-trafficable samples and 7,878 trafficable samples. The branching for the root node of the decision tree was conducted in terms of whether the landslide attribute values of road sections satisfied Eq. 4:
Starting from the root node of the decision tree, the samples whose landslide attributes of road sections that satisfied Eq. 4 were deployed to node 1, and other samples went to node 2. The road sections in node 1 of the decision tree were judged to be trafficable. At this time, node 1 had the smallest Gini index (0.00561366) but the largest purity so the tree did not grow. In the training set, 7,827 samples satisfied Eq. 4 and were deployed to node 1. Among them, 7,805 road sections were trafficable, so that the fault rate was less than 1%.
The branching was conducted for node 2 of the decision tree based on whether the landslide attributes of road sections satisfied Eq. 5. The samples whose landslide attributes of road sections satisfied Eq. 5 were assigned to node 3, and other samples went to node 4. The road sections in node 4 were identified as un-trafficable. At this time, node 3 had the smallest Gini index (0.026989308) but the largest purity so the tree stopped growing. In the training set, 368 samples satisfied Eq. 5 and went to node 3. However, 363 road sections were un-trafficable, causing a fault rate of less than 1%.
The branching was conducted for node 4 of the decision tree based on whether the landslide attributes of road sections satisfied Eq. 6. The samples whose landslide attributes of road sections satisfied Eq. 6 were sent to node 5, and other samples went to node 6. The road sections in node 5 were identified as un-trafficable. At this time, node 5 had the smallest Gini index (0.147928994), but the largest purity and branching was halted. In the training set, 247 samples satisfied Eq. 6 and were sent to node 5. Among these samples, 228 road sections were un-trafficable, so that the fault rate was less than 1%.
The branching was conducted for node 6 of the decision tree based on whether the landslide attributes of road sections satisfied Eq. 7. The samples whose landslide attributes of road sections satisfied Eq. 7 were added to node 7 of the decision tree, and other samples went to node 8. The road sections in node 7 were considered un-trafficable. At this time, node 7 had the smallest Gini index (0.209876543), but the largest purity and the branching came to an end. In the training set, 63 samples satisfied Eq. 7 and went to node 7. Among these samples, 56 road sections were un-trafficable, causing the correctness rate of 88.89%.
The branching was conducted for node 8 of the decision tree based on whether the landslide attributes of road sections satisfied Eq. 8. The samples whose landslide attributes of road sections satisfied Eq. 8 were deployed to node 9 of the decision tree, and other samples went to node 10. The road sections in node 9 were judged to be trafficable. In this case, the node had the smallest Gini index (0.067776457) but the highest purity. Then, the branching was stopped.
The branching was conducted for node 10 of the decision tree based on whether the landslide attributes of road sections satisfied Eq. 9. The samples whose landslide attributes of road sections satisfied Eq. 9 were deployed to node 11 of the decision tree, and other samples went to node 12. The road sections in node 11 were found to be un-trafficable. At this time, node 11 had the smallest Gini index (0.64498791) but the highest purity and the decision tree stopped growing. In the training set, 61 samples satisfied Eq. 9 and were deployed to node 11. Among them, 59 road sections were un-trafficable, so that the fault rate was less than 4%. The road sections in node 12 were judged to be trafficable. Node 12 had the smallest Gini index (0.157215802) and the largest purity so the branching of the decision tree was completed. In the training set, 122 samples did not satisfy Eq. 9 and went to node 12. Among them, 112 road sections were trafficable, so the correctness rate was 91.80%.
The above MDT rules for judging the trafficability of the roads hit by the EL were drafted into a traditional tree structure, as shown in Figure 13.
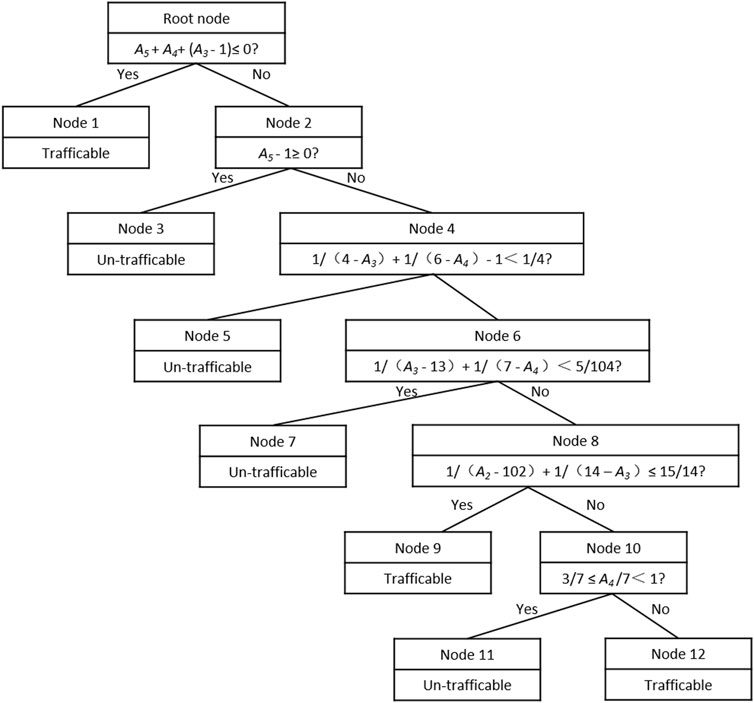
FIGURE 13. MDT model of the TSR hit by the EL in the Wenchuan evaluated region.
The judgment rules given in Figure 13 were used to decide the trafficability of roads hit by the EL for all samples in the Wenchuan evaluated region by virtue of MDT. The results were compared with the actual trafficability of roads. According to the calculation results (Table 2), the p-value of the Wenchuan evaluated region was 2.52×10−203, much lower than 0.001, and its overall correctness rate reached 98.50%. Its kappa coefficient was 0.91, which falls in the range of 0.81–1 so the assessment results given by the model had almost perfect consistency with the actual condition. Based on the results, the number of interruptions in the trafficable road sections hit by the EL took up only 0.958% of these road sections, while the number of interruptions in the un-trafficable road sections was 12.3 times as high as those in other road sections. Obviously, the MDT model could be taken as a good indicator of the interruption caused by EL in the road sections. Compared with the C4.5 decision tree, the MDT model is applicable in a wider range and shows higher differential significance, that is, higher statistical significance, as well as higher kappa coefficient, that is, higher consistency and overall correctness rate.

TABLE 2. Assessment results based on the MDT model (the Wenchuan evaluated region).
The above model was utilized in ArcGIS to obtain the spatial distribution of TSR hit by the EL in the evaluated region (Figure 14A) by calculating the trafficability of road sections hit by the EL, based on the seismic intensity from the post-earthquake field survey. The comparison with actual conditions revealed that most of the road sections that were assessed to be un-trafficable but were trafficable belonged to some expressways with high intensity, while most of the road sections that were calculated to be trafficable but were interrupted by landslides existed in some provincial highways with low intensity. The model was not constructed with the classification of roads but assumed that all roads were identically vulnerable to EL. However, provincial highways were more vulnerable to EL than expressways due to design and siting considerations.
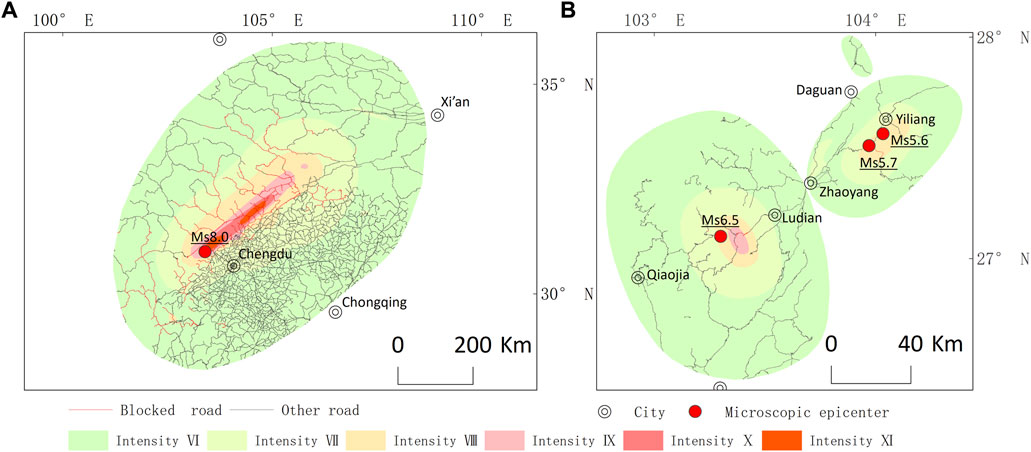
FIGURE 14. Spatial distribution inversion of TSR hit by the EL for the evaluated regions. (A) Wenchuan evaluated region; (B) Ludian-Yiliang evaluated region.
The 2014 Ludian Ms 6.5 earthquake-stricken region and the 2012 Yiliang Ms 5.6 and Ms 5.7 earthquake-stricken region in Yunnan were employed in the study to test the extensibility of the proposed method for the rapid assessment of TSR hit by the EL caused by different earthquake magnitudes in the regions with similar natural and geographical environments. The MDT model constructed for the TSR hit by the EL for the Wenchuan evaluation region was applied to the Yunnan evaluation region without altering the data processing method, model indicators, and parameters. The spatial distribution of TSR that had EL in the Ludian-Yiliang evaluation regions was obtained, as shown in Figure 14B. The Ludian earthquake and the Yiliang earthquake had much lower magnitude and intensity, and the landslides induced were less serious than for the Wenchuan earthquake, but they still triggered different severities of interruption to roads because of EL since they occurred in the mountainous areas. The calculation results (Table 3) showed that the p-value in the test of trafficability for the Ludian-Yiliang evaluated regions was closer to 0, and the overall correctness rate reached 99.67%. Moreover, the kappa coefficient was 0.81. Its consistency was slightly lower than that of the Wenchuan evaluated region but still fell into the almost perfect range. In the Ludian-Yiliang evaluated regions, the road sections that were interrupted by EL comprised only 1.31% of those with the trafficable attribute. Additionally, the road sections that had the untrafficability attribute and that were interrupted by EL were 5.2 times as high as other road sections. Thus, the calculated trafficability is a good indicator of whether road sections are interrupted by landslides. The constructed model for the Wenchuan evaluated region can be promoted for evaluating the trafficability of other regions with similar natural and geographical environments under conditions of EL damage of their road network. On the premise of acceptable error, the constructed method can be employed to rapidly and more extensively assess the TSR hit by the landslides caused by earthquakes of different magnitudes in Southwest China.

TABLE 3. Assessment results based on the MDT model (for the Ludian-Yiliang evaluated regions).
The strong correlation between the trafficability of road sections and the ELS level is pivotal to the construction method for the rapid assessment of TSR hit by the EL. As discussed above, the model must be constructed under three conditions: 1) The basic unit in the assessment must be a road section. In the assessment process, a road must be divided into sections and should not be simply taken as a unit. 2) The buffer zones on both sides of road sections must be extended by 180 m and not created at both ends of a road. The value of 180 m was determined using the horizontal projection distance of EL in the Wenchuan earthquake. 3) The ELS level uses the 90 m × 90 m raster data. Moreover, the data of landslide sensitivity is obtained by taking intensity as a parameter for the influence of ground motion. The landslide sensitivity is divided into five levels, and the attribute values of the cells for landslides are correspondingly 1–5. In the end, the efficacy of this method may vary if any of these conditions are altered, e.g., using a different basic unit for the assessment, changing the distance or way of buffering, or abandoning the 90 m × 90 m raster data of the sensitivity levels.
While developing the rapid assessment method for TSR hit by the EL, road sections are demarcated since they are the basic element connecting two nodes in a road network. Theoretically, a road section fails to serve as a transport medium between two nodes if it is interrupted at any position. However, a problem still needs to be addressed, that is, different lengths of road sections. In other words, the total number of cells at the landslide sensitivity levels in the buffer zones varies with road sections, which inevitably causes the error of the model. In this study, a rapid assessment method is uniformly developed for expressways, national highways, and provincial highways. This may lead to a simplified process of modeling that could reduce the calculation of RT in the rapid assessment but increase the relative error of the assessment results. If the unified geometric attributes are used for the assessed units and different models are developed for different types of highways, the assessment accuracy of the model may be further improved.
The correlation between the trafficability of road sections hit by the EL and the attribute of ELS level can be described with different models. In this study, only the MDT model has been employed to illustrate the correlation between the trafficability of the roads hit by the EL and the number of cells at different ELS levels. It has also been compared with the existing C4.5 model. Different models may generate different assessment results. Therefore, it is necessary to develop different models and select the more effective one.
As a preliminary attempt, the method is constructed for the Wenchuan evaluated region and then applied in the Ludian-Yiliang evaluated regions. It is proved that the proposed rapid assessment method for TSR hit by the EL is effective when road sections are taken as the basic unit in the assessment. Moreover, it is also endorsed for the rapid assessment of earthquake-induced losses and the risk prediction of earthquakes in other mountainous areas. The proposed method is basically a machine learning method. Taking a larger sample size or a larger evaluated region may further lower the error of the assessment results with the method. Nevertheless, the method may experience a larger relative error in the assessment of TSR hit by the EL if the earthquake in the evaluated region has a lower magnitude or affects a narrower range. This situation must be attributed to the discrete lengths of road sections and other occasional factors.
The proposed method for the rapid assessment of TSR hit by the EL is an exploratory effort to address the lack of assessment methods for the trafficability of roads subjected to earthquake-induced geological disasters. This effort is made to quantitatively calculate the spatial distribution of post-earthquake interruptions on the roads caused by EL. Therefore, it is possible to develop a reasonable traffic control strategy and initiate the necessary air support promptly. The method can be further improved and expanded after overcoming some shortcomings related to the sufficiency of data of road interruptions caused by EL in past earthquakes, the currency—the degree to which the data is current—of basic data, and the diversity of models and methods.
The rapid assessment results of the spatial distribution of TSR significantly affect the regional planning for alleviating earthquake-induced disasters and the emergency rescue decision-making for reducing the losses caused by earthquake-induced disasters. The southwestern region of China is characterized by high mountains and steep slopes due to which it is vulnerable to the direct impacts of ground motion. Moreover, earthquake-induced geological hazards are also important factors causing the interruption of roads in the region. In this paper, a rapid method for assessment of the trafficability of sections in the roads hit by the EL based on GIS and MDT is proposed to assess the trafficability of the roads affected by earthquake-induced disasters. The method is constructed in three basic steps. The first step is to define the road section as the basic unit of assessment. In the second step, ELA is assigned to road sections. The numbers of cells at different landslide sensitivity levels within the 180 m buffer zones on both sides of road sections are calculated and taken as the ELA. The third step is to calculate the trafficability of road sections using the MDT model for the correlation between the ELA of road sections and their trafficability. The calculation results are employed in a GIS for mapping the spatial distribution of trafficable road sections in the evaluated region.
In this study, the 2008 Wenchuan Ms 8.0 earthquake-stricken region in Sichuan was selected together with two regions with similar natural and geographical environments, including the 2014 Ludian Ms 6.5 earthquake-stricken region in Yunnan, and the 2012 Yiliang Ms 5.6 and Ms 5.7 earthquakes-stricken region in Yunnan. These evaluated regions were used to develop the rapid assessment method for TSR hit by the EL and build the corresponding model. The Sichuan evaluated region was used to construct the model and test its reasonableness, while the Ludian-Yiliang evaluated regions in Yunnan were employed to evaluate the extensibility and applicability of the model. The model constructed for the Wenchuan evaluated region had a p-value of 2.52×10−203 (much lower than 0.001). The overall correctness rate of the model for identifying the trafficable road sections in the assessment reached 98.50%. The kappa coefficient was 0.91, indicating the almost perfect consistency between the assessment results and the actual condition. The road sections that were identified as trafficable but were interrupted by EL took up only 0.958% of these road sections, while the road sections that were evaluated as un-trafficable and were in fact interrupted by EL were 12.3 times as high as other road sections. This revealed that the RT calculated using the MDT model for the Wenchuan evaluated region was a good indicator for whether road sections were interrupted by EL. The MDT model was compared with the C4.5 decision tree to prove its wider applicability, higher differential significance (i.e., higher statistical significance), as well as higher kappa coefficient (higher consistency and overall correctness rate). When the constructed method and model were applied in the Ludian–Yiliang evaluated regions, the assessment results showed a p-value of 9.7×10−107 and an overall correctness rate of 99.67%. The kappa coefficient was 0.81, falling into the range of 0.81–1 so the assessment results given by the model were almost perfectly consistent with the actual condition. Moreover, the road sections that were assessed to be trafficable but were interrupted by EL accounted for only 1.31% of these road sections, while the road sections that were identified as un-trafficable but were interrupted by EL were 5.2 times as high as other road sections. The results of the Ludian–Yiliang evaluated regions proved that the calculated trafficability was a good indicator for whether road sections were interrupted by landslides. With some acceptable error, the constructed method can be used to rapidly assess the trafficability of the roads according to EL for different magnitudes of earthquakes and in a wider range of similar natural and geographical environments in Southwest China.
The original contributions presented in the study are included in the article/Supplementary Material, further inquiries can be directed to the corresponding authors.
XB: Formal Analysis, Funding acquisition, Investigation, Methodology, Writing–original draft, Writing–review and editing. YD: Data curation, Software, Writing–review and editing. QZ: Investigation, Writing–review and editing. ZY: Methodology, Supervision, Writing–review and editing.
The authors declare financial support was received for the research, authorship, and/or publication of this article. This work was supported financially by the Key Research and Development Plan of Yunnan Province: The Technology of the Comprehensive Risk Assessment of the Earthquake Catastrophe and the Disaster Chains in Yunnan and Its Application (No. 202203AC100003), the Youth Academic and Technical Leaders Reserve Talent Project of 2023 in Yunnan Province, and the Seismic Spark Scientific program of China Earthquake Administration (XH222509C and XH23003C).
The authors thank Prof. YE Liaoyuan for meticulous guidance on the exploration and thesis research work. They also would like to thank Prof. SHI Zhengtao for the warm help in revising the paper format. The authors thank the reviewers for their constructive suggestions to improve the article.
The authors declare that the research was conducted in the absence of any commercial or financial relationships that could be construed as a potential conflict of interest.
All claims expressed in this article are solely those of the authors and do not necessarily represent those of their affiliated organizations, or those of the publisher, the editors and the reviewers. Any product that may be evaluated in this article, or claim that may be made by its manufacturer, is not guaranteed or endorsed by the publisher.
An, J. W., Bai, X. F., Xu, J. H., Nie, G. Z., and Wang, X. Y. (2015). Prediction of highway blockage caused by earthquake-induced landslides for improving earthquake emergency response. Nat. Hazards 79 (1), 511–536. doi:10.1007/s11069-015-1859-7
Bai, X. F., Dai, Y. Q., Yu, Q. K., and Shao, W. L. (2015). Risk assessment modeling of earthquake-induced landslides and its preliminary application. J. Seismol. Res. (in Chinese) 38 (2), 301–312.
Bai, X. F., Dai, Y. Q., and Zhao, H. (2014). Study on the emergency evaluation of earthquake influence field. Journal of Natural Disasters (in Chinese) 23 (4), 91–102. doi:10.13577/J.JND.2014.0413
Bai, X. F., Nie, G. Z., Dai, Y. Q., Yu, Q. K., Luo, W. D., and Ye, L. Y. (2021). Modeling and testing earthquake-induced landslide casualty rate based on a grid in a kilometer scale: Taking the 2014 Yunnan Ludian Ms6.5 earthquake as a case. J. Seismol. Res. 44 (1), 87–95 [in Chinese]. doi:10.3969/j.issn.1000-0666.2021.01.012
Capolongo, D., and Mankelow, R. J. (2002). Evaluating earthquake-triggered landslide hazard at the basin scale through gis in the upper sele river valley. Surveys in Geophysics. doi:10.1023/A:1021235029496
Chang, Y. M. (2013). Study on emergency evaluation to damaged roads and its application based on UAV image in the earthquake area. Chengdu, China: Southwest Jiaotong University. doi:10.7666/d.Y2319094
Chousianitis, K., Del Gaudio, V., Kalogeras, I., and Ganas, A. (2014). Predictive model of arias intensity and newmark displacement for regional scale evaluation of earthquake-induced landslide hazard in Greece. Soil Dynamics and Earthquake Engineering 65, 11–29. doi:10.1016/j.soildyn.2014.05.009
Dai, Y. Q., Bai, X. F., Nie, G. Z., and Huangfu, G. (2022). A rapid assessment method for earthquake-induced landslide casualties based on GIS and logistic regression model. Geomatics, Natural Hazards and Risk 13 (1), 222–248. doi:10.1080/19475705.2021.2017022
Gaudio, V. D., Pierri, P., and Calcagnile, G. (2012). Analysis of seismic hazard in landslide-prone regions: criteria and example for an area of Daunia (southern Italy). Natural Hazards 61 (1), 203–215. doi:10.1007/s11069-011-9886-5
Havenith, H. B., Strom, A., Caceres, F., and Pirard, E. (2006). Analysis of landslide susceptibility in the Suusamyr region, Tien Shan: statistical and geotechnical approach. Landslides 3 (1), 39–50. doi:10.1007/s10346-005-0005-0
James, N., and Sitharam, T. G. (2013). Assessment of seismically induced landslide hazard for the state of Karnataka using GIS technique. Journal of the Indian Society of Remote Sensing 42, 73–89. doi:10.1007/s12524-013-0306-z
Jibson, R. W. (2007). Regression models for estimating coseismic landslide displacement. Engineering Geology 91 (2-4), 209–218. doi:10.1016/j.enggeo.2007.01.013
Kamp, U., Growley, B. J., Khattak, G. A., and Owen, L. A. (2008). GIS-based landslide susceptibility mapping for the 2005 Kashmir earthquake region. Geomorphology 101 (4), 631–642. doi:10.1016/j.geomorph.2008.03.003
Kamp, U., Owen, L. A., Growley, B. J., and Khattak, G. A. (2010). Back analysis of landslide susceptibility zonation mapping for the 2005 Kashmir earthquake: an assessment of the reliability of susceptibility zoning maps. Natural Hazards 54 (1), 1–25. doi:10.1007/s11069-009-9451-7
Lan, R., Feng, B., Wang, Z. B., Clarkson, W. A., and Ibsen, M. (2009). Single frequency Tm-doped fibre DBR laser at 1943 nm. World Earthquake Engineering 25 (002), 81–87. doi:10.1109/CLEOE-EQEC.2009.5194697
Liu, F. M., Zhang, L. H., Liu, H. Q., and Zhang, Y. C. (2006). Assessment of secondary geological hazard of earthquake in China. Journal of Geomechanics (in Chinese) 12 (2), 127–131. doi:10.3969/j.issn.1006-6616.2006.02.00
Ma, S. Y., Qiu, H. J., Zhu, Y. R., Yang, D. D., Tang, B. Z., Wang, D. Z., et al. (2023). Topographic changes, surface deformation and movement process before, during and after a rotational landslide. Remote Sensing 15, 662. doi:10.3390/rs15030662
Murthy, S. K., Kasif, S., and Salzberg, S. (1994). A system for induction of oblique decision trees. Journal of Artificial Intelligence Research 2, 1–32. doi:10.1613/jair.63
Ouyang, Y. (2013). Earthquake tests China's emergency system. The Lancet 381, 1801–1802. doi:10.1016/s0140-6736(13)61105-8
Pei, Y. Q., Qiu, H. J., Zhu, Y. R., Wang, J. D., Yang, D. D., Tang, B. Z., et al. (2023). Elevation dependence of landslide activity induced by climate change in the eastern Pamirs. Landslides 20, 1115–1133. doi:10.1007/s10346-023-02030-w
Qiu, H. J., Zhu, Y. R., Zhou, W. Q., Sun, H. S., He, J. Y., and Liu, Z. J. (2022). Influence of DEM resolution on landslide simulation performance based on the Scoops3D model. Geomatics, Natural Hazards and Risk 13 (1), 1663–1681. doi:10.1080/19475705.2022.2097451
RajabiKhamehchiyanMahdavifarGaudioCapolongo, A. M. M. M. R. V. D. D. (2013). A time probabilistic approach to seismic landslide hazard estimates in Iran. Soil Dynamics and Earthquake Engineering 48 (1), 25–34. doi:10.1016/j.soildyn.2012.09.005
Su, Y. J., and Qin, J. Z. (2001). Strong earthquake activity and relation to regional neotectonic movement in Sichuan-Yunnan region. Earthquake Research in China (in Chinese) 17 (1), 24–34.
Tang, C., Zhu, J., and Zhang, X. R. (2001). GIS based earthquake triggered landslide hazard prediction. Journal of Seismological Research (in Chinese) 24 (1), 73–81.
Tao, S., Hu, D. Y., Zhao, W. J., Fan, Y. D., and Wang, Z. H. (2010). Susceptibility assessment of secondary landslides triggered by earthquakes: a case study of northern Wenchuan. Geographical Research (in Chinese) 29 (9), 1594–1605. doi:10.11821/yj2010090006
Wang, L. Y., Qiu, H. J., Zhou, W. Q., Zhu, Y. R., Liu, Z. J., Ma, S. Y., et al. (2022). The post-failure spatiotemporal deformation of certain translational landslides may follow the pre-failure pattern. Remote Sensing 14, 2333. doi:10.3390/rs14102333
Wang, X., Nie, G. M., Ma, M., Chen, T., Sun, Y., Qin, X., et al. (2012). CD4-CD8-T cells contribute to the persistence of viral hepatitis by striking a delicate balance in immune modulation. Acta Seismologica Sinica 34 (1), 76–84. doi:10.1016/j.cellimm.2012.11.010
Wang, X. Y., Nie, G. Z., and Wang, S. (2011). Evaluation criteria of landslide hazards induced by Wenchuan earthquake using fuzzy mathematical method. Rock and Soil Mechanics 32 (2), 403–410. doi:10.3724/SP.J.1011.2011.00181
Xu, C., Dai, F. C., Xu, X. W., and Lee, Y. H. (2012a). GIS-based support vector machine modeling of earthquake-triggered landslide susceptibility in the Jianjiang River watershed, China. Geomorphology 145-146, 70–80. doi:10.1016/j.geomorph.2011.12.040
Xu, C., Xu, X. W., Dai, F. C., Wu, Z. D., He, H. L., Shi, F., et al. (2013). Application of an incomplete landslide inventory, logistic regression model and its validation for landslide susceptibility mapping related to the May 12, 2008 Wenchuan earthquake of China. Natural Hazards 68 (2), 883–900. doi:10.1007/s11069-013-0661-7
Xu, C., Xu, X. W., Dai, F. C., Xiao, J. Z., Tan, X. B., and Yuan, R. M. (2012c). Landslide hazard mapping using GIS and weight of evidence model in Qingshui River watershed of 2008 Wenchuan earthquake struck region. Journal of Earth Science 23 (1), 97–120. doi:10.1007/s12583-012-0236-7
Xu, C., Xu, X. W., Fan, M., Xin, W., and Hu, Y. (2012b). A genome-wide transcriptome profiling reveals the early molecular events during callus initiation in Arabidopsis multiple organs. Geological Science and Technology Information (in Chinese) 31 (3), 116–124. doi:10.1016/j.ygeno.2012.05.013
Xu, C., Xu, X. W., Yao, X., and Dai, F. C. (2014). Three (nearly) complete inventories of landslides triggered by the May 12, 2008 Wenchuan Mw 7.9 earthquake of China and their spatial distribution statistical analysis. Landslides 11 (3), 441–461. doi:10.1007/s10346-013-0404-6
Xu, C., Xu, X. W., Zhou, B. G., and Shen, L. L. (2019). Probability of co-seismic landslides: A new generation of earthquake-triggered landslide hazard model. J. Eng. Geol. 27 (5), 1122–1130 [in Chinese]. doi:10.13544/j.cnki.jeg.201908
Yang, Z. Q., Chen, M., Zhang, J., Ding, P., He, N., and Yang, Y. (2023b). Effect of initial water content on soil failure mechanism of loess mudflow disasters. Frontiers in Ecology and Evolution 11. doi:10.3389/fevo.2023.1141155
Yang, Z. Q., Wei, L., Liu, Y. Q., He, N., Zhang, J., and Xu, H. H. (2023a). Discussion on the relationship between debris flow provenance particle characteristics, gully slope, and debris flow types along the Karakoram highway. Sustainability 15, 5998. doi:10.3390/su15075998
Yang, Z. Q., Xiong, J. F., Zhao, X. G., Meng, X. R., Wang, S. B., Li, R., et al. (2023c). Column-Hemispherical penetration grouting mechanism for Newtonian fluid considering the tortuosity of porous media. Processes 11, 1737. doi:10.3390/pr11061737
Zhang, F. H., Du, H. G., Deng, S. R., Fan, K. L., Dai, W., Liu, W. H., et al. (2022). Assessment of earthquake hazard risk based on township units: a case study of Jianshui County, Yunnan Province. Journal of Seismological Research (in Chinese) 45 (1), 109–115.
Zhao, X. G., Yang, Z. Q., Meng, X. G., Wang, S. B., Li, R., Xu, H. H., et al. (2023). Study on mechanism and verification of columnar penetration grouting of Time-Varying Newtonian Fluids. Processes 11, 1151. doi:10.3390/pr11041151
Keywords: rapid assessment, road trafficability, earthquake-induced landslides, multivariate decision tree, model
Citation: Bai X, Dai Y, Zhou Q and Yang Z (2023) An MDT-based rapid assessment method for the spatial distribution of trafficable sections of roads hit by earthquake-induced landslides. Front. Earth Sci. 11:1287577. doi: 10.3389/feart.2023.1287577
Received: 02 September 2023; Accepted: 04 October 2023;
Published: 18 October 2023.
Edited by:
Haijun Qiu, Northwest University, ChinaCopyright © 2023 Bai, Dai, Zhou and Yang. This is an open-access article distributed under the terms of the Creative Commons Attribution License (CC BY). The use, distribution or reproduction in other forums is permitted, provided the original author(s) and the copyright owner(s) are credited and that the original publication in this journal is cited, in accordance with accepted academic practice. No use, distribution or reproduction is permitted which does not comply with these terms.
*Correspondence: Xianfu Bai, MjgyOTYxMzk0QHFxLmNvbQ==; Zhiquan Yang, eXpxMTk4MzgxNkBrdXN0LmVkdS5jbg==
Disclaimer: All claims expressed in this article are solely those of the authors and do not necessarily represent those of their affiliated organizations, or those of the publisher, the editors and the reviewers. Any product that may be evaluated in this article or claim that may be made by its manufacturer is not guaranteed or endorsed by the publisher.
Research integrity at Frontiers
Learn more about the work of our research integrity team to safeguard the quality of each article we publish.