 Li Shuguang
 Shen Yanjun2,3*
95% of researchers rate our articles as excellent or good
Learn more about the work of our research integrity team to safeguard the quality of each article we publish.
Find out more
ORIGINAL RESEARCH article
Front. Earth Sci. , 29 December 2023
Sec. Geohazards and Georisks
Volume 11 - 2023 | https://doi.org/10.3389/feart.2023.1283520
This article is part of the Research Topic Risk Assessment, Stability Monitoring, and Safe Design for Deep Rock Engineering View all 20 articles
Due to the unique high-altitude geological conditions of the railway in the cold region, the problem of high ground stress in the construction process is very prominent. In constructing high ground stress tunnels, accurately evaluating the surrounding rock grades is important in rock mass engineering. Based on this, based on a plateau tunnel under construction, this paper selects the classification index of the surrounding rock, which can accurately reflect the geological characteristics of high ground stress tunnel around the geological environment elements of the surrounding rock of high ground stress tunnel. Based on the rapid classification method of surrounding rock of the BP neural network, the classification method of the surrounding rock suitable for high ground stress tunnel is constructed, and the tunnel engineering data is introduced into the BP neural network classification method of surrounding rock for training and testing. It is found that the classification results of surrounding rock obtained by the classification method of surrounding rock of high ground stress tunnel are in good agreement with the actual situation, which provides an important guarantee for the accurate and rapid determination of the surrounding rock grade of high ground stress tunnel and the safe and efficient construction of the tunnel.
Due to its unique high-altitude geological conditions, the problem of high ground stress during the construction of railways in cold regions is very prominent. In the construction of a high ground stress tunnel, the accurate evaluation of the surrounding rock level is an important issue in rock engineering. At this stage, the method of tunnel rock classification has been developed to the semi-quantitative or quantitative classification stage with multiple indicators. Among them, the internationally standard methods are the RMR method (Bieniawski, 1973), Q method (BartonLien and Lunde, 1974), GSI method (Sonmez and Ulusay, 1999), and RMi method (PALMSTRÖM, 1995). The commonly used methods in China are the national standard BQ method (GB 50218-2014, 2015) and hydropower system HC method (GB 50287-2006, 2006), while the classification method of surrounding rock of highway and railway tunnels basically refers to the BQ method and local optimization is carried out according to the characteristics of highway and railway tunnels. Regarding the use of surrounding rock grading methods, GB50218-2015“Engineering Rock Mass Grading Standards” (i.e., BQ method) suggests that when evaluating the surrounding rock quality of tunnel engineering, a variety of surrounding rock classification methods should be used to comprehensively compare and finally determine the surrounding rock grade. However, at present, the problems in the actual use of the above surrounding rock grading methods are: 1) the geological characteristics such as high geostress and rock burst prominently in high geostress tunnels cannot be fully considered; 2) Some evaluation indicators and values in the classification method mostly rely on subjective determination, which is closely related to the geological identification skills of on-site personnel, resulting in doubts about the reliability of the results; 3) The evaluation results of different surrounding rock classification methods are often inconsistent, resulting in blindness in the selection of actual identification results. The core reason for the above problems is that the internal correlation of the evaluation indicators of each method is not systematically summarized from the core of the evaluation index of each surrounding rock classification method, and the application conditions of each method are not paid attention to.
With the development of artificial intelligence, the rapid acquisition and identification of surrounding rock grading evaluation indicators through artificial intelligence methods and then overcoming the subjectivity of evaluation index assignment has become a new development direction of surrounding rock grading. In recent years, “artificial intelligence+” has also been initially applied in the field of surrounding rock grading methods, mainly including K-fold cross-verification (Wang et al., 2021), support vector machine (Tian S. M. et al., 2021), machine learning and reliability algorithm (Zheng et al., 2019), LIBSVM algorithm (He, 2019), two-dimensional cloud model and Apriori algorithm (Xue et al., 2020), comprehensive decision cloud model (Zhou et al., 2020), interval number comprehensive hierarchical cloud optimization theory model (Lu, 2020), TSP and PCA-Bayes method (Lv et al., 2020), normal cloud theory (Liang et al., 2021), multi-factor extendable matter element method (Tian F. F. et al., 2021), DE-BP model (Zhang et al., 2021), KNN method (Ma et al., 2020), entropy weight method (Zhang, 2022) and BP neural network algorithm (Zhou et al., 2005) are introduced into the traditional surrounding rock grading work, aiming to reduce the subjective blindness in the surrounding rock grading process and improve the reliability of the surrounding rock grading results. In addition, considering the complexity of on-site surrounding rock information collection, the artificial intelligence image recognition method is used to realize the acquisition, preprocessing, feature extraction, classification design and classification decision of surrounding rock information, which provides a reliable means to greatly improve the collection efficiency of surrounding rock information. Artificial intelligence image recognition technology has gradually been applied to a certain extent (Liu et al., 2005; Yi et al., 2021). However, it should be pointed out that there is still a lot of space for the cross-application of “artificial intelligence+” in the field of surrounding rock classification of underground engineering, and it is still urgent to explore the applicability and integration of artificial intelligence methods in the field of surrounding rock information collection, identification, and post-processing.
It can be seen that an efficient and accurate grading method for surrounding rock that is fully suitable for the geological characteristics of a high ground stress tunnel has not yet been formed. Therefore, based on a tunnel under construction, this paper selects the classification index of the surrounding rock, which can accurately reflect the geological characteristics of a high ground stress tunnel around the geological environment characteristics of the surrounding rock of high ground stress tunnel. Based on the rapid classification method of surrounding rock of the BP neural network, the classification method of surrounding rock suitable for high ground stress tunnel is constructed, and the tunnel engineering data is introduced into the BP neural network classification method of surrounding rock for training and testing. It is found that the classification results of surrounding rock obtained by the classification method of surrounding rock of high ground stress tunnel are in good agreement with the actual situation, which provides an important guarantee for the accurate and rapid determination of the surrounding rock grade of high ground stress tunnel and the safe and efficient construction of the tunnel.
The cold region railway under construction in China is affected by geological conditions such as topography and landform, passing through several mountains above 3,000 m above sea level, with a bridge-tunnel ratio of 94.76, of which ultra-long deep-buried tunnels account for 62.6% of the length of the main line, which is a typical plateau tunnel (Peng et al., 2020; Tian S. M. et al., 2021; Xie et al., 2022). At present, many scholars have studied the geological characteristics of plateau endowment along the cold region railway; for example, Hong Kairong (Hong, 2020) believes that in ultra-long deep-buried tunnels, high geostress, and rock bursts have natural advantages. Academician Peng Jianbing proposed that the railway in the cold region is facing strong geological tectonic movement, the tectonic stress is very prominent, and the rock burst formed by high ground stress and excavation disturbance seriously affects the safety of tunnel construction and operation. Academician Xie Heping (Hong, 2020; Xie et al., 2022) believes that the surrounding rock of deep buried tunnels is widely present in high geostress and complex coupled geological environments, which derives the problem of rock burst with a more complex breeding mechanism, and it is urgent to explore the surrounding rock grading method that meets the geological environment such as high ground stress and includes efficient determination of rock burst. Therefore, based on the two plateau geological characteristics of high ground stress and rock burst, this paper explores the surrounding rock classification system suitable for plateau tunnels.
In the plateau tunnel, the high geostress factor of the rock mass is an important factor affecting the stability of the surrounding rock. The excessive stress of the surrounding rock may cause problems such as collapse and rock burst, which seriously affects the safety of the project (Xue et al., 2019; Yan et al., 2020). During the tunnel excavation, the stress environment of the rock mass will change, and the initial stress of the rock mass will show a dynamic equilibrium state with time. When this equilibrium reaches its limit, the rock mass will become unstable (Duan et al., 2017; Tian et al., 2022). Therefore, it is of great significance to accurately classify the in-situ stress level and make a reasonable support plan for construction and operation safety. At present, the widely used in-situ stress grading method in China comes from the Code for Geological Investigation of Hydroelectric Power Engineering (GB 50287–2016), which divides the in-situ stress into four grades according to Table 1.
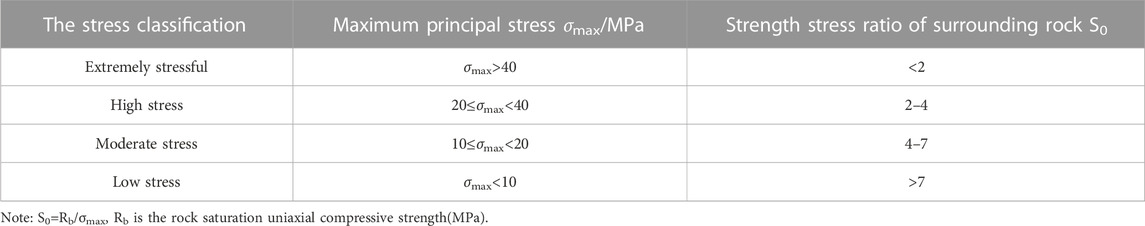
TABLE 1. In-situ stress classification table.
When underground engineering excavation is carried out in the rock mass with high geostress, the excavation and unloading action will cause a high concentration of the stress of the surrounding rock, and the elastic strain energy will accumulate in the rock mass when the stress stored in the surrounding rock exceeds its bearing capacity, the elastic strain energy is released instantaneously, and the surrounding rock is deformed and damaged, and the crushed rock is thrown down, which poses a great threat to construction safety (Gu et al., 2002; Tian Q. F. et al., 2021). However, the creation of a rockburst has two necessary conditions (Shang et al., 2013).
(1) Lithologic conditions
Generally, in the brittle rock mass, the higher the strain energy accumulated by the rock mass, the greater the possibility of rock bursting. The lithological conditions can be judged by the uniaxial compressive test of the rock block, and the judgment formula is shown in Eq. 1.
Formula: Vε1 represents the strain energy accumulated before the rock mass fails; Vε2 represents the strain energy consumed after the rock block has failed.
(2) Stress conditions
There are two ways to determine the stress conditions that produce rock bursts. First, the ratio of the maximum circumferential stress of the chamber rock wall to the uniaxial compressive strength of the rock mass is determined. The second is determined by the ratio of the maximum principal stress of the rock mass in the natural state to the uniaxial compressive strength of the rock mass (Liang and ZHAO, 2022). Dolchaninov of the former Soviet Union investigated the rock burst situation at the local Xiping mine and came up with the identification method, as shown in Table 2 (Guo and Liu, 2018). In the table, σθ represents the maximum circumferential stress of the chamber; σc indicates the uniaxial compressive strength of the rock.

TABLE 2. Table of circumferential stress criteria for Turchaninov rock burst.
In China, according to the statistics of a large number of underground chamber engineering cases, it is found that when the stress of the rock mass meets Eq. 2, rock bursts will occur. And formed a corresponding rock burst classification table (Xu et al., 2002) (Table 3).
where σ1 represents the maximum principal stress; σc indicates the uniaxial compressive strength of the rock.

TABLE 3. Rockburst classification table.
Based on the above geological characteristics of high geostress and rockburst in plateau tunnels, the factors affecting the grade of surrounding rock are divided into basic factors and additional factors, and an integrated rapid grading system of surrounding rock is formed. The classification index of basic factors was taken from the RMR method and BQ method, and the in-situ stress and rock burst were selected as the classification indicators of additional factors, which mainly reflected the geological characteristics of the plateau tunnel occurrence environment. The hierarchical division of plateau tunnels according to this method is shown in Table 4.
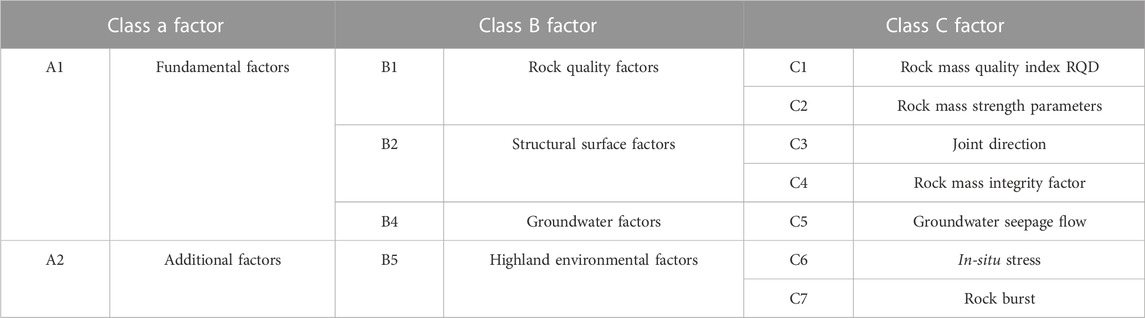
TABLE 4. Classification of surrounding rock of plateau tunnel.
The parameter selection of the integrated surrounding rock grading method of plateau tunnel should reflect the accuracy of surrounding rock classification and the unique geological characteristics of the plateau tunnel. Based on the study of various grading methods and the attributes of plateau tunnels, seven grading parameters were finally selected: RQD, rock mass strength parameters, rock mass integrity coefficient, joint direction, groundwater seepage, in-situ stress, and rock burst. Among them, the rock mass quality index RQD, rock mass strength parameters, rock mass integrity coefficient, joint direction, and groundwater seepage mainly refer to the RMR grading method and BQ classification method. The in-situ stress and rock burst parameters mainly refer to the Code for Geological Investigation of Hydroelectric Power Engineering (GB 50287–2016) and the rock burst grade classification table based on China’s engineering experience.
Among all parameters, RQD, rock integrity coefficient (Kv), groundwater seepage, in-situ stress, and rock burst are directly calculated under their corresponding standards, and the rock integrity coefficient (Kv) is calculated according to Eq. 3. Groundwater seepage takes water inflow per 10m long tunnel; The in-situ stress takes the maximum principal stress σ1 of the surrounding rock; The ratio of the maximum circumferential stress σθ of the rock burst chamber to the uniaxial compressive strength σc of the rock. The strength and joint direction of the complete rock were obtained according to the RMR method.
(1) Rock mass strength parameters
The compressive strength of rock is one of the basic mechanical properties, which has an important influence on the classification and quality of rock. For a long time, the uniaxial compressive strength of rocks has been used as a rock classification standard to evaluate rock quality and stability. In addition, the point load test can also be used to determine the uniaxial strength of the rock, and the point load test has low requirements for the production of the rock. This is a fast, cost-effective and effective on-site method for determining rock strength, which has been widely used in rock mass grading, and can calculate the strength of rock block point loads according to the “Recommended Method for Determining Point Load Strength” revised by the International Society of Rock Mechanics in 1985. Table 5 shows the correspondence between the point load strength index of rock mass strength parameters and the uniaxial compressive strength of rock in the RMR surrounding rock grading method. Due to the low strength of the tunnel rock mass, the uniaxial compressive strength is selected as the input value of the rock mass strength.
(2) Rock mass integrity coefficient
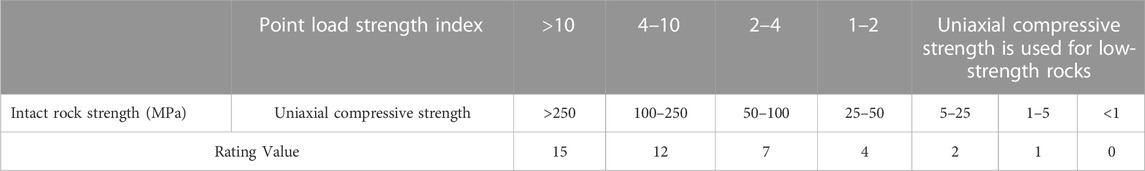
TABLE 5. Rock mass strength parameters by RMR grading method.
The integrity of the rock mass mainly refers to the degree of cutting of the rock mass by the structural surface, the size of the unit block, and the bonding state between the blocks. Therefore, the integrity of the rock mass is related to the geometric characteristics and properties of the structural surface, that is, it is determined by the density, number of groups, production elongation, opening, roughness, undulation, filling situation, and filling properties of the structural surface. The rock integrity coefficient can reflect the structural characteristics of the rock mass. In the surrounding rock grading method, the rock mass integrity coefficient is one of the important parameters commonly used in the surrounding rock grading. In engineering construction, the integrity coefficient of rock mass is relatively easy to obtain and can be expressed by the square of the ratio of the longitudinal wave velocity of the rock mass to the longitudinal wave velocity of the rock block (Eq. 3). In addition, the joint number Jv per unit volume of rock mass can also be used to reflect the integrity of rock mass.
Formula: Kv is the rock mass integrity coefficient; Vpm is the longitudinal wave velocity of the rock mass; Vpr is the longitudinal wave velocity of the rock block.
According to the different values of the rock mass integrity coefficient, the surrounding rock can be divided into five grades, as shown in Table 6.
(3) Joint direction
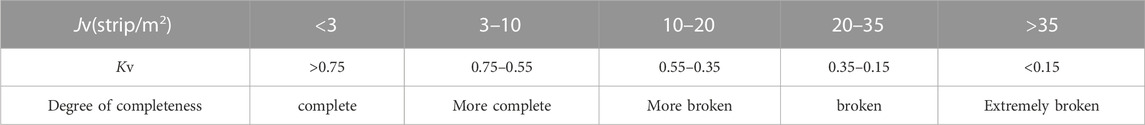
TABLE 6. Table of rock mass integrity coefficients.
In the surrounding rock grading method of the tunnel, the strike of structural surface joints and the direction of the tunnel axis are also the factors affecting the surrounding rock grade. This influencing factor is covered in commonly used grading methods. According to the evaluation relationship between the joint trend of the structural surface and the axis direction of the tunnel, the values of the joint direction parameters are determined according to Table 7 after referring to the RMR grading method.
(4) Groundwater seepage

TABLE 7. Table of section direction parameters.
The development of groundwater reflects the environmental status of rock mass accumulation because groundwater can soften the surrounding rock, erode the filling of the surrounding rock structure, reduce the supporting effect of the surrounding rock, etc., so groundwater is regarded as one of the main factors affecting the stability of the surrounding rock. The groundwater seepage input parameters are entered as a numerical value of the inflow of water per 10 m long tunnel, as shown in Table 8.
(5) In-situ stress
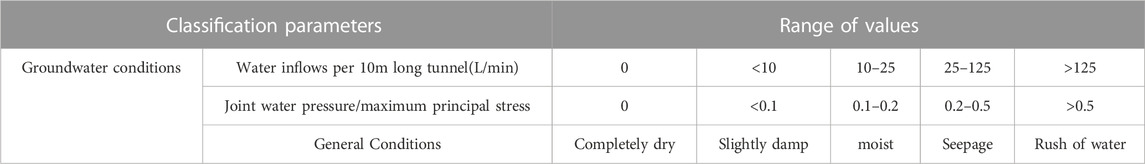
TABLE 8. Groundwater conditions classification table (RMR).
In-situ stress is the stress present inside the earth’s crust. In-situ stress is mainly composed of two parts, one is the gravity caused by the weight of the upper rock, and the other is the tectonic stress transmitted by the surrounding massif. During the excavation of the tunnel, not only the self-weight stress of the surrounding rock will change, but also the tectonic stress. Compared with low altitudes, the surrounding rock of the plateau tunnel has a higher in-situ stress distribution and even has the risk of rock burst, which has a huge impact on the safety of rock mass. Therefore, it is necessary to take the in-situ stress factor into account for the surrounding rock classification of the plateau tunnel. To ensure the convenience and rapidity of classification, the maximum principal stress σ1 of the surrounding rock is taken as one of the classification parameters of the surrounding rock. The parameter inputs for the stress are shown in Table 9.
(6) Rock burst

TABLE 9. Stress parameter input table.
During the excavation of the plateau tunnel, due to the high in-situ stress in the rock mass, the strain energy accumulated by the surrounding rock mass may be released suddenly and violently, resulting in the destruction of the surrounding rock like an explosion. Severe rock bursts can damage tunnels, damage machinery and equipment, and even cause casualties. In the plateau area, the occurrence of rock bursts has an important impact on the stability of the surrounding rock and the way the supporting structure is supported. Therefore, this paper takes the risk of rock burst as one of the influencing parameters of the surrounding rock grade of the plateau tunnel. To make the parameters be recognized by the BP neural network system, the comprehensive evaluation results of rock bursts are converted into dimensionless values between 0 and 1, as shown in Table 10.

TABLE 10. Rockburst parameter input table.
The area where the plateau tunnel is located has complex engineering geological conditions, and there is often a nonlinear mathematical relationship between the parameters affecting the surrounding rock grade. In the stage of exploration and design, due to the limitation of exploration funds and the level of exploration personnel, the classification results of surrounding rock are not accurate enough. In engineering practice, the grade of surrounding rock is generally determined by experienced exploration personnel. With the development of artificial intelligence, neural network technology has gradually improved. The constructed neural network does not need to assume the influence relationship between the parameters. After multiple iterations, the nonlinear relationship between the input vector and the output vector can be accurately mapped. It is reliable to use the neural network to determine the surrounding rock grade. In this chapter, BP neural network is used to establish a surrounding rock classification system suitable for plateau tunnels.
The design of BP network mainly includes the input layer, hidden layer, output layer and transfer function between layers. Most general neural networks predetermine the number of layers of the network, and the BP network can contain different hidden layers. However, it has been proved theoretically that the two-layer BP network can achieve any nonlinear mapping without limiting the number of hidden layer nodes. In the case of relatively few pattern samples, fewer hidden layer nodes can realize the hyperplane division of pattern sample space. This BP neural network training uses a number of single-layer network layers. The structure model of the neural network is shown in Figure 1.
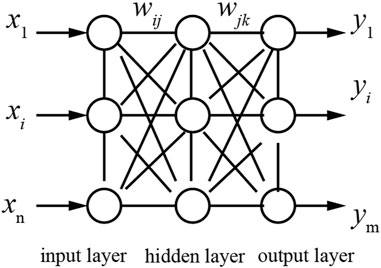
FIGURE 1. Neural network structure model diagram.
In Figure 1, X is the input layer vector, and the input vector is\mathrm{X} = (x1, x2, x3, …, xn); W is the hidden layer vector, and the hidden layer vector is\mathrm{W} = (w1, w2, …, wm)T; Y is the output layer vector, and the output vector is \mathrm{Y} = (y1, y2, …, ym)T. The connection weight matrix from the input layer to the hidden layer node is represented by wij, and the connection weight from the hidden layer to the output layer node is represented by wjk. In the network model of Figure 1, the output vector of the hidden layer is shown in Eq. 4, and the output vector of the output layer is shown in Eq. 5:
In the formula: xi is the input value of the input layer i node; i = 1,2
The input layer acts as a buffer memory, which receives external input data, so the number of nodes depends on the dimension of the input vector. Through the analysis of the influencing factors of the stability of the surrounding rock of the tunnel, combined with the engineering data, seven influencing factors of rock mass quality index RQD, rock uniaxial saturated compressive strength, rock mass integrity index, joint direction, groundwater seepage flow, ground stress and rock burst are selected as the input nodes of the network.
The number of nodes in the output layer depends on two aspects, the output data type and the data size required to represent the type. When the BP network is used for pattern classification, the output results of different patterns are represented in binary form, and the number of nodes in the output layer can be determined according to the pattern to be classified. If the total number of patterns to be classified is m, there are two methods to determine the number of nodes in the output layer.
1) The number of nodes is the total number of patterns to be classified m. At this time, the output of the jth pattern to be classified is (Eq. 6):
That is, the jth node output is 1, and the rest of the output is 0. The rejection is represented by the output of all 0, that is, the input pattern does not belong to any of the patterns to be classified.
2) The number of nodes is
A two-layer BP network with infinite hidden layer nodes can realize any nonlinear mapping from input to output. However, for the mapping from finite input mode to output mode, there is no need for infinite hidden layer nodes, which involves the problem of how to select the number of hidden layer nodes. The complexity of this problem makes it difficult to find a good analytical formula so far. The number of hidden layer nodes is often determined according to the experience of predecessors and their experiments. It is generally believed that the number of hidden layer nodes is directly related to the requirements of solving the problem and the number of input/output units. In addition, too many hidden layer nodes will lead to too long learning time, while too few hidden layer nodes, poor fault tolerance, and low ability to identify unlearned samples, so many factors must be integrated into design.
Hao Zhe and Liu Bin gave the approximate range of the optimal number of hidden layer nodes and optimized the selection according to the system error within this range to obtain the most suitable number of hidden layer nodes. The reference formula for determining the number of hidden layer nodes is (Eqs 7–9):
In the formula: n1 is the number of hidden layer nodes; k is the number of samples; n is the number of input nodes; m is the number of output nodes; C is constant 1–10.
The value of the number of hidden layer nodes between 4 and 13 is appropriate. To accurately determine the number of nodes in the hidden layer, this paper uses the trial and error method to observe the working performance of the neural network, and finally determines that the value of the neural network is 11.
BP neural network is divided into two parts: training and testing. In the training process, the neural network calculates the output of the input learning samples according to the set initial conditions. The weights and thresholds of the network are corrected by the error between the predicted value and the true value. The neural network improves the connection strength between each neuron by continuous learning, and the error between the expected value of the data and the training value of the data will gradually decrease. In the test process, given a new input value of the neural network, the neural network calculates a new classification result.
After the BP neural network of surrounding rock classification of the plateau tunnel is created, the model is trained by using the data in Table 14 until the relative error is less than the set value. The specific operation process is as follows.
(1) Import the data samples to be trained into the BP neural network;
(2) Let the network group the samples and randomly generate a certain proportion of training samples and test samples;
(3) Calculate the output of each neuron node in the hidden layer and the output layer;
(4) Calculate the error between the expected output of the data and the actual output of the network;
(5) Adjust the connection weights of the output layer and the hidden layer in the order from the high level to the low level;
(6) Repeat the process of (3)-(5) until the error meets the requirements.
The training samples of the BP neural network are obtained from the tunnel site survey data and test data. For some missing data, the rock mass environment of the surrounding measuring points is supplemented according to the principle of analogy method. A total of 30 sets of typical data are selected as the training of neural networks. The specific data are shown in Table 11.
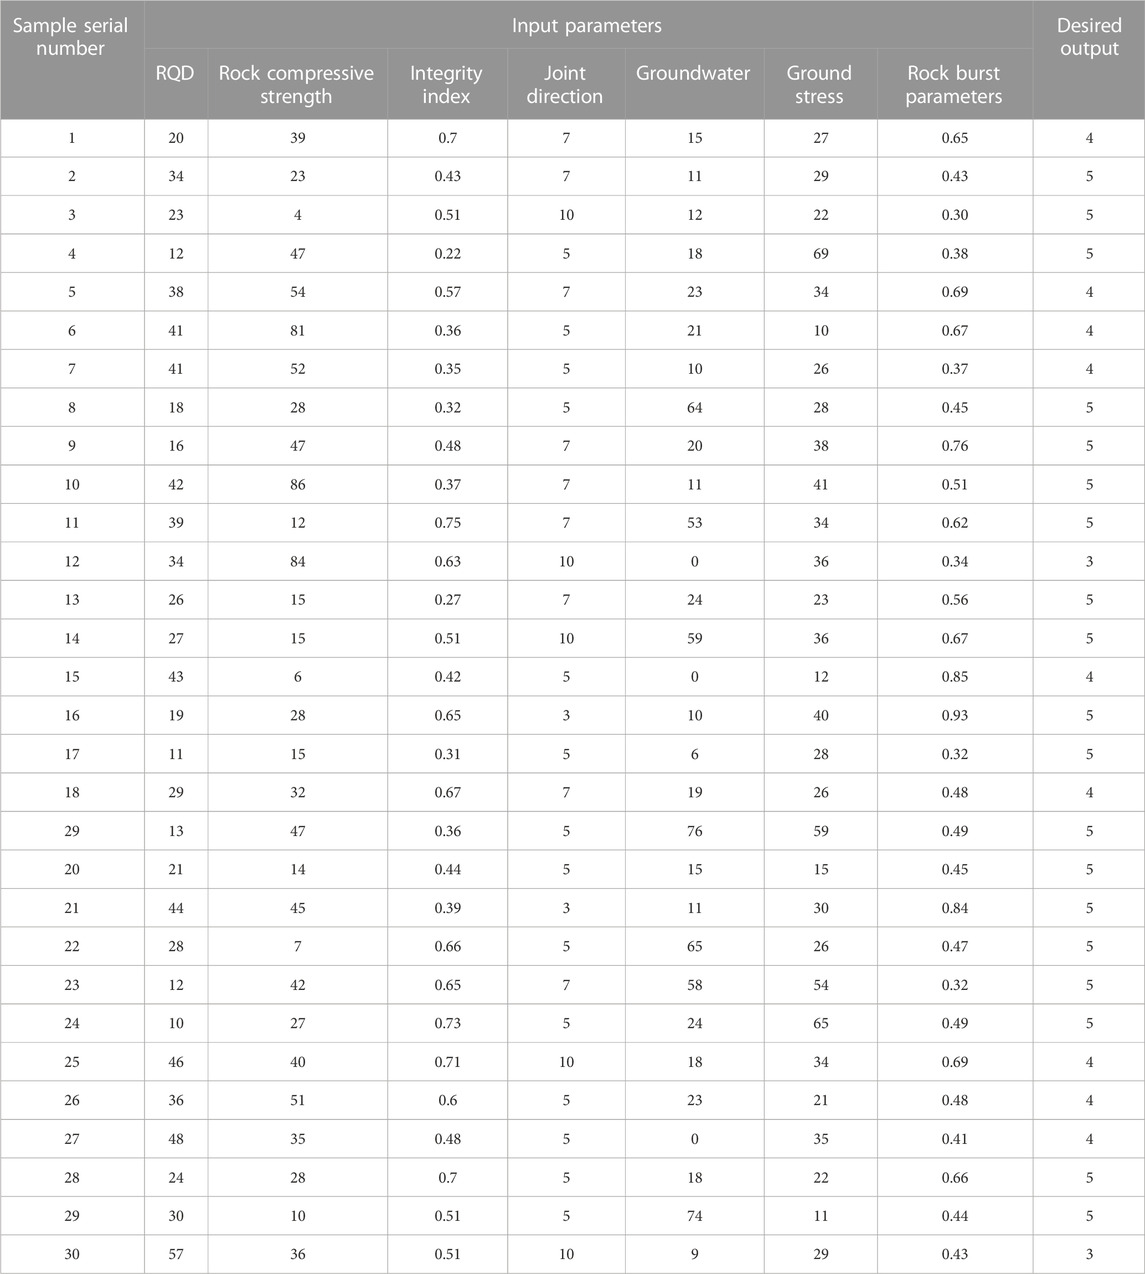
TABLE 11. Neural network training sample data table.
The trained neural network has been repeatedly verified and tested. When the number of hidden layers in the network is 11, the network performs best. The 30 groups of samples were divided into three parts: training set, the validation set, and test set. The training set accounted for 70% of the total sample, that is, 20 groups; validation set accounted for 15% of all samples, namely, 5 groups; the test set accounted for 15% of all samples, namely, 5 groups.
The training method adopts the conjugate gradient method. The comparison between the prediction results of the surrounding rock grade of the network training and the actual results is shown in Figure 2. As shown in Figure 3, the network has gone through 20 iterations. When the network is iterated to the 14th time, the verification error reaches the minimum value of 0.06, which is less than 10–1, and the training error of the network is small enough. The network error histogram is shown in Figure 4. It can be seen from the figure that the error is normally distributed. Most of the data differences are concentrated around the zero error line. There are 25 samples with training errors less than 0.25, and there are 5 training samples with errors less than 0.55. The maximum error of the training sample is 0.54.
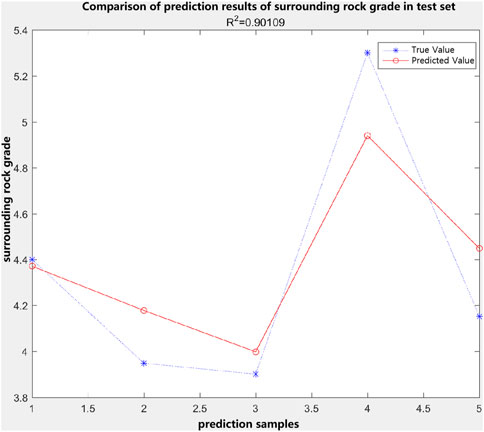
FIGURE 2. Comparison of network training results.
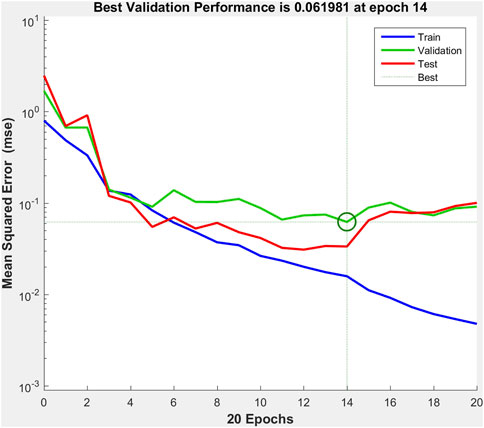
FIGURE 3. Training times.
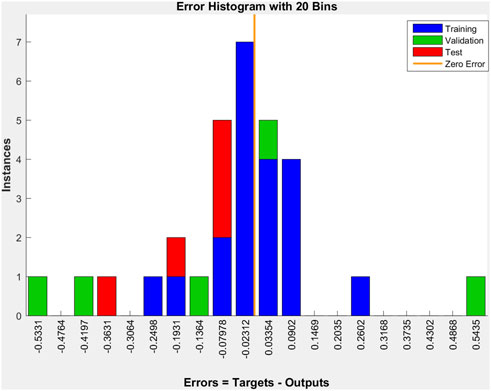
FIGURE 4. Network error histogram.
Figure 5 shows the correlation between the regression R-value measurement output and the target. The R-value of 1 indicates that the target value has a good correlation with the output value, and the R-value of 0 indicates that the target value does not correlate with the output value. It can be seen from the figure that the correlation R-value of the training samples is 0.97, the correlation R-value of the validation set samples is 0.93, the correlation R-value of the test set samples is 0.74, and the correlation R value of all samples is 0.89.
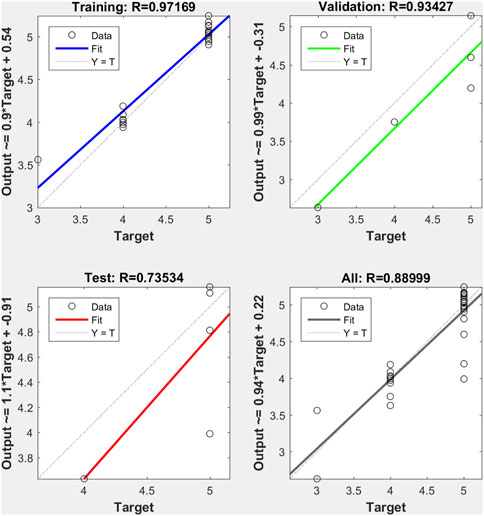
FIGURE 5. Network performance correlation diagram.
Applying the plateau tunnel surrounding rock classification system, the actual surrounding rock classification application was carried out on the actual tunnel pile number K300-3K279 section. The comparison results between the tunnel surrounding rock classification and the commonly used surrounding rock classification methods are shown in Table 12. According to the data of Table 12, it can be found that among the 12 samples, there are 6 grade IV surrounding rocks and 6 grade V surrounding rocks determined by the plateau tunnel surrounding rock classification system; there are 1 grade III surrounding rock, 7 grade IV surrounding rock and 4 grade V surrounding rock determined by BQ method. Through the application of the Kangding No.2 tunnel project, it is found that the surrounding rock classification results obtained by the plateau tunnel surrounding rock classification system are in good agreement with the actual site. Due to the particularity of plateau tunnels, the construction often adopts conservative support methods, and the surrounding rock classification results obtained by the BQ method cannot meet the requirements of engineering support.
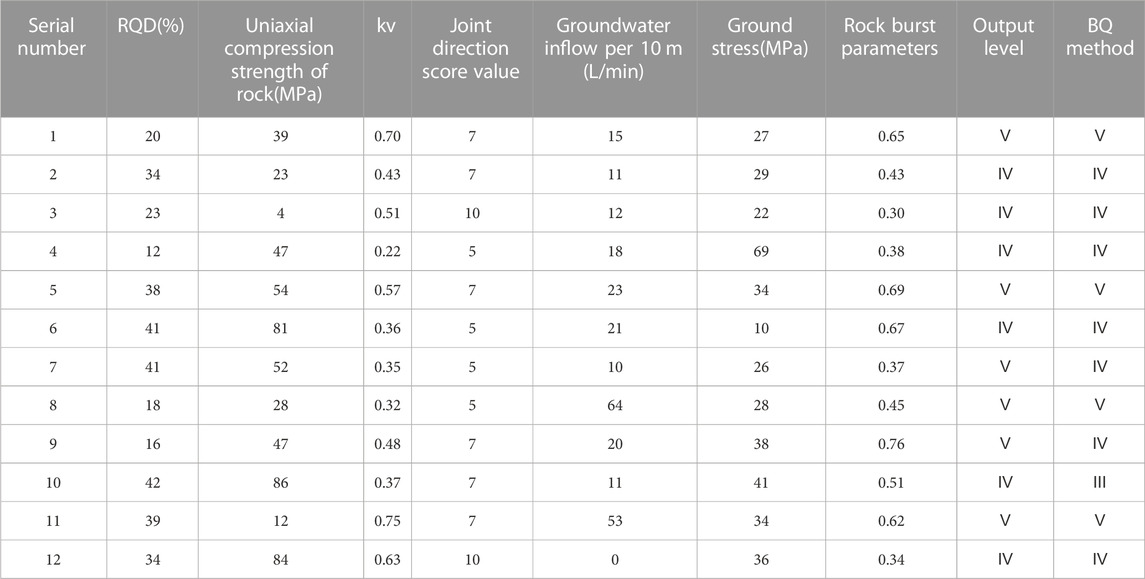
TABLE 12. Comparison table of surrounding rock classification results of a tunnel.
In this paper, the applicability of common surrounding rock classification methods is evaluated based on the geological characteristics of plateau tunnels. Based on this, a rapid classification method of surrounding rock based on the BP neural network is constructed. Then, the engineering data of a plateau tunnel are introduced into the BP neural network surrounding the rock classification system for training and testing. The main conclusions are as follows:
When carrying out the surrounding rock classification work in the plateau tunnel environment, the commonly used surrounding rock classification methods have the following problems: The evaluation index of the RQD surrounding rock quality classification method is single; There is a deviation between the surrounding rock grade determined by the coefficient correction method in the BQ method and the actual surrounding rock grade, and the classification result is sensitive to the uniaxial compressive strength of the rock, and the rock burst problem in the high stress area is not fully considered. The RMR method does not consider the in-situ stress of rock mass and the potential rock burst problem. The Q system method has strong subjectivity and a single evaluation index for in-situ stress.
Combined with the characteristics of plateau tunnels, seven classification parameters are proposed: rock mass quality index RQD, rock mass strength parameters, rock mass integrity coefficient, joint direction, groundwater seepage, in-situ stress, and rock burst parameters as the classification indexes of plateau tunnel surrounding rock.
The rapid classification method of surrounding rock based on the BP neural network is constructed by taking seven parameters of rock mass quality index RQD, uniaxial saturated compressive strength of rock, rock mass integrity index, joint direction, groundwater seepage flow, ground stress, and rock burst as input nodes of the network. The actual engineering case of a tunnel is introduced into the hierarchical model as a training sample. The overall correlation of the trained network model reaches 89, and the network performance is good.
The raw data supporting the conclusion of this article will be made available by the authors, without undue reservation.
LS: Writing–original draft. SY: Writing–original draft. LP: Writing–original draft. XJ: Writing–original draft. TS: Writing–original draft. LY: Writing–original draft. MW: Writing–original draft.
The author(s) declare financial support was received for the research, authorship, and/or publication of this article. This study would not have been possible without financial support from the Natural Science Basic Research Program of Shaanxi Province-Youth Project, 2022JQ-563.
Authors LS and XJ were employed by the China Railway 20th Bureau Group Co., Ltd.
The authors declare that this study received funding from the China Railway 20 Bureau Group Co., Ltd. 2022 Science and Technology Research and Development Major Project, YF2022SD01A and the China Railway Construction Co., Ltd. 2021 science and technology research and development project, 2021-B10. The funders had the following involvement in the study: design, collection, analysis, interpretation of data, the writing of this article, and the decision to submit it for publication.
The remaining authors declare that the research was conducted in the absence of any commercial or financial relationships that could be construed as a potential conflict of interest.
All claims expressed in this article are solely those of the authors and do not necessarily represent those of their affiliated organizations, or those of the publisher, the editors and the reviewers. Any product that may be evaluated in this article, or claim that may be made by its manufacturer, is not guaranteed or endorsed by the publisher.
BartonLien, N. R., and Lunde, J. (1974). Engineering classification of rock masses for the design of tunnel support. J. Rock Mech. 6 (4), 189–236. doi:10.1007/bf01239496
Bieniawski, Z. T. (1973). Engineering classification of jointed rock masses. Civ. Eng. S. Afr. 15 (12), 335–344.
Duan, S. Q., Feng, X. T., Jiang, Q., Liu, G. F., Xu, D. P., Yao, Z. B., et al. (2017). Failure modes and mechanisms for rock masses with staggered zones of Baihetan underground caverns under high geostress. Chin. J. Rock Mech. Eng. 36 (04), 852–864. doi:10.13722/j.cnki.jrme.2015.1236
GB 50287-2006 (2006). Code for engineering geological investigation of water conservancy and hydropower [S]. Beijing: China Planning Press.
Gu, M. C., He, F. L., and Chen, C. Z. (2002). Research on rock burst in qinling tunnel. Chin. J. Rock Mech. Eng. (09), 1324–1329.
Guo, J. Q., and Liu, X. R. (2018). Study on the uniformity between strength criterion and rockburst criterion. Chin. J. Rock Mech. Eng. 37 (S1), 3340–3352. doi:10.13722/j.cnki.jrme.2017.0909
He, X. C. (2019). Application of LIBSVM algorithm in tunnel surrounding rock classification. Highway 64 (04), 334–338.
Hong, K. R. (2020). Key technology for construction of ultra-long and deep-buried TBM tunnels with high geostress. J. China Railw. Soc. 44 (03), 1–23.
Liang, H. R., Wang, Y. D., Peng, H., Liu, J. F., and Yan, X. (2021). Classification of soft surrounding rock of tunnel based on normal cloud theory. J. Chongqing Jiaot. Univ. Sci. 40 (11), 82–87.
Liang, W. Z., and Zhao, G. Y. (2022). A review of long-term and short-term rockburst risk evaluations in deep hard rock. Chin. J. Rock Mech. Eng. 41 (01), 19–39. doi:10.13722/j.cnki.jrme.2021.0165
Liu, H. X., Cha, H. Y., Qian, C., Wang, Z., and Jiang, W. J. (2005). A method for classifying surrounding rock of highway tunnel based on quantization of tunnel face structure. J. Highw. Transp. Res. Dev. 36 (07), 90–97.
Lu, Y. M. (2020). A cloud optimization theoretical model of comprehensive classification for surrounding rock of tunnel with interval number. Sci. Technol. Eng. 20 (09), 3763–3769.
Lv, Q. F., Zhao, B. H., Pan, S. J., Huo, Z. S., and Ma, B. (2020). Classification of tunnel surrounding rock based on TSP system and PCA-bayes discriminant method. Chin. J. Undergr. Space Eng. 16 (01), 80–86.
Ma, S. W., Li, S. D., Li, X., Ma, L. G., Li, Z. L., and Zhang, Y. F. (2020). KNN method for intelligent observational classification of rock mass quality in tunnel. J. Eng. Geol. 28 (06), 1415–1424.
Palmström, A. (1995). RMi-a rock mass characterization system for rock engineering purposes. University of Oslo. PhD Thesis.
Peng, J., Cui, P., and Zhuang, J. (2020). Challenges to engineering geology of Sichuan—tibet railway. Chin. J. Rock Mech. Eng. 39 (12), 2377–2389. doi:10.13722/j.cnki.jrme.2020.0446
Shang, Y. J., Zhang, J. J., and Fu, B. J. (2013). Analyses of three parameters for strain mode rockburst and expression of rockburst potential. Chin. J. Rock Mech. Eng. 32 (08), 1520–1527.
Sonmez, H., and Ulusay, R. (1999). Modifications to the geological strength index (GSI) and their applicability to stability of slopes. Int. J. Rock Mech. Min. Sci. 36 (6), 743–760. doi:10.1016/s0148-9062(99)00043-1
Tian, F. F., Wang, X. R., and Huang, Y. X. (2021a). Evaluation of surrounding rock stability based on multi-factor extension matter element method. Yangtze River 52 (S1), 277–280.
Tian, Q. F., Yuan, Z. H., Zhang, R., Yao, Z. G., Ma, Z. G., and Fang, Y. (2021c). Rockburst mechanism of daxiagu tunnel in horizontal rock formation with high crustal stress. Tunn. Constr. 41 (S1), 223–231.
Tian, S. M., Wang, W., Tang, G. R., and Li, X. (2021b). Study on countermeasures for major unfavorable geological issues of tunnels on sichuan-tibet railway. Tunn. Constr. 41 (05), 697–712.
Tian, S. M., Wu, K. F., Liu, D. G., Wang, M. N., Wang, Z. L., and Dong, Y. C. (2022). Study on design method for active support for plateau railway tunnels in high energy geological environment. J. China Railw. Soc. 44 (03), 39–63.
Wang, X. Q., Liu, S., Li, Q. Y., and Ma, K. B. (2021). Classification and discrimination of surrounding rock of tunnel based on SVM of K-fold cross validation. Min. Metallurgical Eng. 41 (06), 126–128+133.
Xie, H. P., Zhang, R., Ren, L., Zhang, A. L., Zhang, Z. L., Deng, J. H., et al. (2022). Analysis and thoughts on surrounding rock mass catastrophe of deep-buried tunnels along sichuan-tibet railway. Adv. Eng. Sci. 54 (02), 1–20. doi:10.15961/j.jsuese.202101178
Xu, L. S., Wang, L. S., and Li, Y. L. (2002). Study on mechanism and judgement of rockbursts. Rock Soil Mech. (03), 300–303. doi:10.16285/j.rsm.2002.03.010
Xue, L. M., Li, C. M., Zheng, Z. X., Shen, W. L., and Wang, H. J. (2020). Classification of stability of surrounding rock based on two-dimensional cloud and. J. China Railw. Soc. 42 (06), 121–128.
Xue, Y. G., Kong, F. M., Yang, W. M., Qiu, D. H., Su, M. X., Fu, K., et al. (2019). Main unfavorable geological conditions and engineering geological problems along Sichuan-Tibet railway. Chin. J. Rock Mech. Eng. 39 (03), 445–468. doi:10.13722/j.cnki.jrme.2019.0737
Yan, J., He, C., Wang, B., Xu, G. W., Wu, F. Y., and Pan, P. (2020). Research on characteristics and mechanism of rockburst occurring in high geo-temperature and high geo-stress tunnel. J. China Railw. Soc. 42 (12), 186–194.
Yi, W. H., Wang, M. N., Tong, J. J., Zhao, S. G., Li, J. W., Gui, D. B., et al. (2021). Inhomogeneity identification method for surrounding rock of large-section rock tunnel face based on support vector machine. China Railw. Sci. 42 (05), 112–122.
Zhang, B. (2022). Surrounding rock classification method for tunnel construction based on entropy weight method. J. Yangtze River Sci. Res. Inst. 39 (04), 122–127.
Zhang, F. R., Jiang, A. N., Zhao, L., Chen, W., and Guo, K. (2021). Dynamic classification of tunnel surrounding rock based on DE-BP model. J. Shenyang Univ. Technol. 43 (01), 105–112.
Zheng, S., Jiang, A. N., Zhang, F. R., Zhang, Y., Shen, F. Y., and Jiang, X. D. (2019). Dynamic classification method of surrounding rock and its engineering application based on machine learning and reliability algorithm. Rock Soil Mech. 40 (S1), 308–318.
Zhou, C. Y., Zhang, L., and Huang, X. Y. (2005). Classification of rocks surrounding tunnel based on improved BP network algorithm. Earth Sci. (04), 480–486.
Keywords: high ground stress tunnel, neural network, application in engineering, surrounding rock classification, parameter selection
Citation: Shuguang L, Yanjun S, Peng L, Jiangsheng X, Sisi T, You L and Wen M (2023) Classification method of surrounding rock of plateau tunnel based on BP neural network. Front. Earth Sci. 11:1283520. doi: 10.3389/feart.2023.1283520
Received: 26 August 2023; Accepted: 06 November 2023;
Published: 29 December 2023.
Edited by:
Bin Gong, Brunel University London, United KingdomReviewed by:
Ruixiong Xue, Inner Mongolia University of Technology, ChinaCopyright © 2023 Shuguang, Yanjun, Peng, Jiangsheng, Sisi, You and Wen. This is an open-access article distributed under the terms of the Creative Commons Attribution License (CC BY). The use, distribution or reproduction in other forums is permitted, provided the original author(s) and the copyright owner(s) are credited and that the original publication in this journal is cited, in accordance with accepted academic practice. No use, distribution or reproduction is permitted which does not comply with these terms.
*Correspondence: Shen Yanjun, c2hlbnlqQHh1c3QuZWR1LmNu
Disclaimer: All claims expressed in this article are solely those of the authors and do not necessarily represent those of their affiliated organizations, or those of the publisher, the editors and the reviewers. Any product that may be evaluated in this article or claim that may be made by its manufacturer is not guaranteed or endorsed by the publisher.
Research integrity at Frontiers
Learn more about the work of our research integrity team to safeguard the quality of each article we publish.