 Neng Wan
 Shaofeng Liu
 Xueyan Li1
 Bo Zhang
95% of researchers rate our articles as excellent or good
Learn more about the work of our research integrity team to safeguard the quality of each article we publish.
Find out more
ORIGINAL RESEARCH article
Front. Earth Sci. , 10 October 2023
Sec. Structural Geology and Tectonics
Volume 11 - 2023 | https://doi.org/10.3389/feart.2023.1276832
This article is part of the Research Topic Lithosphere and Surface Processes of the Sichuan Basin and Surrounding Areas: Resources and Environmental Effects View all 6 articles
The northern part of the Jurassic Sichuan Basin has long been thought of as a foreland basin in relation to the post-collisional compression along the northern margin of the Yangtze block. However, the exact coupling mechanism between mountain building and basin formation remains unclear. Here, we integrate stratigraphic correlation, basin subsidence analysis and flexural simulation to quantitatively assess the extent to which the fold-thrust belts have controlled basin subsidence. Flexural backstripping of the stratigraphic record, spanning from 201 to 149 Ma, along two cross sections that are perpendicular to the Micangshan fold-thrust belt and the Dabashan fold-thrust belt, respectively, reveals a limited flexural control of mountain loading on basin subsidence. Owing to the short-wavelength nature of plate flexure, the basin-adjacent thrust belts exerted dominant control on basin subsidence only along its margin, with the width of the foredeeps not exceeding ca. 120 km, failing to drive subsidence in the forebulge and backbulge regions. Flexural modeling results suggest that crustal thickening was relatively weak during the Early to Middle Jurassic. This was followed by a more rapid and intense phase of crustal growth in the Late Jurassic, possibly extending into the earliest Early Cretaceous. Compared to the Micangshan region, the Dabashan region has experienced more intense compression during the Late Jurassic. Additionally, our results reveal spatial variations in plate rigidity along the northern margin of the Yangtze block, with greater plate stiffness in the Dabashan region. The presence of residual subsidence, an anomalous long-wavelength subsidence component corrected for both basin-adjacent thrust loading and associated sediment loading, highlights the necessity for an additional driving mechanism for basin subsidence. This residual subsidence was likely dynamic subsidence induced by the flat subduction of the Paleo-Pacific plate (the Izanagi plate) beneath East Asia as the flat slab progressively migrated inland.
Orogenic belts exert first-order control on the formation of their foreland basins (Allen and Allen, 2013). Rock fragments, shredded from source areas by the erosional engine, are transported into basins, forming the sedimentary rocks that contain information of their parent rocks and faithfully record geological events that happened in the orogenic belts and along its transportation pathways (Allen and Heller, 2011; Allen and Allen, 2013). Exploring the potential interactions between orogenic belts and basin deposits offers a key to understanding how orogenic belts have controlled basin formation (e.g., Flemings and Jordan, 1989; Garcia-Castellanos, 2002; Li et al., 2003; Liu et al., 2005a; Fosdick et al., 2014; Saylor et al., 2020). Conversely, signals extracted from sedimentary archives can also provide critical insights into the temporal evolution of mountain belts (e.g., Simpson, 2006; Saylor et al., 2018; Curry et al., 2019).
The Sichuan Basin is a large poly-phase sedimentary basin that developed on the Yangtze block of the western South China plate (Figure 1) (Guo et al., 1996; He et al., 2011; Liu S G et al., 2021). It is now widely accepted that the northern part of the Jurassic Sichuan Basin, which subsided more rapidly than its interior, was a foreland basin, in relation to the thrusting events induced by post-collisional compression along the northern margin of the Yangtze block, after the final collision between the South China plate and the North China-Qinling-Dabieshan plate (Liu et al., 2005b; Meng et al., 2005; Tian et al., 2012a; Tian et al., 2012b; Li et al., 2013; Liu et al., 2015a; Qian et al., 2015; Li Y.Q. et al., 2018; Liu S G et al., 2021). The more rapid basin subsidence rates in front of the Micangshan fold-thrust belt and the Dabashan fold-thrust belt clearly indicate a linkage between mountain building and basin formation. However, the exact coupling mechanism remains unclear. Few studies have explicitly and quantitatively explored the extent to which the basin was controlled by the adjacent mountain belts. The basin-adjacent mountain belts typically exert limited control on basin subsidence due to the short-wavelength nature of plate flexure, even for plates with large rigidities (Watts, 2001). Nevertheless, the ideal plate flexural profile will be further altered by the addition of sediment deposits in the foredeep, leading to additional basin subsidence. This leads to another question that whether the combined flexural subsidence driven by the basin-adjacent mountain belts and the associated sediment loads could account for the all the subsidence in the basin. In other words, whether the basin was solely initiated by the basin-adjacent mountain belts remains elusive.
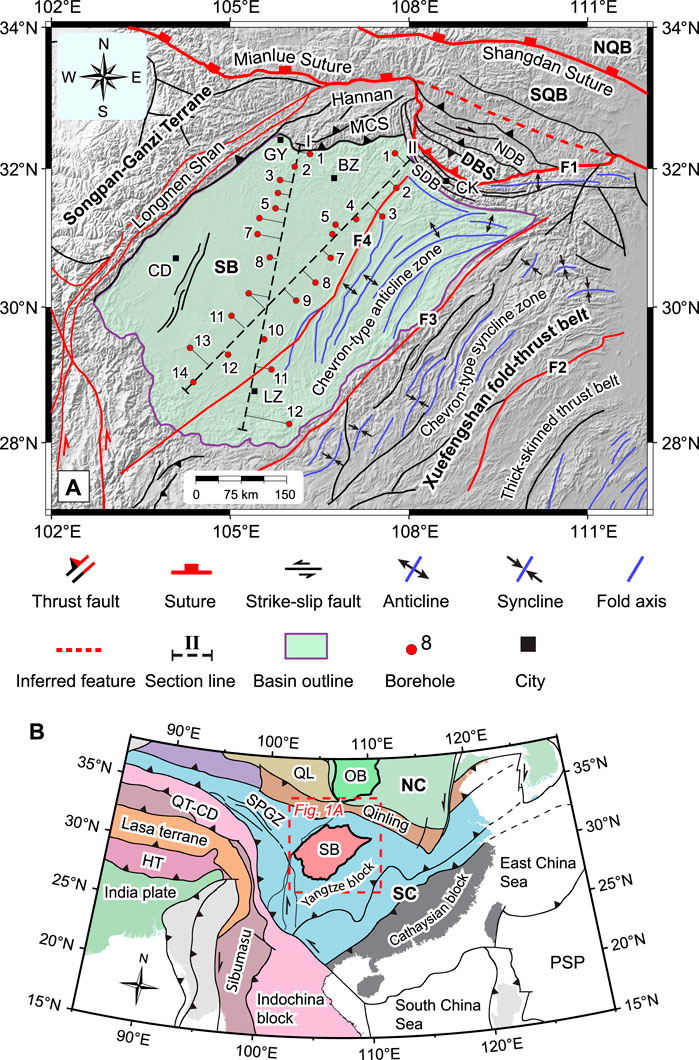
FIGURE 1. (A) DEM map of the Sichuan Basin and adjacent regions, showing locations of boreholes along two cross sections and major structures. (B) Tectonic map showing tectonic units of East Asia and adjacent regions (after Wan, 2013). F1, Chengkou-Xiangfan fault (which buried the Mianlue suture); F2, Cili-Baojing fault; F3, Qiyueshan fault; F4, Huayingshan fault. BZ, Bazhong city; CD, Chengdu city; CK, Chengkou county; GY, Guangyuan city; LZ, Luzhou city. DBS, Dabashan fold-thrust belt; HT, Himalayan terrane; MCS, Micangshan fold-thrust belt; NC, North China plate; NDB, North Dabashan belt; NQB, North Qinling block; OB, Ordos Basin; PSP, Philippine Sea plate; QL, Qilian block; QT-CD, Qiangtang-Changdu terrane; SB, Sichuan Basin; SC, South China plate; SDB, South Dabashan belt; SPGZ, Songpan-Ganzi terrane; SQB, South Qinling block. “Shan” means mountain in Chinese.
The overall well-preserved Jurassic stratigraphy with little metamorphic or structural overprint and abundant borehole data in the residual Sichuan basin provide us with a unique and unprecedented opportunity to investigate the role of mountain belts along the northern margin of the Yangtze block in basin formation. In this paper, we integrated stratigraphic correlation, basin subsidence analysis and flexural simulation to quantitatively assess the extent to which the Sichuan Basin was controlled by the basin-adjacent mountain belts and to decipher their potential coupling mechanism during the Jurassic. We first decompacted the correlated well data to obtain the cumulative subsidence of the basin. We then conducted 2D flexural simulations to ascertain whether the combined flexural subsidence induced by the mountain load and associated sediment loads can explain all the subsidence within the basin. This study not only provides critical insights into the formation mechanism of the Sichuan Basin, but also sheds light on the mountain building processes (e.g., crustal growth) along the northern margin of the Yangtze block.
The Sichuan Basin is a poly-phase sedimentary basin that developed on the basement of the Yangtze block (Figure 1). Before the Middle-Late Triassic, the basin evolved concurrently with the Yangtze block, with 4–7 km of marine successions (Guo et al., 1996; He et al., 2020; Liu S G et al., 2021). Since then, the Sichuan Basin evolved as a terrestrial non-marine basin, following the closure of the Mianlue Ocean between the South China plate and the North China-Qinling-Dabieshan plate (Zhang et al., 2001; Liu et al., 2015a; Liu et al., 2015b). The present-day residual Sichuan Basin, as delineated by the residual Upper Triassic-Lower Cretaceous (Figure 1), is considerably smaller than the reconstructed proto-Sichuan Basin, with its boundary extending further to the east and south (Liu et al., 2015a; Li Y.Q. et al., 2018; He et al., 2020). The proto-basin was severely deconstructed by subsequent structural deformations, leaving the present-day residual Sichuan Basin being surrounded by orogenic belts and deep-seated faults in all directions (Figure 1A) (Yan et al., 2003; Liu et al., 2005b; Zhang et al., 2011).
To the far north, the Qinling orogen (Figure 1B) comprises the South Qinling block and the North Qinling block (Zhang et al., 2001; Liu et al., 2003), and is separated from the Sichuan Basin by the Micangshan fold-thrust belt and the Dabashan fold-thrust belt (Figure 1A). The South Qinling block is separated from the North Qinling-North China plate and the South China plate along the Shangdan suture and the Mianlue suture, respectively. The formation of the Shangdan suture in the Early Devonian marks the closure of the Shangdan Ocean, an ocean that once separated the South Qinling micro-plate from the North Qinling-North China plate (Dong and Santosh, 2016). This was succeeded by the opening of the Mianlue Ocean in the Devonian and its subsequent closure during the Permian to Late Triassic (Liu et al., 2015b; Dong and Santosh, 2016). The Mianlue suture is discontinuous along its strike, as it was buried to depth by subsequent post-collisional deformations (red dashed line in Figure 1A) (Zhang et al., 2001).
To the west of the Sichuan Basin, the NE-striking Longmenshan fold-thrust belt separates the Sichuan Basin from the Songpan-Ganzi terrane (Figure 1A). A series of extensional faults formed beneath the present-day Longmenshan fold-thrust belt during the Permian (Guo et al., 1996; Yan et al., 2018a; He et al., 2020). The Longmenshan structure belt has subsequently undergone multiple episodes of tectonic reactivations, with the initial uplift of its northern segment occurring in the Late Triassic, in response to the closure of the Mianlue Ocean to the north (Liu et al., 2015a; Liu et al., 2015b; Yan et al., 2018b). This was followed by another uplift during the Late Jurassic-Early Cretaceous (Liu et al., 2015a) and the most recent uplift in the Cenozoic (Yan et al., 2011; Tian et al., 2016; Yan et al., 2018a; Yan et al., 2018b).
The Micangshan fold-thrust belt, oriented nearly east-west, is bounded by the northern Longmenshan fold-thrust belt to the west and the Dabashan fold-thrust belt to the east (Figure 1A). The Micangshan fold-thrust belt has experienced prolonged compression since the closure of the Mianlue ocean. In its hinterland (the Hannan region), it is characterized by basement-involved anticlines and south-vergent thrust faults (Liu et al., 2015a; He et al., 2020). Further to the south, the Paleozoic-Early Triassic strata were involved in deformation, forming a series of east-west trending broad folds. The frontal Micangshan comprises a series of duplex thrusts that deformed the Early Mesozoic to Early Cretaceous strata (Liu et al., 2015a).
The Dabashan fold-thrust belt is an arc-shaped structure that extrudes to the southwest (Figure 1A). It is divided into the North Dabashan belt and the South Dabashan belt by the Chengkou-Xiangfan fault (F1 in Figure 1A). The North Dabashan belt superimposes early-stage structures, burying the Mianlue suture to depth (Zhang et al., 2001). The Dabashan orocline progressively bends towards the south, in response to prolonged post-collisional compression (e.g., Dong et al., 2013; Li et al., 2013; Liu et al., 2015a; Li et al., 2015). Previous studies suggested that the North Dabashan belt may have formed during the Middle Jurassic to Early Cretaceous (Tian et al., 2012b; Li et al., 2013; Li et al., 2015). In the South Dabashan belt, the Paleozoic-Jurassic strata are involved in duplex thrusts (Dong et al., 2013; Li et al., 2015; Li et al., 2017), indicating a younger formation age. Apatite fission track dating results suggested that the South Dabashan belt may have formed from the latest Early Cretaceous to the earliest Neogene (Li et al., 2017).
To the east of the Sichuan Basin, the Xuefengshan fold-thrust belt is a broad composite multi-layer fold-thrust system, with most structures trending NE-NNE (Figure 1A) (Yan et al., 2003). From southeast to northwest, the Xuefengshan fold-thrust belt and its adjacent regions comprise the thick-skinned fold-thrust belt, the chevron-type syncline zone and the chevron-type anticline zone (Figure 1A). The thick-skinned thrust belt deformed the Paleozoic to the Lower Jurassic and is separated from the chevron-type syncline zone by the Cili-Baojing fault (F2 in Figure 1A). The chevron-type syncline zone, characterized by a series of NE-NNE trending tight synclines, is separated from the chevron-type anticline zone, which comprises a series of tight anticlines, by the Qiyueshan fault (F3 in Figure 1A). Together, the chevron-type syncline zone and the chevron-type anticline zone form the thin-skinned thrust system of the Xuefengshan fold-thrust belt, which terminates in the central Sichuan Basin by the Huayingshan fault (F4 in Figure 1A). It is generally believed that deformations within the Xuefengshan fold-thrust belt progressively migrated from southeast to northwest in relation to the northwestward subduction of the Paleo-Pacific plate (the Izanagi plate) beneath East Asia (e.g., Yan et al., 2003; Liu et al., 2005b; Li and Li, 2007; Wang et al., 2013; Zhang et al., 2013; Liu et al., 2015a; Yan et al., 2018c; Li J H et al., 2018). The deformation in the thick-skinned fold-thrust belt may have begun as early as the Middle Jurassic, while the deformation in the thin-skinned thrust system may have continued into the Early Cretaceous as it is covered by the Upper Cretaceous (Yan et al., 2018c).
The well-preserved Jurassic strata in the Sichuan Basin are well suited for quantitative subsidence analysis owing to recent advances in chronostratigraphy (e.g., Xu et al., 2017; Huang, 2019; Xu et al., 2021). The presence of widely distributed regional markers facilitates basin-wide correlation of the Jurassic strata, and they are considered approximately isochronous (Huang, 2019; He et al., 2020). Two regional cross sections (Figure 1A), oriented roughly perpendicular to the Micangshan fold-thrust belt and the Dabashan fold-thrust belt, respectively, were constructed using boreholes that penetrate the base of the Jurassic successions (Supplementary Table S1). These two sections were correlated using regional makers, such as maximum flooding surfaces, regional black shale beds or mudstone, and limestone tops. Stratigraphic ages were constrained and assigned based on published isotopic ages (Xu et al., 2017; Xu et al., 2021; Zhou et al., 2022) and biostratigraphic studies (Wang et al., 2018; Huang, 2019), using the timescale by Gradstein and Ogg, (2020). Although these ages are with uncertainties, they will not significantly influence the results and conclusions. Strata thickness has been corrected for abnormal thickness resulting from folding, faulting or deviated well paths. Extensive erosion of the Cretaceous strata has hindered the construction of a complete regional section for the Upper Cretaceous. Therefore, we primarily focus on the Jurassic successions. Due to limited age constraints, we divided the Jurassic strata into four packages, corresponding to the Ziliujing Formation (J1z; also referred to as the Baitianba Formation in the northern Sichuan basin) (201–180 Ma), the Qianfoya Formation (J1-2q; also referred to as the Lianggaoshan Formation or the Xintiangou Formation in some other literature. Hereafter, we use the Qianfoya Formation for consistency) (180–168 Ma), the Lower Shaximiao Formation (J2sx1) (168–161.5 Ma), and the Upper Shaximiao Formation (J3sx2) (161–149 Ma). For a few wells with the Cretaceous successions, we have also included the Suining Formation (J3s) (149–143 Ma) and the Penglaizhen Formation (K1p) (143–137 Ma) for single well subsidence analysis. Although our correlation follows the traditional lithostratigraphic division of the Sichuan Basin, the traditional division scheme was established primarily based on sedimentation cycles (Guo et al., 1996), ensuring the robustness of the correlation results.
To compensate for the compaction effects caused by sediment volume changes due to mechanical decreases in porosity during burial, correlated strata were then sequentially decompacted to obtain the cumulative subsidence at each stage (Supplementary Table S2). The decompaction was implemented using a MATLAB-based code adapted from Nestor Cardozo (Cardozo, 2016), which follows the standard decompaction workflow described by Angevine et al. (1990). Refer to Table 1 for a comprehensive list of decompaction parameters. The surface porosity, compaction constant and density of each layer were computed based on lithology fractions (Heller et al., 1986; Müller et al., 2018). Since water depth is relatively small compared to the stratigraphic thickness and has minimal impact on the overall trend of subsidence curves, no water correction was applied. The decompacted subsidence data were then used for subsequent flexural backstripping.
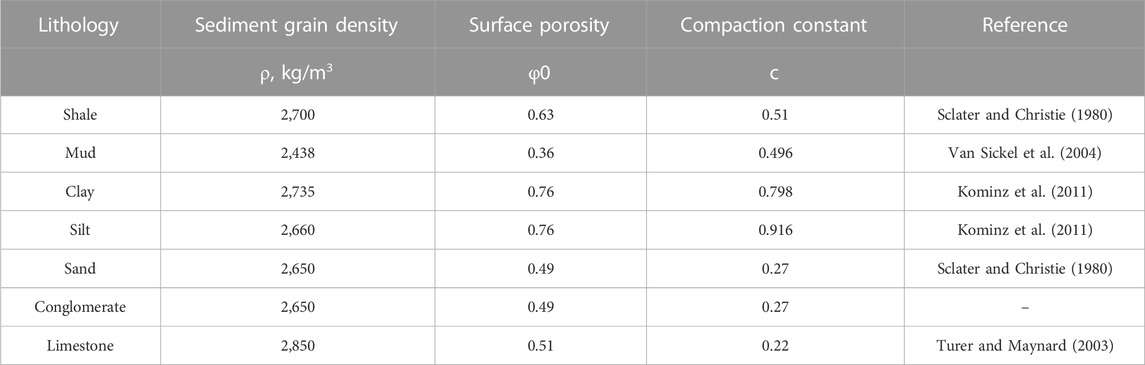
TABLE 1. Decompaction parameters for common lithologies.
Flexural simulations prove to be a valuable tool for investigating the causal linkage or coupling mechanism between mountain belts and their foreland basins formed by plate flexure (e.g., Jordan, 1981; Flemings and Jordan, 1989; Liu and Nummedal, 2004; Liu et al., 2011). In this study, we conducted flexural simulations to ascertain if basin subsidence could be entirely attributed to the subsidence induced by the basin-adjacent thrust load and associated sediment loads. The flexural simulation was implemented using a Monte Carlo method (Saylor et al., 2018; Saylor et al., 2020), which forward models the combined subsidence induced by the thrust load and associated sediment loads by exploring the parameter space composed of several variables (Figure 2) and thereby determines the best-fit parameter combinations.
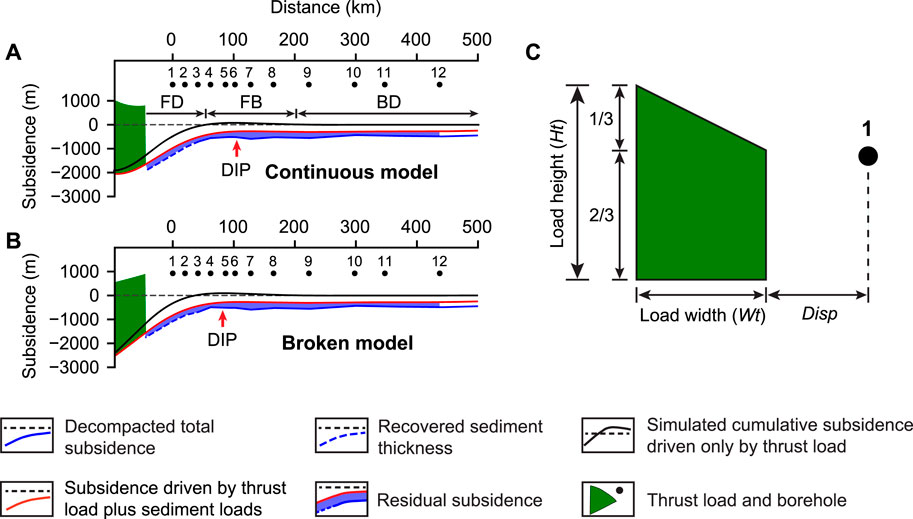
FIGURE 2. Flexural modeling profiles for the continuous model (A) and the broken model (B), respectively. With the same plate rigidity, the continuous model produces a deflection profile with a larger wavelength, but a smaller amplitude compared to the broken model under the same end load. For better representation of modeling results, only a portion of thrust load is displayed. (C) Simplified thrust load setup for flexural modeling. Disp, distance from the thrust front to the cross section. BD, backbulge region; FB, forebulge region; FD, foredeep region; DIP, deflection inflection point (the highest point above base level) of flexural profile driven by thrust load only.
Two classes of flexural models were tested: the continuous plate model and the broken plate model, each assuming different boundary conditions. The continuous flexural model assumes that the lithosphere extends infinitely along the modeling profile (Figure 2A), while the broken flexural model assumes that the lithosphere is semi-infinite (Figure 2B) (Watts, 2001; Wangen, 2010). Given the wavelength of plate deflection is only dependent on the plate rigidity, rather than load height of an end load (Watts, 2001), we first loaded the mountain belts alone to forward model the foredeep and forebulge. This gives a priori range of plate rigidity values and saves computation resources. Then, we added the associated sediment loads to model the complete basin geometry.
The deflection (w) of the lithosphere under applied additional vertical loads can be described by the governing differential equation (Turcotte and Schubert, 2002):
where q(x) represents the distributed vertical load, g is the gravitational acceleration, D is the flexural rigidity, and
The topography of the basin-adjacent thrust belts in the deep geological past typically remains unknown. Palinspastic reconstructions of thrust belts can be challenging and error-prone, given that structures were often involved in subsequent deformations. In this paper, we do not attempt to retrieve the detailed anatomy of the basin-adjacent mountain belts, but rather to obtain a simplest first-order constraint of load size. Therefore, for simplicity, we represent the thrust load using a basic geometric shape, a trapezoid (Figure 2C), as is commonly done in previous studies (e.g., Jordan, 1981; Li et al., 2003; Fosdick et al., 2014; Saylor et al., 2018; Saylor et al., 2020). In light of uncertainties, we have also tested different load shapes. These investigations reveal that the impact of different load geometries on the results is negligible, consistent with previous findings (Liu and Nummedal, 2004; Saylor et al., 2018; Saylor et al., 2020). Despite the simplified load geometry, the modeling results prove to be sufficiently accurate, as demonstrated by our sensitivity tests (see Results section), thereby emphasizing the robustness of our methods.
Model variables include the effective elastic thickness of the plate (Te), load width (Wt), load height (Ht), and distance from the thrust front to the cross section (Disp) (Figure 2). We consider the plate elastic with a constant elastic thickness without variations along the modeling profile, and assume that the Te value remains relatively consistent throughout all stages. Disp was approximately constrained and estimated based on published paleogeographic maps and interpreted seismic profiles (Liu et al., 2015a; Li et al., 2015; Li et al., 2017; He et al., 2020), as our cross sections do not reach basin boundaries. Refer to Table 2 for a comprehensive list of model parameters and their corresponding values.
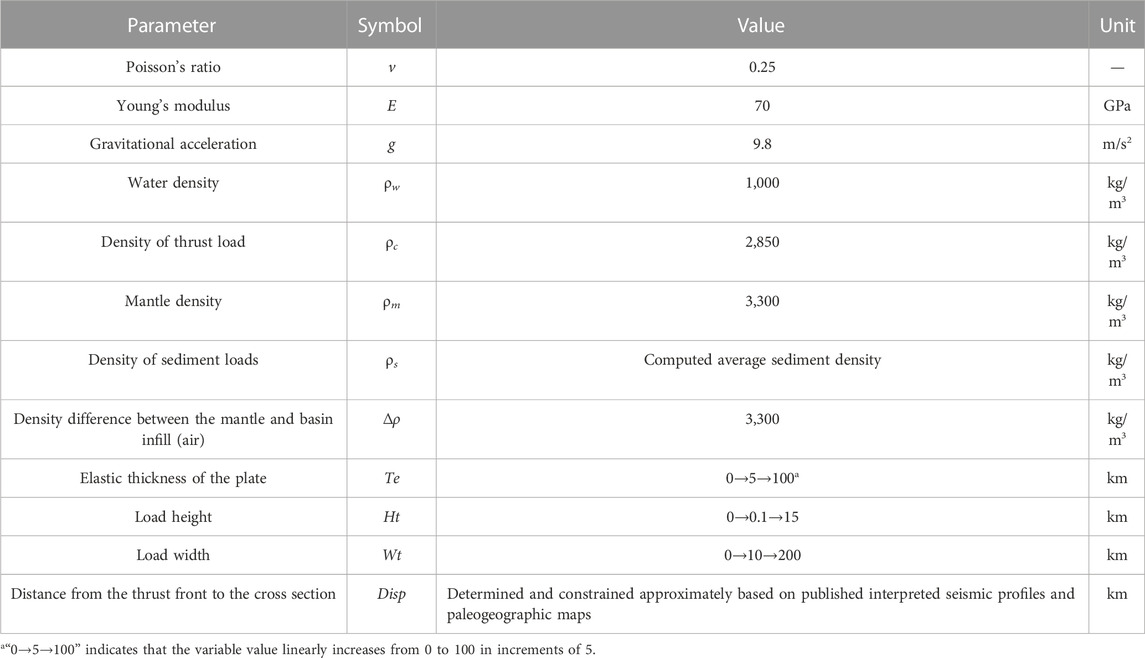
TABLE 2. Model parameters for flexural simulations.
We systematically explored the parameter space composed of these variables (Table 2) to determine the best-fit parameter combination that can best capture the general basin geometry at each stage. To quantitatively assess the goodness of fit of modeling results, we compute the standard deviation (STD) of the difference (referred to as residual subsidence) between the simulated combined subsidence induced by the thrust load and associated sediment loads and the decompacted cumulative subsidence. The calculation of residual subsidence follows the concept described in Liu and Nummedal (2004). The STD is computed as follows:
where n is the number of boreholes, RSi is the residual subsidence at each point, and
The Lower Jurassic successions in the northern Sichuan Basin, referred to as the Baitianba Formation (J1b), overlies the Upper Triassic Xujiahe Formation (T3x) with an angular unconformity (Figure 3). At its base, several layers of basal conglomerates, representing alluvial deposits, are developed. Moving upward, these deposits transition into fine-grained sediments, mainly comprising interbedded grayish to black mudstone and grayish siltstone, with interlayered black shale or coal seams. Basal conglomerates are not found at wells in the front of the Dabashan fold-thrust belt (Figure 4), indicating that the basin extended further to the north. This unconformable contact evolves into a conformable contact as it moves into the basin, where the Lower Jurassic Ziliujing Formation (J1z) is separated from the Xujiahe Formation by regional grayish mudstone (denoted as K0 in Figure 3). From north to the basin interior, this transition from an angular unconformity contact to a conformity contact represents a typical sequence boundary as described by Catuneanu et al. (2009). The Ziliujing Formation primarily comprises grayish mudstone in the northern Sichuan Basin or reddish mudstone in the middle and southern part of two cross sections, with interlayered grayish to greenish siltstone or fine-grained sandstone, black shale, and limestone (Figures 3, 4). Two layers of limestone are developed within the Ziliujing Formation at its middle and top (referred to as the Dongyuemiao member and Daanzhai member, respectively), serving as good regional correlation markers across the basin. The stratigraphic thickness of the Ziliujing Formation is relatively uniform along two cross sections, ranging from 300 to 400 m, with slightly thicker thickness in the northern Sichuan basin.
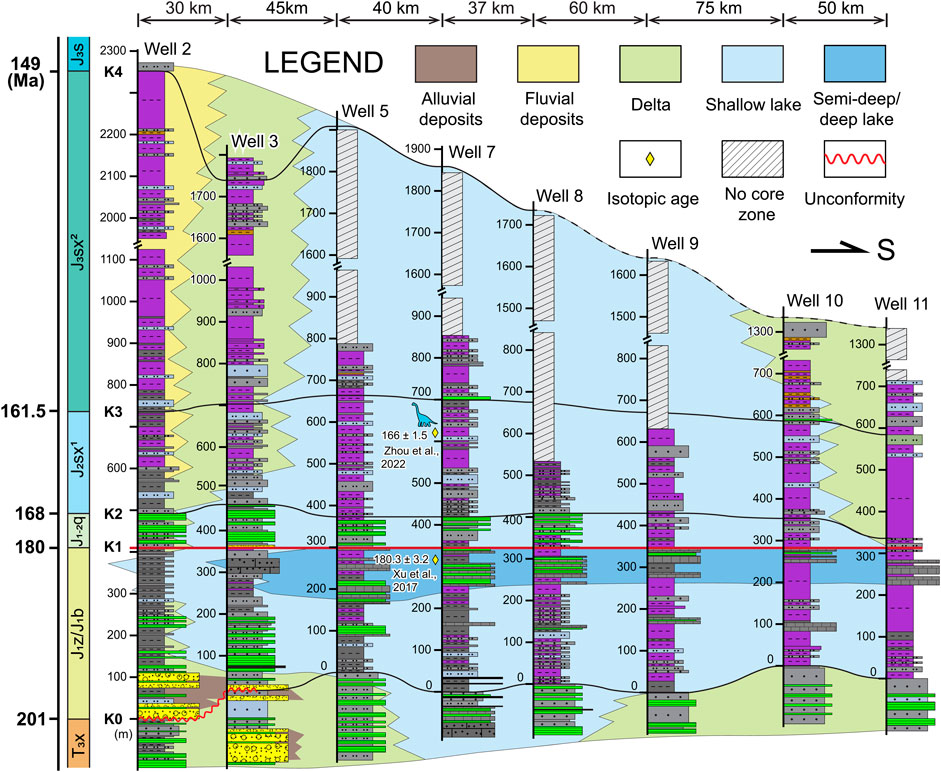
FIGURE 3. Simplified correlated stratigraphy of cross section I, flattened at the base of the Qianfoya Formation (J1-2q), with gross sedimentary facies overlain. Refer to Figure 1A for well locations. Dashed lines denote the inferred eroded layers. K0-K4 represent correlation markers. Note that grayish-black shales are highlighted in green. Refer to the legend in Figure 4 for lithology. T3x, the Xuejiahe Formation; J1z/J1b, the Ziliujing Formation/the Baitianba Formation; J1-2q, the Qianfoya Formation; J2sx1, the Lower Shaximiao Formation; J3sx2, the Upper Shaximiao Formation; J3s, the Suining Formation.
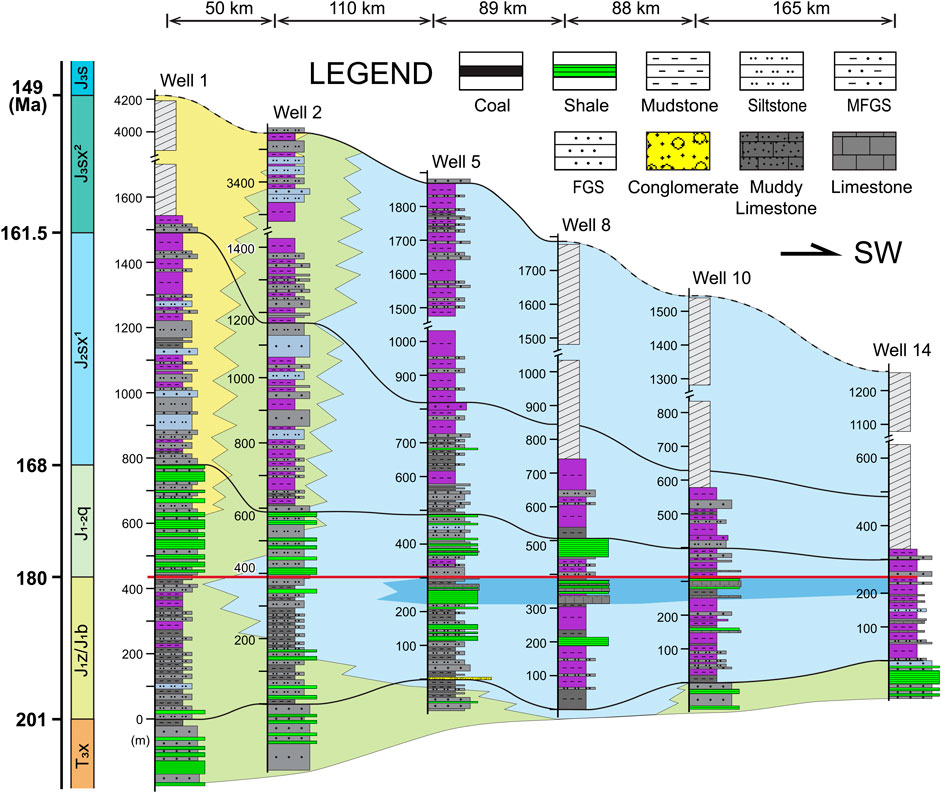
FIGURE 4. Simplified correlated stratigraphy of cross section II, flattened at the base of the Qianfoya Formation (J1-2q), with gross sedimentary facies overlain. Note that omitting lithology may produce an artifact of stratigraphic thickness. Refer to the legend in Figure 3 for gross sedimentary facies. The others are the same as Figure 3. FGS, fine-grained sandstone; MFGS, muddy fine-grained sandstone.
The Qianfoya Formation (J1-2q) conformably overlies the Ziliujing Formation (Figures 3, 4). It is separated from the Ziliujing Formation by a regional black shale bed (denoted as K1 in Figure 3). In the northern Sichuan Basin, the Qianfoya Formation mainly comprises grayish siltstone or fine-grained sandstone, interbedded with black to grayish shale and mudstone. Moving towards the south, it gradually tapers and mainly comprises reddish mudstone, interbedded with grayish or greenish fine-grained sandstone and grayish shale. The Qianfoya Formation overlaps the Ziliujing Formation in front of the Micangshan fold-thrust belt (Figure 3) and extends further to the north (Liu et al., 2015a; Qian et al., 2015; He et al., 2020). The thickness of the Qianfoya Formation is about 100 m in the northern and middle part of two cross sections.
The Lower Shaximiao Formation (J2sx1) conformably overlies the Qianfoya Formation (Figures 3, 4). It is separated from the Qianfoya Formation by a layer of regional black shale or mudstone (denoted as K2 in Figure 3). It mainly comprises reddish mudstone, interbedded with grayish to greenish siltstone. For section I, the thickness of the Lower Shaximiao Formation is relatively uniform throughout the section (Figure 3), ranging from 200 to 300 m. However, for section II, the Lower Shaximiao Formation thickens towards the northeast (Figure 4).
The Upper Shaximiao Formation (J3sx2) conformably overlies the Lower Shaximiao Formation, with a significantly greater thickness compared to the Lower Shaximiao Formation (Figures 3, 4). It is separated from the Lower Shaximiao Formation by a regional layer of black shale with abundant Conchostracans (referred to as the Conchostracans shale in Chinese literature and denoted as K3 in Figure 3). Its thickness reaches over 1,600 m and 2,600 m in front of the Micangshan fold-thrust belt (Figure 3) and the Dabashan fold-thrust belt (Figure 4), respectively. Within the basin interior, its thickness along both sections remains over 1,000 m. The Upper Shaximiao Formation mainly comprises reddish mudstone interbedded with grayish to greenish siltstone and fine-grained sandstone.
Moving from the bottom to the top, the Ziliujing Formation records an overall lake expansion process, culminating at the Daanzhai member (Xu et al., 2017). The Qianfoya Formation, on the other hand, records a complete lake expansion and shrinkage cycle, with a flooding surface occurring in its middle (Figures 3, 4) (He et al., 2020). In contrast, the Lower Shaximiao Formation and Upper Shaximiao Formation exhibit an overall lake shrinkage process, with a smaller-scale lake flooding surface observed at the top of the Lower Shaximiao Formation (Figures 3, 4). The basin was underfilled in the Early to early Middle Jurassic, whereas it became overfilled during stage 3 and stage 4 in the late Middle Jurassic to Late Jurassic (He et al., 2020).
Figure 5 displays the two-dimensional cumulative subsidence history of two cross sections. The cumulative subsidence reveals how the basin has subsided since the earliest Early Jurassic, while the incremental subsidence (denoted by light-red bands in Figure 5) reflects basin subsidence at specific stages. Overall, the patterns of basin subsidence along two section profiles closely resemble those of strata thickness, but with greater magnitude owing to the implementation of stratigraphic decompaction. Below, we mainly describe the incremental subsidence at each stage.
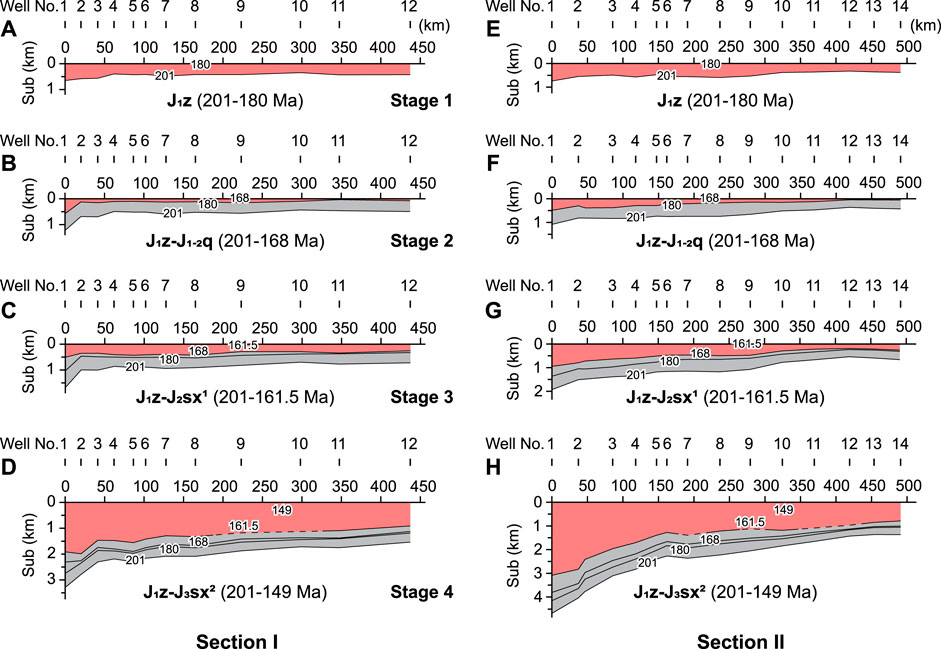
FIGURE 5. Two-dimensional cumulative subsidence history of section Ⅰ (A–D) and section Ⅱ (E–H), respectively. Refer to Figure 1A for well locations. The light-red shaded area denotes incremental subsidence compared to the previous stage. Dashed lines denote the inferred eroded layers. Sub, subsidence.
During stage 1 (201–180 Ma), the basin subsided relatively uniformly, reaching approximately 500 m, with only a slight thickening trend towards the north (over 600 m) (Figures 5A, E). In section II, subsidence in the southern part is relatively smaller, likely due to the presence of the pre-existing topography. The average subsidence rate, calculated by dividing the incremental subsidence by the deposition duration, was 21.7 m/Myr for section I and 22 m/Myr for section II. During stage 2 (180–168 Ma), the subsidence profiles taper towards the south or southwest (Figures 5B, F), with its magnitude significantly smaller than that of stage 1. The average subsidence rate was slow, with only 10 m/Myr for section I and 15.7 m/Myr for section II. During stage 3 (168–161.5 Ma), basin subsidence remained relatively uniform for section I (Figure 5C), while it became a broad wedge-shaped subsidence profile for section II (Figure 5G). Compared to the previous stage, the average subsidence rate increased to 51 m/Myr and 64 m/Myr for section I and section II, respectively. During stage 4 (161.5–149 Ma), the basin experienced an even more rapid subsidence pulse. Pronounced wedge-shaped subsidence profiles are observed in both sections, with typical foredeeps developed in front of the Micangshan and Dabashan regions (Figures 5D, H). For section I, the foredeep is relatively narrow, with the highest point of the forebulge (DIP in Figure 2B) located between well 3 and well 4 (Figure 5D). In contrast, for section II, the foredeep is wider, with the DIP extending to well 6 (Figure 5H). The average subsidence rate further increased to 99 m/Myr and 107 m/Myr for section I and section II, respectively.
Figure 6 displays subsidence curves from six representative wells distributed in the different areas: near the mountain belts (well 1 in section I and well 2 in section II) (Figures 6A, D), in the middle section (well 8 in section I and well 7 in section II) (Figures 6B, E), and in the southern section (well 12 in section I and well 13 in section II) (Figures 6C, F). Single well subsidence curves reveal the subsidence history at specific points. The results reveal that the basin experienced relatively slow subsidence during stage 1 and stage 2 from the Early Jurassic to early Middle Jurassic (Figure 6). In the central and southern part, the subsidence rates during stage 2 were even slower than those during stage 1 (Figures 6B, C, E, F). The overall slow subsidence was followed by gradually enhanced subsidence rates during stage 3 and stage 4 (Figure 6), corresponding to the deposition of the Lower Shaximiao Formation and the Upper Shaximiao Formation, respectively. Rapid subsidence pulses are observed throughout both cross sections, with subsidence rates reaching 137.3 m/Myr and 202 m/Myr during stage 4 for wells near the Micangshan fold-thrust belt and the Dabashan fold-thrust belt, respectively (Figures 6A, D). At all times, subsidence rates near the thrust belts were greater than those in the basin interior (Figure 6), clearly indicating a potential linkage between the basin-adjacent mountain belts and basin subsidence. Together, the slow to fast subsidence pattern forms an upward convex-shaped subsidence curve, which is a typical subsidence pattern representing that the basin formed under a compressional setting (Xie and Heller, 2009).
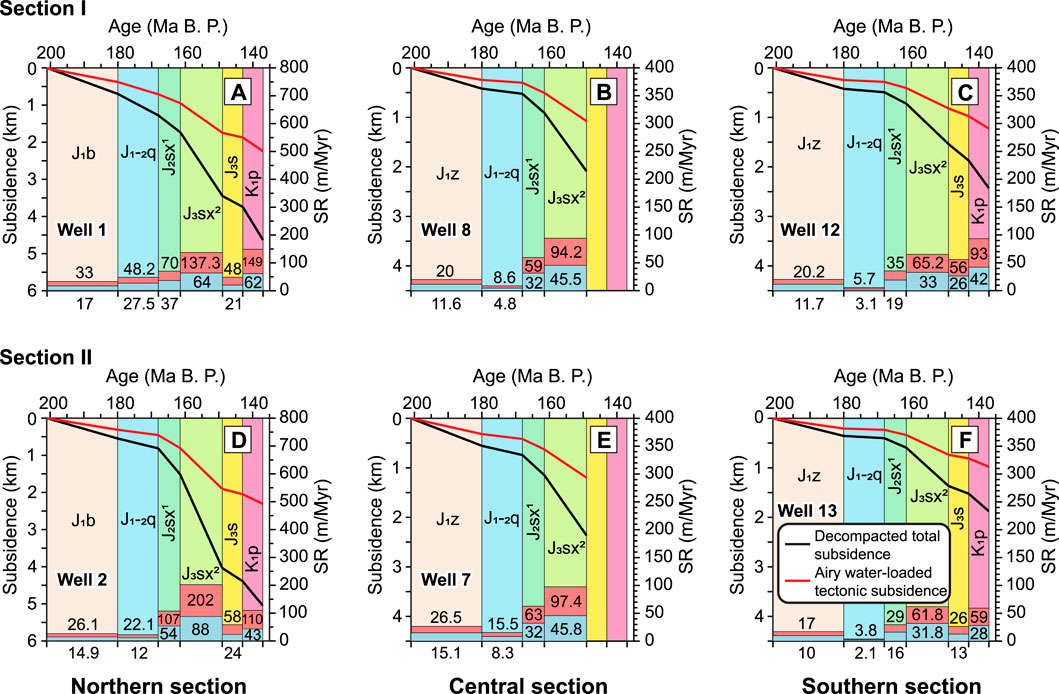
FIGURE 6. Single well subsidence curves of selected wells that are distributed along the northern part (A, D), central part (B, E) and southern part (C, F) of two cross sections, with the left axis representing subsidence and the right axis representing subsidence rate, respectively. Refer to Figure 1A for well locations. Airy water-loaded tectonic subsidence (assuming the plate has no internal rigidity) is included for reference. The numbers in the lower axis denote total subsidence rates (light-red boxes) or tectonic subsidence rates (light-blue boxes), respectively. Paleo-water depth correction is not applied as it does not alter the overall trend. B. P., before present; Myr, Million year; SR, subsidence rate.
Both the broken and continuous models can provide reasonable fits to the general basin geometry with acceptable accuracy, but they yield different best-fit Te values. Generally, the continuous model requires a larger load width, but predicts a relatively smaller Te value. This occurs because the continuous model generates a flexural profile with a larger wavelength compared to the broken model under the same Te value (Figures 2A, B) (Watts, 2001). Here, we prefer the broken model because it is consistent with the boundary condition between the South China plate and the South Qinling block, where the Mianlue suture represents a pre-existing weakness zone. Therefore, all the results and discussions below are based on the best-fit results determined by the broken model.
For the initial three stages, the relatively uniform strata thickness makes it difficult to identify the foredeeps and forebulges, which hinders a vigorous estimate of Te values. The Te values fall within a broad range. However, the Te values can be uniquely determined at the last stage, where typical flexural profiles with distinct foredeeps and forebulges were developed along both sections (Figures 5D, H). To best model the basin geometry, our models favor small to moderate Te values. For section I, a Te value of ca. 25 km, corresponding to a flexural rigidity of 9.7 × 10²² N·m, yields the best-fit results. For section II, a relatively larger plate rigidity is required. A Te value of ca. 40 km, corresponding to a flexural rigidity of 4 × 10²³ N·m, provides the best-fit results.
The sensitivity analysis presents how computed STD changes with load width and load height. The test reveals that at a fixed Te value and a certain displacement value, computed STD is insensitive to the load width when the load width is over ca. 90 km and ca. 110 km for section I and section II, respectively, but rather more sensitive to the load height (Figures 7A, B). This is controlled by the short-wavelength nature of plate flexure (Watts, 2001), meaning that thrust loads that are too far from the cross section have no influence on the deflection of the basin basement. We consider thrust loads at a small load width to be less robust because 1) the load profile at a small load width would exceed the critical taper angle of mountain belts, making it geologically implausible, and 2) it does not conform to the anatomy of a typical fold-thrust belt system that develops from the hinterland towards the foreland (Davis et al., 2011). At a large load width, the load height can be confined within a narrow range (Figures 7A, B), allowing us to determine the best-fit load height at each stage.
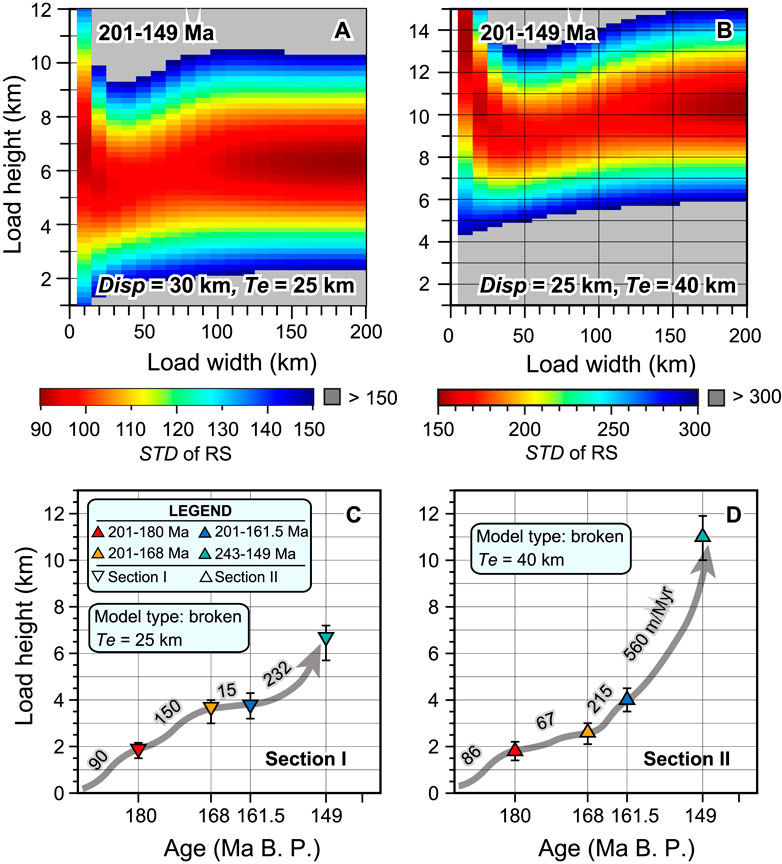
FIGURE 7. Sensitivity test results of flexural modeling for section I (A) and section II (B) based on broken models at stage 4 with the best-fit plate rigidity and displacement value. Evolution of best-fit load heights for the Micangshan structural belt (C) and the Dabashan structure belt (D) plotted at the end of each flexural modeling stage. The number denotes the average growth rate of load height. RS, residual subsidence; STD, standard deviation.
For both sections, the best-fit flexural modeling results reveal a general growth of load height (Figures 7C, D). For section I, at the end of the first stage, the load height was ca. 1.9 km (Figure 7C). It increased to ca. 3.7 km for the second stage and remained stable (ca. 3.8 km) for the third stage. At the end of the final stage, the load height increased to ca. 6.7 km. Corresponding to the four stages, the normalized growth rates of load height were 90 m/Myr, 150 m/Myr, 15 m/Myr, and 232 m/Myr, respectively. For section II, it underwent a similar growth but with different growth rates (Figure 7D). Load height increased from ca. 1.8 km to ca. 2.6 km, then to ca. 4 km and finally to ca. 11 km, corresponding to normalized growth rates of 86 m/Myr, 67 m/Myr, 215 m/Myr, and 560 m/Myr, respectively.
Interestingly, flexural simulations reveal that the combined subsidence induced by the thrust load and associated sediment deposits fails to account for all the subsidence within the basin, for all the parameter combinations explored within the model parameter space, in both continuous and broken models. An anomalous residual subsidence component is observed along both sections at all stages (Figure 8). The residual subsidence, separated from the best-fit results, exhibits a long-wavelength nature at all times, although it is disturbed by small local variations. For section I, corresponding to the four stages, the average cumulative residual subsidence increased from ca. 188 m to ca. 249 m, then ca. 381 m, and finally ca. 759 m (Figures 8A–D). This corresponds to average residual subsidence rates of 9 m/Myr, 5.1 m/Myr, 20.3 m/Myr, and 30.2 m/Myr, respectively. For section II, the average cumulative residual subsidence increased from ca. 181 m to ca. 210 m, then ca. 323 m, and finally ca. 700 m (Figures 8E–H), corresponding to subsidence rates of 8.6 m/Myr, 2.4 m/Myr, 17.4 m/Myr, and 30.1 m/Myr, respectively.
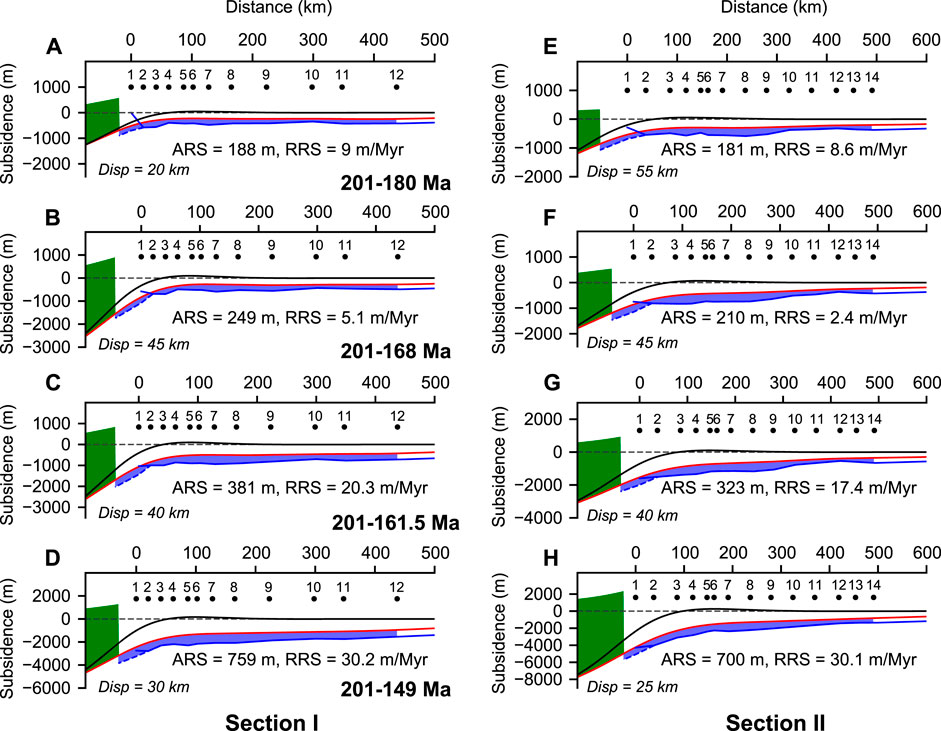
FIGURE 8. Flexural modeling results of section I (A–D) and section II (E–H) based on best-fit parameter combinations determined by the broken model. For better representation of modeling results, only a portion of mountain load is displayed. The legend is the same as Figure 2. ARS, average residual subsidence; RRS, average rate of residual subsidence.
Our best-fit Te values inferred from flexural models fall within the range of values for continental lithosphere in collisional zones (∼5–50 km) compiled from previous studies (Burov and Diament, 1995; Watts, 2001; Garcia-Castellanos and Cloetingh, 2011 and references therein). Additionally, our results agree with Mckenzie’s findings, which were mostly based on signals extracted from gravity data, that the effective elastic thickness of the present-day lithosphere is typically smaller than 40 km (e.g., McKenzie et al., 2014; McKenzie et al., 2015; McKenzie, 2018). More importantly, our findings are generally consistent with a previous flexural study conducted for the Triassic Sichuan Basin, where plate rigidity values of 5 × 10²³–5 × 1024 N·m were determined, corresponding to Te values of 43–54 km (Li et al., 2003), although their modeling sections are perpendicular to the Longmenshan fold-thrust belt. Therefore, the flexural rigidity of the Yangtze block inferred from our models appears reasonable.
The best-fit Te values obtained from the two sections are inconsistent, with a lower plate rigidity in the Micangshan region. Significantly, along-strike variations of Te values were also observed by Li et al. (2003) in a section that transects the northern Longmenshan fold-thrust belt, providing further confirmation of our results. The discrepancy of best-fit Te values between the two sections suggest potential spatial variations in plate rigidity. Spatially variable elastic thickness of the lithosphere has also been reported elsewhere, and this is often attributed to 1) localized weakening or attenuation of the lithosphere due to pre-existing faults (e.g., Fosdick et al., 2014; Curry et al., 2019) or thermal heating (e.g., Copeland et al., 2017), 2) inherited rheological heterogeneities within the crust or lithosphere (e.g., Saylor et al., 2020), or decoupling between the crust and the mantle lithosphere (e.g., Burov and Diament, 1995). Li et al. (2003) interpreted the lower Te value in their northern section as being caused by the Permian extensional faults beneath the present-day Longmenshan fold-thrust belt. It is possible that the pre-existing extension faults may have weakened the lithosphere, resulting in a lower plate rigidity. Geographically, our section I is close to the northern section in Li et al. (2003). Therefore, it is likely that the observed lower plate rigidity along section I was related to the fault-weakened lithosphere. Another potential source of variations could stem from heterogeneities in the basement of the Yangtze block. Previous studies have suggested that the basement of the present-day Sichuan Basin can be divided into three SW-NE trending units, each with distinct basement compositions (Guo et al., 1996). The basement of the western Sichuan Basin primarily comprises the metamorphosed Huangheshui group, whereas in the middle Sichuan Basin, it is composed of more stable Archean migmatite gneiss and Paleoproterozoic Kangding Complex (He et al., 2020). This contrast in compositions of the basement may have contributed to the observed differences in plate rigidity.
Given that the load height of the basin-adjacent mountain belts can be constrained within a narrow range, as demonstrated by sensitivity analysis (Figures 7A, B), the best-fit load heights obtained through flexural modeling allow for a first-order estimation of topographic growth along the northern margin of the Yangtze block. This can further provide critical insight into mountain-building processes, such as crustal thickening processes, during the Jurassic. The normalized growth rates of load height (i.e., rates of crustal thickening) between discrete points in time, though lacking details in-between, permit a first-order constraint on the intensities of post-collisional deformation. Nevertheless, it is important to note that flexural modeling only yields relative topography gain above a base level (i.e., relief), rather than providing information on absolute elevation (Saylor et al., 2020). Besides, the crustal thickening rate is not equivalent to the growth rate of absolute elevation or exhumation rate inferred from thermochronology studies, as the final topography is the result of flexural isostasy of the lithosphere. Therefore, a direct comparison between the paleoelevation given by stable isotopes or fossil assemblages (e.g., Fan and Carrapa, 2014) and topography given by flexural modeling, or between exhumation rates and crustal growth rates, might be inappropriate. Albeit with caveats, we argue that the overall trends should be similar.
The general increase in load height along both sections (Figures 7C, D) suggests an overall crustal thickening process in the Micangshan and Dabashan regions, with limited crustal thickening during the Early to Middle Jurassic, followed by a more rapid and intensified phase during the Late Jurassic. The slow crustal growth rates in the first two stages indicate that the post-collisional deformation along the northern margin of the Yangtze block was relatively weak. The relative stability of topography in the Micangshan region in the late Middle Jurassic (stage 3 in Figure 7C) may suggest a quiescent phase during that time. This could explain the relatively uniform subsidence pattern along this section during this time (Figure 5C), likely due to a slow sediment feeding rate from the source area. Meanwhile, the topography continued to grow in the Dabashan region during this stage (stage 3 in Figure 7D), suggesting continuous compression. The rapid growth of crustal thickness during the Late Jurassic is further supported by findings from field structural studies which suggested that strong compressional deformation have occurred during this time (e.g., Li et al., 2013; Liu et al., 2015a; Li et al., 2015; Li et al., 2017).
However, the topographic growth or crustal growth is not homogenous, but exhibits spatial variations along strike. Compared to the Micangshan region, the compression in the Dabashan region appeared relatively weaker during the Early to early Middle Jurassic in the first two stages (Figures 7C, D). Conversely, the more rapid growth rates of crustal thickness in the Dabashan region during the latter two stages suggest that the Dabashan region may have experienced significantly more intensified structural deformation. This is supported by the overall shortening rates obtained from balanced seismic profiles, with over 10% of shortening rates in the Micangshan region (He et al., 2020; Wang, 2023) and over 28% in the Dabashan region (Li et al., 2015) during the Jurassic. Our results only indicate rapid crustal growth during the Late Jurassic, without providing information on thrust nappes. Li et al. (2013), Li et al. (2015) argued that the North Dabashan belt may have formed in the Middle to Early Cretaceous based on field structural analysis and mica 40Ar/39Ar geochronology. Therefore, the rapid crustal growth in the Dabashan region may be related to the emplacement of the North Dabashan belt.
Another rapid subsidence pulse occurred from the latest Late Jurassic to the earliest Early Cretaceous during the deposition of the Penglaizhen Formation, as revealed by the single well subsidence curves (Figures 5A, C, D, F). This subsidence pulse may suggest another rapid crustal thickening event, although we did not model this stage due to the incompleteness of stratigraphic sections. Moreover, it has been reported that the thickness of the Penglaizhen Formation near the Longmenshan fold-thrust belt is greater than the basin interior (Li Y.Q. et al., 2018; He et al., 2020), suggesting that the Longmenshan structural belt may have been active and uplifted by this time.
Quantification of subsidence induced by the basin-adjacent mountain belts along the northern margin of the Yangtze block against total basin subsidence reveals that thrust loading exerts dominant control (a positive influence denoted by the light-red shaded area in Figure 9) only along its margin, with its maximum contribution reaching up to 50%–65% near the thrust front (Figure 9). The mountain load only generates a narrow foredeep along its foreland, indicating that the influence of thrust loading on basin subsidence is extremely limited when compared to the basin width. The width of the foredeep is less than 100 km for section I (Figures 9A–D), owing to the smaller Te value, and is at most 120 km for section II (Figures 9E–H). Moving further basin-ward, the positive influence turns into a negative influence, producing a forebulge that drives the basement to uplift, as denoted by the light-green shaded area in Figure 9. Its negative contribution is at most ca. 20% of total basin subsidence even at the deflection inflection points (DIP in Figures 2B, 9). Further to the south, the subsidence in the backbulge region becomes even more limited (almost close to zero) and is negligible. The maximum extent influenced by the basin-adjacent mountain belts (sum of the width of the foredeep and the forebulge) does not exceed 250 km for section I and 350 km for section II, respectively (Figure 9).

FIGURE 9. Quantified relative contribution of flexural subsidence induced by the basin-adjacent thrust load against cumulative total subsidence at each stage for section I (A–D) and II (E–H), respectively. Note that subfigures are aligned at the thrust front without considering the distance from the thrust front to the well section.
Given the short-wavelength nature of plate flexure, similar conclusions can be drawn for the Longmenshan fold-thrust belt and the Xuefengshan fold-thrust belt, although we did not model these two structural belts due to incomplete stratigraphic sections. These fold-thrust belts may have controlled basin subsidence at certain stages, but their impact was likely still spatially limited, much like the mountain belts along the northern margin of the Yangtze block. Previous studies on the Longmenshan fold-thrust belt have suggested that it did not uplift until the Late Jurassic to Early Cretaceous (Liu et al., 2005b; Liu et al., 2015a). The uplift of the Longmenshan fold-thrust belt could have generated a narrow foredeep along its strike, creating additional accommodation space. This is supported by the thicker Penglaizhen Formation along its margin (Li Y.Q. et al., 2018; He et al., 2020). Regarding the Xuefengshan fold-thrust belt, its thick-skinned thrust belt was in its early stages in the Middle Jurassic (Yan et al., 2018c). During the Late Jurassic to Early Cretaceous, the Xuefengshan fold-thrust belt migrated further inland. Nevertheless, the generated foredeep would still be far beyond reach of the interior of the basin.
Theoretically, the forebulge produced by an end load is supposed to be above the water and exposed to the surface (Watts, 2001; Horton, 2018). This might leave a hiatus in the sedimentary record or form a condensed zone with limited thickness (generally <5–100 m) (Horton, 2018; Horton, 2022) owing to slow sediment accumulation. Similarly, the backbulge region is more likely to be non-depositional owing to limited subsidence (Allen and Allen, 2013). Oddly, this is not the case in the Sichuan Basin, as no regional hiatus has been found in the forebulge and backbulge regions. More intriguingly, during stage 4 in the Late Jurassic when the most intense crustal thickening occurred to its north, subsidence over the forebulge regions along both sections was still over 1,000 m (Figures 5D, H). It is important to note that the addition of sediment loading, as the foredeep is filled with sediments, will further drive the lithosphere downward, leading to extra basin subsidence. However, the combined subsidence induced by mountain loading and sediment loading still fails to account for all the subsidence in the basin, as demonstrated by the presence of the widespread residual subsidence component. Different from the so-called water-loaded tectonic subsidence that only corrects for sediment loading, the residual subsidence is corrected for both basin-adjacent mountain loading and associated sediment loading, highlighting the necessity for additional driving mechanism(s) for this anomalous subsidence component.
The residual subsidence has long been observed in numerous studies in other areas (e.g., Jordan, 1981; Pang and Nummendal, 1995; Liu and Nummedal, 2004; Curry et al., 2019). Previous studies have attributed this anomalous subsidence component to dynamic subsidence related to deep mantle processes (e.g., mantle convection induced by plate subduction) (e.g., Liu and Nummedal, 2004; Liu and Gurnis, 2010; Liu et al., 2011; Liu et al., 2014; Heller and Liu, 2016), thermal subsidence, or pre-existing structures (Curry et al., 2019). Some localized thermal events may have contributed to some of the excess subsidence. But abnormal thermal events at such a large scale have never been reported and thus can be ruled out. It is reasonable to assume that tectonic reactivation of local faults within the basement might play a role. However, these local faults typically generate deformations at much shorter wavelengths, leading to localized subsidence. Given that most of the structures surrounding the present-day Sichuan Basin formed at later stages, as revealed by field structural studies and interpreted seismic profiles (e.g., Yan et al., 2003; Liu et al., 2005b; Yan et al., 2018c; Li J H et al., 2018; Jia et al., 2020), the basement of the Sichuan Basin likely remained relatively inactive during the Jurassic. Consequently, it seems unlikely that the long-wavelength anomalous residual subsidence was controlled by local structures pronounced within the basement. Instead, these local faults are presumably responsible for the local small disturbances seen along the residual subsidence profiles (Figure 8). It appears more likely that this anomalous subsidence component was controlled by a mechanism that produces long-wavelength subsidence.
The South China plate has experienced significant modifications since the Early Mesozoic in relation to the subduction of the Paleo-Pacific plate (the Izanagi plate) beneath East Asia (e.g., Li and Li, 2007; Wang et al., 2013; Liu et al., 2015a; Liu et al., 2017; Li J H et al., 2018; Liu L. et al., 2021; Liu L.J. et al., 2021; Peng et al., 2021). Flat subduction models, which could have started at ca. 250 Ma, were invoked to explain the formation of the 1,300-km-wide intracontinental orogenic belt (the Xuefengshan fold-thrust belt and the continental marginal structural belt further to the east) and the widely distributed magmatism in South China (Li et al., 2006; Li and Li, 2007). While the initiation of the Xuefengshan fold-thrust belt and the timing of slab flattening are now believed to have occurred later in time, likely commencing during the Middle Jurassic (e.g., Liu et al., 2015a; Li J H et al., 2018; Liu L. et al., 2021), the linkage between the Xuefengshan fold-thrust belt and flat subduction of the Paleo-Pacific plate has long been recognized (e.g., Cui and Li, 1983; Liu et al., 2015a; Li J H et al., 2018). More specifically, the progressively westward-migrating fold-thrust belt was thought to be related to the stress transmitted horizontally not only from the subduction zone, but also from the flattened plate beneath the South China plate, as the flat slab gradually migrated inland.
In addition to the horizontally transmitted stress, mantle convection induced by plate subduction could cause vertical deflection of the lithosphere, referred to as dynamic topography, with an amplitude up to 2 km at long wavelengths (Braun, 2010; Flament et al., 2013). The mantle suction force in front of the leading edge of the flat slab will pull the lithosphere to subside, generating a dynamic subsidence center there (Figure 10A) (e.g., Liu et al., 2011; Heller and Liu, 2016). However, few studies have explicitly investigated the role of flat subduction on the formation of the Sichuan Basin. Residual subsidence extracted from flexural simulations reflects slow rates of residual subsidence during the Early to early Middle Jurassic (Figures 8A, B, E, F). This phase of slow subsidence was followed by the gradually enhanced subsidence rates during stage 3 and stage 4 from the late Middle Jurassic to Late Jurassic (Figures 8C, D, G, H). This enhanced residual subsidence perhaps even continued into the earliest Early Cretaceous during the deposition of the Penglaizhen Formation, as suggested by the single well subsidence curves (Figure 6), given the limited control of mountain belts. Significantly, this subsidence pattern correlates well with dynamic subsidence that would be generated by a westward flat subduction model. Specifically, as the flat slab gradually migrates inland, the loci of maximum subsidence will migrate concomitantly with the leading edge of the flat slab (Figures 10A–C). Consequently, accelerated rates of dynamic subsidence will be seen in a borehole that locates to the west of the leading edge (Figure 10D), assuming a constant subduction rate. Additionally, by running geodynamic models, Peng et al. (2021) argued that the enhanced subsidence rates in the Sichuan Basin during the Late Cretaceous were related to the flat subduction of the Paleo-Pacific plate, further demonstrating that deep mantle processes may have shaped the ups and downs of the South China plate. In their study, the flat subduction of the Paleo-Pacific plate was likely another stage of flat subduction, as suggested by a previous study that multiple stages of flat subduction may have occurred beneath East Asia (Liu L.J. et al., 2021). Therefore, along with the long-wavelength nature of the residual subsidence, it is highly likely that the residual subsidence was dynamic in nature, presumably related to the flat subduction of the Paleo-Pacific plate beneath the South China plate. To establish a more robust connection between the residual subsidence and deep mantle processes, more sophisticated geodynamic models are required in the future.
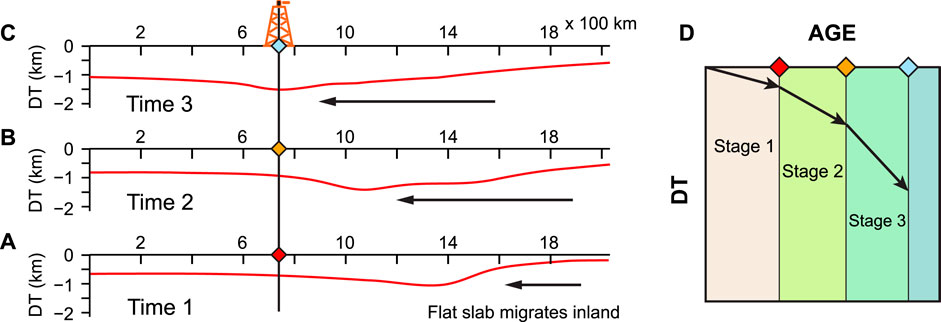
FIGURE 10. A conceptional model illustrating the evolution of dynamic topography along a section parallel to the direction of plate subduction (A–C) and at a fixed location (D), as the leading edge of the flat slab gradually migrates inland. DT, dynamic topography.
Our findings have implications for the formation of the Jurassic Sichuan Basin. Here, we propose a two-stage evolution model for the basin. During the first stage, from the Early to Middle Jurassic, the proto-Sichuan Basin formed as a unified basin with its size significantly larger than its present-day extent (Figure 11A) (Liu et al., 2015a; He et al., 2020). The longmenshan fold-thrust belt did not uplift by this time and the Xuefengshan fold-thrust belt was still in its early stages. Intracontinental deformation along the northern margin of the Yangtze block was relatively weak during this stage, resulting in limited topographic changes. Consequently, the flexural control of the basin-adjacent thrust belts on the basin was weak and spatially restricted, as denoted by the green foredeep front line in Figure 11A.
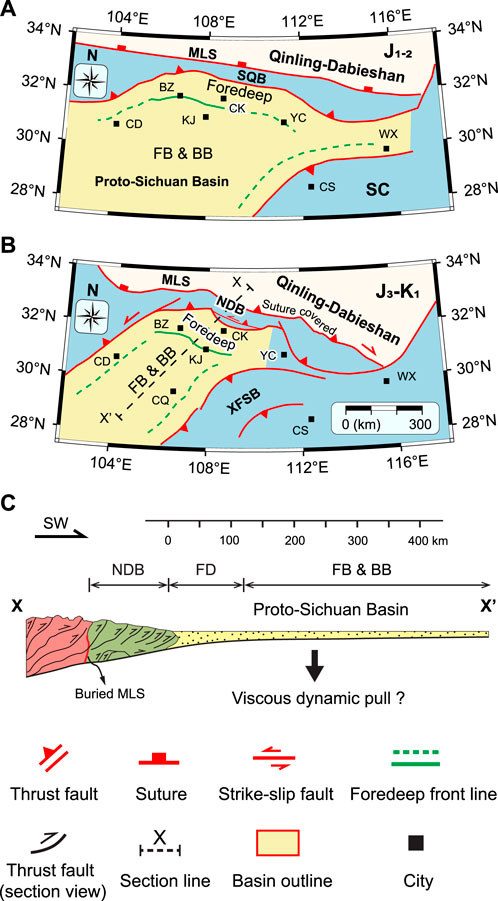
FIGURE 11. A two-stage evolution model of the Sichuan basin (A–B), highlighting the limited extent of flexural subsidence induced by the basin-adjacent mountain belts. The dashed green line denotes inferred foredeep front line. (C) A section view illustrating that the basin was initiated by the combined effect of the basin-adjacent mountain belts and potentially dynamic subsidence in relation to deep mantle processes. Refer to (B) for section location. Basin outlines and structural lines are from Liu et al. (2015b) and He et al. (2020). BZ, Bazhong city; CD, Chengdu city; CK, Chengkou county; CQ, Chongqing city; CS, Changsha city; KJ, Kaijiang city; YC, Yichang city; WX, Wuxue city. FB and BB, forebulge and backbulge; MLS, Mianlue suture; NDB, North Dabashan belt; SC, South China plate; SQB, South Qinling block; XFSB, Xuefengshan fold-thrust belt.
During the Late Jurassic to the earliest Early Cretaceous, compression along the northern margin of the Yangtze block intensified, leading to substantial crustal thickening. This topographic growth generated a foredeep along its foreland, creating a distinctive subsidence center (Liu et al., 2012; He et al., 2020). The Dabashan region experienced more intense compression compared to the Micangshan region, therefore creating a deeper foredeep with thicker sediment infills. The rapid crustal growth in the Dabashan region was likely caused by the emplacement of the North Dabashan belt (Figure 11B). Despite the significant topographic growth, the control of the basin-adjacent mountain belts on the basin was still limited in space. As the thrust belts moved southward, the front of the foredeep further migrated basin-ward (green line in Figure 11B). The foredeep front was south of the Bazhong city in front of the Micangshan fold-thrust belt and reached the Kaijiang city in front of the Dabashan fold-thrust belt, respectively. Meanwhile, the Longmenshan fold-thrust belt may have uplifted and the Xuefengshan fold-thrust belt migrated further northwestward. Similarly, the flexural control of the Longmenshan fold-thrust belt and the Xuefengshan fold-thrust belt were spatially limited (Figure 11B).
In both stages, the limited flexural control of the basin-adjacent mountain belts failed to drive subsidence in the forebulge and backbulge regions, where unconformities or non-depositional zones were expected to develop. Dynamic subsidence, induced by the flat subduction of the Paleo-Pacific plate, may have served as a background subsidence component, driving the forebulge and backbulge regions to subside (Figure 11C). Initially, the subducted slab was located far away from the continental interior and therefore the rate of dynamic subsidence was slow. The basin was underfilled due to the limited sediment supplies from the mountain belts to the north. As the flat slab progressively migrated inland, the rate of dynamic subsidence was enhanced, creating more accommodation space. Despite with increased accommodation space, the basin was overfilled due to the enhanced sediment supplies from source areas. In addition to the sediments shredded from the north, the progressively westward-migrating Xuefengshan fold-thrust belt and the uplifted Longmenshan fold-thrust belt may have also contributed to the basin’s sediment influx. Collectively, these processes resulted in the accumulation of thick sediment layers over the forebulge and backbulge regions (Figure 11C). In summary, the Sichuan Basin was controlled by the combined effects of flexural subsidence along its margin and dynamic subsidence that likely served as a background subsidence component.
Flexural modeling reveals that flexural loading by the basin-adjacent thrust belts exerts dominant control on basin subsidence only along its margin, failing to drive subsidence in the forebulge and backbulge regions. The foredeep generated by the Micangshan fold-thrust belt is less than 100 km wide and is at most 120 km wide for the Dabashan fold-thrust belt. The maximum extent controlled by the thrust belts does not exceed 250 km and 350 km for the Micangshan fold-thrust belt and the Dabashan fold-thrust belt, respectively.
Flexural simulations suggest spatial variations in plate rigidity within the northern Yangtze block, with a smaller plate rigidity in the Micangshan region (equivalent to an elastic thickness of ca. 25 km) and a stronger rigidity in the Dabashan region with an elastic thickness of ca. 40 km.
The northern margin of the Yangtze block experienced relatively weak crustal thickening during the Early to Middle Jurassic, followed by a more rapid and intensified crustal thickening event in the Late Jurassic, which possibly continued into the earliest Early Cretaceous. The intensity of post-collisional deformation is not uniform along strike, with the Dabashan region generally experiencing more intense compression than the Micangshan region during the Late Jurassic.
The limited flexural control of the basin-adjacent fold-thrust belts on basin subsidence and the presence of an anomalous residual subsidence component in the basin highlight the necessity for a new subsidence mechanism. The long-wavelength residual subsidence was likely dynamic in nature, related to the flat subduction of the Paleo-Pacific plate (the Izanagi plate) beneath the South China plate. Studies using more sophisticated geodynamic models are necessary to establish a more robust and detailed linkage in the future.
The original contributions presented in the study are included in the article/Supplementary Material, further inquiries can be directed to the corresponding author.
NW: Conceptualization, Formal Analysis, Investigation, Methodology, Software, Visualization, Writing–original draft. SL: Conceptualization, Funding acquisition, Project administration, Supervision, Writing–review and editing. XL: Data curation, Writing–review and editing, Formal Analysis, Investigation. BZ: Writing–review and editing, Data curation, Formal Analysis, Investigation, Validation. RR: Funding acquisition, Writing–review and editing, Data curation, Investigation, Project administration, Resources. ZC: Data curation, Writing–review and editing, Funding acquisition, Investigation, Project administration, Resources.
This work was supported by grants from the National Natural Science Foundation of China (4205000124, 41820104004, 42241201), by Seed Grant from IUGS Big Science Program (GJ-C03-889 2023-002) and by program from Research Institute of Petroleum Exploration and Development (yjxk2019-1).
We thank two reviewers for their constructive comments that significantly improve the quality and clarity of the manuscript. We thank the China National Petroleum Corporation (CNPC) and the National Geological Archives of China (https://www.ngac.org.cn/) for providing us with borehole data. We also express our gratitude to Xingyu Mou, Hui Jin, Zecheng Wang, and Hua Jiang for their help in collecting borehole data, as well as to Guangting Liu, Xiaoyang Dou, and Qihang Wang for their assistance in data preparation. Special thanks go to Chengfa Lin for valuable discussions. Most of the figures in this paper were prepared using the Generic Mapping Tools (Wessel et al., 2019).
Authors RR and ZC were employed by the Research Institute of Petroleum Exploration and Development.
The remaining authors declare that the research was conducted in the absence of any commercial or financial relationships that could be construed as a potential conflict of interest.
The reviewer LQ declared a shared affiliation with the authors NW, SL, XL, and BZ to the handling editor at the time of review.
All claims expressed in this article are solely those of the authors and do not necessarily represent those of their affiliated organizations, or those of the publisher, the editors and the reviewers. Any product that may be evaluated in this article, or claim that may be made by its manufacturer, is not guaranteed or endorsed by the publisher.
The Supplementary Material for this article can be found online at: https://www.frontiersin.org/articles/10.3389/feart.2023.1276832/full#supplementary-material
Allen, P. A., and Allen, J. R. (2013). Basin analysis: principles and application to petroleum play assessment. John Wiley & Sons.
Allen, P. A., and Heller, P. L. (2011). “Dispersal and preservation of tectonically generated alluvial gravels in sedimentary basins,” in Tectonics of sedimentary basins: Recent advances. Editors C. Busby, and A. A. Pérez (Wiley-Blackwell Publishing Ltd.), 111–130. doi:10.1002/9781444347166
Angevine, C. L., Heller, P. L., and Paola, C. (1990). Quantitative sedimentary basin modeling. Tulsa, Okla: American Association of Petroleum Geologists.
Braun, J. (2010). The many surface expressions of mantle dynamics. Nat. Geosci. 3 (12), 825–833. doi:10.1038/Ngeo1020
Burov, E. B., and Diament, M. (1995). The effective elastic thickness (T-E) of continental lithosphere - what does it really mean. J. Geophys Res-Sol Ea. 100 (B3), 3905–3927. doi:10.1029/94jb02770
Cardozo, N. (2016). Matlab Scripts for basin analysis, 1D Airy backstripping. Available at http://www.ux.uis.no/∼nestor/work/matlabScripts.html (Accessed October 10, 2020).
Catuneanu, O., Abreub, V., Bhattacharya, J. P., Blum, M. D., Dalrymple, R. W., Eriksson, P. G., et al. (2009). Towards the standardization of sequence stratigraphy. Earth-Sci Rev. 92 (1-2), 1–33. doi:10.1016/j.earscirev.2008.10.003
Copeland, P., Currie, C. A., Lawton, T. F., and Murphy, M. A. (2017). Location, location, location: the variable lifespan of the laramide orogeny. Geology 45 (3), 223–226. doi:10.1130/G38810.1
Cui, S., and Li, J. (1983). On the indosinian orogeny along the Chinese western pacific belt. Acta Geol. Sin. 57, 51–61. (in Chinese).
Curry, M. E., van der Beek, P., Huisrnans, R. S., Wolf, S. G., and Munoz, J. A. (2019). Evolving paleotopography and lithospheric flexure of the Pyrenean Orogen from 3D flexural modeling and basin analysis. Earth Planet S. C. Lett. 515, 26–37. doi:10.1016/j.epsl.2019.03.009
Davis, G. H., Reynolds, S. J., and Kluth, C. F. (2011). Structural geology of rocks and regions. John Wiley & Sons.
Dong, S. W., Gao, R., Yin, A., Guo, T. L., Zhang, Y. Q., Hu, J. M., et al. (2013). What drove continued continent-continent convergence after ocean closure? Insights from high-resolution seismic-reflection profiling across the daba Shan in central China. Geology 41 (6), 671–674. doi:10.1130/G34161.1
Dong, Y. P., and Santosh, M. (2016). Tectonic architecture and multiple orogeny of the qinling orogenic belt, Central China. Gondwana Res. 29 (1), 1–40. doi:10.1016/j.gr.2015.06.009
Fan, M. J., and Carrapa, B. (2014). Late cretaceous-early eocene laramide uplift, exhumation, and basin subsidence in Wyoming: crustal responses to flat slab subduction. Tectonics 33 (4), 509–529. doi:10.1002/2012tc003221
Flament, N., Gurnis, M., and Muller, R. D. (2013). A review of observations and models of dynamic topography. Lithosphere-Us 5 (2), 189–210. doi:10.1130/L245.1
Flemings, P. B., and Jordan, T. E. (1989). A synthetic stratigraphic model of foreland basin development. J. Geophys. Res. Solid Earth 94 (B4), 3851–3866. doi:10.1029/JB094iB04p03851
Fosdick, J. C., Graham, S. A., and Hilley, G. E. (2014). Influence of attenuated lithosphere and sediment loading on flexure of the deep-water Magallanes retroarc foreland basin, Southern Andes. Tectonics 33 (12), 2505–2525. doi:10.1002/2014tc003684
Garcia Castellanos, D., and Cloetingh, S. (2011). “Modeling the interaction between lithospheric and surface processes in foreland basins,” in Tectonics of sedimentary basins: Recent advances. Editors C. Busby, and A. A. Pérez (Wiley-Blackwell Publishing Ltd.), 152–181. doi:10.1002/9781444347166
Garcia-Castellanos, D. (2002). Interplay between lithospheric flexure and river transport in foreland basins. Basin Res. 14 (2), 89–104. doi:10.1046/j.1365-2117.2002.00174.x
Gradstein, F. M., and Ogg, J. G. (2020). “The chronostratigraphic scale,” in Geologic time scale 2020. Editors F. M. Gradstein, J. G. Ogg, M. D. Schmitz, and G. M. Ogg (Elsevier), 21–32.
Guo, Z. W., Deng, K. L., and Han, Y. H. (1996). Formation and evolution of the Sichuan Basin. Beijing: Geology Press. (in Chinese).
He, D. F., Li, D. S., Zhang, G. W., Zhao, L. Z., Fan, C., Lu, R. Q., et al. (2011). Formation and evolution of multi-cycle superposed Sichuan Basin, China. Chin. J. Geol. 46 (03), 589–606. (in Chinese with English abstract).
He, D. F., Li, Y. Q., Huang, H. Y., Zhang, J., Lu, R. Y., and Li, D. (2020). Evolution of multi-phase basin in Sichuan and oil and gas generation. Beijing: Science press. (in Chinese).
Heller, P. L., Bowdler, S. S., Chambers, H. P., Coogan, J. C., Hagen, E. S., Shuster, M. W., et al. (1986). Time of initial thrusting in the sevier orogenic belt, Idaho Wyoming and Utah. Geology 14 (5), 388–391. doi:10.1130/0091-7613(1986)14<388:Toitit>2.0.Co;2
Heller, P. L., and Liu, L. J. (2016). Dynamic topography and vertical motion of the US Rocky Mountain region prior to and during the Laramide orogeny. Geol. Soc. Am. Bull. 128 (5-6), 973–988. doi:10.1130/B31431.1
Horton, B. K. (2018). Sedimentary record of Andean mountain building. Earth-Sci Rev. 178, 279–309. doi:10.1016/j.earscirev.2017.11.025
Horton, B. K. (2022). Unconformity development in retroarc foreland basins: implications for the geodynamics of andean-type margins. J. Geol. Soc. Lond. 179 (3). doi:10.1144/jgs2020-263
Huang, D. Y. (2019). Jurassic integrative stratigraphy and timescale of China. Sci. China Earth Sci. 62 (1), 223–255. doi:10.1007/s11430-017-9268-7
Jia, D., Li, Y. Q., Yan, B., Li, Z. G., Wang, M. M., Chen, Z. X., et al. (2020). The cenozoic thrusting sequence of the longmen Shan fold-and-thrust belt, eastern margin of the Tibetan plateau: insights from low-temperature thermochronology. J. Asian Earth Sci. 198, 104381. doi:10.1016/j.jseaes.2020.104381
Jordan, T. E. (1981). Thrust loads and foreland basin evolution, Cretaceous, western United States. AAPG Bull. 65 (12), 2506–2520. doi:10.1306/03B599F4-16D1-11D7-8645000102C1865D
Kominz, M. A., Patterson, K., and Odette, D. (2011). Lithology dependence of porosity in slope and deep marine sediments. J. Sediment. Res. 81 (9-10), 730–742. doi:10.2110/jsr.2011.60
Li, J. H., Dong, S. W., Cawood, P. A., Zhao, G. C., Johnston, S. T., Zhang, Y. Q., et al. (2018). An Andean-type retro-arc foreland system beneath northwest South China revealed by SINOPROBE profiling. Earth Planet S. C. Lett. 490, 170–179. doi:10.1016/j.epsl.2018.03.008
Li, J. H., Dong, S. W., Yin, A., Zhang, Y. Q., and Shi, W. (2015). Mesozoic tectonic evolution of the daba Shan thrust belt in the southern qinling orogen, central China: constraints from surface geology and reflection seismology. Tectonics 34 (8), 1545–1575. doi:10.1002/2014tc003813
Li, J. H., Zhang, Y. Q., Dong, S. W., and Shi, W. (2013). Structural and geochronological constraints on the mesozoic tectonic evolution of the North dabashan zone, South Qinling, central China. J. Asian Earth Sci. 64, 99–114. doi:10.1016/j.jseaes.2012.12.001
Li, W. P., Liu, S. F., Wang, Y., Qian, T., and Gao, T. J. (2017). Duplex thrusting in the South Dabashan arcuate belt, central China. J. Struct. Geol. 103, 120–136. doi:10.1016/j.jsg.2017.09.007
Li, X. H., Li, Z. X., Li, W. X., and Wang, Y. J. (2006). Initiation of the indosinian orogeny in South China: evidence for a permian magmatic arc on hainan island. J. Geol. 114 (3), 341–353. doi:10.1086/501222
Li, Y., Allen, P. A., Densmore, A. L., and Xu, Q. (2003). Evolution of the longmen Shan foreland basin (western sichuan, China) during the late triassic indosinian orogeny. Basin Res. 15 (1), 117–138. doi:10.1046/j.1365-2117.2003.00197.x
Li, Y. Q., He, D. F., Li, D., Lu, R. Q., Fan, C., Sun, Y. P., et al. (2018). Sedimentary provenance constraints on the jurassic to cretaceous paleogeography of Sichuan Basin, SW China. Gondwana Res. 60, 15–33. doi:10.1016/j.gr.2018.03.015
Li, Z. X., and Li, X. H. (2007). Formation of the 1300-km-wide intracontinental orogen and postorogenic magmatic province in mesozoic south China: A flat-slab subduction model. Geology 35 (2), 179–182. doi:10.1130/G23193a.1
Liu, L. J., and Gurnis, M. (2010). Dynamic subsidence and uplift of the Colorado Plateau. Geology 38 (7), 663–666. doi:10.1130/G30624.1
Liu, L. J., Peng, D. D., Liu, L., Chen, L., Li, S. Z., Wang, Y. Y., et al. (2021). East Asian lithospheric evolution dictated by multistage Mesozoic flat-slab subduction. Earth-Sci Rev. 217, 103621. doi:10.1016/j.earscirev.2021.103621
Liu, L., Liu, L., and Xu, Y. G. (2021). Mesozoic intraplate tectonism of East Asia due to flat subduction of a composite terrane slab. Earth-Sci Rev. 214, 103505. doi:10.1016/j.earscirev.2021.103505
Liu, S. F., Gurnis, M., Ma, P. F., and Zhang, B. (2017). Reconstruction of northeast Asian deformation integrated with western Pacific plate subduction since 200 Ma. Earth-Sci Rev. 175, 114–142. doi:10.1016/j.earscirev.2017.10.012
Liu, S. F., Heller, P. L., and Zhang, G. W. (2003). Mesozoic basin development and tectonic evolution of the Dabieshan orogenic belt, central China. Tectonics 22 (4). doi:10.1029/2002tc001390
Liu, S. F., Li, W. P., Wang, K., Qian, T., and Jiang, C. X. (2015a). Late Mesozoic development of the southern Qinling-Dabieshan foreland fold-thrust belt, Central China, and its role in continent-continent collision. Tectonophysics 644, 220–234. doi:10.1016/j.tecto.2015.01.015
Liu, S. F., Nummedal, D., and Gurnis, M. (2014). Dynamic versus flexural controls of late cretaceous western interior basin, USA. Earth Planet S. C. Lett. 389, 221–229. doi:10.1016/j.epsl.2014.01.006
Liu, S. F., and Nummedal, D. (2004). Late cretaceous subsidence in Wyoming: quantifying the dynamic component. Geology 32 (5), 397–400. doi:10.1130/G20318.1
Liu, S. F., Nummedal, D., and Liu, L. J. (2011). Migration of dynamic subsidence across the late cretaceous United States western interior basin in response to farallon plate subduction. Geology 39 (6), 555–558. doi:10.1130/G31692.1
Liu, S. F., Nummedal, D., Yin, P. G., and Luo, H. J. (2005a). Linkage of Sevier thrusting episodes and Late Cretaceous foreland basin megasequences across southern Wyoming (USA). Basin Res. 17 (4), 487–506. doi:10.1111/j.1365-2117.2005.00277.x
Liu, S. F., Qian, T., Li, W. P., Dou, G. X., and Wu, P. (2015b). Oblique closure of the northeastern Paleo-Tethys in central China. Tectonics 34 (3), 413–434. doi:10.1002/2014tc003784
Liu, S. F., Steel, R., and Zhang, G. W. (2005b). Mesozoic sedimentary basin development and tectonic implication, northern Yangtze block, eastern China: record of continent - continent collision. J. Asian Earth Sci. 25 (1), 9–27. doi:10.1016/j.jseaes.2004.01.010
Liu, S. G., Deng, B., Li, Z. W., and Sun, W. (2012). Architecture of basin-mountain systems and their influences on gas distribution: A case study from the Sichuan basin, south China. J. Asian Earth Sci. 47, 204–215. doi:10.1016/j.jseaes.2011.10.012
Liu, S. G., Yang, Y., Deng, B., Zhong, Y., Wen, L., Sun, W., et al. (2021). Tectonic evolution of the Sichuan Basin, southwest China. Earth-Sci Rev. 213, 103470. doi:10.1016/j.earscirev.2020.103470
McKenzie, D. (2018). A geologist reflects on a long career. Annu. Rev. Earth Pl. S. C. 46, 1–20. doi:10.1146/annurev-earth-082517-010111
McKenzie, D., Yi, W. Y., and Rummel, R. (2015). Estimates of Te for continental regions using GOCE gravity. Earth Planet S. C. Lett. 428, 97–107. doi:10.1016/j.epsl.2015.07.036
McKenzie, D., Yi, W. Y., and Rummel, R. (2014). Estimates of Te from GOCE data. Earth Planet S. C. Lett. 399, 116–127. doi:10.1016/j.epsl.2014.05.003
Meng, Q. R., Wang, E., and Hu, J. M. (2005). Mesozoic sedimentary evolution of the northwest Sichuan basin: implication for continued clockwise rotation of the South China block. Geol. Soc. Am. Bull. 117 (3-4), 396–410. doi:10.1130/B25407.1
Müller, R. D., Cannon, J., Williams, S., and Dutkiewicz, A. (2018). PyBacktrack 1.0: A tool for reconstructing paleobathymetry on oceanic and continental crust. Geochem Geophy Geosy 19 (6), 1898–1909. doi:10.1029/2017gc007313
Pang, M., and Nummendal, D. (1995). Flexural subsidence and basement tectonics of the cretaceous western interior basin, united-states. Geology 23 (2), 173–176. doi:10.1130/0091-7613(1995)023<0173:Fsabto>2.3.Co;2
Peng, D. D., Liu, L. J., and Wang, Y. Y. (2021). A newly discovered late-cretaceous east asian flat slab explains its unique lithospheric structure and tectonics. J. Geophys Res-Sol Ea. 126 (10). doi:10.1029/2021JB022103
Qian, T., Liu, S. F., Li, W. P., Gao, T. J., and Chen, X. L. (2015). Early-middle jurassic evolution of the northern Yangtze foreland basin: A record of uplift following triassic continent-continent collision to form the qinling-dabieshan orogenic belt. Int. Geol. Rev. 57 (3), 327–341. doi:10.1080/00206814.2015.1006270
Saylor, J. E., Jordan, J. C., Sundell, K. E., Wang, X. M., Wang, S. Q., and Deng, T. (2018). Topographic growth of the Jishi Shan and its impact on basin and hydrology evolution, NE Tibetan Plateau. Basin Res. 30 (3), 544–563. doi:10.1111/bre.12264
Saylor, J. E., Rudolph, K. W., Sundell, K. E., and van Wijk, J. (2020). Laramide orogenesis driven by late cretaceous weakening of the North American lithosphere. J. Geophys Res-Sol Ea. 125 (8). doi:10.1029/2020jb019570
Sclater, J. G., and Christie, P. A. (1980). Continental stretching: an explanation of the post-mid-Cretaceous subsidence of the central north sea basin. J. Geophys. Res. Solid Earth 85 (B7), 3711–3739. doi:10.1029/JB085iB07p03711
Simpson, G. D. H. (2006). Modelling interactions between fold-thrust belt deformation, foreland flexure and surface mass transport. Basin Res. 18 (2), 125–143. doi:10.1111/j.1365-2117.2006.00287.x
Tian, Y. T., Kohn, B. P., Phillips, D., Hu, S. B., Gleadow, A. J. W., and Carter, A. (2016). Late cretaceous-earliest paleogene deformation in the longmen Shan fold-and-thrust belt, eastern Tibetan plateau margin: pre-cenozoic thickened crust? Tectonics 35 (10), 2293–2312. doi:10.1002/2016tc004182
Tian, Y. T., Kohn, B. P., Zhu, C. Q., Xu, M., Hu, S. B., and Gleadow, A. J. W. (2012a). Post-orogenic evolution of the mesozoic micang Shan foreland basin system, central China. Basin Res. 24 (1), 70–90. doi:10.1111/j.1365-2117.2011.00516.x
Tian, Y. T., Qiu, N. S., Kohn, B. P., Zhu, C. Q., Hu, S. B., Gleadow, A. J. W., et al. (2012b). Detrital zircon (U-Th)/He thermochronometry of the mesozoic daba Shan foreland basin, central China: evidence for timing of post-orogenic denudation. Tectonophysics 570, 65–77. doi:10.1016/j.tecto.2012.08.010
Turer, D., and Maynard, J. B. (2003). Combining subsidence analysis and detrital modes of sandstones to constrain basin history: an example from the eastern pontides of Turkey. Int. Geol. Rev. 45 (4), 329–345. doi:10.2747/0020-6814.45.4.329
Van Sickel, W. A., Kominz, M. A., Miller, K. G., and Browning, J. V. (2004). Late cretaceous and cenozoic sea-level estimates: backstripping analysis of borehole data, onshore New Jersey. Basin Res. 16 (4), 451–465. doi:10.1111/j.1365-2117.2004.00242.x
Wan, T. F. (2013). A new Asian tectonic unit map. Geol. China 40 (5), 1351–1365. (in Chinese with English abstract).
Wang, J., Ye, Y., Pei, R., Tian, Y. M., Feng, C. Q., Zheng, D. R., et al. (2018). Age of jurassic basal sauropods in sichuan, China: A reappraisal of basal sauropod evolution. Geol. Soc. Am. Bull. 130 (9-10), 1493–1500. doi:10.1130/B31910.1
Wang, Q. H. (2023). Quantitative deformation reconstruction of the peripheral Sichuan Basin since mesozoic. Beijing: China university of geosciences. [master thesis]. [China].
Wang, Y. J., Fan, W. M., Zhang, G. W., and Zhang, Y. H. (2013). Phanerozoic tectonics of the South China block: key observations and controversies. Gondwana Res. 23 (4), 1273–1305. doi:10.1016/j.gr.2012.02.019
Wessel, P., Luis, J. F., Uieda, L., Scharroo, R., Wobbe, F., Smith, W. H. F., et al. (2019). The generic mapping tools version 6. Geochem Geophy Geosy 20 (11), 5556–5564. doi:10.1029/2019gc008515
Xie, X., and Heller, P. L. (2009). Plate tectonics and basin subsidence history. Geol. Soc. Am. Bull. 121 (1-2), 1–64. doi:10.1130/B26398.1
Xu, W. M., Ruhl, M., Jenkyns, H. C., Hesselbo, S. P., Riding, J. B., Selby, D., et al. (2017). Carbon sequestration in an expanded lake system during the Toarcian oceanic anoxic event. Nat. Geosci. 10 (2), 129–134. doi:10.1038/Ngeo2871
Xu, W. M., Weijers, J. W., Ruhl, M., Idiz, E. F., Jenkyns, H. C., Riding, J. B., et al. (2021). Molecular and petrographical evidence for lacustrine environmental and biotic change in the palaeo-Sichuan mega-lake (China) during the Toarcian Oceanic Anoxic Event. Geol. Soc. Lond. Spec. Publ. 514 (1), 335–357. doi:10.1144/SP514-2021-2
Yan, D. P., Qiu, L., Chen, F., Li, L., Zhao, L., Yang, W. X., et al. (2018c). Structural style and kinematics of the Mesozoic Xuefengshan intraplate orogenic belt, South China Block. Earth Sci. Front. 25 (1), 1–13. doi:10.13745/j.esf.yx.2017-5-16
Yan, D. P., Qiu, L., Wells, M. L., Zhou, M. F., Meng, X. K., Lu, S., et al. (2018b). Structural and geochronological constraints on the early mesozoic north longmen Shan thrust belt: foreland fold-thrust propagation of the SW qinling orogenic belt, northeastern Tibetan plateau. Tectonics 37 (12), 4595–4624. doi:10.1029/2018tc004986
Yan, D. P., Zhou, M. F., Song, H. L., Wang, X. W., and Malpas, J. (2003). Origin and tectonic significance of a mesozoic multi-layer over-thrust system within the Yangtze block (south China). Tectonophysics 361 (3-4), 239–254. doi:10.1016/S0040-1951(02)00646-7
Yan, D. P., Zhou, M. F., Li, S. B., and Wei, G. Q. (2011). Structural and geochronological constraints on the Mesozoic-Cenozoic tectonic evolution of the Longmen Shan thrust belt, eastern Tibetan Plateau. Tectonics 30. doi:10.1029/2011tc002867
Yan, D. P., Zhou, Y., Qiu, L., Wells, M. L., Mu, H. X., and Xu, C. G. (2018a). The longmenshan tectonic Complex and adjacent tectonic units in the eastern margin of the Tibetan plateau: A review. J. Asian Earth Sci. 164, 33–57. (in Chinese with English abstract). doi:10.1016/j.jseaes.2018.06.017
Zhang, G. W., Guo, A. L., Wang, Y. J., Li, S. Z., Dong, Y. P., Liu, S. F., et al. (2013). Tectonics of South China continent and its implications. Sci. China Earth Sci. 56 (11), 1804–1828. doi:10.1007/s11430-013-4679-1
Zhang, G. W., Zhang, B. R., Yuan, X. C., and Xiao, Q. H. (2001). Qinling orogenic belt and continental dynamics. Beijing: Science Press. (in Chinese).
Zhang, Y. Q., Dong, S. W., Li, J. H., and Shi, W. (2011). Mesozoic multi-directional compressional tectonics and formation-reformation of Sichuan basin. Geol. China 38 (2), 233–250. (in Chinese with English abstract).
Keywords: Sichuan Basin, basin and mountain coupling mechanism, fold-thrust belt, anomalous residual subsidence, crustal thickening, dynamic subsidence
Citation: Wan N, Liu S, Li X, Zhang B, Ren R and Chen Z (2023) Limited flexural control of fold-thrust belts on the Jurassic Sichuan Basin, South China. Front. Earth Sci. 11:1276832. doi: 10.3389/feart.2023.1276832
Received: 13 August 2023; Accepted: 13 September 2023;
Published: 10 October 2023.
Edited by:
Yuntao Tian, Sun Yat-sen University, ChinaReviewed by:
Liang Qiu, China University of Geosciences, ChinaCopyright © 2023 Wan, Liu, Li, Zhang, Ren and Chen. This is an open-access article distributed under the terms of the Creative Commons Attribution License (CC BY). The use, distribution or reproduction in other forums is permitted, provided the original author(s) and the copyright owner(s) are credited and that the original publication in this journal is cited, in accordance with accepted academic practice. No use, distribution or reproduction is permitted which does not comply with these terms.
*Correspondence: Shaofeng Liu, c2hhb2ZlbmdAY3VnYi5lZHUuY24=
Disclaimer: All claims expressed in this article are solely those of the authors and do not necessarily represent those of their affiliated organizations, or those of the publisher, the editors and the reviewers. Any product that may be evaluated in this article or claim that may be made by its manufacturer is not guaranteed or endorsed by the publisher.
Research integrity at Frontiers
Learn more about the work of our research integrity team to safeguard the quality of each article we publish.