 Beibei Zheng1,2,3
 Shijie Song
- 1Xi’an University of Science and Technology, College of Geology and Environment, Xi’an, China
- 2Research Institute of Coal Green Mining Geology, Xi’an University of Science and Technology, Xi’an, China
- 3Key Laboratory of Geological Guarantee for Coal Green Development of Shaanxi Province, Xi’an, China
- 4Ningxia Survey and Monitor Institute of Land and Resources, Xi’an, China
- 5Shanxi Water Group Construction Investment Co., Ltd., Shanxi, China
Introduction: How to solve the contradiction between coal mining and soil and water conservation is a key scientific problem to realize ecological environment protection and high-quality development in the middle reaches of the Yellow River.
Methods: Using FLAC3D numerical simulation experiment method, the influence of loess slope surface shape and coal seam overburden structure coupling on slope movement and deformation is studied.
Results: Under any surface slope shape, the average slope subsidence coefficient (q slope average) increases with the increase of sand layer coefficient after coal mining subsidence. When the sand layer coefficient is less than 0.71, the q slope average increases rapidly, with an increase of more than 2.86%, and when the sand layer coefficient is greater than 0.71, the q slope average tends to be stable. Under any surface slope shape, the q slope average decreases with the increase of sand-mud ratio. When the overburden structure characteristics of any coal seam and the natural slope of the surface slope are less than or equal to 5°, the q slope average of the convex slope is the largest, and the q slope average of the four slope types is ranked as follows: convex slope > straight slope ≈ composite slope > concave slope; When the structural characteristics of overlying strata in any coal seam and the natural slope of surface slope are more than 5°, the q slope average of concave slope is the largest, and the q slope average of four slope types is in the order of concave slope > straight slope ≈ composite slope > convex slope. With the increase of the natural slope of the surface slope, the q slope average first decreases and then increases, and the inflection point is 15°. The influence law of loess slope surface morphology and coal seam overburden structure on the average horizontal movement of slope surface is similar to that of average subsidence of slope surface.
Discussion: The results can provide scientific basis for surface movement and deformation and soil and water conservation in the mining subsidence area of northern Shaanxi in the middle reaches of the Yellow River Basin in China.
1 Introduction
As an important disposable energy source in China, coal plays a leading role in the energy structure of China. Based on the energy structure characteristics of China, which is “short of oil, short of gas and relatively rich in coal”, coal resources, as the ballast stone of China’s energy security, will not change in the short term (Wang et al., 2021; Song et al., 2023a; Song et al., 2023c). Even by 2050, the proportion of coal in China’s primary energy consumption will not be less than 40% (Qiu et al., 2022). With the development of coal resources in eastern China, the western region has become the main producing area of coal development (Liu F. et al., 2022; Qiu et al., 2022; Song et al., 2023d), and the middle reaches of the Yellow River have become the center of coal strategic westward movement (Fang et al., 2016; Zhang et al., 2019; Shen et al., 2022). However, the soil erosion in the middle reaches of the Yellow River Basin is serious, and the natural ecology is very fragile. Especially, the mining area in northern Shaanxi and the national key control area of soil erosion with heavy sand and coarse sand in the Yellow River are highly overlapped in space (Song et al., 2022), so that the mining damage problems such as surface deformation, water resources destruction and soil quality degradation caused by coal mining continue to aggravate regional soil erosion (Song et al., 2018; Li, 2019; Li et al., 2019). This is contrary to the important instruction on ecological environment protection in the middle reaches of the Yellow River (Song et al., 2023b) and the requirement of “paying special attention to soil and water conservation in the middle reaches of the Yellow River” in the Outline of Ecological Protection and High-quality Development Plan of the Yellow River Basin. Therefore, how to solve the sharp contradiction between coal mining and soil and water conservation has become a key scientific issue to realize ecological environment protection and high-quality development in the middle reaches of the Yellow River Basin in China.
Scholars at home and abroad have been paying attention to the influence of loess layer on the development characteristics and evolution law of coal mining subsidence, and have obtained a lot of valuable research results from the properties of loess layer such as thickness, vertical joints, collapsibility and physical and mechanical properties. For example, Song et al. (2011) studied the influence of the rock-soil ratio of overlying strata on mining subsidence in the elm bay mining area in northern Shaanxi, and found that the extremely thick loess layer over 100 m has the effect of reducing subsidence coefficient. Tang (2011) thought that the surface subsidence in the loess-covered area in the west is caused by the load of loess layer and the uneven settlement of bedrock, and a two-layer medium prediction model of coal mining subsidence considering the effect of the thick loess layer is established through numerical simulation test. Tang F. Q. et al. (2019) studied the quantitative relationship between the equivalent load of loess layer and equivalent mining width, depth and bedrock subsidence, and established a two-medium model to simulate the interaction between loess layers based on random medium theory. The natural form (slope) of loess layer on the surface, as a direct embodiment of the complex topography in the loess gully region, is not only an important geological factor affecting the coal mining subsidence, but also an important topographic basis for shaping the final form of the surface after subsidence, so that there is obvious mutual feedback effect between “the shape and deformation of loess slope” and “the characteristics and laws of coal mining subsidence”. However, it is not enough to study and reveal the influence of coal mining subsidence on the surface loess slope shape from the perspective of feedback. As a typical sedimentary mineral, the overburden structure of coal is not only a very significant and important geological condition, but also a carrier for the upward spread of underground mining activities (Song et al., 2011). The sand layer coefficient of coal seam overburden reflects the quantitative characteristics of rock strata in overburden, and the sand-mud ratio of coal seam overburden reflects the overall lithologic characteristics of overburden. The characteristics of strata in the overlying strata structure of coal measures determine the overall shape and panorama of the surface subsidence basin, and mining subsidence will show completely different basic characteristics and laws under different overlying strata structure conditions.
In view of this, taking the loess gully region in Northern China as the research area, this paper studies and reveals the influence of coal mining subsidence on the surface loess slope shape (slope and slope length) under the coupling effect of “the structure of coal seam overburden and the natural shape of surface loess slope” by using the numerical simulation experiment method, with a view to enriching and deepening the research on the law of soil erosion in the coal mining subsidence area and providing scientific basis for soil and water conservation in northern Shaanxi coal mining area in the middle reaches of the Yellow River Basin in China.
2 Overview of the research area
Located in the north of Shaanxi Province, China, the coal mining area in northern Shaanxi Province generally refers to Yushenfu mining area, including two relatively large mining areas, Yushen and Shenfu mining area, so it is also collectively referred to as the northern Shaanxi coal mining area (see Figure 1). The length of northern Shaanxi coal mining area is about 84 km in the east-west direction and 85 km in the North-South direction, and the whole coal mining area is about 7,139.7 km2 (Liu et al., 2021; Song et al., 2021; Shang et al., 2022). The overall terrain is high in the northwest and low in the southeast, and the altitude is within the range of 1,200–1300 m (Wang, 2020; Pei et al., 2023). According to the genesis and morphological characteristics of the landform in the mining area, it can be divided into three types: wind-blown sand landform, loess landform and valley landform, among which the loess landform can be divided into loess ridge landform, sand cover loess ridge landform and loess hilly landform. It is cold in winter in this area, with low humidity and temperature. The annual average temperature ranges from 6.2°C to 8.5°C, and there is little precipitation, mainly from July to September (Song et al., 2023e; Ma et al., 2023), and the annual rainfall ranges from 194.7 to 531.6 mm. The vegetation types in the study area are single, mainly including Salix psammophila, Artemisia selengensis, Sabina vulgaris and Caragana korshinskii. The geological structure in the area is simple, 2−2 coal is the main coal seam, and the thickness of coal seams is above 2 m, with the maximum thickness of 12.5 m. The overall characteristics of coal seams are shallow burial, large thickness and thin overlying bedrock, which has good mining conditions. The mining method in the mining area is mainly longwall fully mechanized mining, which is easy to cause environmental geological problems. Coal mining and roadway excavation will produce a large area of mined-out area underground, and the collapse of mined-out area will lead to the caving and bending subsidence of overlying strata, and cracks and surface subsidence will appear in different degrees all over the mining area (Shao et al., 2015). The ecological environment of mining areas in Northern Shaanxi is fragile, with drought and little rainfall all the year round and large evaporation. It is the key control area of soil erosion in Shaanxi Province, China, with serious soil erosion for many years, with soil erosion modulus exceeding 5,000 t/(km2a) (Song et al., 2021). Secondly, the surface damage and soil erosion caused by coal mining in this area are very representative, so the northern Shaanxi mining area in China is chosen as the research area.
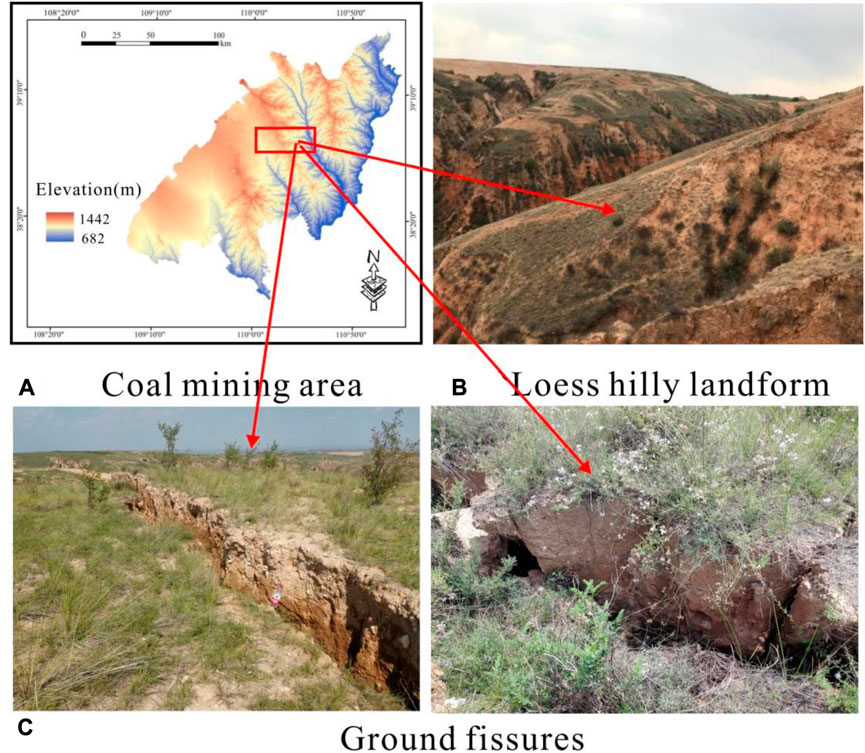
FIGURE 1. Geographical location map of mining area [see figures (A–C) for mining area, loess hilly landform and ground fissures].
3 Model construction and numerical simulation experiment
3.1 Model construction
Based on the overlying strata structure and loess slope shape of coal seam in northern Shaanxi coal mining area, a numerical model framework is designed.
3.1.1 Frame selection
According to the survey data, the type of floor-coal seam-bedrock-loess layer in the actual geological occurrence structure of 2−2 main coal seam in the study area accounts for more than 60% (Wang et al., 2010), so it is used as the basic framework of the model.
3.1.2 Structural design of loess layer
Firstly, the topography of the mining area in northern Shaanxi is complex. In order to more accurately express the slope shape of the surface loess layer, we divide the loess layer into two sections. Secondly, the mining area in Northern Shaanxi is covered by loess, and the loess layer is thick. From the point of view of numerical model construction, it is necessary to maintain the consistency and integrity of the overlying geotechnical structure of coal seams on both sides of the model, so the loess layer is divided into two sections. In addition, Song et al. (2016) found that the mining depth will have an important influence on the deformation of the surface slope during coal mining. In order to eliminate the influence of mining depth on mining subsidence as much as possible, we divide the loess layer into two sections, the upper section is a slope section and the lower section is a horizontal section.
3.1.3 Surface slope shape design
According to the results of detailed geological survey carried out by predecessors in the study area, the slope of loess slope in northern Shaanxi mining area is mainly between 6° and 40°, and according to China’s Soil Erosion Classification and Classification Standard (SL190-2007), the slope is set to 5 slopes, which are 5°, 15°, 25°, 35°, and 45° in turn. The external morphology of loess slope is set to four types: straight slope, concave slope, convex slope and compound slope. The design of slope and slope shape covers all types of surface slope morphology in the study area.
3.1.4 Design of overlying strata structure
According to the detailed geological survey results carried out by predecessors in the study area, the overlying bedrock of 2−2 coal seam in the whole area is mainly composed of sandstone and mudstone, and the number of sandstone layers is generally 5–15, with a maximum of 35. The thickness ratio of sandstone and mudstone in bedrock is between 60% and 80%, so the sand-mud ratio (reflecting the overall lithologic characteristics of overlying strata) is selected as 6:4 and 8:2. The sand coefficient (reflecting the quantitative characteristics of strata in overlying strata) is 0.67, 0.71, and 0.75.
3.1.5 Geometric parameter design of numerical model frame
Set all models to be 1,000 m long in the X direction, 300 m wide in the Y direction, 295 m high at the top of the slope in the Z direction and 235 m high at the bottom of the slope. Set the floor thickness to be 10 m, the coal seam thickness to be 5 m, the overlying bedrock thickness to be 210 m, the maximum thickness of loess layer to be 70 m, and the lower section thickness to be 10 m.
According to the above variables, 120 different models are constructed.
3.2 Numerical simulation experiment process
In the study area, the thickness of coal seam is 5 m, and in the simulation process, the mining height is cut at one time. In the process of model excavation, the working face is gradually advanced from left to right, and the excavation is once every 50 m, and the ground surface begins to sink and move horizontally until the operation is stopped due to full mining. Take 25° compound slope with sand-mud ratio of 8:2 and sand layer coefficient of 0.75 as an example, and its three-dimensional numerical model is shown in Figure 2.
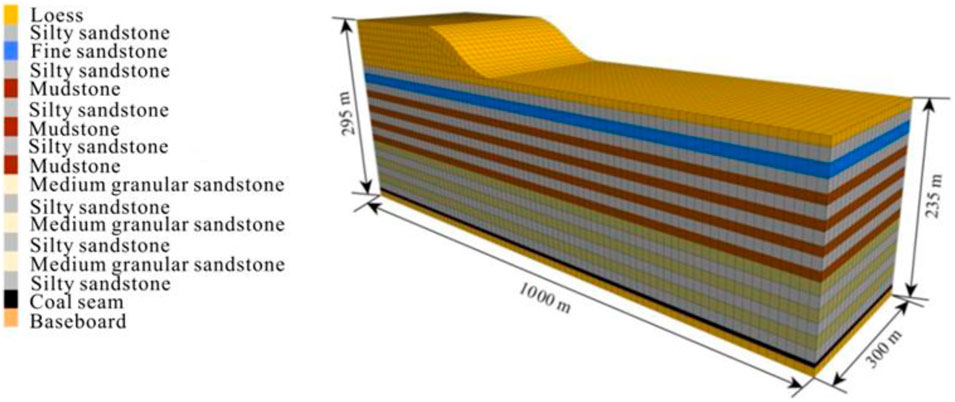
FIGURE 2. Three-dimensional numerical model diagram of 25° compound slope.
3.2.1 Setting of physical and mechanical parameters
According to the representative geological drilling and geotechnical test data, the physical and mechanical parameters of each geotechnical layer in the model are assigned, and the results are shown in Table 1.

TABLE 1. Physical and mechanical parameters of rock and soil layers.
3.2.2 Boundary condition setting
Mohr Coulomb model is selected in FLAC3D numerical simulation software, and the constraint conditions of the model are set according to the actual excavation situation of the model. Firstly, the front, back, left, right and lower boundaries of the model are defined as fully constrained boundaries, and the upper part of the model is loess layer, which will move in both horizontal and vertical directions after full mining, and is defined as free boundary.
3.2.3 Data extraction and calculation
Through the simulation experiment, the surface subsidence and horizontal movement of each model on the slope are extracted by Fish language, and the extracted data are converted into coordinates to represent the shape of the slope after subsidence. Irregular slope gradient and slope length are replaced by uniform slope under the same conditions (Song et al., 2011). The average slope length of the typical loess slope in the coal mining subsidence area of northern Shaanxi is 50 m. The upper 10 m of the subsidence slope is divided into the top, the middle 30 m is divided into the middle and the lower 10 m is divided into the toe. A monitoring point is arranged every 2 m on the loess slope, and a total of 25 monitoring points are evenly arranged, including 5 monitoring points at the top of the slope, 15 monitoring points at the middle of the slope and 5 monitoring points at the foot of the slope. The subsidence coefficient q slope at the toe of the slope (the maximum subsidence and mining height ratio at the toe of the slope) and the average subsidence coefficient q slope average (the weighted average of subsidence and mining height ratio at the top, middle and toe of the slope, in which the weights of monitoring points at the top, middle and toe of the slope are 1/5, 3/5 and 1/5 respectively) are adopted to analyze the overlying strata structure of coal seam. According to the extracted monitoring point data, the horizontal movement of each model is calculated (the translation momentum of all monitoring points on the slope is averaged). Because the moving direction of the model slope is consistent with the advancing direction of the working face, it is a positive value, which is represented by the u slope average.
4 Results and analysis
4.1 Influence of coal mining subsidence on average subsidence of slope surface
According to the extracted monitoring point data, the subsidence coefficient at the toe of different models and the average subsidence coefficient of the whole slope are calculated, and the calculation results are shown in Table 2. It can be seen from Table 2 that when the subsidence coefficient q slope at the foot of the model is used to analyze the loess slope movement law, the difference of subsidence coefficient among the models is too small, and there is no obvious law. However, when the subsidence coefficient q slope average is used to analyze the loess slope movement law, the q slope average can represent the movement and deformation of the whole slope. Under the coupling effect of different loess slope shapes and coal seam overburden structure, the subsidence coefficients among the models are also obviously different, so the q slope average is used to analyze the loess slope movement and deformation.

TABLE 2. Average subsidence coefficient and average displacement of loess slope after full mining.
4.1.1 Influence of overlying strata structure on average subsidence coefficient of slope surface
4.1.1.1 Influence of sand layer coefficient on average subsidence coefficient of slope surface
According to the data in Table 2 and Figure 3 is drawn, as shown in the figure below.
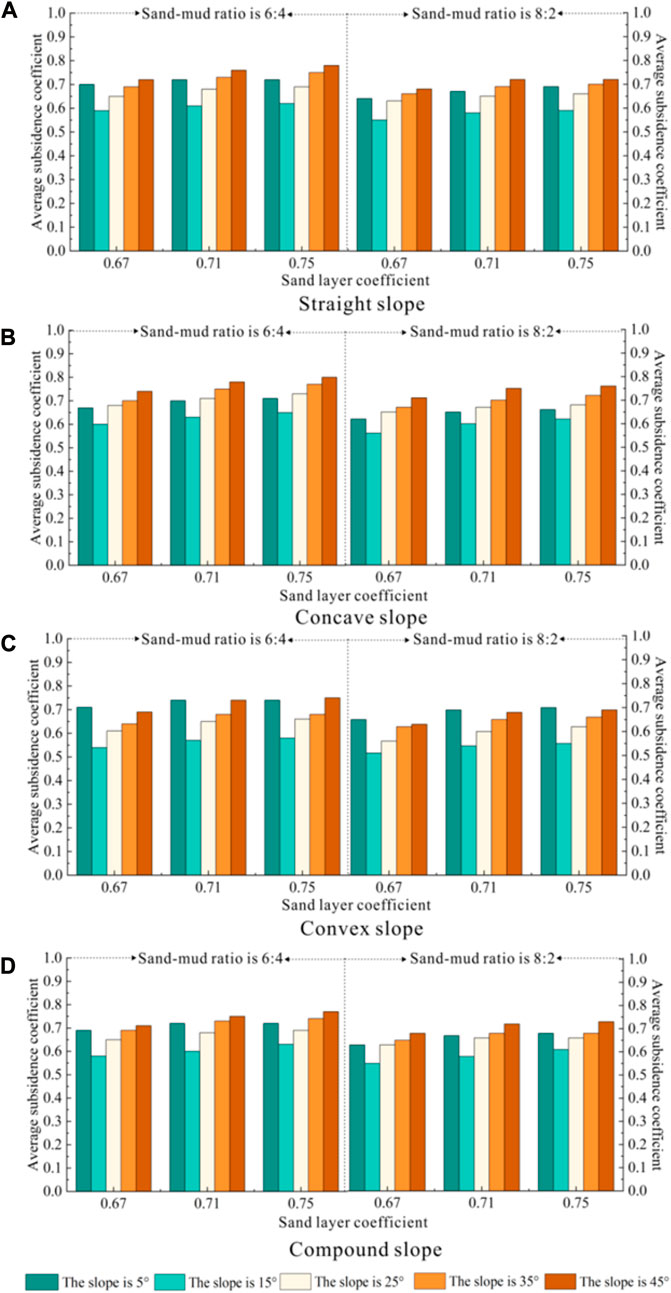
FIGURE 3. Comparison of average subsidence coefficient changes of slopes with different slopes under the coupling effect of loess slope shape and sand-mud ratio of coal seam overlying strata [see Figures (A–D) for straight slopes, concave slopes, convex slopes and composite slopes].
From Table 1 and Figure 3, it can be seen that under any coupling type of loess slope surface shape and sand-mud ratio of coal seam overburden, the q slope average will show an increasing trend with the increase of sand layer coefficient. Specifically:
Under the coupling effect of “sand-mud ratio of coal seam overburden is 6:4+arbitrary slope shape and natural slope ≤45°”, with the sand bed coefficient increasing from 0.67 to 0.71, the increase range of straight slope’s q slope average is 2.86%–5.80%, the increase range of concave slope’s q slope average is 4.48%–7.14%, the increase range of convex slope’s q slope average is 4.23%–7.25%, and that of compound slope is 4.35%–5.80%. Under the coupling effect of “sand-mud ratio of coal seam overburden is 8:2+arbitrary slope shape and natural slope ≤45°”, with the sand layer coefficient increasing from 0.67 to 0.71, the increase range of straight slope’s q slope average is 3.17%–5.88%, the increase range of concave slope’s q slope average is 3.08%–7.14%, the increase range of convex slope’s q slope average is 4.84%–7.94%, and that of compound slope is 4.62%–6.35%. However, under the coupling effect of “sand-mud ratio of overlying strata in any coal seam+arbitrary slope shape of surface and natural slope ≤45°”, with the increase of sand bed coefficient from 0.71 to 0.75, the q slope average has no obvious change and gradually tends to be stable. Therefore, it can be seen that the q slope average is obvious when the sand layer coefficient of coal seam overburden is ≤0.71, but the q slope average is stable after the sand layer coefficient is >0.71.
Under the coupling effect of “sand-mud ratio of coal seam overburden is 6:4+arbitrary slope shape and natural slope ≤45°”, with the sand bed coefficient increasing from 0.67 to 0.71, the increase speed of straight slope’s q slope average is 0.5–1, the increase speed of concave slope’s q slope average is 0.75–1.25, the increase speed of convex slope’s q slope average is 0.75–1.25 and that of composite slope is 0.5–1. Under the coupling effect of “sand-mud ratio of coal seam overburden is 8:2+arbitrary slope shape and natural slope ≤45°”, with the sand bed coefficient increasing from 0.67 to 0.71, the increase speed of straight slope’s q slope average is 0.5–1, the increase speed of concave slope’s q slope average is 0.5–1, the increase speed of convex slope’s q slope average is 0.75–1.25 and that of composite slope is 0.75–1. However, under the coupling effect of “sand-mud ratio of overlying strata in any coal seam+arbitrary slope shape and natural slope ≤45°”, with the increase of sand bed coefficient from 0.71 to 0.75, the increase speed of the q slope average has no obvious change and gradually tends to be stable. Therefore, it can be seen that the influence of the overburden sand coefficient of the coal seam on the q slope average is mainly manifested in two stages: when the overburden sand coefficient of the coal seam is ≤0.71, the increase speed of the q slope average is obvious, and it is sensitive to the change of the sand coefficient; When the overburden sand coefficient is >0.71, the increase speed of the q slope average does not change obviously, and the influence of the sand coefficient on the q slope average is weakened.
4.1.1.2 Influence of sand-mud ratio on average subsidence coefficient of slope surface
According to the data in Table 2, the comparison chart of the decline rate of the q slope average when the sand-mud ratio is 8:2 compared with the sand-mud ratio is 6:4 is drawn, as shown in Figure 4 below.
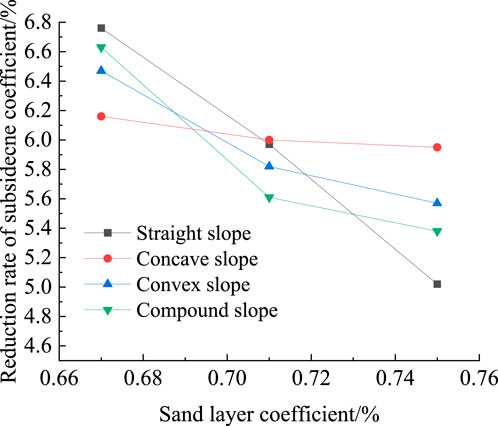
FIGURE 4. Comparison chart of decline rate of the q slope average with sand-mud ratio of 8:2 to 6:4.
As can be seen from Table 2 and Figure 4, with the increase of overburden sand coefficient of the coal seam, the decline rate of the q slope average with sand-mud ratio of 8:2 is gradually reduced compared with that of the q slope average with sand-mud ratio of 6:4. Specifically, when the sand layer coefficient is 0.67, the corresponding decline rate of the q slope average is the largest, and the decline rates of straight slope, concave slope, convex slope and composite slope are 6.76%, 6.16%, 6.47%, and 6.63% in turn. When the sand coefficient is 0.71, the decline rates of the q slope average corresponding to the four slope shapes are 5.98%, 6.00%, 5.82%, and 5.61% in turn. When the sand layer coefficient is 0.75, the decline rate of the corresponding q slope average is the smallest, and the decline rates of the four slope shapes are 5.03%, 5.95%, 5.57%, and 5.38% respectively. It can be seen that the decline rate of the q slope average decreases with the increase of sand layer coefficient, and the greater the sand layer coefficient, the weaker the influence of sand-mud ratio on the q slope average.
4.1.2 Influence of loess slope surface morphology on average subsidence coefficient of slope surface
4.1.2.1 Influence of slope gradient on average subsidence coefficient of slope surface
According to the data in Table 2, the average contrast map of the q slope average under the coupling effect of different coal seam overburden structure and loess slope shape is drawn, as shown in Figure 5 below. From Table 2 and Figure 5, it can be seen that under the coupling effect of loess slope gradient and coal seam overburden structure, the q slope average first decreases and then increases with the increase of loess slope gradient, specifically:
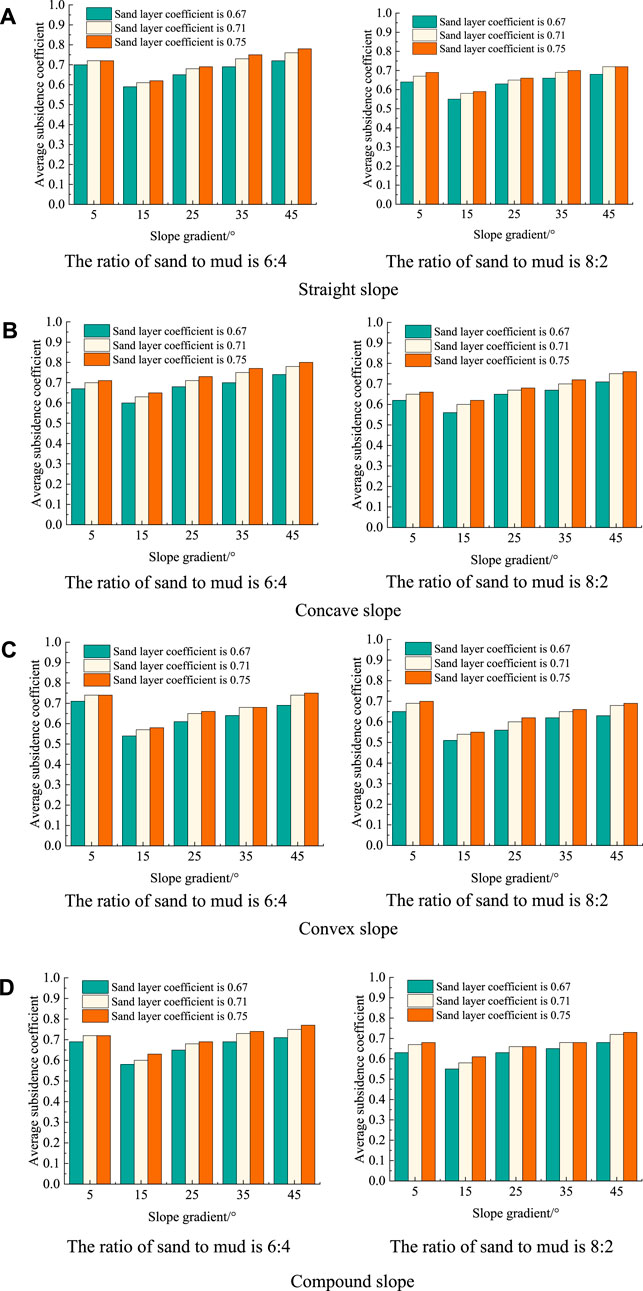
FIGURE 5. Comparison chart of average subsidence coefficient changes under the coupling effect of overburden structure of coal seam (sand-mud ratio of 6:4 is shown on the left and sand-mud ratio of 8:2 is shown on the right) and loess slope surface [straight slope, concave slope, convex slope and composite slope are shown in Figures (A–D)].
Under the coupling effect of “overburden sand coefficient of any coal seam and sand-mud ratio 6:4+arbitrary slope shape and natural slope ≤15°”, with the natural slope increasing from 5° to 15°, the decline rate of the straight slope’s q slope average is 13.89%–15.71%, the decline rate of the concave slope’s q slope average is 8.45%–10.45%, the decline rate of the convex slope’s q slope average is 21.62%–23.94%, and that of the compound slope is 12.50%–15.94%. Under the coupling effect of “overburden sand coefficient of any coal seam and sand-mud ratio 8:2+arbitrary slope shape and natural slope ≤15°”, with the natural slope increasing from 5° to 15°, the decline rate of the straight slope’s q slope average is 13.43%–14.49%, the decline rate of the concave slope’s q slope average is 6.06%–9.68%, the decline rate of the convex slope’s q slope average is 21.43%–21.74%, and that of the compound slope is 10.29%–13.43%. It can be seen that when the natural slope is ≤15°, the q slope average decreases with the increase of slope, and reaches the minimum when the slope is 15°.
Under the coupling effect of “overburden sand coefficient of any coal seam and sand-mud ratio 6:4+arbitrary slope shape of the surface and 15° < natural slope ≤45°”, with the increase of natural slope from 15° to 45°, the increase rate of straight slope’s q slope average is 10.77%–13.04%, the increase rate of concave slope’s q slope average is 8.82%–9.86%, and the increase rate of convex slope’s q slope average is 13.11%–13.85%, and that of compound slope is 9.23%–11.59%. Under the coupling effect of “overburden sand coefficient of arbitrary coal seam and sand-mud ratio of 8:2+arbitrary slope shape of surface and 15° < natural slope ≤45°”, with the increase of natural slope from 15° to 45°, the increase rate of straight slope’s q slope average is 7.94%–10.77%, the increase rate of concave slope’s q slope average is 9.23%–11.94%, and the increase rate of convex slope’s q slope average is 11.29%–13.33%, and that of compound slope is 7.94%–10.61%. It can be seen that the q slope average increases with the increase of slope when “15° < natural slope ≤45°”, and reaches the maximum when the slope is 45°.
4.1.2.2 Influence of slope shape on average subsidence coefficient of slope surface
According to the data in Table 2, the average contrast map of the q slope average under the coupling effect of different coal seam overburden structure and loess slope surface gradient is drawn, as shown in Figure 6.
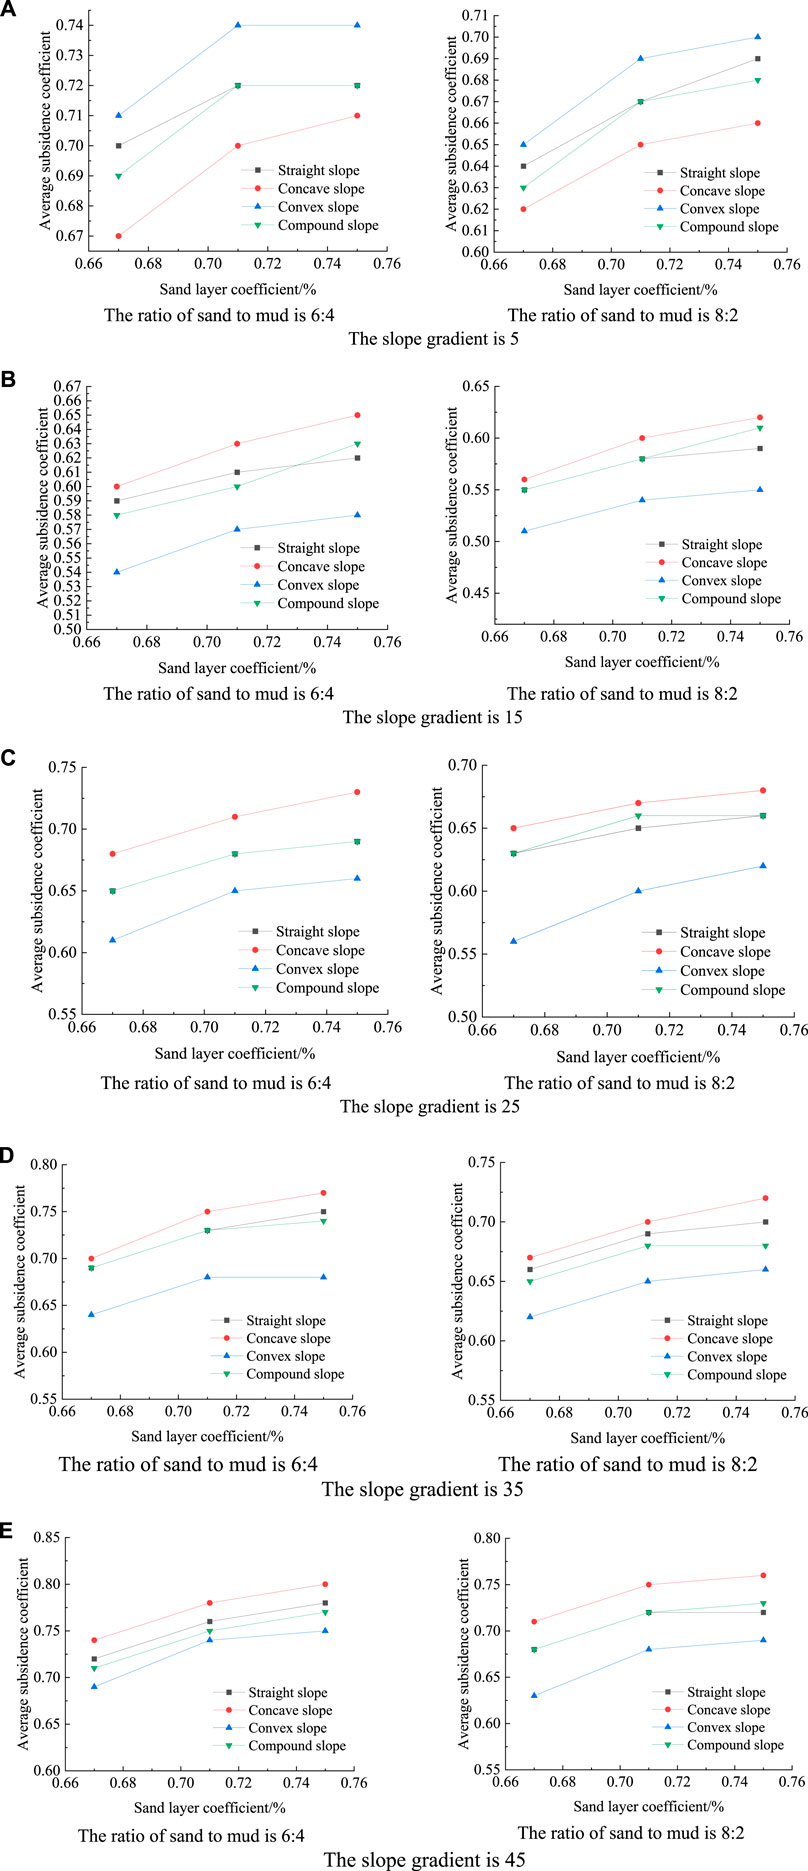
FIGURE 6. (Continued)
From Table 2 and Figure 6, it can be seen that under the coupling effect of loess slope shape and coal seam overburden structure, the change law of the q slope average is different, specifically:
Under the coupling effect of “overburden sand coefficient of any coal seam and sand-mud ratio of 6:4+arbitrary slope shape and natural slope of 5°”, with the sand coefficient increasing from 0.67 to 0.71, the q slope average of straight slope is 0.7, 0.72 and 0.72, the q slope average of concave slope is 0.67, 0.70 and 0.71, and the q slope average of convex slope is 0.71, 0.74,0.74, the q slope average of compound slope is 0.69, 0.72 and 0.72. Under the coupling effect of “overburden sand coefficient of any coal seam and sand-mud ratio of 8:2+arbitrary slope shape and natural slope of 5°”, with the sand coefficient increasing from 0.67 to 0.71, the q slope average of straight slope is 0.64, 0.67 and 0.69, the q slope average of concave slope is 0.62, 0.65 and 0.66, and the q slope average of convex slope is 0.65, 0.69,0.70, the q slope average of compound slope is 0.63, 0.67 and 0.68. It can be seen that when the natural slope is ≤5°, the q slope average of convex slope is the largest, while that of concave slope is the smallest, and the q slope average between straight slope and compound slope is not big, which has obvious homogeneity. The q slope average of four slopes is convex slope > straight slope ≈ compound slope > concave slope.
Under the coupling effect of “overburden sand coefficient of arbitrary coal seam and sand-mud ratio 6:4+arbitrary slope shape of surface and 5° < natural slope ≤45°”, with the sand coefficient increasing from 0.67 to 0.71, the q slope average of straight slope is 0.66, 0.70 and 0.71, and the q slope average of concave slope is 0.68, 0.72, 0.74, the q slope average of convex slope is 0.62, 0.66, 0.67 and the q slope average of compound slope is 0.66, 0.69, 0.71. Under the coupling effect of “overburden sand coefficient of arbitrary coal seam and sand-mud ratio of 8:2+arbitrary slope shape of surface and 5° < natural slope ≤45°”, with the sand coefficient increasing from 0.67 to 0.71, the q slope average of straight slope is 0.63, 0.66 and 0.67, and the q slope average of concave slope is 0.65, 0.68, 0.70 and the q slope average of convex slope is 0.58, 0.62, 0.63, and the q slope average of compound slope is 0.63, 0.66, 0.67. Therefore, when “5° < natural slope ≤45°”, the q slope average of concave slope is the largest, the q slope average of convex slope is the smallest, and the q slope average between straight slope and compound slope is not big, which has obvious homogeneity. The q slope average of four slope types is as follows: concave slope > straight slope ≈ compound slope > convex slope.
4.1.3 Prediction model of influence of overlying strata structure and surface slope shape on average subsidence coefficient
Using multivariate nonlinear fitting method, the prediction model of average subsidence coefficient of slope under the coupling effect of overburden structure and slope shape under four kinds of slope shapes is constructed, as shown in Formulas (1)–(4).
R2 = 0.717
R2 = 0.846
R2 = 0.697
R2=0.726
Where: α: sand-mud ratio; β: sand layer coefficient, %; S: natural slope of loess slope, °.
The mining area in northern Shaanxi, China is mainly hilly and gully landform of the Loess Plateau, with complex topography, obvious surface undulation and complex slope morphology. Under this complex terrain condition, the influence of terrain factors on mining subsidence can not be ignored. However, at this stage, scholars at home and abroad have not fully considered and studied this issue. Therefore, we take into account the complex terrain factors in the mining area of northern Shaanxi, China, and construct a prediction equation for the influence of the coupling effect of underground overburden structure and the shape of the upper slope on the average subsidence coefficient of the surface slope. This can provide a new idea and method for surface movement prediction under complex terrain factors in northern Shaanxi mining area.
4.2 Influence of coal mining subsidence on average horizontal movement of slope surface
4.2.1 Influence of overlying strata structure on average horizontal movement of slope surface
According to the data in Table 2, the influence of the overlying strata structure of coal seam on the horizontal movement of slope surface is the same as that on the subsidence of slope surface, and the main laws are as follows:
Under the coupling effect of “sand-mud ratio of coal seam overburden is 6:4+arbitrary slope shape and natural slope ≤45°”, with the sand layer coefficient increasing from 0.67 to 0.71, the u slope average of straight slope increases by 5.27%–22.50%, the u slope average of concave slope increases by 5.38%–26.18%, and the u slope average of convex slope increases by 5.38%–10.76%, the u slope average of compound slope increases by 5.94%–27.41%. Under the coupling effect of “sand-mud ratio of overlying strata in coal seam is 8:2+arbitrary slope shape and natural slope ≤45°”, with the sand layer coefficient increasing from 0.67 to 0.71, the u slope average of straight slope increases by 4.58%–14.72%, the u slope average of concave slope increases by 8.05%–16.70%, and the u slope average of convex slope increases by 3.78%–13.15%, the u slope average of compound slope increases by 5.04%–13.03%. However, under the coupling effect of “sand-mud ratio of overlying strata in any coal seam+arbitrary slope shape of the surface and natural slope ≤45°”, with the increase of sand bed coefficient from 0.71 to 0.75, the increase rate of u slope average no longer changes obviously and tends to be stable gradually. It can be seen from this that when the sand layer coefficient of coal seam overburden is ≤0.71, the u slope average increases obviously, but when the sand layer coefficient is >0.71, the u slope average does not change obviously and tends to be stable.
The main influence law of sand-mud ratio of coal seam overlying strata is: the u slope average shows a decreasing trend with the increase of sand-mud ratio of coal seam overlying strata, which is the same as the influence law of sand-mud ratio of coal seam overlying strata on the q slope average.
4.2.2 Influence of surface slope morphology on average horizontal movement of slope
According to the data in Table 2, it can be seen that the influence of the loess slope surface shape on slope horizontal movement mainly has the following main laws:
Under the coupling effect of “overburden sand coefficient of arbitrary coal seam and sand-mud ratio of 6:4+arbitrary slope shape of surface and natural slope ≤45°”, with the natural slope increasing from 5° to 45°, the u slope average of straight slope at 45° is increased by 1.06–1.16 times compared with the u slope average of straight slope at 5°–35°, and that of concave slope at 45° is increased by 1.08–1.14 times compared with the slope at 5°–35°. The u slope average of convex slope with gradient of 45° is increased by 1.09–1.13 times compared with that of 5°–35°, and the u slope average of composite slope with gradient of 45° is increased by 1.03–1.14 times compared with that of 5°–35°. Under the coupling effect of “overburden sand coefficient of any coal seam and sand-mud ratio of 8:2+arbitrary slope shape of the surface and natural slope ≤45°”, with the natural slope increasing from 5° to 45°, the u slope average of straight slope at 45° is increased by 1.07–1.15 times compared with the u slope average of straight slope at 5°–35°, and that of concave slope at 45° is increased by 1.13–1.16 times compared with the slope at 5°–35°. The u slope average of convex slope with gradient of 45° is increased by 1.08–1.11 times compared with that of 5°–35°, and the u slope average of composite slope with gradient of 45° is increased by 1.03–1.09 times compared with that of 5°–35°. Therefore, under the coupling effect of “overburden sand coefficient of any coal seam and sand-mud ratio+arbitrary slope shape of the surface and natural slope ≤45°”, the u slope average increases with the increase of loess slope surface slope, and reaches the maximum when the slope is 45°.
The main influence law of loess slope shape on the u slope average is: when the overlying strata characteristics and natural slope of any coal seam are less than 35°, the concave slope’s u slope average is the largest after coal mining subsidence, and when the overlying strata characteristics and natural slope of any coal seam are more than or equal to 35°, the convex slope’s u slope average is the largest after coal mining subsidence, which has obvious influence on the horizontal movement of slope.
5 Discussion
The increase of sandstone layers will directly lead to the increase of the main structural plane of coal seam overlying strata, which will not only lead to the decline of the overall strength of coal seam overlying strata (Liu Z. J. et al., 2022; Wang et al., 2022), but also weaken the anti-interference ability of coal seam overlying strata to underground mining disturbance. Song et al. (2014) found that when the sand layer coefficient of overlying strata of 2−2 coal seam in northern Shaanxi mining area is less than 0.7, the surface subsidence coefficient will increase rapidly with the increase of sand layer coefficient, and when the sand layer coefficient is greater than 0.7, the surface subsidence coefficient tends to be stable. Therefore, under the condition of the same thickness of bedrock, the subsidence coefficient of surface and slope caused by the same underground coal mining disturbance will increase with the increase of sand layer coefficient, and the development degree of surface coal mining subsidence will continue to improve. In addition, the proportional relationship between the thickness of hard rock and soft rock in coal seam overburden, that is, the sand-mud ratio, will also significantly affect the movement and deformation characteristics of the surface and slope. Song et al. (2014) found that when the sand layer coefficient is constant, the greater the sand-mud ratio, the smaller the surface subsidence coefficient. Qian (2008) found that the main key stratum in overlying strata controls the dynamic process of surface subsidence, and the fracture of the main key stratum will lead to the synchronous fracture of all overlying strata and the rapid subsidence of the surface, which will lead to the obvious increase and periodic change of subsidence speed and subsidence influence boundary. Xu et al. (2007) found that when the lithology changes from soft to hard, the plastic expansion zone is less easily compressed and the surface subsidence coefficient decreases accordingly. This is consistent with the results of this study. It can be seen that the smaller the sand-mud ratio of overlying strata, the thinner the total thickness of sandstone in overlying strata, the weaker the anti-disturbance ability of overlying strata as a whole, and the more intense the movement and deformation caused by the same coal mining subsidence. This may be one of the reasons why the smaller the sand-mud ratio of overlying strata is, the greater the surface subsidence coefficient is.
The negative correlation between slope gradient and slope stability has become a recognized fact. Zhu et al. (2020) used three methods to calculate and analyze the stability of 76 loess slope models with different slopes, and found that the stability coefficient of loess slope decreased with the increase of slope, and the change was most obvious when the slope was less than 55°. Based on the shaking table model test of soil slope model, Tang W. M. et al. (2019) found that under the dynamic load, the greater the slope of soil slope, the stronger the amplification effect of slope acceleration, and the more obvious the signs of deformation and failure of slope. Zhang et al. (2007) found that the slope obviously changed the stress distribution of loess slope, which made the safety factor of slope decrease with the increase of slope, showing an obvious logarithmic relationship. Katz et al. (2014) used the numerical two-dimensional discrete element method to find that the increase of slope will lead to the increase of slope movement size, and then increase the risk of slope movement. Qiu et al. (2018) based on the data of 275 loess landslides in Zhidan County, the central part of China Loess Plateau, and found that the slope gradient indirectly affected the size of slope movement through the slope length. Xi et al. (2021) extracted the slope information of coal mining subsidence area through DEM, and found that coal mining subsidence can increase the slope of surface slope. While Huang et al. (2014) found that coal mining subsidence can reduce the slope length of loess slope by using digital terrain analysis and remote sensing image fusion, which is consistent with the results of this study. Therefore, no matter what slope shape the loess slope is, the greater the slope is, the smaller the stability is, and the more intense the movement and deformation will be under the influence of the same coal mining subsidence, which may be one of the important reasons why the loess slope with any slope shape in this study will increase the slope and decrease the slope length after subsidence. More interestingly, the greater the natural slope of loess slope, the greater the slope increment after subsidence, but the smaller the slope length decline. This provides a new proposition for further study on the characteristics and laws of surface loess slope movement and deformation in coal mining subsidence area. The influence of slope shape on slope stability is still controversial. Tang W. M. et al. (2019) found that slope shape has great influence on slope deformation and failure, and concave slope is less prone to instability and failure than straight slope and convex slope, but the upper part of concave slope usually has a large slip phenomenon. Huang (2017) used small-scale shaking table test and FLAC3D numerical simulation research to find that if the first longitudinal crack at the top of the slope is taken as the standard, the stability of convex slope is the worst, followed by straight slope and concave slope is the most stable. Gao (1993) found that concave slopes with medium height and steep slope are more prone to movement and deformation through remote sensing interpretation. However, this study found that under the same influence of coal mining subsidence, when the natural slope is less than 5°, the movement and deformation of convex slope is the largest, while when the natural slope is more than 5°, the movement and deformation of concave slope is the most obvious. It shows that under the special dynamic load of coal mining subsidence, the influence of slope shape on slope stability and movement deformation degree is closely related to slope. This provides a new insight for scientific understanding of the stability, movement and deformation characteristics of surface loess slope in coal mining subsidence area.
6 Conclusion
Under any surface slope shape, the q slope average after coal mining subsidence increases with the increase of overlying sand coefficient of coal seam, and it mainly shows two stages. The first stage: when the sand coefficient is ≤0.71, the q slope average is obvious, showing a rapid growth trend, and the increase range is between 2.86% and 7.94%; The second stage: after “sand coefficient >0.71”, the q slope average no longer changes obviously and tends to be stable gradually. Under any surface slope shape, the q slope average after coal mining subsidence decreases with the increase of sand-mud ratio of coal seam overlying strata, and the decline rate of the q slope average with sand-mud ratio of 8:2 is greater than 5.03% compared with that with sand-mud ratio of 6:4, that is, the smaller the sand-mud ratio of coal seam overlying strata, the more obvious the influence on loess slope subsidence.
When the overburden structure characteristics of any coal seam and the natural slope of the surface slope are less than or equal to 5°, the q slope average of the convex slope is the largest after coal mining subsidence, and the q slope average of the four slope types is ranked as follows: convex slope > straight slope ≈ compound slope > concave slope; When the overburden structure characteristics of any coal seam and the surface slope are 5° < natural slope ≤45°, the q slope average of the concave slope is the largest after coal mining subsidence, and the q slope average of the four slopes is in the order of concave slope > straight slope ≈ compound slope > convex slope, that is, “convex slope with natural slope ≤5° and concave slope with natural slope ≤45°” has great influence on loess slope surface subsidence. With the increase of natural slope after coal mining subsidence, the q slope average first decreases and then increases with the increase of natural slope, and the inflection point is 15°. When the natural slope is less than 15°, the q slope average decreases with the increase of natural slope, reaches the minimum value when the natural slope is 15°, and when “15° ≤ natural slope ≤45°”, the q slope average increases with the increase of natural slope, and reaches the maximum value when the natural slope is 45°, and the difference between the maximum value and the minimum value is greater than 22.03%. Based on the basic principle of multivariate nonlinearity, the prediction equation of the q slope average with the increase of sand layer coefficient under the coupling effect of loess slope surface shape and coal seam overburden structure is constructed.
The influence of structural characteristics of coal seam overlying strata on the horizontal movement of loess slope is the same as that of subsidence, that is, the horizontal movement of loess slope is stronger after coal mining subsidence under any surface slope shape and when the sand coefficient of coal seam overlying strata is ≤0.71, and the increase rate of u slope average is 5.04%–27.41%, and the u slope average is no longer obvious after the sand coefficient is >0.71; Under any surface slope shape, the u slope average after coal mining subsidence decreases with the increase of sand-mud ratio of overlying strata in coal seam. Under any structural characteristics of coal seam overburden and any slope shape of surface slope, the u slope average increases with the increase of natural slope after coal mining subsidence, and reaches the maximum when the natural slope is 45°, which is more than 1.03 times of the natural slope of 5°–35°. When the overlying strata structure characteristics and natural slope of any coal seam are less than 35°, the u slope average of concave slope is the largest after coal mining subsidence, and when the overlying strata structure characteristics and natural slope of any coal seam are more than or equal to 35°, the u slope average of convex slope is the largest after coal mining subsidence, which has obvious influence on the horizontal movement of slope.
Data availability statement
The datasets presented in this study can be found in online repositories. The names of the repository/repositories and accession number(s) can be found in the article/Supplementary Material.
Author contributions
BZ: Writing–original draft, Conceptualization, Data curation, Investigation, Methodology, Software. SS: Writing–review and editing, Conceptualization, Methodology. XC: Investigation, Writing–review and editing. RN: Investigation, Writing–review and editing. XC: Data curation, Writing–review and editing. HR: Supervision, Writing–review and editing. GL: Validation, Writing–review and editing.
Funding
The author(s) declare financial support was received for the research, authorship, and/or publication of this article. This work was supported by 2022 Special Fund project of Shaanxi Key Laboratory of Geological Support for Coal Green Development (grant no. DZBZ2022Z-03), the Key Research and Development Program of Shaanxi Province (grant no. 2023-YBSF-458).
Acknowledgments
The author greatly appreciated that the constructive comments from the editors and reviewers.
Conflict of interest
GL was employed by the Shanxi Water Group Construction Investment Co., Ltd.
The remaining authors declare that the research was conducted in the absence of any commercial or financial relationships that could be construed as a potential conflict of interest.
Publisher’s note
All claims expressed in this article are solely those of the authors and do not necessarily represent those of their affiliated organizations, or those of the publisher, the editors and the reviewers. Any product that may be evaluated in this article, or claim that may be made by its manufacturer, is not guaranteed or endorsed by the publisher.
References
Fang, J., Li, Q. S., Du, W. F., and Cao, Z. G. (2016). Water disaster control in overlying thick loose layer on bedrock in Shendong coal mining area. Coal Geol. Explor. 44 (4), 94–97. doi:10.3969/j.issn.1001-1986.2016.04.018
Gao, J. (1993). Identification of topographic settings conducive to landsliding from dem in Nelson county, Virginia, U.S.A. Earth Surf. Process. Landforms 18, 579–591. doi:10.1002/esp.3290180702
Huang, Y., Wang, Y., Wang, M., Tian, F., and Ao, J. (2014). Effect of mining subsidence on soil erosion in mountainous area of the Loess Plateau. Trans. Chin. Soc. Agric. Eng. 30 (1), 228–235. doi:10.3969/j.issn.1002-6819.2014.01.029
Huang, Z. W. (2017). Stability analysis of concave and convex slopes under earthquake. Chongqing University.
Katz, O., Morgan, J. K., Aharonov, E., and Dugan, B. (2014). Controls on the size and geometry of landslides: insights from discrete element numerical simulations. Geomorphology 220, 104–113. doi:10.1016/j.geomorph.2014.05.021
Li, J. M., Yu, J. H., and Zhang, W. Z. (2019). Spatial distribution and governance of coal-mine subsidence in China. J. Nat. Resour. 34 (4), 867. doi:10.31497/zrzyxb.20190415
Li, S. Z. (2019). Control practices and countermeasure analysis on coal subsidence area in China. Coal Sci. Technol. 47 (1), 36–43. doi:10.13199/j.cnki.cst.2019.01.005
Liu, Z., Han, L., Wang, D. Y., Liu, Z. H., and Chen, R. (2021). Soil physicochemical properties and quality assessment in the coal mining area of Loess Plateau in Northern Shaanxi Province. J. China Coal Soc. 46 (05), 1555–1564. doi:10.13225/j.cnki.jccs.ST21.8216
Liu, F., Guo, L. F., and Zhao, L. Z. (2022a). Research on coal safety range and green low-carbon technology path under the dual-carbon background. J. China Coal Soc. 47 (01), 1–15. doi:10.13225/j.cnki.jccs.yg22.0016
Liu, Z. J., Qiu, H. J., Zhu, Y. R., Liu, Y., Yang, D. D., Ma, S. Y., et al. (2022b). Efficient Identification and Monitoring of Landslides by Time-Series InSAR Combining Single- and Multi-Look Phases. Remote Sens. 14 (4), 1026. doi:10.3390/rs14041026
Ma, S. Y., Qiu, H. J., Zhu, Y. R., Yang, D. D., Tang, B. Z., Wang, D. Z., et al. (2023). Topographic Changes, Surface Deformation and Movement Process before, during and after a Rotational Landslide. Remote Sens. 15 (3), 662. doi:10.3390/rs15030662
Pei, Y. Q., Qiu, H. J., Yang, D. D., Liu, Z. J., Ma, S. Y., Li, J. Y., et al. (2023). Increasing landslide activity in the Taxkorgan River Basin (eastern Pamirs Plateau, China) driven by climate change. Catena 223, 106911. doi:10.1016/j.catena.2023.106911
Qian, M. G. (2008). On Scienized Coal Mining. China coal. (08), 5–10+20. doi:10.19880/j.cnki.ccm.2008.08.001
Qiu, H. J., Cui, P., Regmi, A. D., Hu, S., Wang, X. G., and Zhang, Y. Z. (2018). The effects of slope length and slope gradient on the size distributions of loess slides: field observations and simulations. Geomorphology 300, 69–76. doi:10.1016/j.geomorph.2017.10.020
Qiu, H. J., Zhu, Y. R., Zhou, W. Q., Sun, H. S., He, J. Y., and Liu, Z. J. (2022). Influence of DEM resolution on landslide simulation performance based on the Scoops3D model. Geomatics Nat. Hazards Risk 13 (1), 1663–1681. doi:10.1080/19475705.2022.2097451
Shang, J. X., Gao, Y. K., Yang, F., Bi, Y. L., Quan, W. Z., and Ma, S. P. (2022). Landscape planning model design and layout of loess hills in coal mining area of northern Shaanxi:A study of the subsidence area of Ningtioata Coal Mine. Coal Geol. Explor. 50 (07), 128–137. doi:10.12363/issn.1001-1986.21.11.0659
Shao, X. P., Li, X. J., Wu, J. T., and Yang, W. H. (2015). Simulation Study of Overlying Strata Movement Laws at Layer Mining in Northern Shaanxi Local Coal Mines Lying Protected Areas. Coal Technol. 34 (06), 1–4. doi:10.16865/j.cnki.1000-7555.2021.0217
Shen, Y. J., Yang, B. H., Wang, S. M., Kou, H. B., Chen, X., and Xu, Y. L. (2022). Typical characteristics of geological hazards and ecological environment of coal base in the bends area of the Yellow River. Coal Geol. Explor. 50 (6), 104–117. doi:10.12363/issn.1001-1986.21.12.0887
Song, S. J., Zhao, X. G., Xie, J., and Guan, Y. Y. (2011). “Grey Correlation Analysis and Regression Estimation of Mining Subsidence in Yu-Shen-Fu Mining Area,” in 3rd International Conference on Environmental Science and Information Application Technology (ESIAT), AMSTERDAM, 1747–1752. doi:10.1016/j.proenv.2011.09.274
Song, S. J., Zhao, X. G., and Wang, S. M. (2014). Influence of Sandsone Layer Coefficient in Coal Overburden on Mining Subsidecne. Saf. Coal Mines 45 (11), 60–63. doi:10.2991/isesce-15.2015.31
Song, S. J., Zhao, X. G., Zhang, Y., and Nie, W. J. (2016). Analyzing the Effect of the Mining Depth on the Shape and Erosion of Surface Slope in Coal Mining Area. Environ. Sci. Technol. 39 (08), 178–184. doi:10.3969/j.issn.1003-6504.2016.08.029
Song, S. J., Wang, S. M., Zhao, X. G., and Shen, T. (2018). Stratification transfer method of the mining subsidence based on the characteristics of layered structure in coal overburden. J. China Coal Soc. 43 (S1), 87–95. doi:10.13225/j.cnki.jccs.2017.3011
Song, S. J., Zhang, Y. L., Wang, S. M., Du, L., and Liu, M. N. (2021). Influence of mining ground fissures on soil microorganism and enzyme activities in Northern Shaanxi coal mining area. J. China Coal Soc. 46 (05), 1630–1640. doi:10.13225/j.cnki.jccs.st21.0203
Song, S. J., Du, L., Wang, S. M., and Sun, T. (2022). Variation of soil erodibility on loess slope under various subsidence years in coal mining subsidence area located Northern Shaanxi. Coal Sci. Technol. 50 (02), 289–299. doi:10.13199/j.cnki.cst.QNTK21-126
Song, S. J., Feng, Z. X., Sun, T., Zheng, B. B., and Wei, J. B. (2023a). Loess slope deformation and soil erosion effect in coal mining subsidence area of northern Shaanxi. J. Xi'an Univ. Sci. Technol. 43 (02), 301–311. doi:10.13800/j.cnki.xakjdxxb.2023.0210
Song, S. J., Peng, R. S., Wang, Y., Cheng, X., Niu, R. L., and Ruan, H. (2023b). Spatial distribution characteristics and risk assessment of soil heavy metal pollution around typical coal gangue hill located in Fengfeng Mining area. Environ. Geochem. Health 22. doi:10.1007/s10653-023-01530-x
Song, S. J., Sun, T., Du, L., Feng, Z. X., and Zheng, B. B. (2023c). Effects of Mining Ground Fissures of Different Shapes on Soil Erodibility in Northern Shaanxi Coal Mining Area Influence. J. China Coal Soc., 1–14. 11.2190.td.20230303.1533.003.html.
Song, S. J., Sun, T., Zheng, B. B., Niu, R. L., Ruan, H., and Cheng, X. (2023d). Effect of coal mining subsidence on loess slope morphology and soil erosion in loess gully region of Northern Shaanxi. Coal Sci. Technol. 51 (02), 422–435. doi:10.13199/j.cnki.cst.2022-1913
Song, S. J., Zheng, B. B., Sun, T., Du, L., and Wei, J. B. (2023e). Influence of Different Mining Damage Types on Soil Erodibility in Coal Mining Areas of Northern Shaanxi in the Middle Reaches of the Yellow River in China. Sustainability 15 (6), 5434. doi:10.3390/su15065434
Tang, F. Q., Lu, J. X., and Li, P. F. (2019a). A prediction model for mining subsidence in loess-covered mountainous areas of western China. Curr. Sci. 116 (12), 2036–2043. doi:10.18520/cs/v116/i12/2036-2043
Tang, W. M., Ma, S. Z., Liu, X. L., and Zhao, X. (2019b). The influence of topographic and geomorphological conditions on the dynamic response of slope. J. Yangtze River Acad. Sci. 36 (11), 98–103+109. doi:10.11988/ckyyb.20180443
Tang, F. Q. (2011). Mining subsidence predicition model in western thick loess layer mining areas. J. China Coal Soc. 36 (S1), 74–78. doi:10.13225/j.cnki.jccs.2011.s1.025
Wang, S. M., Huang, Q. X., Fan, L. M., Yang, Z. Y., and Shen, T. (2010). Study on overburden aquclude and water protection mining regionazation in the ecological fragile mining area. J. China Coal Soc. 35 (01), 7–14. doi:10.13225/j.cnki.jccs.2010.01.007
Wang, G. F., Ren, S. H., Pang, Y. H., Qu, S. J., and Zheng, D. Z. (2021). Development achievements of China’s coal industry during the 13th Five-Year Plan period and implementation path of “dual carbon” target. Coal Sci. Technol. 49 (09), 1–8. doi:10.13199/j.cnki.cst.2021.09.001
Wang, L. Y., Qiu, H. J., Zhou, W. Q., Zhu, Y. R., Liu, Z. J., Ma, S. Y., et al. (2022). The Post-Failure Spatiotemporal Deformation of Certain Translational Landslides May Follow the Pre-Failure Pattern. Remote Sens. 14 (10), 2333. doi:10.3390/rs14102333
Wang, F. (2020). Analysis of the law of surface rock movement of coal mine goaf in northern Shaanxi. Chang’an University. doi:10.26976/d.cnki.gchau.2020.001362
Xi, B. S., Gao, Y. G., Yang, B., Li, L., and Kong, W. J. (2021). Analysis of terrain change characteristics and disaster-causing points under mining disturbance in a mine in western mountainous area. Metal. mine 541 (07), 172–178. doi:10.19614/j.cnki.jsks.202107024
Xu, J. L., Lian, G. M., Zhu, W. B., and Qian, M. G. (2007). Influecne of the key strata in deep mining to mining subsidence. J. China Coal Soc. (07), 686–690. doi:10.13225/j.cnki.jccs.2007.07.003
Zhang, M., Sun, C. Y., Xiao, P. X., Wei, X. L., Huang, Y. L., and Lin, L. (2007). Detailed investigation and demonstration of geological disasters in Baota District, Yan 'an City. Northwest Geol. (02), 29–55. doi:10.3969/j.issn.1009-6248.2007.02.002
Zhang, B., Peng, S. P., Wang, T., and Song, M. (2019). Strategic Paths and Countermeasures for Constructing a “Great Power of Coal Resources”. Strategic Study CAE 21 (1), 88–96. doi:10.15302/J-SSCAE-2019.01.013
Keywords: coal mining subsidence, loess slope, moving deformation, overburden rock structure, China Northern Shaanxi coal mining area
Citation: Zheng B, Song S, Cheng X, Niu R, Cheng X, Ruan H and Li G (2023) The influence of coal mining subsidence on the movement and deformation of loess slope in the loess gully area of Northern Shaanxi. Front. Earth Sci. 11:1273389. doi: 10.3389/feart.2023.1273389
Received: 06 August 2023; Accepted: 24 August 2023;
Published: 05 September 2023.
Edited by:
Haijun Qiu, Northwest University, ChinaCopyright © 2023 Zheng, Song, Cheng, Niu, Cheng, Ruan and Li. This is an open-access article distributed under the terms of the Creative Commons Attribution License (CC BY). The use, distribution or reproduction in other forums is permitted, provided the original author(s) and the copyright owner(s) are credited and that the original publication in this journal is cited, in accordance with accepted academic practice. No use, distribution or reproduction is permitted which does not comply with these terms.
*Correspondence: Shijie Song, a2trYmZmQDE2My5jb20=