 Alin Mihu-Pintilie
 Viorica Vasilache
 Felix-Adrian Tencariu
 Andrei Asăndulesei
94% of researchers rate our articles as excellent or good
Learn more about the work of our research integrity team to safeguard the quality of each article we publish.
Find out more
ORIGINAL RESEARCH article
Front. Earth Sci. , 11 December 2023
Sec. Hydrosphere
Volume 11 - 2023 | https://doi.org/10.3389/feart.2023.1270063
This article is part of the Research Topic New Tools and Techniques for Advanced Water Resource Management View all 6 articles
The study aimed to evaluate the elemental composition of salt extracted from shallow to saline groundwater sources selected based on ethnoarchaeological evidence in the Eastern Carpathians and Sub-Carpathians area of Romania and to assess their specific vulnerability using groundwater pollution potential (DRASTIC and DRASTIC-LU methodology). 198 saline water samples were collected from different site types, including natural saline springs, catchment saline springs, brine wells, salted lakes and ponds, during the period between 2007 and 2019. Scanning electron microscopy with energy-dispersive X-ray spectroscopy was employed to characterize the elemental composition of salt after dry-evaporating a predetermined volume of each collected sample. The results indicated that the salt concentration in the brines ranged from 0.1% to 41.3%, with the highest concentration found in wells and natural saline springs. The dominant component was sodium chloride, but several sites had high concentrations of potassium chloride, which is essential for human health. Over 95% of the analyzed samples also contained other minerals like calcium and magnesium, further highlighting the health benefits of these brine sources. However, two sites were slightly contaminated with heavy metals, posing potential health risks if consumed. The DRASTIC index, a standardized system for evaluating groundwater pollution potential, gave scores between 99 and 208, indicating moderate to very high intrinsic pollution potential. Similarly, the DRASTIC-LU index, which takes into account and the land use aspects, showed scores ranging from 114 to 258, suggesting low to very high vulnerability to contamination. These findings provide valuable information on the elemental composition of salt and the vulnerability of these brine sources, which are still used by rural communities for traditional practices like meat and fish preservation, milk curdling, and pickling. The study has important implications for sustainable management from both ethnoarchaeological and economic perspectives.
Since the Early Neolithic, shallow to saline groundwater sources (SGS), such as brine springs, salted ponds and lakes, have played a crucial role in European agro-pastoral societies (Sordoillet et al., 2018). According to archaeological evidence, salt extracted from rock salt deposits or SGS was used in various ways, including the preservation and consumption of foodstuffs (Brigan and Weller, 2018), livestock farming (Brigan et al., 2018), as barter currency (Tencariu et al., 2015), for therapeutic purposes, and even in mystical practices due to the social and spiritual symbolism of salt (Alexianu et al., 2016). Therefore, the SGS and the mastery of extraction techniques, such as briquetage (Tencariu et al., 2015) or artificial evaporation processes (Măţău et al., 2013), contributed to the social and economic development of populations since the early sixth millennium BCE (Sordoillet et al., 2018). In this context, many archaeological sites have been discovered near SGS across Europe, such as the Neolithic and Chalcolithic sites at Wieliczka in Southern Poland (Alexandrowicz et al., 2009), the Middle Chalcolithic sites at Provadia-Solnitsata in Bulgaria (Nikolov, 2016), the Late Neolithic sites at Champ-Durand in Central-Western France (Rozzi and Froment, 2018), the Bronze Age sites at Halle in Germany (Münster et al., 2018), and the Iron Age sites in the Seille Valley in Eastern France (Riddiford et al., 2012). To this day, some of these SGS, which contain a highly concentrated solution of sodium chloride (Freeze and Cherry, 1979), are still exploited in a traditional or industrial way and serve as multi-component sources for common salt (NaCl) along with calcium, iodine, lithium, magnesium, potassium, bromine, and other elements (Rezaei et al., 2021).
In this ethnoarchaeological framework, the entire mountain area of Romania, and in particular the contact area between Eastern Carpathians/sub-Carpathians and Transylvanian Plateau/Moldavian Plateau, is distinctive compared to other European areas where diachronic methods of salt exploitation have been investigated. This is due to the high concentration of ethnoarchaeological evidence-based sites discovered in the Carpathians basin (Alexianu et al., 2016). For instance, the Early Neolithic salt working sites Lunca-Poiana Slatinei and Hălăbutoaia-Ţolici in the Eastern Carpathian lowlands (Moldavian sub-Carpathians/Moldavian Plateau) are the earliest and long-lasting salt workings on Earth, thanks to the persistence of proto-industrial salt production practices up to the present day (Sordoillet et al., 2018). Additionally, the Bronze Age salt production site at Băile Figa, located in the junction between the Inner Eastern Carpathians and Transylvanian Plateau, shows that the oldest salt production traces in Europe can be found in the Eastern Carpathians area (Quinn and Ciugudean, 2018). Therefore, with approximately 300 SGS sites and numerous prehistoric archaeological sites in their vicinity (Romanescu, 2019), and, most notably, with areas that still exhibit resilient traditional practices of salt provision in rural communities, the salt landscape of the Carpathian Basin (Romanescu et al., 2018) has played a important role in the genesis and evolution of preindustrial salt civilization (Gimbutas, 1974; Harding, 2014; Mihu-Pintilie and Gherghel, 2022).
In recent decades, significant advancements have been made in the field of ethnoarchaeology of salt in Romania through large-scale research projects (ETHNOSALRO, 2010; ETHNOSALRO, 2016; ETHNOSALRO, 2018). Multidisciplinary studies incorporating field surveys (Asăndulesei et al., 2014; Romanescu et al., 2014; Brigan et al., 2018; Brigan and Weller, 2018; Sordoillet et al., 2018; Mihu-Pintilie and Nicu, 2019), geophysical prospection (Asăndulesei, 2017), ethnoarchaeological investigation (Alexianu et al., 2016; Alexianu et al., 2016; Brigan et al., 2018) and experimental archaeology (Tencariu et al., 2015; Tencariu, 2018), have revealed the crucial role of SGS for the subsistence of prehistoric communities in Old Europe (Gimbutas, 1974). At the same time, several hydro-geochemical analyses of representative SGS found in the ethnoarchaeological context have been conducted to highlight the significance of salt in various aspects of daily life, including nutrition, health, food preservation, and habitat development (Sandu et al., 2014; Romanescu et al., 2015a; Romanescu et al., 2015b). Despite the collection of a large number of samples over time, a comprehensive study of all collected data has yet to be published. In this context, the primary objective of our work is to address the issue by conducting a comprehensive analysis of all geochemical and geostatistical data related to salt, in conjunction with assessing the intrinsic groundwater pollution potential at each selected site. Therefore, our aim is to bolster the management of identified SGS in the Eastern Carpathian and sub-Carpathian regions of Central and Northeast Romania and ensure their sustainable preservation in Romania.
Regarding the methodology employed in this study, two distinct approaches were utilized. The first method was employed for characterizing the elemental composition of salt (ECs), while the second methodology was utilized to assess the intrinsic vulnerability of SGS sites. Therfore, the utilization of scanning electron microscopy (SEM) with energy-dispersive X-ray spectroscopy (EDX) (Hill et al., 2007; Girão et al., 2017) was considered as the primary technique for characterizing the elemental composition of salt (ECs) in SGS located in the Eastern Carpathian and sub-Carpathian regions of Central and Northeast Romania. This analysis was conducted on salt samples extracted from 198 brine sites, which were selected based on ethnoarchaeological evidence. The second method adopted was the DRASTIC and DRASTIC-LU vulnerability assessment system (Aller et al., 1985; Martínez-Bastida et al., 2010; Malakootian and Nozari, 2020). Overall, the DRASTIC methodology, developed by the United States Environmental Protection Agency (US EPA), is a standardized approach for evaluating intrinsic groundwater pollution potential. The method is based on seven key hydrogeological settings: depth to groundwater (D) (Baghapour et al., 2016), net recharge (R) (Chitsazan and Akhtari, 2009; Ghosh and Kanchan, 2016), aquifer type (A) (Aller et al., 1985; Singh et al., 2015; Malakootian and Nozari, 2020), soil type (S) (Aller et al., 1985; Singh et al., 2015), topography/slope (T) (Aller et al., 1985; Malakootian and Nozari, 2020), impact of the vadose zone (I) (Shirazi et al., 2012; Singh et al., 2015; Malakootian and Nozari, 2020) and hydraulic conductivity (C) (Aller et al., 1985; Kardan Moghaddam et al., 2017; Neshat and Pradhan, 2017; Malakootian and Nozari, 2020). In the case of DRASTIC-LUindex, the DRASTICindex is modified by adding the land use (LU) parameter as a new pollution potential factor (Malakootian and Nozari, 2020). The role of LU for SGS vulnerability assessment was determined by the fact that several sites are shallow saline waters, which indicates that the LU significantly contribute to the vulnerability of these type of sites. However, all parametres involved in DRASTIC and DRASTIC-LU computation will be described in more detail in the next sections.
The novelty of this study derives from the fact that the ECs results (Yang et al., 2018; Guo et al., 2019), in conjunction with ethnoarchaeological investigation, Geographic Information System (GIS) data integration (Warren and Asch, 1999; Mihu-Pintilie et al., 2016; Mihu-Pintilie and Nicu, 2019; Mihu-Pintilie and Gherghel, 2022), and DRASTIC and DRASTIC-LU vulnerability assessment of each selecde SGS were used to provide a complementary interdisciplinary approach for ethno-management purposes (Romanescu et al., 2018). Furthermore, this work has practical applications as all analyzed SGS are still being used by rural populations for various traditional practices (e.g., food preservation, milk curdling, and pickling), and the results provide valuable information regarding the consequences and benefits of consumption for human health. Taking into account the above, the techniques developed and ECs and DRASTIC and DRASTIC-LU data are presented and discussed, and the implications of the study are further explored.
The study area is situated in the Carpathian Basin of Romania, covering approximately 100,000 km2. It is located between 23°30′E and 27°10′E longitudes and 45°00′N and 48°15′N latitudes (Figure 1). The region has a temperate continental climate typical of central Europe, with temperatures ranging from 24°C in August to −5°C in January and an average annual temperature between 6°C and 10°C. The average annual rainfall varies from 450 to 500 mm in the lowland area of the Moldavian Plateau to 1,100–1,200 mm in the mountain area of the Carpathians. In the mountain area of the studied SGS sites, groundwater is the primary source of water for drinking, agriculture, and industrial use. This is particularly evident in the Eastern Carpathians and sub-Carpathian region, as opposed to the plateau-plain transition zone (e.g., Mopldavian Plateau, Transsilvanian Plateau) where low precipitation trends have caused a significant decline in groundwater levels over the last few decades (Romanescu et al., 2017; Stoleriu et al., 2020). For this reason, the DRASTIC and DRASTIC-LU methodologies were applied only to those SGS sites where there is a significant amount of precipitation or where anthropogenic pollution have been identified. However, for the few sites identified in the Eastern Carpathians lowlands, the basic assumption that heavy metals move from the surface to groundwater due to natural infiltration of precipitation is replaced by agricultural activities like irrigation during dry periods.
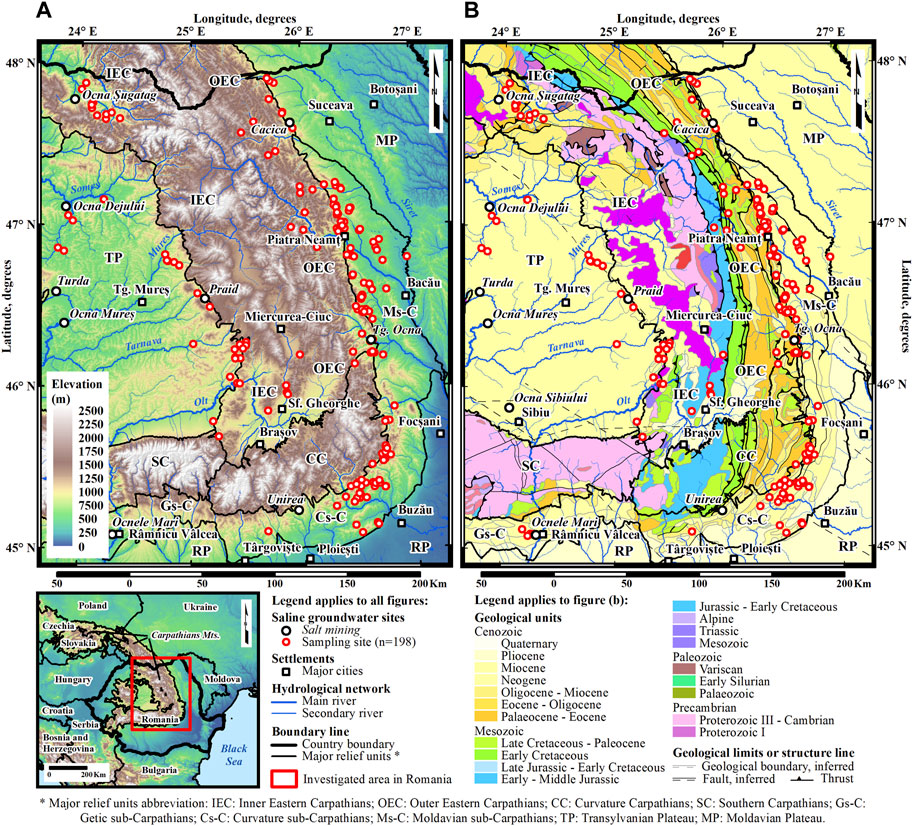
FIGURE 1. Geographic location of investigated area and spatial distribution of SGS within the major (A) relief units and (B) geological units in Romanian Carpathians.
The selected study sites are dispersed in the central and northeast parts of Romania, where they overlap with the area of contact between the Inner Eastern Carpathians and the Transylvanian Plateau to the west, and the area of contact between the Outer Eastern Carpathians, including the Curvature Carpathians, Moldavian Plateau, Moldavian sub-Carpathians, and Curvature sub-Carpathians to the east and southeast. The northern boundary is defined by the state border between Romania and Ukraine (Figure 1A). From hydrogeological point of view, these regions are one of the most richest salt resource areas in Europe (Melcher and Reichl, 2017) due to the Eocene and Miocene salt deposits formed in lagoons, coast facies, and epicontinental seas (such as the Sarmatian Sea in Eastern Europe) (Romanescu et al., 2018). This results in high frequency of saline springs due to the washing and dissolving of salt deposits (seeds) (Krézsek and Bally, 2006), particularly in the diapiric area of the Transylvanian Plateau and in the Inner Eastern Carpathians (Bánffy, 2015), or by the dissolution of salt within sedimentary rocks (such as marls, clays, malm-rock sands, and sandstones), like in the Moldavian Plateau and Curvature sub-Carpathians (Aquitanian and Badenian deposits) (Romanescu et al., 2015a). In the Eastern Carpathian lowland and Moldavian Plateau, the presence of salt in the upper part of the crust, through capillarity, leads to some groundwater sources being slightly to moderately salinized and having a dominant potassium salt composition (Romanescu et al., 2018) (Figure 1B).
Generally, the SGS selected in this study are either lowland springs, typical for bedrock zones and corresponding to the outcrop of an aquifer in a topographic depression, or springs on slopes that are often located at the point where the piezometric level or confined aquifer meets the topographic surface. In light of the seven hydrogeological data layers adopted in the DRASTIC methodology, the hydrogeological conditions specific to the selected SGS sites can be summarized as follows: The depth to groundwater parameter (D), which represents the distance from the water table to the ground surface in SGS, varies from 0 m to 4.5 m. The net recharge parameter (R), which quantifies the amount of runoff that has penetrated into the ground and reached the groundwater surface, is determined using the equation: R = slope (%) + rainfall + soil permeability. This parameter ranges from <50 mm to >250 mm. The aquifer type parameter (A), which controls the movement of groundwater streams within the aquifer, exhibits different characteristics: clay or sandy clay substrate for 65 SGS sites, a combination of limestone, gravel, sand, and clay for 130 SGS sites, and gravel deposits only for 3 SGS sites. The soil type parameter (S), which significantly affects the amount of surface water that can penetrate the aquifer due to processes such as absorption, filtration, degradation, and evaporation, varies from nonaggregated and aggregated clay, clay loam, sandy loam, or loam for 161 SGS sites to sand, gravel, or a thin soil layer for 27 SGS sites. The topography (slope) parameter (T), which controls the residence time of water within the soil and the extent of penetration, ranges from 0 to >18%. The impact of the vadose zone parameter (I), which indicates an unsaturated area located between the topographic surface and the groundwater level and plays a significant role in reducing groundwater contamination through pollutant degradation processes. This parameter varies from clay, alluvium, and calcareous strata for 11 SGS sites to sandstones and limestone strata for 165 SGS sites, and even basalt strata for 9 SGS sites. The hydraulic conductivity parameter (C), which indicates the ability of the aquifer to transfer water, with areas of high hydraulic conductivity posing a greater risk of groundwater contamination, ranges from 0.9 (m/day-1) to >24.2 (m/day-1) for the studied SGS sites. Due to these hydrogeological and morphological differences, the variability of ECs in the SGS spread across different parts of the study area is mainly a result of local factors such as the thickness of the salt layer, halite concentration, and hydrogeological conditions described above.
Figure 2 summarizes the workflow followed in this study, including the selection of SGS sites based on ethnoarchaeological criteria, collection of samples, and ECs characterization through SEM-EDX microanalysis. Additionally, it outlines the key steps involved in computing the DRASTICindex and DRASTIC-LUindex for SGS vulnerability assessment and the correlation between salt concentration values and the resulting DRASTICindex and DRASTIC-LUindex scores. Each methodological step will be further explained in the following subsections.
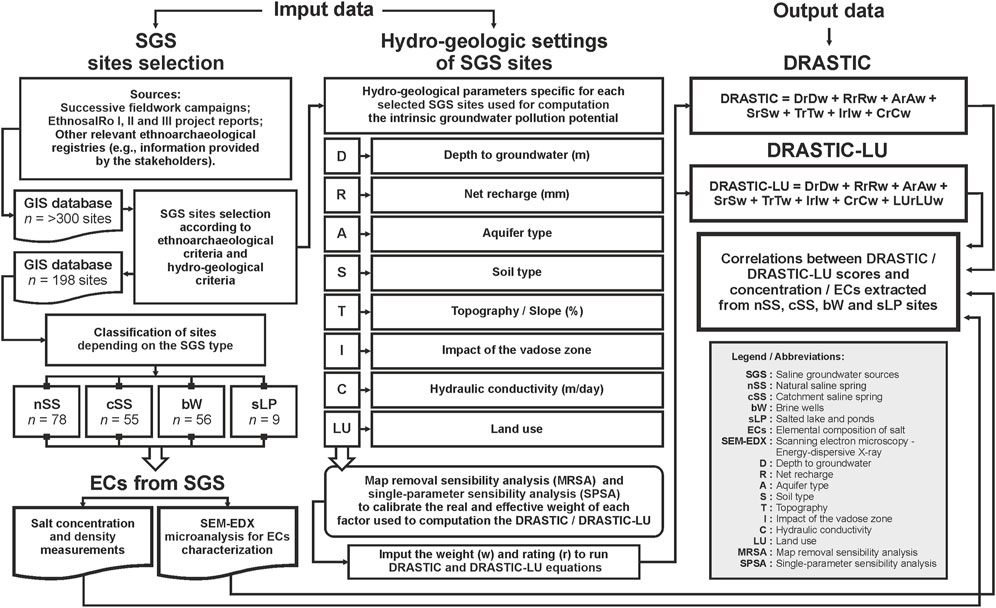
FIGURE 2. Workflow chart followed in this study to investigate the ECs and SGS vulnerability assessment using DRASTCindex and DRASTIC-LUindex.
The springs in the study area provide high-quality groundwater (in our case the saltwater), which is easily exploited and used in a traditional manner (Pazand and Hezarkhani, 2012; Luo et al., 2020). Therefore, the fieldwork investigations (e.g., transect survey by foot or by automobile, ethnologic inquiries) and field data collection (e.g., brine sample collection) involved summer campaigns in the Eastern Carpathian and sub-Carpathians settlements where the traditional exploitation of SGS they could be probable according to geologic salt deposit patterns in Romania (Geo-spatial, 2011; Romanescu et al., 2014; Romanescu et al., 2015a) or have been localized and confirmed by archaeologists in previous studies (Asăndulesei et al., 2014; Bánffy, 2015; Tencariu et al., 2015; Alexianu et al., 2016; Brigan et al., 2018; Brigan and Weller, 2018; Romanescu et al., 2018; Sordoillet et al., 2018; Romanescu, 2019). The locations of most SGS were determined based on information from local residents, while a small portion was located using cartographic tools (e.g., geologic maps, GPS). Over 300 saltwater samples were collected from 2007 to 2019 (ETHNOSALRO, 2010; ETHNOSALRO, 2016; ETHNOSALRO, 2018) and four main types of springs were identified: natural saline springs (nSS), catchment saline springs (cSS), brine wells (bW), and salted lakes and ponds (sLP) (Figure 3). For each sampling points the global positioning system (GPS) coordinates were logged during fieldwork investigations, along with the depths of the wells and other type of groundwater sources (e.g., natural springs, catchment springs) when was appropriate.
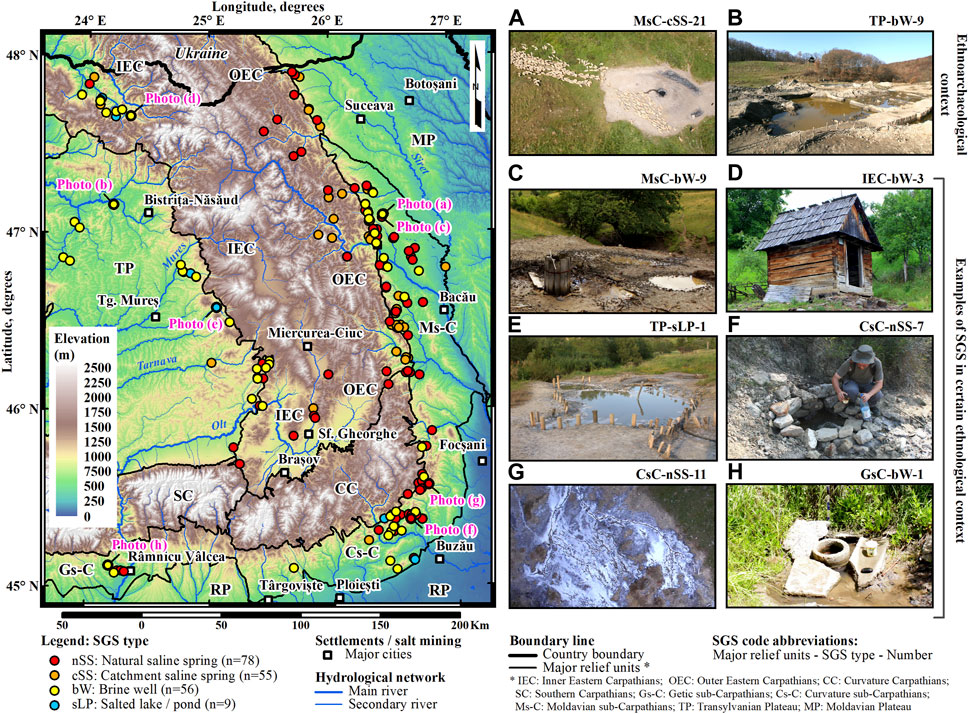
FIGURE 3. SGS sites classification depending on SGS type (left map). In photos, examples of different SGS type are highlighted, where: (A) MsC-Css-21 and (B) TP-bW-9 are sites in certain ethnoarchaeological context; and (C) MsC-bW-9, (D) IEC-bW-3, (E) TP-sLP-1, (F) CsC-nSS-7, (G) CsC-nSS-11 and (H) GsC-bW-1 are sites in certain ethnological context. The SGS code abbreviation: major relief units–SGS type–number.
The selection of SGS sites analyzed in this study was made according to ethnoarchaeological criteria (e.g., the importance of brine sources in the local culture, material derivatives of human behavior, non-industrial context) (Politis, 2014) and hydrogeological criteria (Guo et al., 2019) because not all of the analyzed samples recorded more than 0.1% salt concentration (sC), which is the limit of slightly saline water. In this context, according to certain archaeological remains only the brine sources associated with first proto-industrial salt production sites in the Eastern Carpathian and sub-Carpathian regions were selected (e.g., Early Neolithic sites Lunca-Poiana Slatinei and Hălăbutoaia-Ţolici, Bronze Age site Băile Figa) (Figures 3A, B). According to the ethnological criteria which involve the sites where the traditional salt supplies from groundwater sources continue to this day (David and Kramer, 2001), also only the SGS with high salt concentration have been selected (Figures 3C–H). Therefore, 198 sites selected based on ethnoarchaeological evidence was assessed as a complementary technique to ECs characterization extracted from SGS in the Eastern Carpathian and sub-Carpathian regions of Romania. However, taking into account the magnitude of non-industrial use of saltwater sources by the rural communities in the past or in the present day, it may be considered that ethno-management is a fully operative concept in this context (Romanescu et al., 2018).
The groundwater samples (n=198) were collected during the time (2007–2019) from 78 natural saline spring (nSS), 55 catchment saline spring (cSS), 56 brine wells (bW) and 9 salted lake and ponds (sLP) (Figure 3). Clean 1-L polyethylene bottles were rinsed, filed with brine water, sealed and labeled after collection according to SGS type, location and sampling data. The samples were stored in a portable fridge, in the dark at the temperature of 4°C for transportation to the laboratory were stored at the same temperature until the analysis.
The salt concentration was determined by dry-evaporating a predetermined volume of brine samples in a porcelain crucible, through the gravimetric method, and for determining the density, a 50 cm3 pycnometer and a PARTNER mode AS 220/C/2 analytical balance has been employed. The microanalysis used a scanning electron microscopy (SEM model VEGA II LSH) (Czech), coupled by an energy-dispersive X-ray detector (EDX type QUANTAX QX2, Germany) (Figure 4). The ECs was determined based on EDX spectrum, in terms of gravimetric and atomic percentages on a microstructure at a zoom factor of × 200. Descriptive statistics were applied for the classification and interpretation of 18 analyzed parameters in 198 saline groundwater samples (Sandu et al., 2014). All data was processed in the Laboratory for Scientific Investigation and Conservation of Cultural Heritage Assets and Geoarchaeology Laboratory of Arheoinvest Center, Institute for Interdisciplinary Research, Department of Exact and Natural Sciences, “Alexandru Ioan Cuza” University of Iaşi (UAIC) Romania.
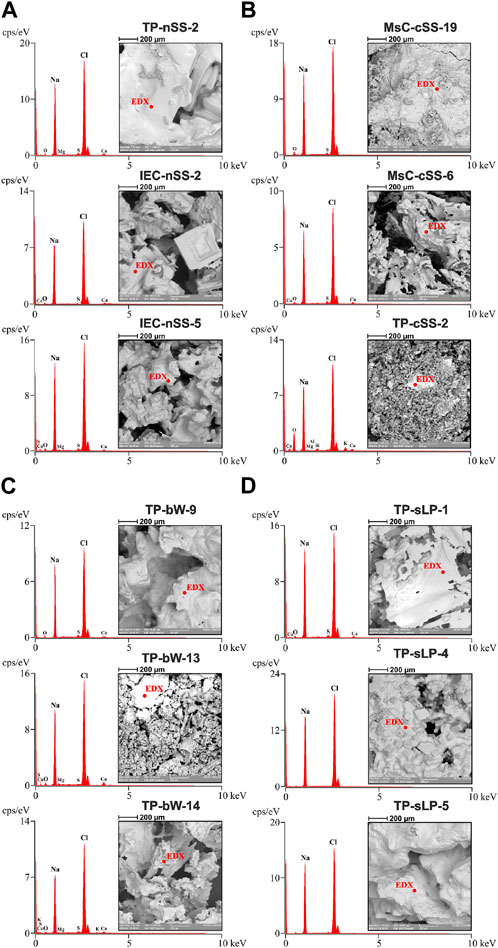
FIGURE 4. Examples for SEM images showing salt crystals (NaCl) and EDX results for 12 samples collected from: (A) nSS, (B) cSS, (C) bW, and (D) sLP. The EDX analysis (red spots) are shown on the SEM image area. The SGS code abbreviation: major relief units–SGS type–number.
As we mentioned in the introduction section the DRASTIC methodology developed by the US EPA, is a standardized approach for evaluating intrinsic groundwater pollution potential based on seven key hydrogeological settings: depth to groundwater (D), net recharge (R), aquifer type (A), soil type (S), topography/slope (T), impact of the vadose zone (I) and hydraulic conductivity (C). (Aller et al., 1985). For the study area, the DRASTIC and DRASTIC-LU parameters was computation as follows:
Depth to groundwater (m)–The “D” parameter represents the distance from the ground surface to the water table in SGS (Baghapour et al., 2016). To obtain this layer, we utilized direct measurements collected during field campaigns. In the end, over 198 SGS sites were categorized according to the criteria outlined in Table 1.
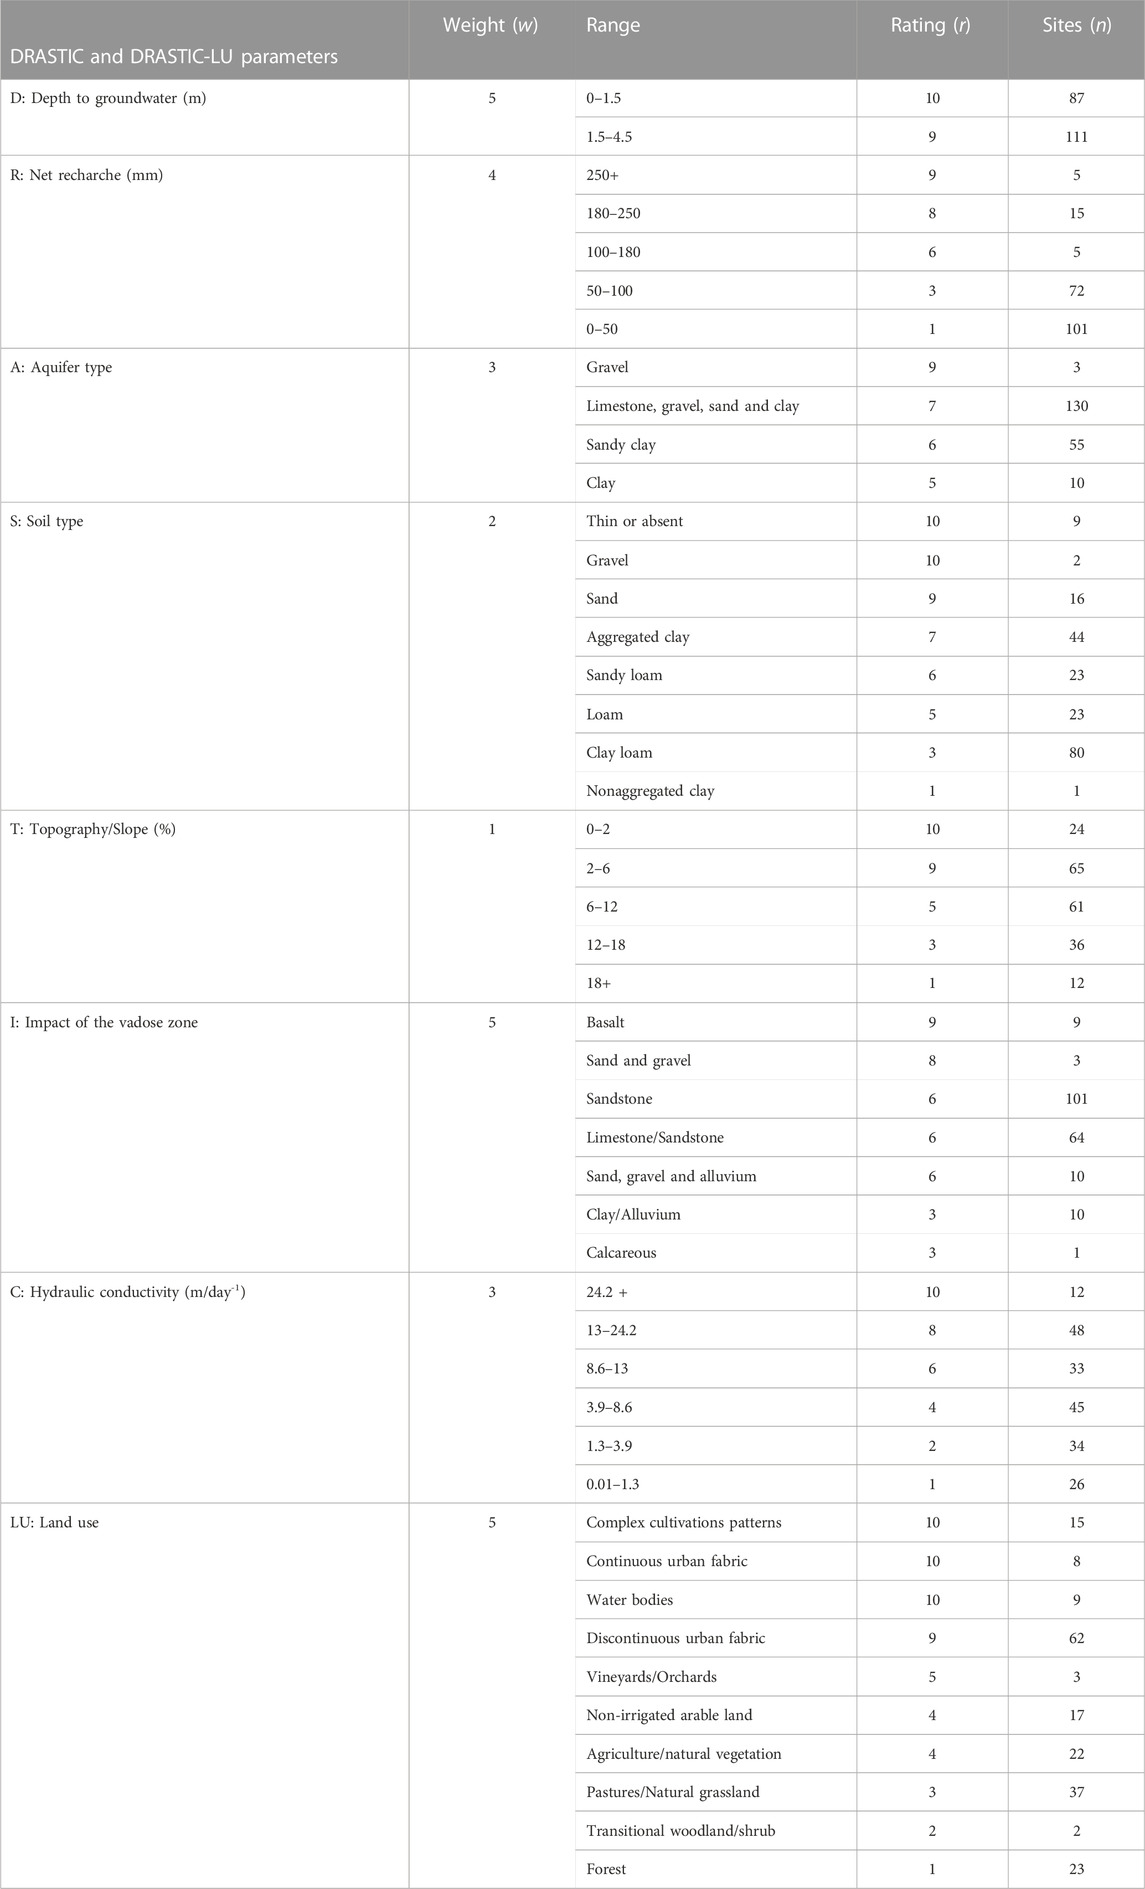
TABLE 1. Weight (w), ranges and ratings (r) of the DRASTIC and DRASTIC-LU parameters used for SGS vulnerability assessment. The w and r was determined based on MRSA and SPSA sensibility analysis. The SGS sites number (n) per each r are indicated.
Net recharge (mm)–The “R” parameter represents the amount of runoff that has penetrated the ground and reached the groundwater surface, and it was determined using the following equation: R = slope (%) + rainfall + soil permeability (Chitsazan and Akhtari, 2009; Ghosh and Kanchan, 2016; Jang et al., 2017). The slope (%) was extracted from a Digital Elevation Model (DEM) at 20 m resolution generated for a 100 m buffer zone around each selected SGS, and the Romanian soil map (scale 1:200,000), log observations, and exploration of SGS were utilized to quantify soil permeability.
Aquifer type–The “A” parameter controls the movement of groundwater streams within the aquifer (Aller et al., 1985; Singh et al., 2015; Malakootian and Nozari, 2020). In the case of the investigated SGS, information from available hydrogeological maps (scale 1:100,000) and direct observations were used to create the aquifer media layer.
Soil type–The “S” parameter significantly influences the amount of surface water that can penetrate the aquifer due to processes such as absorption, filtration, degradation, and evaporation (Aller et al., 1985; Singh et al., 2015). Therefore, the soil map was prepared using the Romanian soil map (scale 1:200,000) and the logs of observations and explorations at the investigated SGS.
Topography/Slope (%)–The “T” parameter controls the residence time of water within the soil and the depth of penetration (Aller et al., 1985; Malakootian and Nozari, 2020). The “T” layer was prepared using the same DEM as was used for the provision of the “R” parameter and was classified using the indications provided by Aller et al. (1985) as shown in Table 1.
Impact of the vadose zone–The “I” parameter indicates an unsaturated area located between the topographic surface and the groundwater level. It plays a significant role in reducing groundwater contamination through pollutant degradation processes (Shirazi et al., 2012; Singh et al., 2015; Jang et al., 2017; Malakootian and Nozari, 2020). This study utilized lithologic data from 198 observation and exploration SGS to develop the vadose zone media for each investigated saline groundwater source.
Hydraulic conductivity (m/day-1)–The “C” parameter indicates the ability of the aquifer to transmit water; areas with high hydraulic conductivity suggest a greater potential for groundwater contamination (Aller et al., 1985; Singh et al., 2015; Malakootian and Nozari, 2020). In this case, national maps produced by the National Research-Development Institute for Pedology, Agrochemistry, and Environmental Protection (ICPA) were used to create the hydraulic conductivity layer. Table 1 was employed to assess the hydraulic conductivity layer generated for each selected site.
Land use–The “LU” parameter impacts groundwater resources by altering recharge and water consumption patterns (Jang et al., 2017; Malakootian and Nozari, 2020). The 2018 CORINE Land Cover (CLC) data was utilized to create this layer and classify it in order to prepare a land use (LU) map associated with each investigated SGS.
The next step in DRASTIC and DRASTIC-LU computation was to assessing the potential vulnerability based on all considered parameters. Therfore, for each selected parameter was assigned a relative numerical weight ranging from 1 to 5, where 1 signifies minimal impact and 5 indicates the highest degree of influence (Baghapour et al., 2016). Furthermore, the DRASTIC parameters were categorized into ranges and assigned a numerical value between 1 and 10, reflecting their impact on vulnerability. Finally, following the compilation and digitization of hydrogeological data through GIS, the information is combined and superimposed to create vulnerability maps based on DRASTIC and DRASTIC-LU index for each SGS area (Shirazi et al., 2012; Yin et al., 2013).
In this study, the DRASTICindex computation was calculated using Eq. 1 (Aller et al., 1985).
Where “r” is the rating and “w” is the weight of each DRASTIC factor presented in Table 1.
Each parameter of the DRASTICindex is rated on a scale from 1 to 10, with the weight values assigned to each parameter rated on a scale from 1 to 5 to indicate their relative significance. According to Jang et al. (2017), a low DRASTICindex score corresponds to a low potential for groundwater pollution, while a high DRASTICindex score corresponds to a high potential for groundwater pollution. The DRASTICindex score ranges from 23 to 46 (very low) to >185 (very high), with the intermediate ranges being 47–92 (low), 93–136 (moderate), and 137–184 (high) (Aller et al., 1985).
In the case of DRASTIC-LUindex, the DRASTICindex is modified by adding the land use (LU) parameter as a new pollution potential factor (Malakootian and Nozari, 2020). The role of LU for SGS vulnerability assessment was determined by the fact that several sites are shallow saline waters (e.g., sLP), which indicates that the LU significantly contribute to the vulnerability of these type of sites. Therefore, the DRASTIC-LUindex was obtained by using Eq. 2:
Where “r” is the rating and “w” is the weight of each DRASTIC-LU; the “r” related to LU factor is presented in Table 1.
Different form DRASTICindex were the final outputs can range from 23 to 230, by adding LU factor in the DRASTIC-LUindex computation the final outputs range from 28 to 280, and the vulnerability classes based on the DRASTIC-LUindex scores range as fallows: <100 (very low), 100–145 (low), 145–190 (moderate), 190–235 (high), and >235 (very high) (Malakootian and Nozari, 2020).
During the time, in some studies dedicated to groundwater pollution potential it was reported that similar results could be obtained using less data and at lower costs than those used for DRASTICindex (Merchant, 1994; Babiker et al., 2005). Furthermore, the subjectivity related to the selection of DRASTICindex and DRASTIC-LUindex parameters has also been criticized (Jang et al., 2017). However, in order to avoid the suspicions related to the selection of the r and w of the parameters used to calculate the DRASTICindex and DRASTIC-LUindex in this study, the map removal sensibility analysis (MRSA) (Modabberi et al., 2017) using Eq. 3 were performed.
Where “S” stands for the sensibility value expressed in terms of the variation index; “V” is the real vulnerability index; “V1′” is the real vulnerability index after removing one layer; “N” and “n” are the number of data pieces used to calculate “V” and “V1”, respectively (Modabberi et al., 2017; Malakootian and Nozari, 2020).
As we indicated above (Section 3.2), more than 300 samples were collected from four type of SGS but only 198 samples (nSS = 78 samples, cSS = 55 samples, bW = 56 samples, sLP = 9 samples) were selected for ECs characterization based on hydrogeological and ethnoarchaeological criteria (Figure 3). Therefore, the salt concentration (sC) recrystallized through evaporation from all analyzed samples varies between 0.1% and 41.3%, and the average sC value for different SGS type are: 19.01% in bW, 16.1% in sLP, 14.78% in nSS and 12.85% in cSS (Table 2). According to the USGS salinity scale (Stanton et al., 2017) wich defines three levels of saline water, 34 samples are slightly saline water, 34 samples are moderately saline water, and 130 SGS are highly saline water. Related to the geographical distributions of SGS with the highest sC values are those located in the Transylvanian Plateau, Inner Eastern Carpathians and Curvature sub-Carpathians. Overall, starting from the premise that the SGS with the highest sC are also the most exploited for different traditional practices (e.g., meat and fish preservation, milk curdling, pickling), we intended to believe that the bW and nSS sites are the most used SGS. We support this statement for two reasons: firstly, due to the fact that 82% (46 sites) of bW and 62.8% (49 sites) of nSS are highly saline water sources; and secondly, due to the fact that during field campaigns we observed that these types SGS were the most frequented by the locals. However, even if the salt concentration range from one site to another, all selected SGS still attracted the rural populations to extract and used the salt for free.
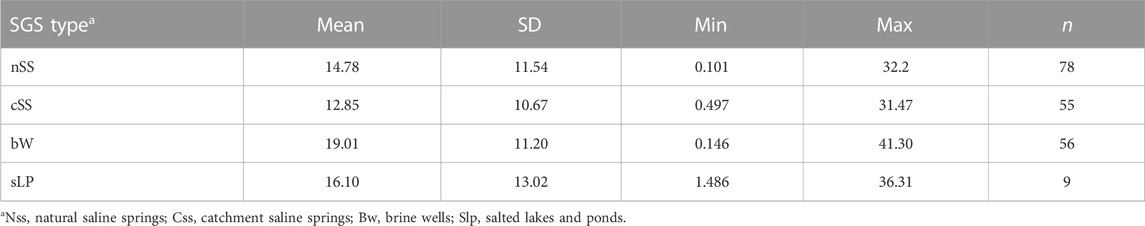
TABLE 2. Descriptive statistics of salt concentration Sc (%) in four types of SGS selected based on ethnoarchaeological evidence. The sites number (n) per each SGS type are indicated.
According to the EDX data generated from the spectrum acquired on the surface of the SEM micro photogram, Table 3 provides descriptive statistics on the elemental composition of salt (ECs) for all types of SGS. While NaCl is the primary compound in the collected salt samples (mean values: 81.97% in nSS, 86.84% in cSS, 86.65% in bW, 91.94% in sLP), other minerals such as potassium (mean value: 0.63%), calcium (mean value: 1.16%), and magnesium (mean value: 0.72%) are also present in varying concentrations. Additionally, sulfur (mean value: 1.3%) is found in all types of SGS. Significant amounts of iron (mean value: 0.17%) and zinc (mean value: 0.13%) are present, but they are specific only to natural and catchment saltwater springs and brine wells. Moreover, iodine (mean value: 0.72%) is found in nSS, cSS, and bW, in addition to the minerals mentioned above. However, in sLP, the ECs are much simpler due to intense evaporation processes on the water surface, as indicated by the high concentration of NaCl (91.94%). Therefore, it can be assumed that nSS, cSS, and bW contain the greatest diversity of mineral elements with numerous health benefits in human nutrition, while the waters exploited within the sLP context have the highest concentration of pure salt. Regarding the presence of heavy metals in SGS, only two sites were identified as slightly contaminated with strontium (OEC-Css-7/Sr = 0.1% and OEC-cSS-1/Sr = 0.27%) and one with arsenic (OEC-Css-7/As = 0.2%), which pose potential health risks if consumed. However, we consider that the presence of these highly toxic elements is a consequence of direct anthropogenic pollution, and therefore, careful use of the salt extracted from the mentioned brine sources is recommended.

TABLE 3. Descriptive statistics of Ecs (%) in four types of SGS selected based on ethnoarchaeological evidence. The sites number (n) per each SGS type are indicated.
The descriptive statistics of intrinsic vulnerability based on DRASTIC and DRASTIC-LU obtained scores for each SGS type are presented in Table 4. We chose to compute both vulnerability indices due to the fact that DRASTIC provides information regarding the intrinsic groundwater pollution potential based on hydrogeological settings, while DRASTIC-LU also takes into account the contribution of surface pollution potential through land use analysis. Therefore, the DRASTIC scores obtained for all SGS types ranged from 99 to 208, with a mean value of 147. Among these, the sLP category exhibited the highest groundwater pollution potential (mean value: 173), while the cSS category displayed the lowest groundwater pollution potential (mean value: 134).
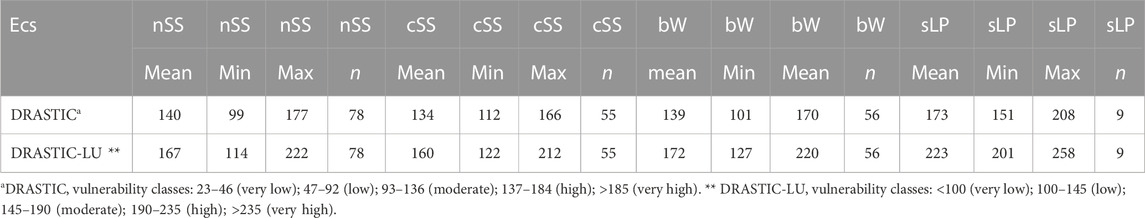
TABLE 4. Descriptive statistics of DRASTIC and DRASTIC-LU obtained scores (see Table 1) for SGS vulnerability assessment. The sites number (n) per each SGS type are indicated.
According to the Map Removal Sensitivity Analysis (MRSA), the most significant variables contributing to the DRASTIC index score in the cases of nSS, cSS, and bW were: D–Depth to groundwater (m) (35%–40%), I - Impact of the vadose zone (20%–25%), and A–Aquifer type (15%–18%). Regarding the sLP category, the most influential variables contributing to the DRASTIC index score were: D–Depth to groundwater (m) (30%), I - Impact of the vadose zone (18%), and C–Hydraulic conductivity (m/day-1) (18%) (Figure 5A). However, the variable contribution differs for the sLP category due to the fact that the hydraulic conductivity (C) parameter holds greater importance than aquifer type when considering open water bodies such as salted lakes and ponds in the study area. In the case of the DRASTIC-LU index, the obtained scores ranged from 114 to 258, with the sLP category again exhibiting the highest groundwater pollution potential (mean value: 201), while the cSS category displayed the lowest groundwater pollution potential (mean value: 122). In this case, MRSA indicates that the most influential variables contributing to the DRASTIC-LU index score for nSS, cSS, and bW were: D–Depth to groundwater (m) (30%–35%), I - Impact of the vadose zone (20%–25%), and LU–Land use (18%–22%). Regarding the sLP category, the most significant variables contributing to the DRASTIC-LU index score were: D–Depth to groundwater (m) and LU–Land use, both with a contribution of 25%, and I - Impact of the vadose zone and C–Hydraulic conductivity (m/day-1), both with a contribution of 15% (Figure 5B). Overall, what can be highlighted regarding the DRASTIC-LU scores and variable contributions is the significant influence of land use (LU) on the intrinsic pollution potential for all SGS types.
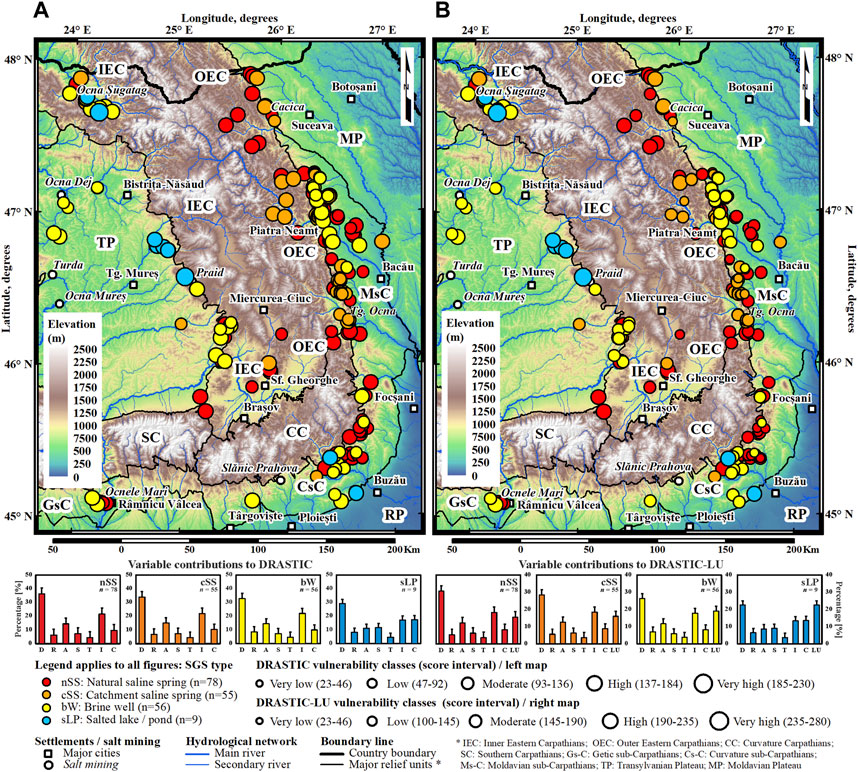
FIGURE 5. SGS sites classification depending on (A) DRASTIC and (B) DRASTIC-LU scores obtained for intrinsic vulnerability assessment. Variable contributions to DRASTIC and DRASTIC-LU scores are indicated in charts for each SGS type (see Figure 3).
In relation to the ability of DRASTIC and DRASTIC-LU to assess the intrinsic groundwater pollution potential of the SGS in the study area, the most effective approach was to classify the sites into intrinsic vulnerability classes (Jang et al., 2017; Malakootian and Nozari, 2020). According to the DRASTIC vulnerability classes, 85 SGS were classified as having a moderate (93–136) intrinsic vulnerability potential, while 11 sites fell into the high (137–184) vulnerability class, and only two sites were classified as very high (185–230) vulnerability (Table 5). As for the DRASTIC-LU vulnerability classification, 33 SGS were categorized as having a low (100–145) vulnerability, 126 sites were classified as moderate (145–190) intrinsic vulnerability potential, 37 sites were in the high (190–235) vulnerability class, and the same two sites (IEC-sLP-2 and TP-sLP-1) identified by the DRASTIC index were classified as very high (235–280) vulnerability (Table 6). It is noteworthy that when the LU parameter is included in the calculation formula for assessing intrinsic groundwater pollution potential using the DRASTIC index, the vulnerability classes increase from three to four classes, without changing the number of sites falling into the highest vulnerability class. Therefore, the LU parameter does not exaggerate the degree of vulnerability of the analyzed sites but rather correlates their location with surface environmental conditions. In our opinion, this aspect best reflects the reality on the ground and accurately describes the context in which the SGS are situated in relation to nearby anthropogenic activities. In this context, all analyzed sites are, as expected, classified as being in low to very high vulnerability to potential pollution. Among them, the most vulnerable are the sLP sites due to their open water characteristic, followed by nSS sites due to the lack of development in the exploitation area, unlike cSS and bW sites where protective measures have been implemented to safeguard the brine water source. However, considering that 59% of the sites, according to DRASTIC, and 19.5% of the sites, according to DRASTIC-LU, fall into the high and very high vulnerability classes, the extraction and utilization of salt from these SGS should be approached with caution, especially when intended for human consumption (Figure 5).
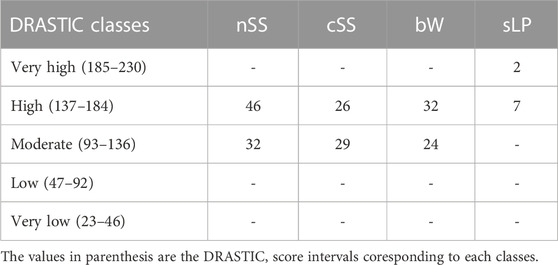
TABLE 5. Number of SGS type per each DRASTIC vulnerability classes.
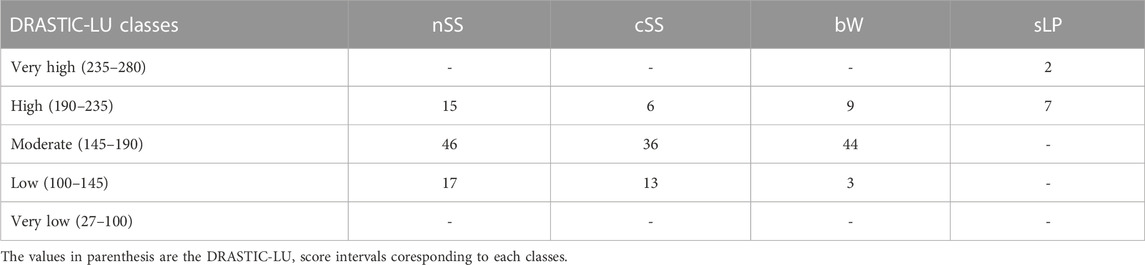
TABLE 6. Number of SGS type per each DRASTIC vulnerability classes.
As mentioned in section 4.1, various salt concentrations (sC) and elemental compositions of salt (ECs) were observed in the selected SGS based on ethnoarchaeological criteria. In this context, the next question we addressed was whether there is a correlation between the assessed vulnerability level based on DRASTIC/DRASTIC-LU scores and the salt concentration (sC) of the salt sources. We wanted to determine if sites with higher salt content might have a higher pollution potential due to more intense exploitation. To explore this, we first attempted to deduce which specific parameters of DRASTIC/DRASTIC-LU correlate better with the variation in sC (Figure 6).
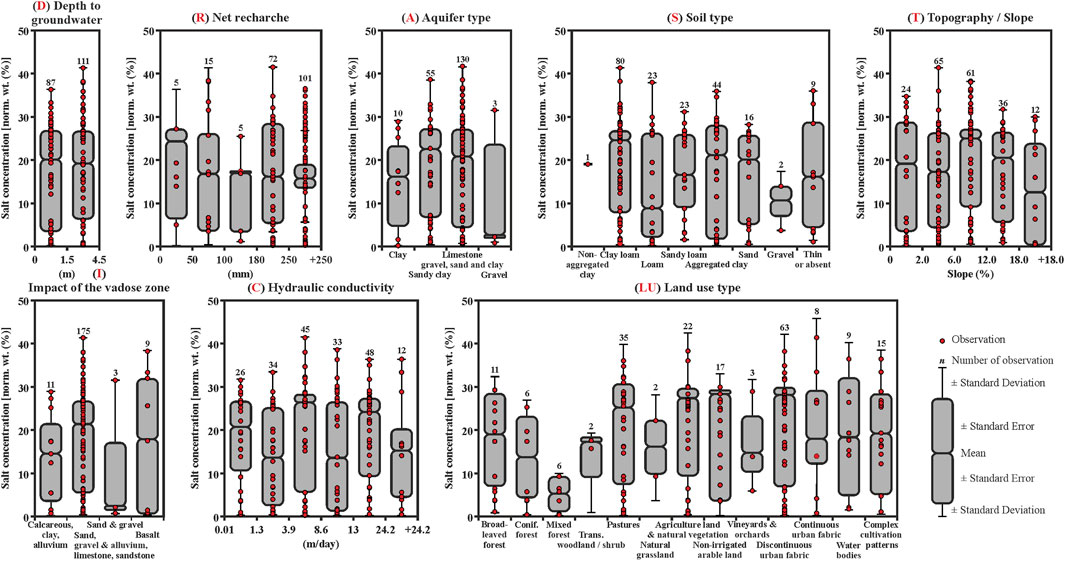
FIGURE 6. Box plots showing the distribution of salt concentration [sC–norm. wt. (%)] for the statistically different classes of the DRASTIC/DRASTIC-LU parameters. The SGS sites number (n) per each classes are indicated.
According to the D parameter, which represents the distance between the water table and the ground surface in SGS, there is no significant variation in sC within the first 4.5 m. The same applies to the R parameter, which measures the amount of runoff that has penetrated into the ground and reached the groundwater surface. Although the average of the first class (0–50 mm) of the R parameter deviates positively from the average sC (17.33%), this deviation is not statistically significant because over 87% of the analyzed sites are located in areas where the net recharge values exceed +150 mm. Regarding the A parameter, which controls the movement of groundwater in the aquifer, a significant correlation exists between high mean sC and aquifers composed of sandy clay or alternating layers of limestone, gravel, sand, and clay, covered at the top by clay loam or aggregated clay soils, according to the S parameter. The T parameter, which indicates the residence time of water inside the soil and the degree of penetration, shows a good correlation between high sC and SGS where the surface topography does not exceed an 18% slope. In the case of the I parameter, which represents an unsaturated area between the topographic surface and the groundwater level and plays a significant role in reducing groundwater contamination through pollutant debilitation processes, a very strong connection is observed between high mean sC and a vadose zone composed of alternating layers of sand, gravel, alluvium, limestone, and sandstone. As for the last parameter of the DRASTIC index, the C parameter, which indicates the aquifer’s ability to transfer water and areas with high hydraulic conductivity suggesting a high potential for groundwater contamination, we cannot affirm a direct correlation between hydraulic conductivity and the salt concentration of the analyzed SGS (Figure 6).
Overall, the DRASTIC index scores show a low correlation with ECs in all four types of analyzed brine sources, indicating that the salt concentration is merely a consequence of the thickness of the salt layer, halite concentration, and local hydrogeological conditions. Regarding the relationship between the DRASTIC-LU index score and sC, there is a better correlation of values due to the addition of the land use (LU) parameter (Table 7). This parameter affects groundwater resources through changes in recharge and alterations in water demands. Therefore, the LU classes that have strong connections with high sC values are pastures (mean sC = 28 norm. wt. (%)), agricultural land, and natural vegetation (mean sC = 29 norm. wt. (%)), non-irrigated arable land (mean sC = 29.5 norm. wt. (%)), and discontinuous urban fabric (mean sC = 29.8 norm. wt. (%)). The lowest values of sC were observed in the case of SGS located in mixed forests (mean sC = 5.9 norm. wt. (%)) (Figure 6; Table 7).
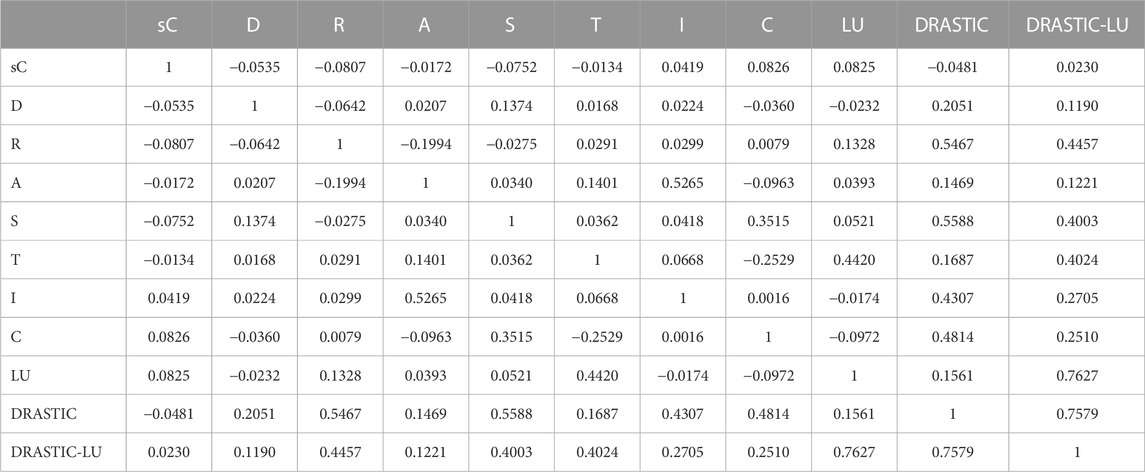
TABLE 7. Correlation between sC and DRASTIC and DRASTIC-LU parameters.
The DRASTIC index and its derivative, the DRASTIC-LU index, have gained extensive utilization in the assessment of groundwater vulnerability, making substantial contributions to various environmental and hydrogeological studies (Aller et al., 1985; Martínez-Bastida et al., 2010; Singh et al., 2015; Kardan Moghaddam et al., 2017; Malakootian and Nozari, 2020). Despite their utility, it is imperative to recognize and address their inherent limitations, as these can profoundly impact their applicability and accuracy. Therfore, one fundamental constraint of the DRASTIC index is its oversimplified representation of hydrogeological systems. This model relies on a fixed set of parameters, assigning equal importance to each, which may not genuinely capture the complexity of natural systems. Consequently, in our study, it was essential to substantiate the DRASTIC and DRASTIC-LU assessments with on-the-ground observations to validate their accuracy. Moreover, the precision of the DRASTIC index is highly contingent upon the availability of high-quality data encompassing geological, hydrological, and land use information. Regrettably, in many regions, such data’s availability and accuracy are questionable, rendering the application of the model a challenging endeavor (Busico et al., 2020).
The scale of analysis also presents a significant challenge. The DRASTIC index’s sensitivity to the geographic scale can lead to an inability to capture local vulnerabilities when applied regionally, or conversely, it may overlook broader regional factors when assessed at a local level. In our study, we addressed this issue by calculating the DRASTIC and DRASTIC-LU indices individually for each selected SGS, within a radius of 100 m around the site, thereby mitigating this limitation. Another noteworthy weakness of the DRASTIC methodology arises from the inherent subjectivity in assigning weights to its parameters. These weightings can vary based on the expert’s judgment, introducing a level of variability into vulnerability assessments. To address this subjectivity, we plan to develop feature analyses based on a hybrid approach (Busico et al., 2020; Guo et al., 2023) to assess specific vulnerability to anthropogenic pollution in SGS areas of ethnoarchaeological significance. However, while the DRASTIC index continues to serve as a valuable tool for evaluating groundwater vulnerability, it is vital to recognize and address its limitations. Furthermore, it is crucial to complement DRASTIC assessments with local knowledge and a more comprehensive dataset to enhance the precision of vulnerability evaluations and advance the cause of sustainable groundwater management.
In this study, we conducted a comprehensive geochemical analysis to assess the elemental composition of salt (ECs) extracted from 198 shallow to saline groundwater sources (SGS) in the Eastern Carpathians and Sub-Carpathians region of Romania. The selection of these sources was based on ethnoarchaeological evidence, highlighting their significance in current traditional practices. Four main types of springs were identified: natural saline springs (nSS), catchment saline springs (cSS), brine wells (bW), and salted lakes and ponds (sLP). The results revealed a wide range of salt concentration in the brine samples, varying from 0.1% to 41.3%. Wells (bW) and natural saline springs (nSS) exhibited the highest salt concentrations. Sodium chloride was identified as the dominant component, although certain sites displayed elevated levels of potassium chloride, which is essential for human health. Furthermore, more than 95% of the analyzed samples contained additional minerals such as calcium and magnesium, emphasizing the potential health benefits associated with these brine sources. However, two sites showed slight contamination with heavy metals, indicating potential health risks if consumed. Additionally, for the first time in the study area we employed the DRASTIC/DRASTIC-LU methodology to evaluate the intrinsic vulnerability of these SGS due to their continued use by local communities since prehistoric time in some cases. Therefore, the DRASTIC scores obtained for all SGS types ranged from 99 to 208, with a mean value of 147, indicating moderate to very high intrinsic pollution potential across the studied SGS. Similarly, the DRASTIC-LU index, which incorporates land use aspects, revealed vulnerability scores ranging from 114 to 258, indicating low to very high susceptibility to contamination. The findings of this study have significant implications for understanding the geographical distribution, environmental impact and salt concentration in groundwater sources that are still being traditionally exploited in the Carpathian Basin of Romania. Moreover, these results contribute to the sustainable management of SGS from both ethnoarchaeological and economic perspectives.
The raw data supporting the conclusions of this article will be made available by the authors, without undue reservation.
AM-P: Conceptualization, Data curation, Formal Analysis, Investigation, Methodology, Resources, Software, Supervision, Validation, Visualization, Writing–original draft, Writing–review and editing, Funding acquisition, Project administration. VV: Conceptualization, Data curation, Formal Analysis, Funding acquisition, Investigation, Methodology, Resources, Software, Validation, Visualization, Writing–original draft, Writing–review and editing. F-AT: Data curation, Formal Analysis, Investigation, Resources, Software, Validation, Visualization, Writing–original draft. AA: Data curation, Formal Analysis, Investigation, Resources, Software, Validation, Visualization, Writing–original draft.
The author(s) declare financial support was received for the research, authorship, and/or publication of this article. Authors are thankful to the Department of Exact and Natural Sciences, Institute of Interdisciplinary Research, “Alexandru Ioan Cuza” University of Iaşi (UAIC), Romania, and to Romanian Ministry of Research, Innovation and Digitization, within Program 1–Development of the national RD system, Subprogram 1.2–Institutional Per-formance–RDI excellence funding projects, Contract no.11PFE/30.12.2021, for financial support.
All data was processed in the Laboratory for Scientific Investigation and Conservation of Cultural Heritage Assets and Geoarchaeology Laboratory of Arheoinvest Center, Institute for Interdisciplinary Research, Department of Exact and Natural Sciences, “Alexandru Ioan Cuza” University of Iaşi (UAIC) Romania.
The authors declare that the research was conducted in the absence of any commercial or financial relationships that could be construed as a potential conflict of interest.
All claims expressed in this article are solely those of the authors and do not necessarily represent those of their affiliated organizations, or those of the publisher, the editors and the reviewers. Any product that may be evaluated in this article, or claim that may be made by its manufacturer, is not guaranteed or endorsed by the publisher.
Alexandrowicz, Z., Urban, J., and Miśkiewicz, K. (2009). Geological values of selected polish properties of the UNESCO world heritage list. Geoheritage 1, 43–52. doi:10.1007/s12371-009-0004-y
Alexianu, M., Weller, O., and Brigand, R. (2016a). “Romanian salt springs, intangible cultural heritage, archaeological reconstruction: a variable geometry,” in The intangible elements of culture in ethnoarchaeological research. Editors S. Biagetti, and F. Lugli (Cham: Springer), 231–240. doi:10.1007/978-3-319-23153-2_18
Alexianu, M.-T., Weller, O., Curcă, R.-G., Brigand, R., and Asăndulesei, M. (2016b). White gold. French and Romanian projects on salt in the extra-carpathian areas of Romania. Kaiserslautern: Parthenon Verlag.
Aller, L., Bennett, T., Lehr, J. H., and Petty, R. J. (1985). DRASTIC: a standardized system for evaluating ground water pollution potential using hydrogeologic settings. Ada Oklahoma: U.S Environmental Protection Agency.
Asăndulesei, A. (2017). Inside a cucuteni settlement: remote sensing techniques for documenting an unexplored eneolithic site from northeastern Romania. Remote Sens. 9, 1–41. doi:10.3390/rs9010041
Asăndulesei, A., Alexianu, M.-T., Curcă, R.-G., Caliniuc, S., and Asăndulesei, M. (2014). Settling selection patterns in the Subcarpathian areas of Romania. Salt resources as a determining factor for prehistoric occupation. SGEM GeoConference Inf. Geoinformatics Remote Sens. 14, 829–839. doi:10.5593/SGEM2014/B23/S11.106
Babiker, I. S., Mohamed, M. A., Hiyama, T., and Kato, K. (2005). A GIS-based DRASTIC model for assessing aquifer vulnerability in Kakamigahara Heights, Gifu Prefecture, central Japan. Sci. Total Environ. 345, 127–140. doi:10.1016/j.scitotenv.2004.11.005
Baghapour, M. A., Nobandegani, A. F., Talebbeydokhti, N., Bagherzadeh, S., Nadiri, A. A., Gharekhani, M., et al. (2016). Optimization of DRASTIC method by artificial neural network, nitrate vulnerability index, and composite DRASTIC models to assess groundwater vulnerability for unconfined aquifer of Shiraz Plain, Iran. J. Environ. Health Sci. 14, 1–16. doi:10.1186/s40201-016-0254-y
Bánffy, E. (2015). The beginnings of salt exploitation in the Carpathian Basin (6th-5th millennium BC). Doc. Praehist. 42, 197–209. doi:10.4312/dp.42.13
Brigan, R., and Weller, O. (2018). Neo-Eneolithic settlement pattern and salt exploitation in Romanian Moldavia. J. Archaeol. Sci. Rep. 17, 68–78. doi:10.1016/j.jasrep.2017.10.032
Brigan, R., Weller, O., Tencariu, F.-A., Alexianu, M., and Asăndulesei, A. (2018). “Ovine pastoralism and mobility systems in Romania: an ethnoarchaeological approach,” in Historical archaeologies of transhumance across Europe. Editors E. Costello, and E. Svensson (NY: Routledge), 245–263. doi:10.4324/9781351213394
Busico, G., Kazakis, N., Cuoco, E., Colombani, N., Tedesco, D., Voudouris, K., et al. (2020). A novel hybrid method of specific vulnerability to anthropogenic pollution using multivariate statistical and regression analyses. Water Res. 171, 115386. doi:10.1016/j.watres.2019.115386
Chitsazan, M., and Akhtari, Y. (2009). A GIS-based DRASTIC model for assessing aquifer vulnerability in Kherran Plain, Khuzestan, Iran. Water Resour. Manag. 23, 1137–1155. doi:10.1007/s11269-008-9319-8
David, N., and Kramer, C. (2001). “Ethnoarchaeology: its nature, origins, and history,” in Ethnoarchaeology in action. Editors N. David, and C. Kramer (Cambridge University Press), 1–32. doi:10.1017/CBO9781316036488.002
ETHNOSALRO (2010). The salt water springs of Moldavia: the ethnoarchaeology of a polyvalent natural resource Ethnosal project PN-II-IDEI.414/2007. Avaliable at: http://ethnosal.uaic.ro/about.html (Accessed September 28, 2019).
ETHNOSALRO (2016). The ethno-archaeology of the salt springs and salt mountains from the extra-Carpathian area of Romania Ethnosal project PN-II-ID-PCE-2011-3-0825. Avaliable at: http://ethnosalro.uaic.ro/download/EthnosalRo_RS-2011-2016_ENG.pdf (Accessed September 28, 2019).
ETHNOSALRO (2018). The ethnoarchaeology of salt in the inner carpathian area of Romania ethnosal project PN-III-P4-ID-PCE-2016-0759. Avaliable at: http://ethnosalro.uaic.ro/download/EthnosalRo_RS-2017_RO.pdf (Accessed September 28, 2019).
Geo-spatial (2011). Geological map of Romania, scale 1:200,000. Bucharest: Geological Romanian Institute database. Avaliable at: http://www.geo-spatial.org/download/harta-geologica-a-romaniei-scara-1-200-000 (Accessed September 28, 2019).
Ghosh, T., and Kanchan, R. (2016). Aquifer vulnerability assessment in the Bengal alluvial tract, India, using GIS based DRASTIC model. Model Earth Syst. Environ. 2, 153–213. doi:10.1007/s40808-016-0208-5
Girão, A. V., Caputo, G., and Ferro, M. C. (2017). “Application of scanning electron microscopy-energy dispersive X-ray spectroscopy (SEM-EDS),” in Characterization and analysis of microplastics. Editors M. Rocha-Santos, and A. Duarte (Oxford: Elsevier BV), 153–168. doi:10.1016/bs.coac.2016.10.00
Guo, J., Zhou, X., Zhang, Y., Ta, M., and Wang, Y. (2019). Occurrence and hydrochemical characteristics of saline and salty springs in the sichuan Basin of China. Geofluids 11, 1–16. doi:10.1155/2019/8671973
Guo, X., Xiong, H., Li, H., Gui, X., Hu, X., Li, Y., et al. (2023). Designing dynamic groundwater management strategies through a composite groundwater vulnerability model: integrating human-related parameters into the DRASTIC model using LightGBM regression and SHAP analysis. Environ. Res. 236 (2), 116871. doi:10.1016/j.envres.2023.116871
Harding, A. (2014). The prehistoric exploitation of salt in Europe. Geol. Q. 58 (3), 591–596. doi:10.7306/gq.1164
Hill, A. D., Lehman, A. H., and Maria, L. P. (2007). Using scanning electron microscopy with energy dispersive X-ray spectroscopy to analyze archaeological materials. Introducing scientific concepts and scientific literacy to students from all disciplines. J. Chem. Educ. 84 (5), 810. doi:10.1021/ed084p810
Jang, W. S., Engel, B., Harbor, J., and Theller, L. (2017). Aquifer vulnerability assessment for sustainable groundwater management using DRASTIC. Water 9, 792. doi:10.3390/w9100792
Kardan Moghaddam, H., Jafari, F., and Javadi, S. (2017). Vulnerability evaluation of a coastal aquifer via GALDIT model and comparison with DRASTIC index using quality parameters. Hydrol. Sci. J. 62, 1–10. doi:10.1080/02626667.2015.1080827
Krézsek, C., and Bally, A. W. (2006). The Transylvanian Basin (Romania) and its relation to the Carpathian fold and thrust belt: insights in gravitational salt tectonics. Mar. Pet. Geol. 23 (4), 405–442. doi:10.1016/j.marpetgeo.2006.03.003
Luo, Q., Yang, Y., Qian, J., Wang, X., Chang, X., Ma, L., et al. (2020). Spring protection and sustainable management of groundwater resources in a spring field. J. Hydrol. 582, 124498. doi:10.1016/j.jhydrol.2019.124498
Malakootian, M., and Nozari, M. (2020). GIS-based DRASTIC and composite DRASTIC indices for assessing groundwater vulnerability in the Baghin aquifer, Kerman, Iran. Nat. Hazards Earth Syst. Sci. 20, 2351–2363. doi:10.5194/nhess-20-2351-2020
Martínez-Bastida, J. J., Arauzo, M., and Valladolid, M. (2010). Intrinsic and specific vulnerability of groundwater in central Spain: the risk of nitrate pollution. Hydrol. J. 18, 681–698. doi:10.1007/s10040-009-0549-5
Măţău, F., Nica, V., Postolache, P., Ursachi, I., Cotiuga, V., and Stancu, A. (2013). Physical study of the Cucuteni pottery technology. J. Archaeol. Sci. 40, 914–925. doi:10.1016/j.jas.2012.08.021
Melcher, F., and Reichl, C. (2017). Economic geology of the eastern and south-eastern European (ESEE) region. Berg. Huettenmaenn Monatsh 162 (7), 238–244. doi:10.1007/s00501-017-0625-4
Merchant, J. W. (1994). GIS-based groundwater pollution hazard assessment: a critical review of the DRASTIC model. Photogramm. Eng. Remote Sens. 60, 1117–1127.
Mihu-Pintilie, A., Asăndulesei, A., Stoleriu, C. C., and Romanescu, G. (2016). GIS methods for assessment of hydro-geomorphic risk and anthropogenic impact which affect the archaeological sites. Case study: dealul Mare archaeological site, Moldavian Plateau (Romania). Acta Geobalcanica 2, 35–43. doi:10.18509/AGB.2016.04
Mihu-Pintilie, A., and Gherghel, I. (2022). Eco-Cultural niche breadth and overlap within the cucuteni–trypillia culture groups during the eneolithic. Front. Earth. Sci. 10, 910836. doi:10.3389/feart.2022.910836
Mihu-Pintilie, A., and Nicu, I. C. (2019). GIS-Based landform classification of eneolithic archaeological sites in the plateauplateau-plain transition zone (NE Romania): habitation practices vs. Flood hazard perception. Remote Sens. 8, 915. doi:10.3390/rs11080915
Modabberi, H., Hashemi, M. M. R., Ashournia, M., and Rahimipour, M. A. (2017). Sensitivity analysis and vulnerability mapping of the guilan aquifer using drastic method. Rev. Environ. Earth. Sci. 4, 27–41. doi:10.18488/journal.80.2017.41.27.41
Münster, A., Knipper, C., Oelze, V. M., Nicklisch, N., Stecher, M., Schlenker, B., et al. (2018). 4000 years of human dietary evolution in central Germany, from the first farmers to the first elites. PloS One 13 (3), e0194862. doi:10.1371/journal.pone.0194862
Neshat, A., and Pradhan, B. (2017). Evaluation of groundwater vulnerability to pollution using DRASTIC framework and GIS. Arab. J. Geosci. 10, 501–508. doi:10.1007/s12517-017-3292-6
Nikolov, V. (2016). The prehistoric salt-production and urban center of Provadia-Solnitsata, Northeastern Bulgaria. Méditerranée 126, 71–78. doi:10.4000/mediterranee.8246
Pazand, K., and Hezarkhani, A. (2012). Investigation of hydrochemical characteristics of groundwater in the Bukan basin, Northwest of Iran. Appl. Water. Sci. 2, 309–315. doi:10.1007/s13201-012-0051-4
Politis, G. G. (2014). “Ethnoarchaeology,” in Encyclopedia of global archaeology. Editor C. Smith (New York: Springer), 27–82. doi:10.1007/978-1-4419-0465-2_284
Quinn, C. P., and Ciugudean, H. (2018). Settlement placement and socio-economic priorities: dynamic landscapes in Bronze Age transylvania. J. Archaeol. Sci. Rep. 19, 936–948. doi:10.1016/j.jasrep.2017.05.046
Rezaei, M., Zarasvandi, A., Azhdari, A., and Heidari, M. (2021). Geology and hydrochemistry of brine springs in the Zagros Fold and Thrust Belt (ZFTB), Iran: a review on origin, environmental aspects, and economic potentials. Appl. Geochem. 130, 104985. doi:10.1016/j.apgeochem.2021.104985
Riddiford, N. G., Branch, N. P., Green, C. P., Armitage, S. J., and Olivier, L. (2012). Holocene palaeoenvironmental change and the impact of prehistoric salt production in the Seille Valley, eastern France. Holocene 22 (8), 831–845. doi:10.1177/0959683611434221
Romanescu, G. (2019). Salt and the development of human settlements with balnear and climateric potential within the Romanian intracarpathian space. Present Environ. Sustain. Dev. 13 (1), 137–155. doi:10.2478/pesd-2019-0011
Romanescu, G., Alexianu, M.-T., and Asăndulesei, A. (2014). THE DISTRIBUTION OF SALT MASSIFS AND THE EXPLOITATION OF ANCIENT AND CURRENT RESERVES OF MINERALIZED WATERS WITHIN THE SIRET HYDROGRAPHICAL BASIN (ROMANIA) CASE STUDY FOR THE EASTERN AREA OF THE EASTERN CARPATHIANS. SGEM GeoConference Water Resour. For. Mar. Ocean Ecosyst. 14, 731–746. doi:10.5593/SGEM2014/B31/S12.094
Romanescu, G., Carboni, D., Mihu-Pintilie, A., Stoleriu, C. C., and Efros, V. (2018). Streams and salt-water sources: ethnomanagement, current management and saltscape in the Moldavian area (catchments of Siret and Prut, Romania). Acta Geobalcanica 4 (2), 85–103. doi:10.18509/AGB.2018.10
Romanescu, G., Cîmpianu, C. I., Mihu-Pintilie, A., and Stoleriu, C. C. (2017). Historic flood events in NE Romania (post-1990). J. Maps 13, 787–798. doi:10.1080/17445647.2017.1383944
Romanescu, G., Curcă, R.-G., and Sandu, I. G. (2015a). Salt deposits in the Romanian Subcarpathians – genesis, repartition and ethnomanagement. Int. J. Conserv. Sci. 6 (3), 261–269.
Romanescu, G., Jora, I., Panaitescu, E., and Alexianu, M.-T. (2015b). Calcium and magnesium in the groundwater of the Moldavian Plateau (Romania) – distribution and managerial and medical significance. SGEM GeoConference Hydrology Water Resour. 16, 103–112. doi:10.5593/SGEM2015/B31/S12.014
Rozzi, F. R., and Froment, A. (2018). Earliest animal cranial surgery: from cow to man in the neolithic. Sci. Rep. 8, 5536. doi:10.1038/s41598-018-23914-1
Sandu, I., Vasilache, V., Alexianu, M.-T., and Curcă, R.-G. (2014). Chemical explanation of original milk curdling ethnoprocedure by natural brine. Rev. Chim. Buchar. 65 (1), 120–122.
Shirazi, S. M., Imran, H., and Akib, S. (2012). GIS-based DRASTIC method for groundwater vulnerability assessment: a review. J. Risk. Res. 15, 991–1011. doi:10.1080/13669877.2012.686053
Singh, A., Srivastav, S., Kumar, S., and Chakrapani, G. J. (2015). A modified-DRASTIC model (DRASTICA) for assessment of groundwater vulnerability to pollution in an urbanized environment in Lucknow, India. Environ. Earth. Sci. 74, 5475–5490. doi:10.1007/s12665-015-4558-5
Sordoillet, D., Weller, O., Rouge, N., Buatier, M., and Sizun, J.-P. (2018). Earliest salt working in the world: from excavation to microscopy at the prehistoric sites of Ţolici and Lunca (Romania). J. Archaeol. Sci. 89, 46–55. doi:10.1016/j.jas.2017.11.003
Stanton, J. S., Anning, D. W., Brown, C. J., Moore, R. B., McGuire, V. L., Qi, S. L., et al. (2017). Brackish groundwater in the United States. Reston, Virginia: U.S. Geological Survey Professional, 1–185.
Stoleriu, C. C., Urzica, A., and Mihu-Pintilie, A. (2020). Improving flood risk map accuracy using high-density LiDAR data and the HEC-RAS river analysis system: a case study from north-eastern Romania. J. Flood Risk Manag. 13, e12572. doi:10.1111/jfr3.12572
Tencariu, F.-A. (2018). Examining the relation between the shape/manufacture technique and the function of the pottery used for salt-making (briquetages). Stud. Antiq. Archaeol. 8 (2), 139–146.
Tencariu, F.-A., Alexianu, M., Cotiuga, V., Vasilache, V., and Sandu, I. (2015). Briquetage and salt cakes: an experimental approach of a prehistoric technique. J. Archaeol. Sci. 59, 118–131. doi:10.1016/j.jas.2015.04.016
Warren, R. E., and Asch, D. L. (1999). “A Predictive model of archaeological site location in the Eastern Prairie Peninsula,” in Practical applications of GIS for archaeologists. A predictive modeling toolkit. Editors K. L. Wescott, and R. J. Brandon (London: Taylor and Francis), 3–32. doi:10.1201/b16822-7
Yang, N., Wang, G., Shi, Z., Zhao, D., Jiang, W., Guo, L., et al. (2018). Application of multiple approaches to investigate the hydrochemistry evolution of groundwater in an arid region: nomhon, northwestern China. Water 10, 1667. doi:10.3390/w10111667
Yin, L., Zhang, E., Wang, X., Wenninger, J., Dong, J., Guo, L., et al. (2013). A GIS-based DRASTIC model for assessing groundwater vulnerability in the Ordos Plateau, China. Environ. Earth. Sci. 69, 171–185. doi:10.1007/s12665-012-1945-z
Keywords: GIS, SEM-EDX investigations, DRASTIC index, saline groundwater sources, elemental composition of salt, ethnoarchaeology, Romania
Citation: Mihu-Pintilie A, Vasilache V, Tencariu F-A and Asăndulesei A (2023) Elemental composition of salt and vulnerability assessment of saline groundwater sources selected based on ethnoarchaeological evidence in Romania. Front. Earth Sci. 11:1270063. doi: 10.3389/feart.2023.1270063
Received: 31 July 2023; Accepted: 28 November 2023;
Published: 11 December 2023.
Edited by:
Gopal Krishan, National Institute of Hydrology, IndiaReviewed by:
Yawar Hussain, Sapienza University of Rome, ItalyCopyright © 2023 Mihu-Pintilie, Vasilache, Tencariu and Asăndulesei. This is an open-access article distributed under the terms of the Creative Commons Attribution License (CC BY). The use, distribution or reproduction in other forums is permitted, provided the original author(s) and the copyright owner(s) are credited and that the original publication in this journal is cited, in accordance with accepted academic practice. No use, distribution or reproduction is permitted which does not comply with these terms.
*Correspondence: Viorica Vasilache, dmlvcmljYS52YXNpbGFjaGVAdWFpYy5ybw==
Disclaimer: All claims expressed in this article are solely those of the authors and do not necessarily represent those of their affiliated organizations, or those of the publisher, the editors and the reviewers. Any product that may be evaluated in this article or claim that may be made by its manufacturer is not guaranteed or endorsed by the publisher.
Research integrity at Frontiers
Learn more about the work of our research integrity team to safeguard the quality of each article we publish.