 Xiaoyi Liu
 Yongshuang Zhang3*
- 1China Aero Geophysical Survey and Remote Sensing Center for Natural Resources, Beijing, China
- 2Key Laboratory of Airborne Geophysics and Remote Sensing Geology, Ministry of Natural Resources, Beijing, China
- 3School of Engineering and Technology, China University of Geosciences, Beijing, China
The identification of ancient landslides has become a challenging task due to the long-term reconstruction and sediment cover, which obscure the original geomorphic characteristics of these landslides. To address this issue, a comprehensive remote sensing identification model, known as GTVI, is developed using the Object Based Image Analysis (OBIA) based on multi-source and high-resolution remote sensing data in the Dadu River Basin. The study reveals significant differences in texture, hue, shape, and adjacency topology between ancient landslides and reactivated landslides. The gray level co-occurrence matrix entropy (GLCM), terrain roughness index (TRI) and vegetation index (NDVI) effectively capture the information related to ancient landslides. The feasibility of the GTVI (GLCM and Terrain roughness and Vegetation index) model is confirmed through field investigations and remote sensing image analysis of typical landslides, demonstrating its high accuracy. This research provides a valuable method and technical reference for the rapid identification of ancient landslides in plateau canyon areas.
1 Introduction
The eastern margin of the Tibetan Plateau is well known for its high topographic relief, intense endogenous and exogenous geological processes, and extreme climatic conditions. This region also has a vast number of well-developed ancient landslides that pose a significant risk of reactivation (Ren et al., 2021; Yang et al., 2021; Zhang et al., 2023). Accurate identification of these ancient landslides is essential for studying their reactivation mechanisms and for risk prevention (Dong et al., 2022; Guo et al., 2023; Xu et al., 2023). It plays a crucial role in the research and prevention system of landslide disasters.
However, ancient landslides have undergone long-term geological processes, and their original appearance characteristics are unclear, making it difficult to quickly and accurately identify them in practice (Zhang et al., 2015; Xu, 2020; Cui et al., 2023). Remote sensing identification of reactivated landslides can achieve over 80% accuracy due to the significant spectral differences between the landslide area and the surrounding environment (Ji et al., 2020). However, for ancient landslides, their spectral characteristics do not differ significantly from the surrounding environment, making automatic identification more difficult. Even for ancient landslides in the Loess Plateau with relatively obvious geomorphic features, the current identification accuracy is only 60%–70% (Xu, 2020). Identification of ancient landslides in the deep valley area on the eastern margin of the Tibetan Plateau is even more difficult and less accurate due to the complex terrain and vegetation cover.
In recent years, the development of high-resolution multisource remote sensing techniques has provided the possibility to solve these problems (Keyport et al., 2018). The integration of various information extraction and multiscale segmentation techniques to quickly and accurately extract quantitative information from a large amount of remote sensing data (such as high spatial, high spectral, high radiometric, and high temporal resolution images) has become a hot topic (Lu et al., 2011; Bruzzone et al., 2013). Martha et al. (2010) considered the spectral, geomorphological, and spatial information of landslides and used multispectral images and multiscale segmentation techniques to identify landslides in the Mandakini River in India. Daniel et al. (2012) classified landslides in northwestern Italy based on SPOT-5 and DEM data using an object-oriented semi-automatic analysis method. However, current research has mainly focused on the identification of reactivated landslides based on significant spectral and textural features, with relatively less research on the identification of ancient landslides that have spectral characteristics similar to those of their surroundings.
In this paper, we applied an Object Based Image Analysis method (OBIA) to analyse the characteristics of landslides in the Dadu River Basin on the eastern margin of the Tibet Plateau using multi-source high-resolution remote sensing data (Landsat, ZY-3 satellite images, and UAV images). We established a comprehensive remote sensing identification model (GTVI, GLCM and Terrain Roughness and Vegetation Index) for ancient landslides in the deep valley area, significantly improved the efficiency and accuracy of landslide remote sensing information extraction.
2 Data and methods
2.1 Data selection and preprocessing
The Dadu River Basin is characterized by complex topography and landforms, with a maximum elevation of 4260 m and a minimum elevation of 1940 m, resulting in a relative elevation difference of up to 2300 m. This makes it a typical deep valley landscape. The area consists of various types of exposed rock formations, including metamorphic rocks, igneous rocks, sedimentary rocks, and Quaternary loose deposits. Geological hazards occur mainly in the Quaternary breccia deposits and soft metamorphic rocks such as quartzite and slate. The intersection of the NW-trending Xianshuihe Fault Zone and the NE-trending Longmenshan Fault Zone in the study area contributes to intense tectonic activity and frequent landslide disasters. This area exhibits characteristics such as multiple occurrence points, wide distribution, and sudden onset, which pose significant risks (Figure 1).
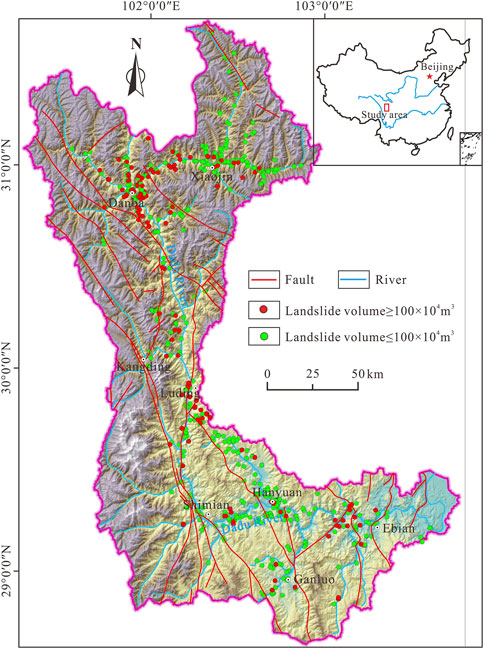
FIGURE 1. Distribution map of landslides in the study area.
The study utilized several basic data sources, including SRTM DEM data with a resolution of 30 m, ZY-3 DOM data with a resolution of 2 m, Landsat 8 OLI data (path 131, row 39) acquired on 25 December 2017, and small-scale UAV images acquired in August 2019. Landsat data were used to interpret the distribution of landslides, while high-resolution remote sensing images from ZY-3 and UAV were employed to analyze the detailed characteristics of landslides. To ensure accurate spatial and spectral information of the remote sensing data, the Landsat 8 images were pre-processed using ENVI 5.3 and ArcGIS 10.2 software. This included radiometric calibration, atmospheric correction, geometric correction, mosaicing, and image cropping prior to performing the OBIA classification.
2.2 Object based image analysis method
OBIA is a classification method that takes into account spatial, textural, and spectral features to classify remote sensing images. It effectively addresses issues encountered in traditional pixel-based classification methods, such as “same object, different spectra” or “same spectra, different objects.” OBIA offers advantages such as high interpretation accuracy and the ability to eliminate speckle noise (Martha et al., 2012; Scaioni et al., 2014; Patil et al., 2020). The OBIA data processing workflow is illustrated in Figure 2. Image segmentation and feature selection are critical steps in landslide information extraction using OBIA, as they determine the efficiency and accuracy of landslide information extraction (Tian et al., 2007).
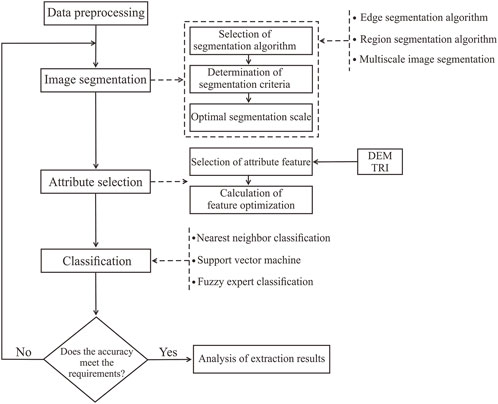
FIGURE 2. Landslide information extraction using the OBIA method.
2.2.1 Image segmentation
The choice of the segmentation scale has a significant impact on the classification accuracy (Woodcock et al., 1987; Hölbling et al., 2012; Wang et al., 2015). In this study, the local variance method (Eq. 1) was employed as an effective measure to evaluate the quality of the image. To estimate the scale factor, a scale parameter estimation tool was utilized (Lee et al., 2003; Jacquin et al., 2008). This tool automatically calculated the local variance (LV) for each segmented object at the corresponding segmentation scale. The optimal segmentation scale was determined by analysing the dynamic rate of change of LV, known as ROC, as shown in Eq. 2 (Lucian et al., 2011).
In Eq. 1, vL represents the local variance, which is a measure of the variation in grayscale values within a segmented object. The variable x refers to the grayscale value of a pixel within the object. By calculating the local variance using Eq. 1, we can assess the level of variation in pixel values within each segmented object, which helps evaluate the quality of the image segmentation.
According to Eq. 2, L and L-1 represent the LV values corresponding to the current segmentation scale layer and the next segmentation scale layer, respectively. The ROC curve is used to determine the optimal segmentation scale, with the peak point on the curve indicating the reference value for the optimal scale factor.
Based on Figure 3, which provides information on the ROC curve, the potential optimal scale factors for the study area are 30, 50, 70, and 95. Taking into consideration factors such as terrain, landforms, and landslide characteristics, a scale factor of 50 is chosen. Additionally, a shape factor of 0.4 and compactness factor of 0.5 are selected.
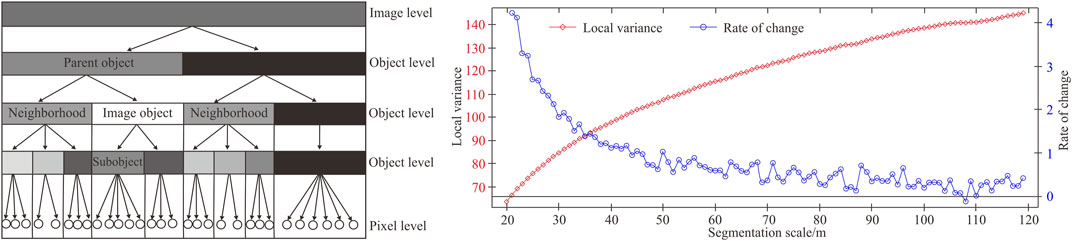
FIGURE 3. Multiscale segmentation and optimal segmentation scale selection. (A) The level of multiscale segmentation. (B) Relationship curve between ROC and LV.
The region growing and merging algorithm for multiscale segmentation based on the principle of minimizing heterogeneity adopts a spectral criterion and a shape criterion in segmentation to determine the degree of homogeneity (f) of individual pixels and neighboring pixels in an image (Eq. 3) (Baatz et al., 1999).
In Eq. 3, hspectal denotes the spectral discreteness criterion, i.e., spectral feature heterogeneity, hshape denotes the shape discreteness criterion, i.e., shape feature heterogeneity, and w is the user-defined spectral weight with respect to the shape, 0≤w≤1.
The compactness heterogeneity indicates the compactness of the area after merging (Eq. 4),
In Eq. 4, l is the actual boundary length of the image object, and n is the number of image elements composing the image object.
Smoothness heterogeneity indicates the boundary smoothness of the merged region (Eq. 5),
In Eq. 5, l is the actual boundary length of the image object, b is the shortest possible boundary length of the image object.
The shape factor is then calculated by the above two criteria (Eq. 6).
With these parameters, the segmentation objects obtained are of moderate size, with minimal internal spectral differences and clear boundaries between different categories. This selection aims to balance the spatial geometric distribution characteristics of landslides with capturing local details, thereby facilitating the extraction of landslide information.
2.2.2 The selection of attribute features
After performing multiscale segmentation, we obtain several homogeneous image objects with strong homogeneity. To extract the desired information, we select attributes of the image objects, including spectral features, shape features, texture features, and terrain features (Martha et al., 2010; Rau et al., 2014).
The aim of this study is to select the most suitable attribute features for landslide information extraction from the 11 classification features presented in Table 1. The selection principle is based on the samples of each category and the initial feature set. The aim is to find the combination of features that maximizes the average distance and minimizes the distance between categories, resulting in an optimal separation distance. This optimal feature set will be used for classification.

TABLE 1. Common image attribute classification features.
Using the “Feature Space Optimization” tool, we determined the following optimal attribute features that are suitable for landslide information extraction in the study area: NDVI, brightness value (BI), aspect ratio, topographic roughness index (TRI), elevation, gray-level cooccurrence matrix (GLCM entropy all dir), and slope. These seven features were selected to establish the feature space of the objects, as shown in Figure 3.
2.2.3 Extraction of landslide information
After selecting the object features, we use the assignment algorithm to statistically determine threshold ranges for each feature of landslides based on the feature value window (Figure 4). Then, the thresholds for different attribute features are determined according to the optimal attribute features, resulting in the extraction of landslide candidate areas (Figure 5). Comparing Figures 5A, B, it can be observed that the landslide candidate areas are mainly distributed along both sides of the river, which indicates a satisfactory overall extraction effect, as shown in Figure 5C.
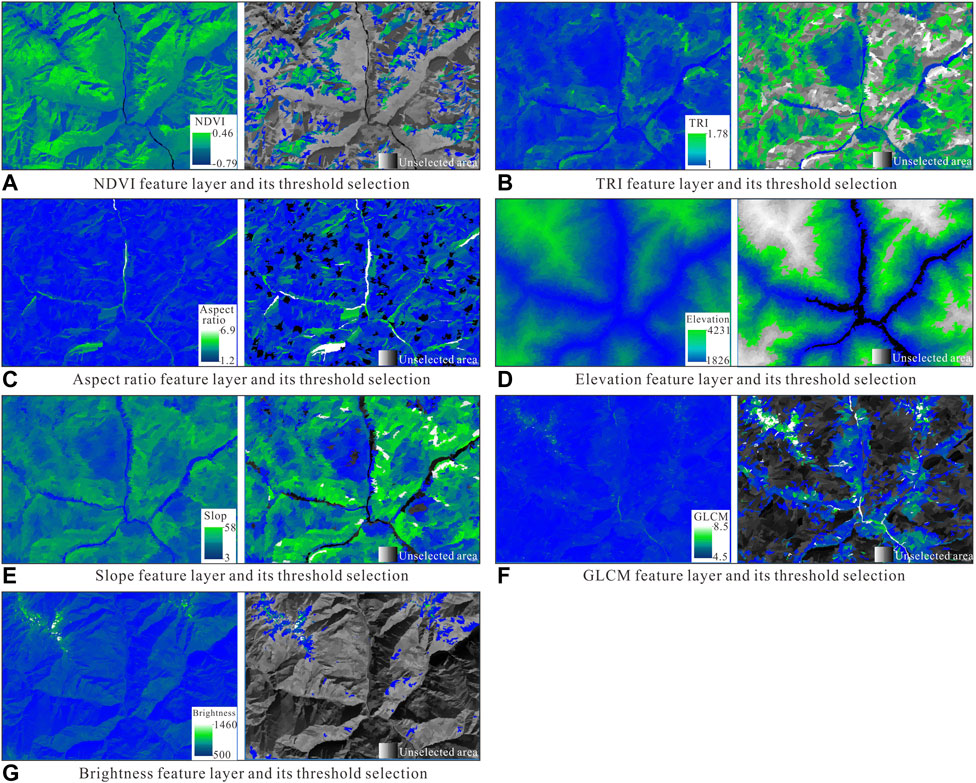
FIGURE 4. Optimal attribute feature layer and threshold selection.
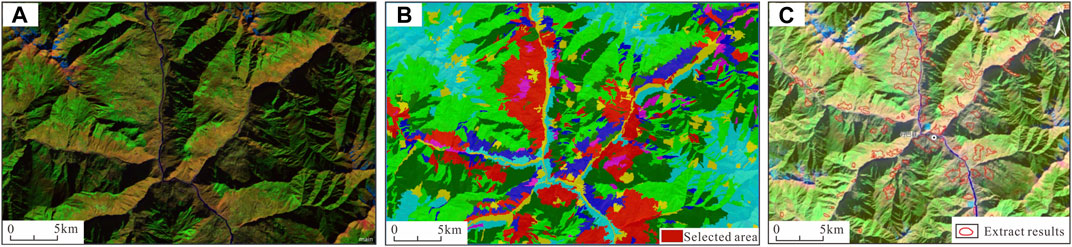
FIGURE 5. Landslide extraction results in eCognition view. (A) Remote sensing images. (B) Preliminary identification results of ancient landslides, red represents the landslide range. (C) Landslide extraction results.
It is important to note that due to the image segmentation process, there are multiple image objects of the same category within the landslide candidate areas. As a result, there are numerous blocks, messy boundaries, and high computational complexity, which are not conducive to result analysis. In addition, roads, buildings, shadows, and other features have high similarity to landslide information in terms of spectral, morphological, and background aspects (Figure 5B). Therefore, it is necessary to combine high-resolution remote sensing images with field surveys for verification. The scattered small patches need to be integrated and smoothed to allow a more accurate classification of the images based on real conditions (Figure 5C).
3 A comprehensive remote sensing identification model for ancient landslides
There are significant differences in the characteristics of ancient landslides and reactivated landslides. Ancient landslides, which occurred a long time ago, typically have a relatively smooth surface and high vegetation cover. In contrast, reactivated landslides have a rough surface, and the vegetation that was damaged by the landslide has not yet fully recovered within a short period of time. As a result, remote sensing identification of ancient landslides is more challenging than that of reactivated landslides.
To improve the accuracy of ancient landslide identification, it is essential to construct a comprehensive remote sensing identification model specifically designed for ancient landslides. This can be achieved through a comparative analysis of the attribute characteristics of ancient landslides and reactivated landslides. By identifying the key differences in attribute characteristics between these two types of landslides, the remote sensing model can be tailored to effectively distinguish between them and accurately identify ancient landslides.
3.1 Differences in attribute characteristics between ancient landslides and reactivated landslides
Based on the field survey, a comparative analysis of sample information (Table 2) between ancient landslides and reactivated landslides reveals significant differences in terms of texture, hue, morphology, and critical topology. Specifically, there are noticeable differences in attributes such as the vegetation index (NDVI), brightness index (BI), terrain roughness index (TRI), and gray-level co-occurrence matrix entropy (GLCM).
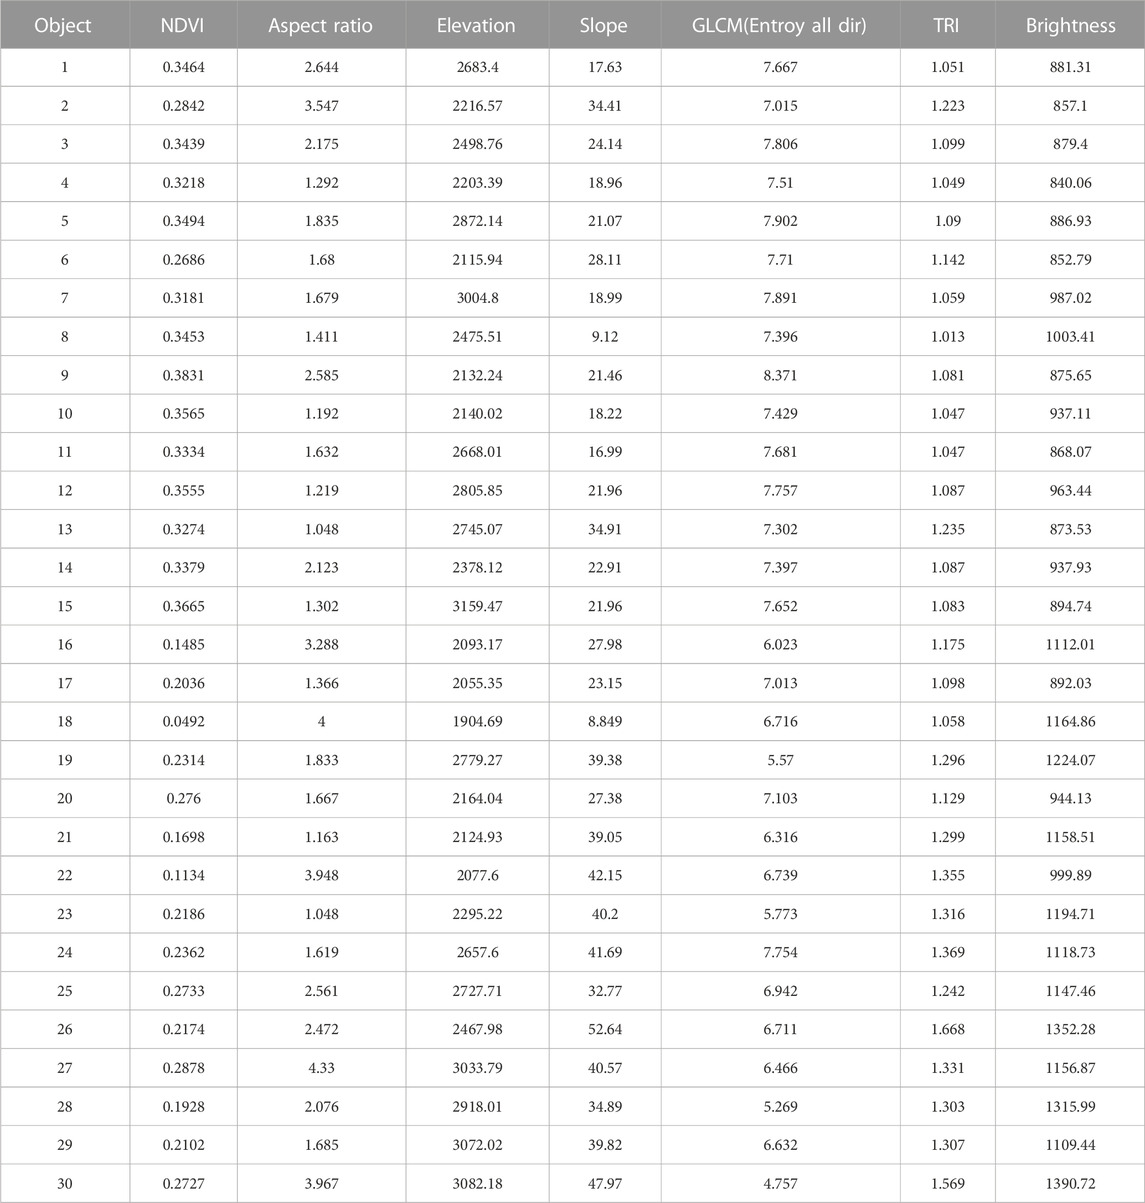
TABLE 2. Sample objects of the ancient landslide and the reactivated landslide.
To provide a more intuitive representation of these differences, we remove the unit constraints of the different attributes. This allows for a weighted comparison of indicators with different units or scales. The attribute characteristics of the selected samples from ancient landslides and reactivated landslides are then normalized using Eq. 7, which helps standardize the data for analysis and comparison purposes. By normalizing the attribute values, we can effectively compare and evaluate the differences between ancient landslides and fresh landslides in a more meaningful way.
In Eq. 3, x* represents the normalized attribute feature value, xmin denotes the minimum value of the attribute feature, and xmax represents the maximum value of the attribute feature.
After the attribute feature values are normalized according to Eq. 3 and scaled them proportionally to the specified range [0, 1], they are transformed into dimensionless numerical values. Statistical analysis is then performed on the attribute features of the selected samples (Figure 6). The analysis reveals significant differences between ancient landslides and reactivated landslides in attributes such as NDVI, GLCM, TRI, and BI.
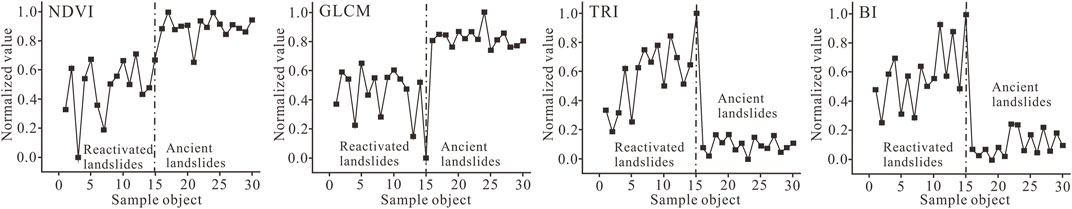
FIGURE 6. Distribution of ancient landslides and reactivated landslides based on object attribute features.
For ancient landslides, the normalized values of NDVI and GLCM are relatively high, ranging from [0.8, 1]. This indicates that ancient landslides have a higher vegetation index and higher gray-level co-occurrence matrix entropy than reactivated landslides. On the other hand, the normalized values of NDVI and GLCM for reactivated landslides are relatively low, ranging from [0, 0.6], indicating lower vegetation cover and less texture complexity.
In contrast, the normalized values of TRI and BI for reactivated landslides are higher than those for ancient landslides. This indicates that reactivated landslides exhibit more terrain roughness and brightness than ancient landslides. The normalized values of TRI and BI for ancient landslides are concentrated around [0, 0.2], with only a few exceeding 0.2, indicating relatively smoother terrain and lower brightness.
These findings highlight the different attribute characteristics between ancient landslides and reactivated landslides, and provide insights that can be further utilized for the accurate identification and differentiation of these types of landslides using remote sensing techniques.
3.2 A remote sensing identification model (GTVI)
Ancient landslides and reactivated landslides exhibit significant differences in attributes such as NDVI, GLCM, TRI, and BI, as shown in Figure 6. Since both BI and NDVI represent spectral characteristics, but NDVI provides more meaningful data, NDVI is selected as one of the factors for the identification model. When considering the analysis of the original attribute features in Table 2, it can be observed that the numerical values of NDVI and GLCM differ by an order of magnitude. However, both attributes consistently demonstrate differences between the two types of landslides: reactivated landslides have lower values, while ancient landslides have higher values.
To enhance the clustering characteristics between ancient and reactivated landslides, a modification is proposed. The attribute values of NDVI are multiplied by 10 and then summed with the GLCM attribute values. This modification aims to provide a clearer separation between the two types of landslides. In contrast, the TRI values exhibit differences that are opposite to those of NDVI and GLCM. To further enhance the clustering and differentiation in the identification model, the TRI values are subtracted.
The final GTVI (GLCM and Terrain roughness and Vegetation index) model is given by Eq. 8:
To validate the clustering performance of the model, a quality function IGTVI is constructed based on the GTVI model. The IGTVI values are then normalized using Z-score standardization on the model data. Eq. 9 for obtaining IGTVI is as follows:
In Eqs. 10, 11, n represents the total number of samples, and s represents the sample standard deviation.
To provide a more intuitive understanding of the attribute differences between reactivated landslides and ancient landslides, the analysis focuses on the pixels within the landslide samples. The maximum value, mean value, variance, and standard deviation of these sample pixels are calculated.
To visualize the distribution of the IGTVI values of the sample pixels in the Dadu River Basin, a histogram is plotted. This histogram represents the number of pixels corresponding to different IGTVI values in both the ancient and reactivated landslide areas (Figure 7). The analysis reveals that the frequency distribution of the pixel counts for both reactivated landslides and ancient landslides approximately follows a Gaussian distribution.
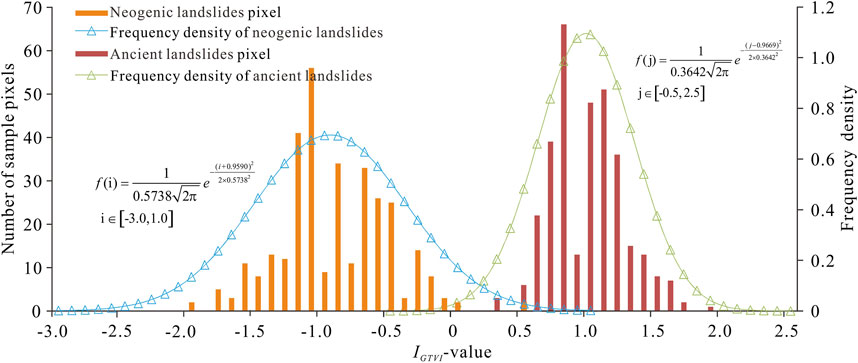
FIGURE 7. Frequency density function of IGTVI values corresponding to the pixels of ancient and reactivated landslides.
To further analyze and quantify this distribution, MATLAB is used to fit the frequency count data of pixel counts. The results, as shown in Figure 7, indicate that the frequency counts of pixel counts for both reactivated landslides and ancient landslides conform to a normal distribution. This means that the frequency density functions of the sampled pixels can be obtained for both types of landslides. By obtaining the frequency density functions, it becomes possible to analyze and compare the distribution characteristics of the IGTVI values in reactivated landslides and ancient landslides more precisely.
The obtained correlation coefficient (R2) from fitting a Gaussian curve to the pixels of ancient landslides is 0.8876, while for reactivated landslides, it is 0.8041. In addition, the frequency of reactivated landslides having
3.3 Verification of the remote sensing identification model
In general, remote sensing data can be effectively utilized for the rapid detection and identification of reactivated landslides. This is because there are usually significant spectral differences between landslide areas and their surrounding environments (Ji, 2012). However, the accurate identification of ancient landslides can be challenging due to various factors, such as long-term transformation or sediment deposition. These factors often make the spectral characteristics of ancient landslides being less distinct from their surroundings.
To overcome these challenges and achieve accurate identification, the GTVI model needs to be analyzed in conjunction with typical examples. Therefore, in this study, the Suopo landslide group and the Jiaju landslide group are selected as representative cases. These landslide groups contain both reactivated landslides and ancient landslides. To conduct a comprehensive analysis of the landslides, remote sensing information is combined with field investigations (Figure 8).
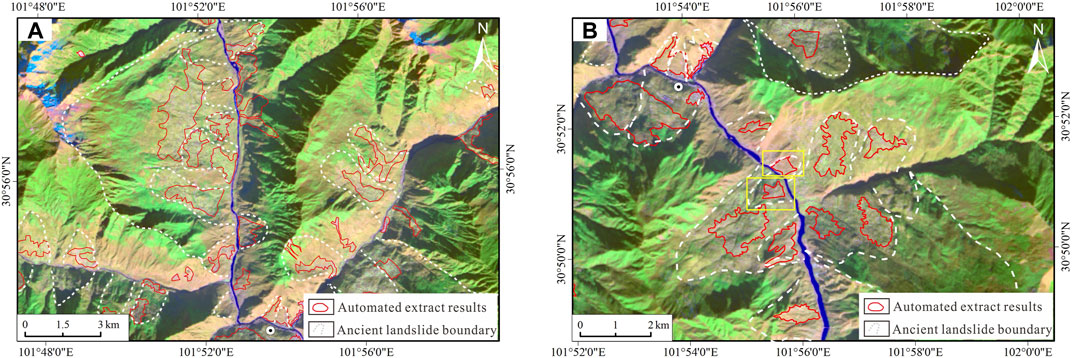
FIGURE 8. Landslide results extracted by the OBIA method. (A) The Suopo landslide group. (B) The Jiaju Landslide Group.
3.3.1 Case study analysis
1) The Suopo landslide group
The Suopo landslide group is located 3 km south of Danba County town upstream of the Dadu River. It consists of several individual landslides, including the Suopo landslide, Chanong landslide, Moluo landslide, Songda landslide, and Zegong landslide (Figure 8A). Table 3 provides the attribute values of these typical landslides in the Suopo landslide group.
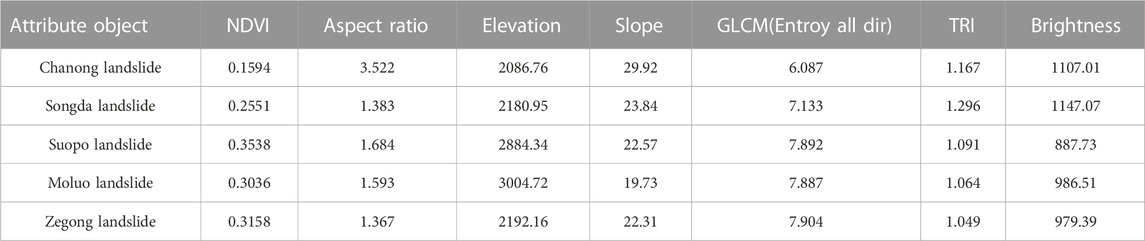
TABLE 3. Attribute features of typical objects in the Suopo landslide group.
The attribute values show that the NDVI, GLCM, and TRI values vary significantly among the different landslides. The Chanong and Songda landslides have relatively lower NDVI and GLCM values, while their TRI values are comparatively higher. Further field investigation revealed several characteristics of these landslides. The Chanong and Songda landslides exhibit severe destruction of surface vegetation, loose soil, and clear signs of recent activity. This suggests that they are reactivated landslides. On the other hand, the Moluo, Suopo, and Zegong landslides have abundant vegetation cover on their slopes and do not show clear topological relationships with the surrounding areas. These characteristics indicate that these landslides are ancient landslides (Figure 9).
2) The Jiaju landslide group
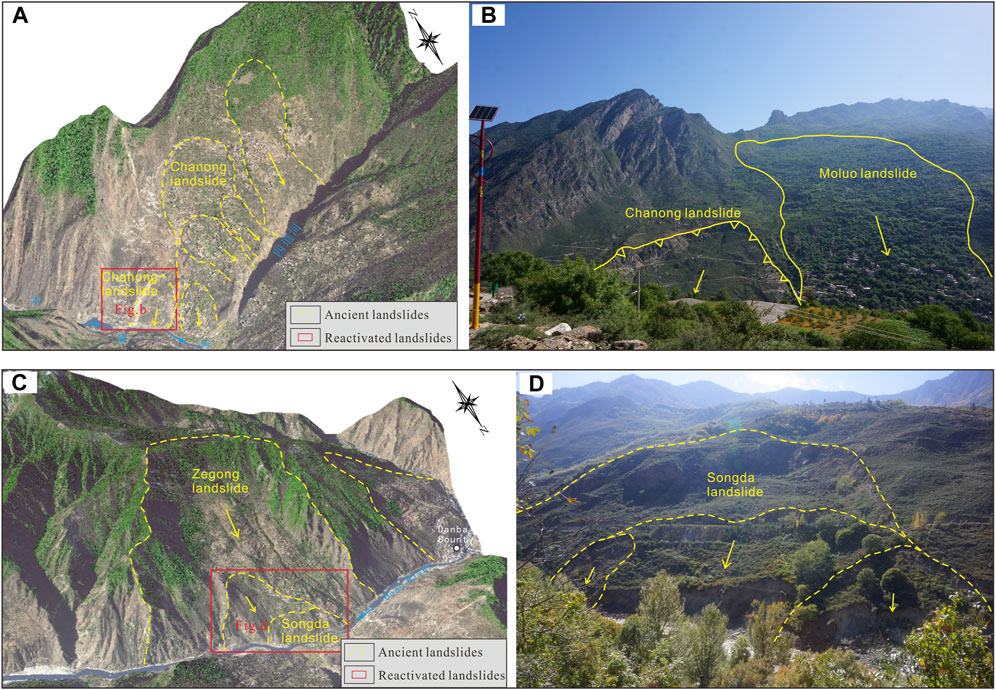
FIGURE 9. Remote sensing interpretation and field verification of the Suopo landslide group. (A) and (B) The Chanong landslide. (C) and (D) The Songda landslide.
The Jiaju Landslide Group is located in Niela Township, Danba County, in the upstream area of the Dadu River. It is approximately 6 km away from the county town and consists of several individual landslides, including the Jiaju, Niela, Hanei, and Nading landslides (Figure 8B). Table 4 provides the attribute characteristics of these typical landslides in the Jiaju landslide group. The attribute values show remarkable differences among the landslides. Specifically, the Niela landslide exhibits significantly smaller NDVI and GLCM values than the other landslides. On the other hand, its TRI value is relatively larger.
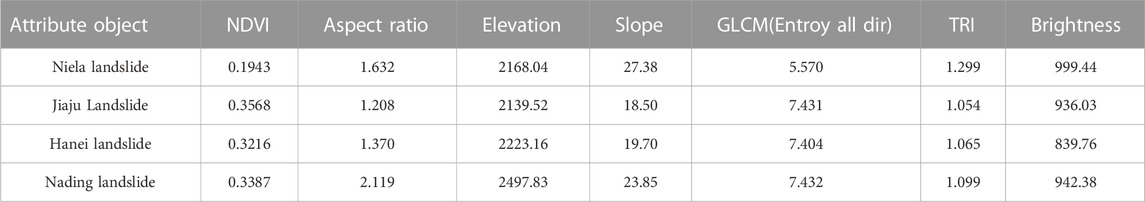
TABLE 4. Attribute features of typical objects in the Jiaju landslide group.
Field investigations were conducted to further understand the characteristics of the landslides. The results indicate that the Niela landslide is a reactivated landslide. This conclusion is supported by the lower NDVI and GLCM values, which indicate less vegetation cover and less texture variation within the landslide area. Moreover, a higher TRI value indicates a higher degree of surface roughness, which is commonly associated with reactivated landslides. In contrast, the other landslides in the Jiaju Landslide Group exhibit typical features of ancient landslide landforms. These characteristics, combined with field observations, suggest that the Jiaju, Hanei, and Nading landslides are ancient landslides rather than reactivated landslides (Figure 10).
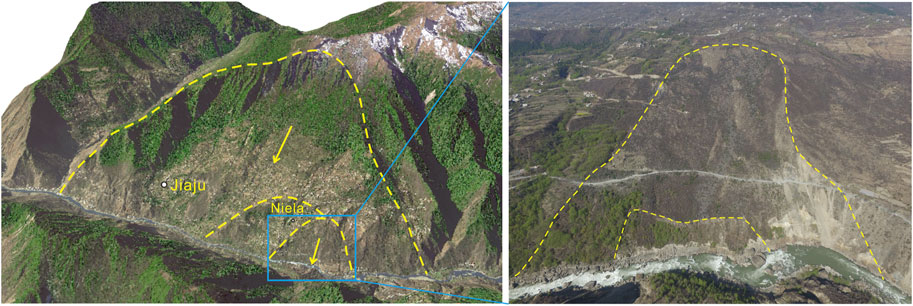
FIGURE 10. Remote sensing interpretation and field verification of the Jiaju landslide group.
3.3.2 Result analysis
Applying Eqs. 3–7 to the landslide pixels extracted from Table 3 and Table 4 and plotting the histogram of the number of pixels corresponding to IGTVI values (Figure 7), several observations can be made.
First, it is evident that the IGTVI values for reactivated landslides are generally less than 0, while the IGTVI values for ancient landslides are generally greater than 0. This distinction in IGTVI values between reactivated and ancient landslides highlights the potential of the GTVI model to differentiate between these two types of landslides (Figure 11).
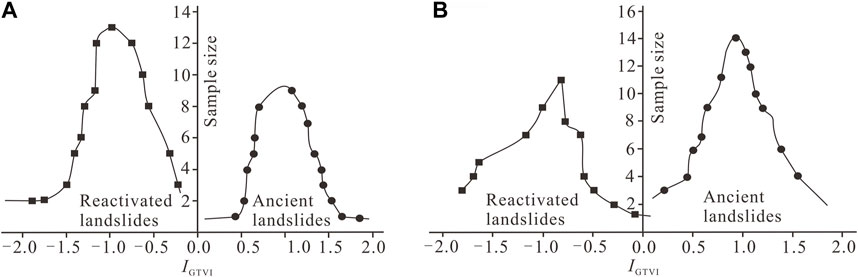
FIGURE 11. IGTVI values of reactivated landslide and ancient landslide pixels. (A) The Suopo landslide group. (B) The Jiaju Landslide Group.
Second, the pixel distribution of reactivated and ancient landslides follows an approximately normal distribution. This statistical characteristic further validates the reliability of the GTVI model based on attributes such as GLCM, NDVI, and TRI. The normal distribution of pixel values suggests that these attributes effectively capture the differences between reactivated and ancient landslides, allowing for accurate classification using the GTVI model (Figure 11).
Based on these observations, it can be concluded that the GTVI model provides a solid basis for distinguishing between reactivated and ancient landslides. The model’s reliance on attributes such as GLCM, NDVI, and TRI, combined with the statistical characteristics exhibited by the IGTVI values, enhances its reliability and accuracy in landslide classification.
4 Conclusion
Based on the analysis of multi-source and high-resolution remote sensing data in the Dadu River basin, the study applied the Object Based Image Analysis (OBIA) method to conduct attribute analysis of landslides. Vegetation indices (NDVI), terrain roughness index (TRI), and gray-level co-occurrence matrix entropy (GLCM) were used as indicators to establish a comprehensive identification model for ancient landslides, known as the GTVI model. The following conclusions were drawn from the study:
1) The optimal scale factor for landslide information extraction in the Dadu River basin was determined to be 50, with a shape factor of 0.4 and compactness factor of 0.5, using ROC-LV curves and OBIA technology.
2) Statistical analysis of landslide attribute characteristics revealed significant differences between ancient landslides and reactivated landslides in terms of texture, hue, shape, and adjacency topology. Based on these differences, the GTVI model was established using NDVI, TRI, and GLCM as basic indicators.
3) The reliability of the GTVI model in identifying ancient landslides was confirmed through field investigations of typical landslides and analysis of remote sensing image features. The model demonstrated the ability to discriminate between reactivated and ancient landslides based on their attribute characteristics. This finding provides a valuable method and technological reference for the rapid identification of ancient landslides in deep valley areas.
Data availability statement
The original contributions presented in the study are included in the article/supplementary material, further inquiries can be directed to the corresponding authors.
Author contributions
XL: Conceptualization, Data curation, Formal Analysis, Investigation, Methodology, Software, Supervision, Writing–original draft, Writing–review and editing. YZ: Formal Analysis, Funding acquisition, Investigation, Methodology, Resources, Visualization, Writing–review and editing. SR: Investigation, Writing–review and editing. LT: Investigation, Writing–review and editing. ZG: Investigation, Writing–review and editing.
Funding
The author(s) declare financial support was received for the research, authorship, and/or publication of this article. This research was supported by the National Natural Science Foundation of China (No. 41731287), the Key Laboratory of Airborne Geophysics and Remote Sensing Geology Foundation (No. 2023YFL22) and the Key Research and Development Program in Ningxia, China (No. 2021BEG03118).
Acknowledgments
The authors express their gratitude to Prof. Changbao Guo and Prof. Xin Yao for their help in the field investigations and remote sensing image data treatment. The figures were prepared using ArcGIS and CorelDRAW software.
Conflict of interest
The authors declare that the research was conducted in the absence of any commercial or financial relationships that could be construed as a potential conflict of interest.
Publisher’s note
All claims expressed in this article are solely those of the authors and do not necessarily represent those of their affiliated organizations, or those of the publisher, the editors and the reviewers. Any product that may be evaluated in this article, or claim that may be made by its manufacturer, is not guaranteed or endorsed by the publisher.
References
Baatz, M., and Schape, A. (1999). Object-oriented and multi-scale image analysis in semanticent works. Enschede 15 (3), 87–109.
Bruzzone, L., and Bovolo, F. (2013). A novel framework for the design of change-detection systems for very-high-resolution remote sensing images. Proc. IEEE 101 (3), 609–630. doi:10.1109/JPROC.2012.2197169
Cui, Y., Yang, W., Xu, C., and Wu, S. (2023). Distribution of ancient landslides and landslide hazard assessment in the Western Himalayan Syntaxis area. Front. Earth Sci. 11, 1135018. doi:10.3389/feart.2023.1135018
Daniel, H., Petra, F. R., Francesco, A., Francesca, C., Nicola, C., and Lang, S. (2012). A semi-automated object-based approach for landslide detection validated by persisten-t scatterer interferometry measures and land-slide inventories. Remote Sens. 4 (5), 1310–1336. doi:10.3390/rs4051310
Dong, X., Yin, T., Dai, K., Pirasteh, S., Zhuo, G., Li, Z., et al. (2022). Identifying potential landslides on giant niexia slope (China) based on integrated multi-remote sensing technologies. Remote Sens. 14, 6328. doi:10.3390/rs14246328
Guo, C., Yuan, H., Wu, R., Yan, Y., and Yang, Z. (2023). Research review and prospects of the 2000 giant yigong long-runout landslide: volume, formation mechanism and recurrence period, Tibetan plateau, China. Front. Earth Sci. 10, 1017611. doi:10.3389/feart.2022.1017611
Hölbling, D., Füreder, P., Antolini, F., Cigna, F., Casagli, N., and Lang, S. (2012). A semi-automated object-based approach for landslide detection validated by persistent scatterer interferometry measures and landslide inventories. Remote Sens. 4, 1310–1336. doi:10.3390/rs4051310
Jacquin, A., Misakova, L., and Gay, M. (2008). A hybrid object-based classification approach for mapping urban sprawl in periurban environment. Land-scape Urban Plan. 84 (2), 152–165. doi:10.1016/j.landurbplan.2007.07.006
Ji, C. (2012). Study on the method of landslide identification based on object-oriented. University of electronic science and technology of China, 1–79 [in Chinese with English abstract].
Ji, S., Yu, D., Shen, C., Li, W., and Xu, Q. (2020). Landslide detection from an open satellite imagery and digital elevation model dataset using attention boosted convolutional neural networks. Landslides 17, 1337–1352. doi:10.1007/s10346-020-01353-2
Keyport, R. N., Oommen, T., Martha, T. R., Sajinkumar, K. S., and Gierke, J. S. (2018). A comparative analysis of pixel and object-based detection of landslides from very high-resolution images. Int. J. Appl. earth observation geoinformation 64, 1–11. doi:10.1016/j.jag.2017.08.015
Lee, D. S., Shan, J., and Bethel, J. S. (2003). Class-guided building extraction from Ikonos imagery. Photogrammetric Eng. Remote Sens. 69 (2), 143–150. doi:10.14358/PERS.69.2.143
Lu, P., Stumpf, A., Kerle, N., and Casagli, N. (2011). Object-oriented change detection for landslide rapid mapping. Geoscience Remote Sens. Lett. IEEE 8 (4), 701–705. doi:10.1109/LGRS.2010.2101045
Lucian, D., Clemens, E., and Thomas, S. (2011). Local variance for multi-scale analysis in geomorphometry. Geomorphology 130, 162–172. doi:10.1016/j.geomorph.2011.03.011
Martha, T. R., Kerle, N., Jetten, V., Westen, C. J. V., and Kumar, K. V. (2010). Characterising spectral, spatial and morphometric properties of landslides for semi-automatic detection using object-oriented methods. Geomorphology 116 (1-2), 24–36. doi:10.1016/j.geomorph.2009.10.004
Martha, T. R., Kerle, N., Westen, C. J. V., Jetten, V., and Kumar, K. V. (2012). Object-oriented analysis of multi-temporal panchromatic images for creation of historical landslide inventories. ISPRS J. photogrammetry remote Sens. 67, 105–119. doi:10.1016/j.isprsjprs.2011.11.004
Patil, A. S., Bhadra, B. K., Panhalkar, S. S., and Patil, P. T. (2020). Landslide susceptibility mapping using landslide numerical risk factor model and landslide inventory prepared through OBIA in chenab valley, Jammu and Kashmir (India). J. Indian Soc. Remote Sens. 48 (3), 431–449. doi:10.1007/s12524-019-01092-5
Rau, J. Y., Jhan, J. P., and Rau, R. J. (2014). Semiautomatic object-oriented landslide recognition scheme from multisensor optical imagery and DEM. IEEE Trans. Geosci. Remote Sens. 52 (2), 1336–1349. doi:10.1109/TGRS.2013.2250293
Ren, S., Zhang, Y., Xu, N., Wu, R., Liu, X., and Du, G. (2021). Mobilized strength of gravelly sliding zone soil in reactivated landslide: a case study of a giant landslide in the north-eastern margin of Tibet Plateau. Environ. Earth Sci. 80, 434. doi:10.1007/s12665-021-09638-y
Scaioni, M., Longoni, L., Melillo, V., and Papini, M. (2014). Remote sensing for landslide investigations: an overview of recent achievements and perspectives. Remote Sens. 6 (10), 9600–9652. doi:10.3390/rs6109600
Tian, X. (2007). Object-oriented information extraction from high resolution remote sensing imagery. China Academy of Surveying and mapping.
Wang, L., and Liu, Q. (2015). The methods summary of optimal segmentation scale selection in high-resolution remote sensing images multi-scale segmentation. Geomatics Spatial Inf. Technol. 3, 166–169.
Woodcock, C. E., and Strahler, A. H. (1987). The factor of scale in remote sensing. Remote Sens. Environ. 21 (3), 311–332. doi:10.1016/0034-4257(87)90015-0
Xu, H., Chen, J., Chen, R., Cui, Z., Mi, D., and Shi, L. (2023). Evolution process of the yinduba paleolandslide-dammed lake in the upper jinsha river, SE Tibetan plateau. Front. Earth Sci. 11, 1144992. doi:10.3389/feart.2023.1144992
Xu, Q. (2020). Understanding and consideration of related issues in early identification of potential Geohazards. Geomatics Inf. Sci. Wuhan Univ. 45 (11), 1651–1659 [in Chinese with English abstract]. doi:10.13203/j.whugis20200043
Yang, W., Wang, F., Tie, Y., Wang, D., and Ouyang, C. (2021). Characteristics and dynamic process modeling of the rainfall-induced landslide on August 21, 2020 in hanyuan county, China. Front. Earth Sci. 9, 720872. doi:10.3389/feart.2021.720872
Zhang, Y., Guo, C., Lan, H., Zhou, N., and Yao, X. (2015). Reactivation mechanism of ancient giant landslides in the tectonically active zone: a case study in southwest China. Environ. Earth Sci. 74 (2), 1719–1729. doi:10.1007/s12665-015-4180-6
Keywords: OBIA method, multi-scale segmentation, feature optimization, ancient landslide, remote sensing identification model
Citation: Liu X, Zhang Y, Ren S, Tong L and Guo Z (2023) A comprehensive remote sensing identification model for ancient landslides in the Dadu river basin on the eastern margin of tibet plateau. Front. Earth Sci. 11:1268826. doi: 10.3389/feart.2023.1268826
Received: 28 July 2023; Accepted: 21 September 2023;
Published: 16 October 2023.
Edited by:
Tao Liu, University of Arizona, United StatesReviewed by:
Chaoying Zhao, Chang’an University, ChinaLorenzo Borselli, Universidad Autonoma de San Luis Potosi, Mexico
Copyright © 2023 Liu, Zhang, Ren, Tong and Guo. This is an open-access article distributed under the terms of the Creative Commons Attribution License (CC BY). The use, distribution or reproduction in other forums is permitted, provided the original author(s) and the copyright owner(s) are credited and that the original publication in this journal is cited, in accordance with accepted academic practice. No use, distribution or reproduction is permitted which does not comply with these terms.
*Correspondence: Yongshuang Zhang, emh5czEwMEBjdWdiLmVkdS5jbg==