 Xuan-Hien Le
 Song Eu
 Chanul Choi1
 Minho Yeon
 Giha Lee
- 1Department of Advanced Science and Technology Convergence, Kyungpook National University, Sangju, Republic of Korea
- 2Faculty of Water Resources Engineering, Thuyloi University, Hanoi, Vietnam
- 3Department of Forest Environment and Conservation, National Institute of Forest Science, Seoul, Republic of Korea
Landslides are a major natural hazard that can significantly damage infrastructure and cause loss of life. In South Korea, the current landslide susceptibility mapping (LSM) approach is mainly based on statistical techniques (logistic regression (LR) analysis). According to previous studies, this method has achieved an accuracy of approximately 75.2%. In this paper, we expand upon this traditional approach by comparing the performance of six machine learning (ML) algorithms for LSM in Inje County, South Korea. The study employed a combination of geographical data gathered from 2005 to 2019 to train and evaluate six algorithms, including LR, Gaussian Naive Bayes (GNB), Support Vector Machine (SVM), K-Nearest Neighbors (KNN), Random Forest (RF), and Extreme Gradient Boosting (XGB). The effectiveness of these models was measured by various criteria, such as the percentage of correct classification (PCC) score, F1 score, and Kappa score. The results demonstrated that the PCC and F1 scores of the six models fell between [0.869–0.941] and [0.857–0.940], respectively. RF and XGB had the highest PCC and F1 scores of 0.939 and 0.941, respectively. This study indicates that ML can be a valuable technique for high-resolution LSM in South Korea instead of the current approach.
1 Introduction
Landslides are a typical natural disaster that can occur anywhere on the earth and have devastating consequences, including loss of lives and harm to society and the economy (Highland and Bobrowsky, 2008; Biswas et al., 2022). The Republic of Korea, hereafter referred to as South Korea, is particularly susceptible to landslide-induced catastrophes. In South Korea, landslides are primarily concentrated in the summer, when approximately 60% of the annual rainfall occurs due to the Asian Monsoon. Climate change has intensified this pattern, evidenced by the nearly doubled mean annual landslide-damaged area, from 276.6 ha/year in 1981–2000 to about 527.6 ha/year in 2001–2020 (Korea Forest Service, 2021). Despite the great efforts, including installing check dams to prevent fatalities and property loss since 1986, several landslide disasters have often inflicted severe damage. One of the fatal landslides in 2011 killed 43 people due to landslide-induced debris flows in Seoul and Chuncheon, with an estimated damage of 824 ha (Kim et al., 2011). Moreover, 2020 experienced a prolonged monsoon period of 54 days, the third-longest in the recorded weather history of South Korea, which resulted in 1,343 ha of damaged area and nine fatalities (Lee et al., 2021).
Identifying landslide-prone areas and implementing measures to prevent or mitigate their impacts necessitates a practical landslide susceptibility assessment (Huabin et al., 2005; Chikalamo et al., 2020). This evaluation includes an examination of numerous elements that might contribute to landslides, such as land use, rainfall, slope, rainfall, and geology (Pourghasemi et al., 2018). The involvement of fluvial processes and the hydro-geomorphic characteristics they generate is one crucial component that might contribute to the danger of landslides (Tran et al., 2022). These water-moving activities can change the terrain in ways that raise the danger of landslides. LSM is central to understanding the risk associated with landslides in various regions. By conducting an LSM, we can better understand the frequency and location of landslides and take steps to lessen the danger of these disasters (Eker et al., 2015; Maes et al., 2017).
Over the past decades, researchers have developed a myriad of techniques to gauge the potential for landslides. However, constructing an effective LSM presents several challenges, primarily related to the completeness and quality of the incoming data (Pardeshi et al., 2013; Chae et al., 2017). The effectiveness of an LSM significantly depends on the data quality it is based upon. Yet, such data might be marred by incompleteness, inaccuracies, or spatial inconsistencies, resulting in reduced map accuracy (Thirugnanam et al., 2020; Caleca et al., 2022). Historically, diverse methods ranging from geomorphological assessments to statistical models have been employed to predict landslide-prone zones (Cardinali et al., 2002). While pivotal, these methods have challenges, ranging from extensive ground truthing to dependency on consistent spatial data (Lombardo et al., 2020; Shano et al., 2020). Due to their inherently dynamic nature, landslide-causing conditions can differ dramatically across temporal and spatial scales, making it arduous to pinpoint the likelihood of landslides in a given location (Atkinson and Massari, 2011). There may also be a lack of resources and technology available to monitor areas continuously for potential landslides, particularly in remote or inaccessible regions (Zêzere et al., 2017; Piciullo et al., 2018). This can make identifying the circumstances that could lead to a landslide on time challenging. Furthermore, the traditional statistical models used to construct LSMs are based on statistical relationships and assumptions that may not always hold in reality, resulting in uncertainty in the predictions made by the model (Lee and Min, 2001; Huang et al., 2020).
LSM utilizes a variety of strategies, such as statistical methods and ML algorithms, to predict potential landslide zones (Stanley et al., 2021; Rahman et al., 2022). One such statistical technique is LR analysis, which assesses the association between a dependent variable (e.g., occurrence or absence of landslides) and several independent elements (e.g., land use, slope, and geology) (Lee, 2005; Woo et al., 2014). This technique is attractive due to its ability to handle multiple independent variables and its probabilistic outcome, offering a likelihood of occurrence for landslides in specific areas (Reichenbach et al., 2018). Another frequently applied statistical method in LSM is bivariate statistical analysis (Mersha and Meten, 2020). Bivariate analysis examines the relationship between two variables—landslides and slope inclination—to uncover patterns and trends. This analysis’s simplicity and ability to identify statistically significant associations between landslide occurrence and influencing factors make it a valuable tool in LSM (Yalcin, 2008; Hong et al., 2019). These statistical techniques have garnered popularity due to their simplicity and capability to handle multiple variables, as they often operate under assumptions of linearity and independence among predictors. Such assumptions can restrict their predictive power in complex natural terrains (Yalcin et al., 2011).
Recently, ML techniques have emerged as powerful tools in LSM due to their ability to analyze large volumes of data, identify hidden patterns and relationships that may not be evident to human analysts (Lv et al., 2022; Wang et al., 2023). Common models employed for LSM include decision trees (DTs), RF, SVM, and neural networks (Azarafza et al., 2021; Wang et al., 2021). DTs are a form of ML technique that includes building a tree-like model of decisions based on various variables or attributes. This model is designed to forecast the chance of landslides occurring across multiple territory regions (Kadavi et al., 2019). RFs include ensembling a group of DTs and utilizing their aggregate forecasts to produce more accurate predictions about the risk of landslides happening (Dou et al., 2019; Sahin et al., 2020). SVMs estimate the likelihood of landslides occurring in various parts of the region by locating the hyperplane in a high-dimensional space that maximum separates distinct classes (Pham et al., 2016; Ye et al., 2023). These ML algorithms can be beneficial for detecting locations at high risk of landslides and developing strategies to mitigate this risk (Youssef and Pourghasemi, 2021). Despite its efficacy, each algorithm presents its strengths and challenges. The success of these algorithms largely depends on the nature of the data and the research context (Merghadi et al., 2020; Ado et al., 2022). Therefore, it is essential to compare the performance of several ML algorithms to identify the most effective approach for a given study area.
In South Korea, LSM relies on the statistical technique of LR analysis, which has an accuracy rate of approximately 75.2% (Lee et al., 2015). Although LR has been helpful, it has certain limitations, mainly when modeling non-linear interactions. This has motivated the exploration of alternative ML techniques, each presenting unique strengths: GNB’s probabilistic approach, KNN’s adaptability to non-linear data boundaries, SVM’s prowess in high-dimensional spaces, and the ensemble capabilities of RF and XGB that efficiently capture complex data relationships. However, comprehensive comparative studies on these ML algorithms, especially in the South Korean setting, are limited due to past restrictions in accessing high-resolution data.
This study aims to fill this gap by investigating the performance of 6 ML algorithms for high-resolution LSM in Inje County, Gangwon, South Korea, an area characterized by steep terrain and a high frequency of landslides (Lee et al., 2016). The novelty of this study lies in its comprehensive comparison of the performance of 6 ML algorithms, providing a more extensive analysis than previous research in the South Korean context. This study also leverages high-resolution data to provide a detailed evaluation of each algorithm’s performance, addressing previous limitations in data availability.
This article discusses the following important research questions: 1) What is the overall accuracy of the ML algorithms for predicting landslide susceptibility? 2) How do the ML algorithms perform for specific assessment criteria like recall, precision, and F1 score? 3) How do the ML algorithms perform across different landslide susceptibility classes? 4) How does the effectiveness of the ML algorithms compare to that of other methods, such as the traditional statistic method? 5) What are the critical factors influencing the performance of the ML techniques in the research area?
By identifying the most effective ML algorithms for LSM in South Korea, this study aims to contribute to developing more accurate and reliable landslide risk assessment models. These can underpin informed decision-making in disaster management, ultimately mitigating the impacts of landslide disasters. The remainder of the article is structured as follows: The Material and Methods section presents the data sources, the selection and implementation of the ML algorithms, and the evaluation of algorithm performance. The Results section describes the research results, and the Discussion section discusses the implications of the findings. The Conclusion section summarizes the key findings and provides recommendations for further study. The schematic diagram of this study is illustrated in Figure 1.
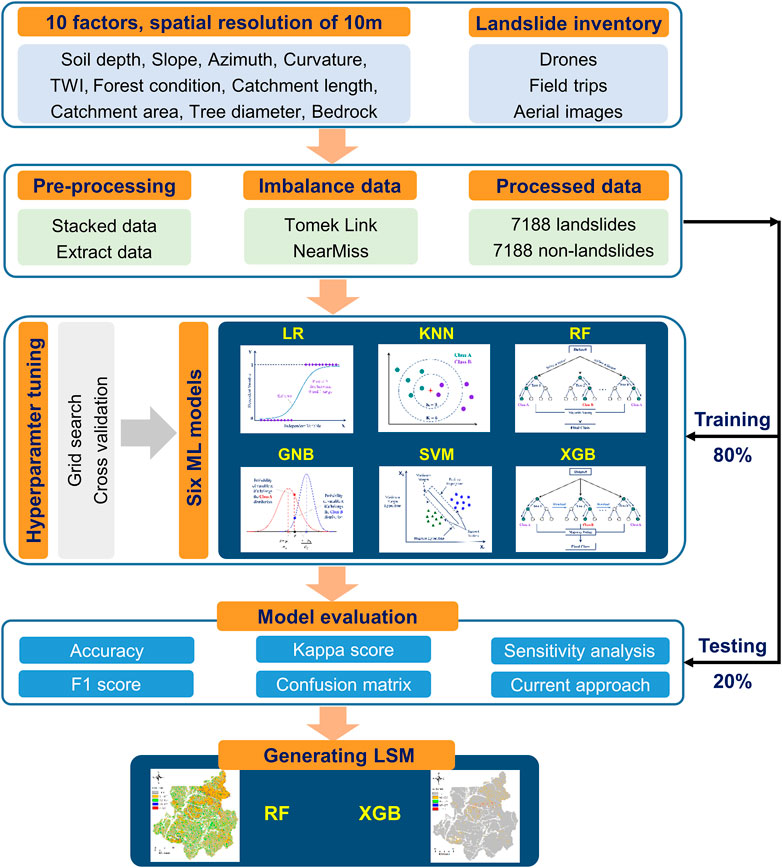
FIGURE 1. Flowchart of this study.
2 Materials and methods
2.1 Study area
Landslides are ground movements caused by the movement of slope-forming elements comprising rock, soil, vegetation, and water downward and outward. These movements can range from slow creep to rapid and destructive slides, often activated by factors like precipitation, geological attributes, human activity, or a combination of these triggers.
This investigation is centered in Inje County, Gangwon Province, South Korea. Situated in the eastern segment of the Korean Peninsula, Inje County is distinctly characterized by its steep terrains, predisposing it to a heightened risk of landslides (Yoo et al., 2009). These geophysical phenomena not only carry the potential to damage infrastructure severely but also to impede transportation networks and critically impact local community livelihoods (Kadavi et al., 2019). Recently, Inje County has witnessed an uptick in the frequency and magnitude of landslide events, a pattern emerging from an intricate interplay of natural and anthropogenic influences. Intense meteorological events like heavy monsoons and shifts in land use patterns have amplified these landslide occurrences (Lee et al., 2015). Notably, the county is especially susceptible to landslides triggered by heavy rainfall events, typical during the monsoon phase (Lee et al., 2015). Figure 2 presents the study area.
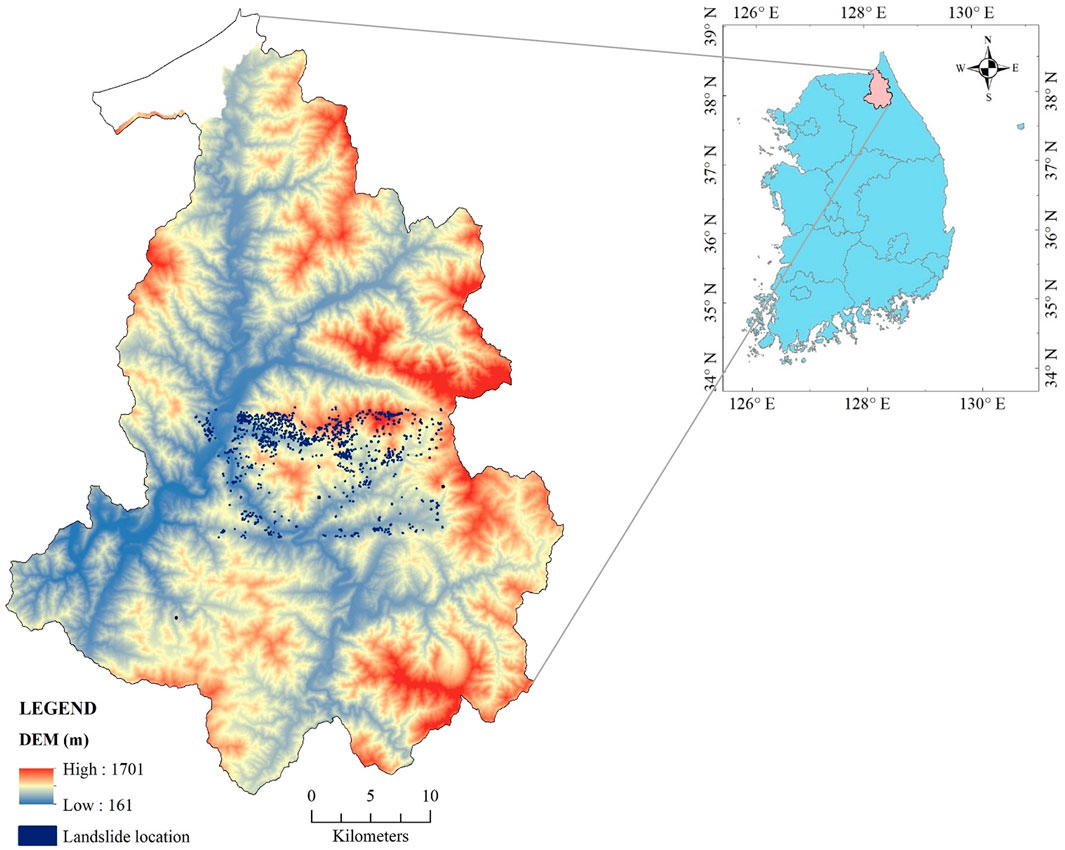
FIGURE 2. Location of the studied region.
For LSM, the input data quality and the selection of the appropriate modeling approach are among the components that have the most significant impact on the accuracy of the map (Yalcin, 2008). Because landslides are the slope’s movement or the slope’s instability and their control parameters, the fundamental causes of landslides are typically connected to geology, hydrology, morphology, and anthropogenic activities (Ayalew and Yamagishi, 2005). As a result, it is crucial to identify the causative conditions for landslides in prone areas. Despite this, there is no universally accepted technique or approach for identifying effectiveness variables in LSM (Pourghasemi et al., 2018), and identifying these elements differs from one research to the next.
For this study, guided by recommendations from the National Institute of Forest Science, South Korea, we gathered data spanning ten distinct types selected as input attributes for the modeling process. These data sources included soil depth (SD), tree diameter (TD), forest condition (FC), bedrock (BR), curvature (CU), azimuth (AZ), topographic wetness index (TWI), catchment length (CL), catchment area (CA), and slope (SL). All variables have been compiled into a high-resolution raster grid format corresponding to a grid cell size of 10 m × 10 m. In addition, information on past landslide occurrences was also collected from the Korean Meteorological Administration database. All data were processed and analyzed using geographic information systems software. Figure 3 depicts a map of several conditions contributing to landslide occurrence in the region.
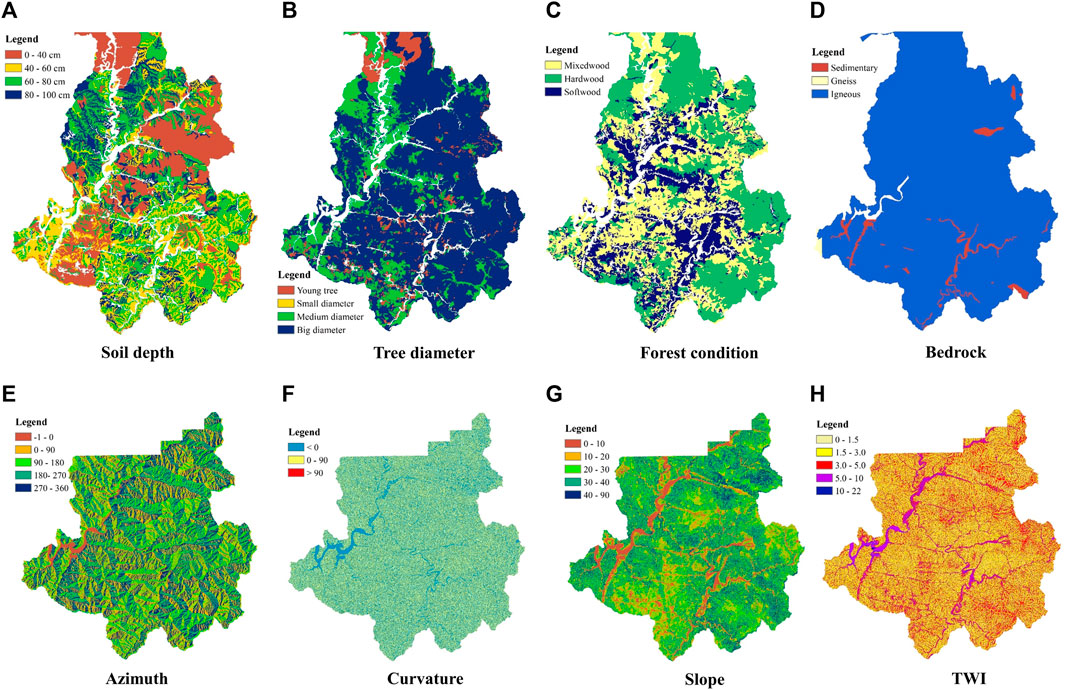
FIGURE 3. Several factor maps cause landslides.
2.2 Data pre-processing
As previously highlighted, the ten factors collected in this research are rasterized with an impressive 10 m resolution. In addition to these datasets, we collected and processed data on landslide inventory for 2005–2019. It can be said that this is the most important dataset for studies on building LSM based on ML algorithms. This entire dataset was measured and analyzed by surveys at locations immediately after a landslide from aerial images, drones, and field trips. The pre-processing of this dataset for the ML models is marked by several integral phases. The landslide inventory dataset is first rasterized to match the grid cell size of the ten factors mentioned in this study, which is 10 m×10 m. This high resolution indicates that a single landslide event can be identified across multiple neighboring cells and the number of landslide-affected cells depending on the scale and size of the respective landslide event. Following rasterization, cell locations affected by landslides are carefully identified, inventoried, and labeled. Ten different data types are then stacked on the digitized landslide data. Once layered, data from all the superimposed layers is extracted for each grid cell. Based on their data attributes, these cells are systematically classified as landslides or non-landslides.
After processing and analyzing the data, it was found that approximately 7,188 grid cells recorded landslides, significantly lower than the number of grid cells that did not. The imbalance between these data classes is a typical problem in practice and can result in biased algorithms that perform poorly on the minority class (Fernández et al., 2018). This occurs because ML models may learn to classify the majority class correctly while ignoring or incorrectly classifying the minority class (Ma and He, 2013). To solve this problem and boost the effectiveness of the ML models, this study applied several solutions, such as the Tomek Links technique and the Near Miss algorithm, to resample the data. The following subsections go into further depth about these approaches. After processing, the final dataset had 14,376 samples, comprising 7,188 landslide samples and 7,188 non-landslide samples.
2.2.1 Tomek Links technique
The Tomek Links technique is a data pre-processing technique frequently utilized to improve the efficiency of ML algorithms. It is based on the idea that a pair of samples near one other and belonging to distinct classes are termed Tomek Links (Tomek, 1976). This technique removes samples from the majority class for each pairing while expanding the gap between the two categories. This can be useful as noise and outliers often negatively affect the model’s accuracy and reliability. This approach could be applied to any ML issue, including classification, regression, and clustering. Figure 4 depicts the resampling procedure of the Tomek Links techniques.
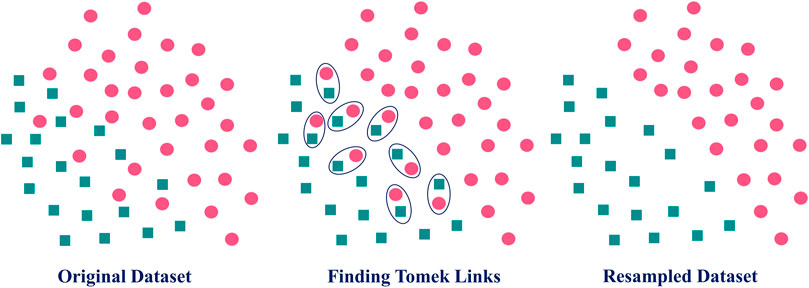
FIGURE 4. Illustration of Tomek Links technique.
2.2.2 NearMiss algorithm
The NearMiss algorithm is commonly employed to boost the effectiveness of ML algorithms, especially for imbalanced datasets. An imbalanced dataset is one in which the number of samples in one category differs considerably from the number of samples in the other. This frequently results in poor performance of ML algorithms, as the minority class is often underrepresented and may not be adequately learned by the model.
The NearMiss algorithm tackles this issue by selecting a subset of samples from the majority group that is similar to samples from the minority group based on a distance measure like Euclidean distance (Zhang and Mani, 2003). The NearMiss algorithm has three variants: NearMiss1, NearMiss2, and NearMiss3. NearMiss1 chooses samples from the majority group nearest to the minority group. NearMiss-2 and NearMiss-3 select samples from the majority group that are furthest from the majority group and closest to the minority group, respectively. Figure 5 depicts the resampling procedure of the Near Miss algorithms.
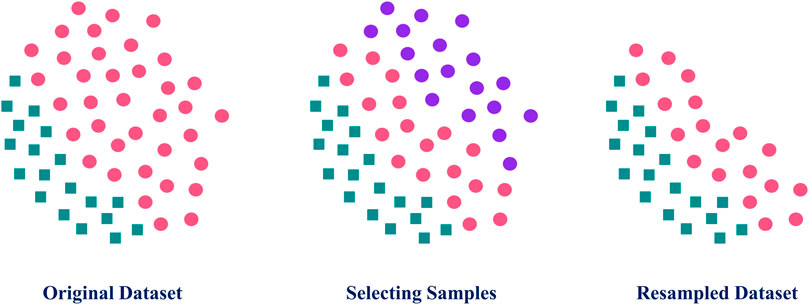
FIGURE 5. Illustration of NearMiss algorithm.
2.3 ML algorithms
This study used 6 ML algorithms to classify areas as prone to landslides or not prone to landslides based on a set of input features. Each algorithm has its assumptions, strengths, and limits, and we chose various algorithms to provide robust and reliable results. In addition, the cross-validation technique was utilized to analyze the performance of each algorithm and select the best-performing algorithm based on a range of evaluation criteria, for instance, PCC, recall, precision, and F1 score. Before using ML algorithms to LSM, it is necessary first to gather a collection of labeled data, in which both the input characteristics and the landslide susceptibility (either “1″or “0″) are already established. ML models are then trained using the aforementioned labeled data via appropriate optimization algorithms.
2.3.1 LR
LR is a simple and popular classification method using linear regression and the logistic function as its primary building blocks (Cramer, 2002). In the context of LSM, LR is utilized to classify areas as either prone or not prone to landslides based on a collection of input features that are known to be associated with landslides. These elements may include geological and topographic characteristics, land use, land cover, and environmental factors like precipitation and slope angle. The LR objective is to find the line that best matches the data points and demarcates the two distinct groups of “landslide” and “non-landslide”. The output is a probability that ranges between 0 and 1, which is utilized to categorize the data into one of the two options. For instance, if the likelihood is higher than 0.5, the data is classified as potentially affected by landslides. Still, if the probability is lower than 0.5, the data is categorized as not having the potential to be affected by landslides. Figure 6A briefly illustrates the LR algorithm. The probability of the event occurring is expressed as:
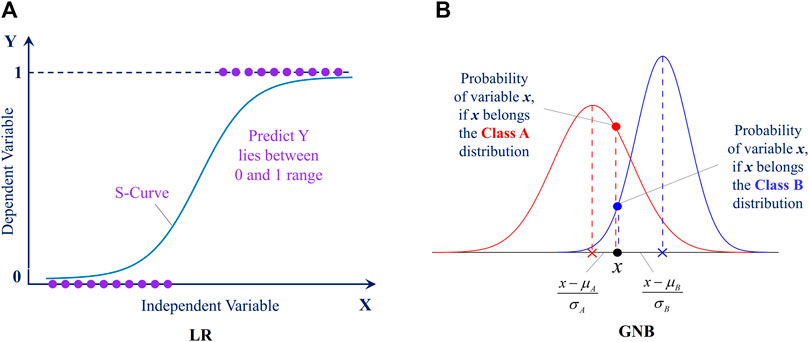
FIGURE 6. Illustration for (A) LR algorithm and (B) GNB algorithm.
Where β0, β1,… are the coefficients and x1, x2,… are the predictor variables
2.3.2 GNB
GNB classification algorithm is based on Bayesian probability theory and follows a Gaussian normal distribution, making it suitable for continuous data classification tasks. It is a straightforward and commonly adopted approach, mainly when the dataset is large. The method assumes that the input characteristics are independent of one other, called the “naive” assumption. This indicates that the probability of each factor is computed independently without considering the probabilities of the other characteristics. Through the use of the maximum likelihood estimate, it is possible to learn the possibility of the input characteristics given the various classes. The output is the likelihood that the data belong to each category, and the prediction is taken from the type with the highest probability. GNB can be sensitive to the assumptions of independence and normalcy of the features, even though it is a straightforward and efficient classification method that performs well on a wide range of datasets. Figure 6B briefly illustrates the GNB algorithm. Given a feature vector
2.3.3 KNN
KNN is an ML algorithm used for classification tasks. The core of this technique is rooted in the principle of instance-based learning, wherein the categorization of a new data point is established based on its similarity to prior data points within the training dataset (Cover and Hart, 1967). The technique uses a distance metric, for instance, Euclidean or Manhattan distance, to estimate the distance from the new data point to all points. The K closest points to the latest data are then selected, where K is a value determined by the user. The new data point is assigned to the category with the highest frequency among the K nearest points. KNN is a prevalent choice for classification jobs because of its simplicity and performance on various input formats. Figure 7A briefly illustrates the KNN algorithm. The distance between two points x and y in the Euclidean space is:
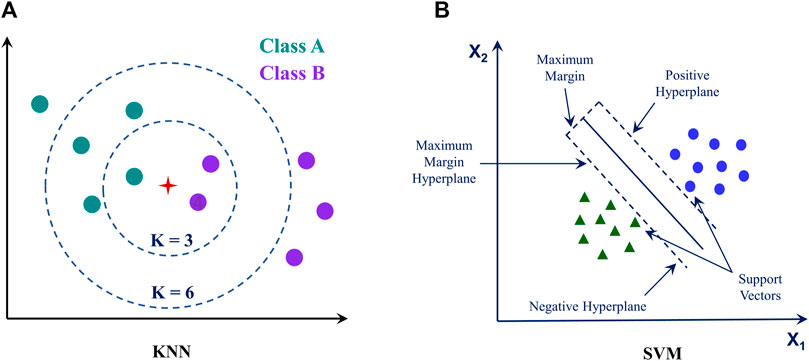
FIGURE 7. Illustration for (A) KNN algorithm and (B) SVM algorithm.
2.3.4 SVM
SVM is a powerful and versatile classification algorithm that works by finding the hyperplane that maximally separates various classes in the feature space (Cortes and Vapnik, 1995). The fundamental of SVM is finding a decision margin that maximally divides the data points into multiple classifications. A set of support vectors defines the decision boundary, the data points in the training dataset nearest to the hyperplane. The relative position of the support vectors determines the hyperplane position. The SVM output is a score that indicates the likelihood of the data belonging to one class or the other. SVM is a powerful and effective classification technique suited for a wide range of datasets, although it can be computationally expensive when the training set is large. Figure 7B briefly illustrates the SVM algorithm. The decision function is:
Where ω is the normal vector to the hyperplane and b is the offset.
2.3.5 RF
RF is a classification algorithm incorporating numerous DT predictions to make more accurate and robust predictions (Tin Kam, 1998; Breiman, 2001). A DT is a tree-shaped model in which each node represents an individual characteristic, each branch a particular choice, and each leaf node a distinct category or value. RF generates a collection of DT by bootstrapping a sample of the data and randomly picking a sample of the input data for every split. This means that each DT is constructed by drawing from a distinct sample of the data and a unique subset of the input variables. In classification tasks, RF determines the final classification by taking the unweighted average of the predictions made by individual DTs and selecting the most commonly predicted category. RF is a robust and efficient method resistant to overfitting and can be used on various datasets. Figure 8A briefly illustrates the RF algorithm. The classification decision is made by majority voting:
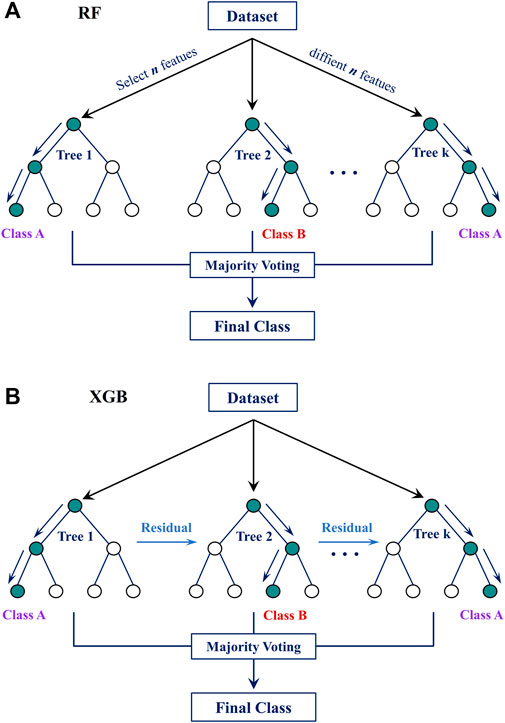
FIGURE 8. Illustration for (A) RF algorithm and (B) XGB algorithm.
Where YTi is the prediction of the ith tree.
2.3.6 XGB
XGB is a well-known gradient-boosting technique that may be applied to classification and regression applications (Chen and Guestrin, 2016). It is based on DT and is meant to form an ensemble of DTs to make predictions based on data that has not been seen before. An optimization approach that minimizes the loss function generates a set of decision trees in XGB. This means the DTs are formed to reduce the gap between the observed and estimated values. XGB is a robust and efficient technique for classification and regression work. It is a popular algorithm because of its strong performance on a diverse range of data formats and its capacity to deal with categorical and numerical characteristics. Figure 8B briefly illustrates the XGB algorithm. Given a differentiable loss function L(y, F(x)), where y is the actual value and F(x) is the prediction, the prediction model is updated iteratively:
Where fi(x) is the prediction of the ith base leaner (typically a DT), and η is the learning rate.
2.4 Hyperparameter tuning and model validation
This study employed the grid search strategy for hyperparameter tuning, a widely used approach that can effectively enhance the accuracy and reliability of the resulting LSMs. As its applicability to small to medium-sized datasets, this method trains and evaluates an ML algorithm for each set of hyperparameters defined within a specified grid. For each model, the Python scikit-learn library facilitates the implementation of the grid search method.
The final processed dataset for this study contained 14,376 samples, with a balanced distribution of landslide and non-landslide instances (7,188 each). By maintaining a balanced dataset, potential model bias is mitigated, and the generalizability of prediction tasks is improved. The dataset is separated into training and testing subsets, representing 80% and 20% of the total dataset. Thus, the training set includes 11,500 samples (5,750 landslides and 5,750 non-landslides), while the testing set consists of 2,876 samples (1,438 landslides and 1,438 non-landslides). A 5-fold cross-validation is performed throughout the grid search procedure to fine-tune the models. This ensures that the findings are not overly optimistic and can be generalized to unseen data. The selected parameters for each ML model used in the grid search are detailed in Table 1.
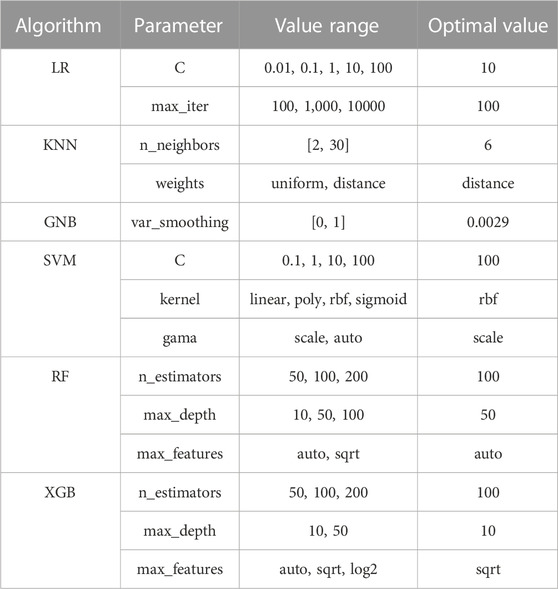
TABLE 1. Parameter settings of each ML model used in the grid search.
2.5 Performance measures
Assessing algorithm performance is a crucial stage in using ML algorithms for LSM. It helps to identify the most accurate and reliable algorithm for a given study and can provide valuable insights into the strengths and limitations of the algorithms. This study used various evaluation criteria, including PCC, precision, recall, and F1 score. PCC measures how well the model correctly classifies the data, whereas recall estimates the proportion of true positive (TP) predictions over total observed positive events. Precision measures how well the model avoids false positives (FP), and the F1 score is the harmonic average of precision and recall. We estimated these evaluation metrics using a confusion matrix, which compares each case’s predicted and actual values. A confusion matrix comprises four main components: TP, FP, true negatives (TN), and false negatives (FN). In this case, TP and RN stand for the number of samples rightly categorized as positive and negative. In contrast, FP and FN refer to the number of samples wrongly classified as positive and negative. The following is a description of these criteria.
Where PCC means the percentage of correct classification (or accuracy), PV implies the probability of random agreement, and KC represents the Kappa coefficient.
3 Results
3.1 Comparison of six ML algorithms
To compare the performance of 6 ML algorithms for LSM in Inje County, South Korea, we use several evaluation metrics, including PCC, F1 score, and KC. The results of these evaluations are presented in Table 2 and Figures 9, 10 below.
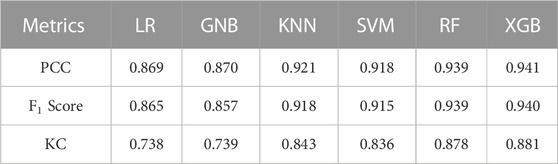
TABLE 2. Performance statistics of six models.
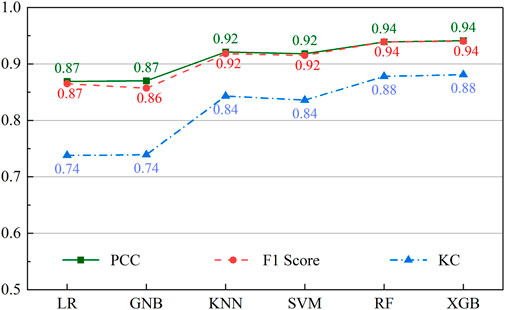
FIGURE 9. Performance of six algorithms in terms of classification.
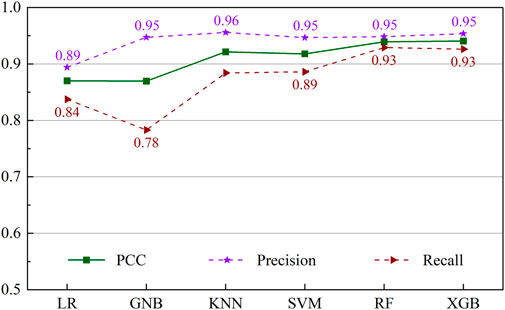
FIGURE 10. Classification performance of six models in terms of landslide class.
All algorithms generally have relatively high PCC, F1 score, and KC values, indicating that they all perform well overall. However, the performance of the various models differs slightly. RF and XGB algorithms had the highest PCC values, with 0.939 and 0.941, respectively. These models can correctly classify landslide-prone areas with a high percentage, indicating that they can detect zones with an increased susceptibility to landslides. Regarding the F1 score metric, these models can balance the precision and recall well, as the corresponding values for RF and XGB were 0.939 and 0.940, respectively. This is important as it will reduce the number of FNs and FPs. The KC metric also revealed a strong agreement between the predictions of these models and actual observations, and the models are not just labeling all areas as landslide-prone. The best values for this metric were 0.878 and 0.881, belonging to RF and XGB algorithms.
In contrast, the PCC and F1 score values of the LR and GNB were lower than those of the other algorithms (0.869 and 0.87, respectively), and their KC values were also lower (0.738 and 0.739, respectively), which indicated that they might not perform as well as the other models. This might be because these models are simple, and they may be incapable of capturing the complex relationships between the input variables and the landslide sensitivity, as well as other models such as RF or XGB. It is worth noting that the KNN and SVM algorithms also performed pretty well, with PCC, F1 score, and KC values of 0.921, 0.918, and 0.843 for the KNN, and 0.918, 0.915, and 0.836 for the SVM, respectively. These models were capable of recognizing regions with a high risk of landslides. However, they are not as good as RF and XGB regarding balancing the precision, recall, and agreement between the model predictions and the observations.
Figure 10 illustrates the classification performance for the landslide class of the ML models corresponding to the PCC, precision, and recall criteria. Similar to the previous evaluation, the LR and GNB models had lower accuracy and recall values, with the earlier having scores of 0.894 and 0.947, while the latter had numbers of 0.837 and 0.783, respectively. The KNN and SVM algorithms depicted a similar pattern, with precision and recall scores of 0.956 and 0.884 for KNN and corresponding numbers for SVM of 0.947 and 0.886, respectively. XGB had the highest precision value of 0.953 compared to other models, indicating its proficiency in identifying TPs and having a low FP rate. On the other hand, RF had the highest recall value of 0.929, demonstrating its ability to identify TP and low FN rates.
3.2 Robustness and sensitivity analysis
To offer a more thorough assessment of the robustness of RF and XGB models, an analysis of the confusion matrix and feature importance was performed and shown in Figure 11, Figure 12.
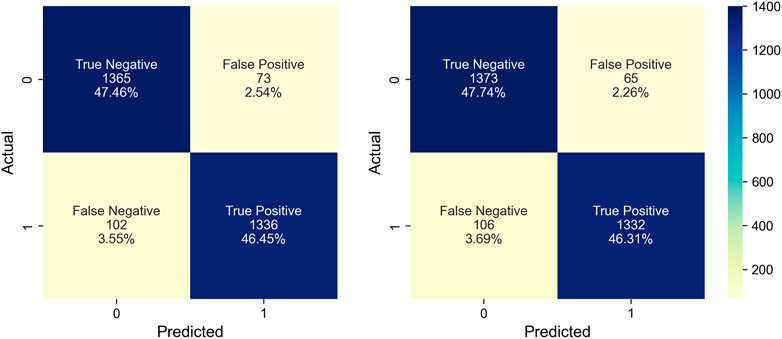
FIGURE 11. Confusion matrix for RF and XGB.
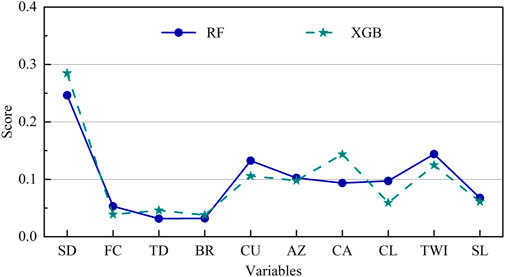
FIGURE 12. Variable importance of RF and XGB.
Figure 11 illustrates the confusion matrix details for both models. Out of 2,876 samples, the RF model yielded 1,365 TNs, 1,336 TPs, 73 FPs, and 102 FNs. In contrast, the XGB model resulted in 1,373 TNs, 1,332 TPs, 65 FPs, and 106 FNs. Regarding PCC, both the RF and XGB exhibited remarkable performance, registering classification accuracies of 93.9% and 94.1%, respectively. The precision and recall metrics underscore their efficacy, with RF showing 94.8% and 92.9%, respectively, whereas XGB showcased 95.3% and 92.6%.
Feature importance is a metric of how much each factor contributes to the predictions made by the model. According to the data presented in Figure 12, the variable considered to be of the utmost significance in both the RF and the XGB models was SD (soil depth), which had a value of 0.246 and 0.285, respectively. This means that soil depth was the most influencing variable when determining landslide susceptibility in the research region. The second most significant variable in the RF algorithm was CU, with a value of 0.133, followed by TWI, with 0.144. In the case of the XGB model, the CA variable was the second most important variable, followed by the TWI variable, which had values of 0.144 and 0.125. BR was the component with the lowest importance score in both models, with a value of 0.032 in RF and 0.038 in XGB models.
3.3 LSM of Inje area
The LSM generated by the RF and XGB algorithms were displayed in Figure 13, Figure 14, respectively. These maps were based on the likelihood of landslides occurring for each grid cell, which ranges from 0 to 1. As seen in these Figures, the LSM is segmented into five levels following the categorization used by the National Institute of Forest Science in South Korea. Among them, level 4, with a range of probability [0.5–0.7], and level 5, with a range of probability [0.7–1.0], are considered the most dangerous warning levels. The visualized results of the two algorithms revealed a slight difference in the landslide probability estimation for grid cells. This distinction was particularly noticeable when comparing level 1 (0–0.1) and level 3. In contrast, there was not much difference between the other levels, notably levels 4 and 5, each with a significant possibility of landslides.
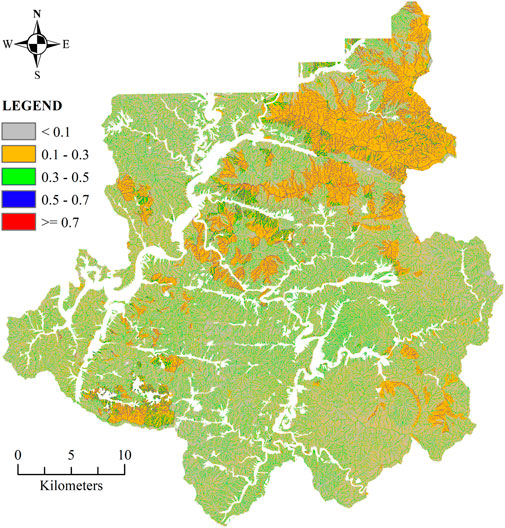
FIGURE 13. LSM using RF algorithm.
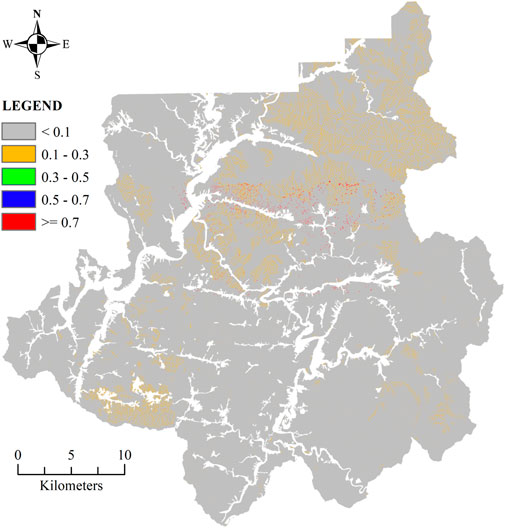
FIGURE 14. LSM using XGB algorithm.
3.4 Current approach for LSM in South Korea
The current approach for LSM in South Korea focuses primarily on using statistical techniques, particularly logistic regression analysis, to identify the association between input factors (Woo et al., 2014). The following equations are used to calculate the probability of a landslide hazard at a specific site. The LSM for the Inje area was developed from these equations, as shown in Figure 15.
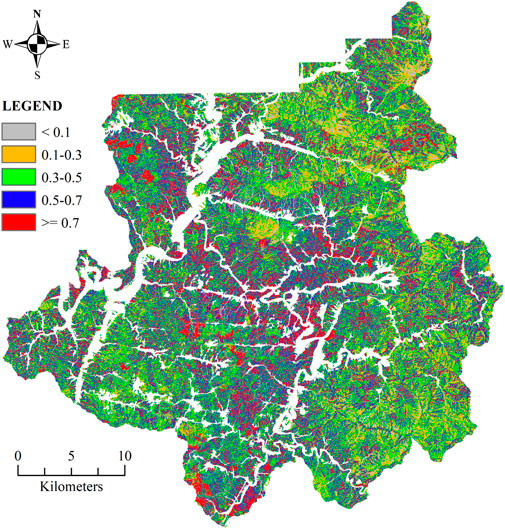
FIGURE 15. LSM using LR analysis.
According to Lee et al. (2015), this methodology achieved an average accuracy of approximately 75.2%. When comparing this method to the ML approach presented in Section 3.1, the accuracy of ML models was about 92% on average, which was a significant improvement over the process that is currently being used. The PCC and F1 scores of the 6 ML models range from 0.869 to 0.941 and 0.857 to 0.940, respectively. Among the six algorithms, RF and XGB performed best, with accuracy and F1 values of [0.939–0.941]. The results of this study indicated that using ML algorithms for LSM can lead to more accurate and higher-resolution LSMs. It is essential to point out that one of the benefits of adopting an ML technique is that it is capable of handling complicated interactions between input variables and landslide susceptibility. These types of relationships may be difficult to capture using statistical methods. Additionally, the use of ML algorithms provides a valuable alternative to the current statistical approach in South Korea.
4 Discussion
The ability of ML algorithms to enhance LSM in contexts such as Inje County, South Korea, has been substantiated in this study. The RF and XGB models performed particularly well in correctly identifying landslide-prone areas, while KNN and SVM performed well. Nonetheless, algorithm selection for such applications should be based on performance metrics and factors like ease of implementation, model interpretability, and inherent limitations (Zhou et al., 2021; Liu et al., 2023).
The poorer performance exhibited by LR and GNB resonates with prior literature on their inherent limitations. For instance, LR assumes a linear relation between predictor and response variables, which often is not true in complex natural phenomena like landslides (Pham et al., 2016). Additionally, its sensitivity to outliers and imbalanced datasets hampers its ability to capture intricate non-linear associations (Akinci and Zeybek, 2021). Similarly, while GNB’s simplicity and computational efficiency are well acknowledged, its assumption of input independence often leads to its suboptimal performance, consistent with our findings and those of Azarafza et al. (2021).
The comparable performance of KNN and SVM echoes prior works. KNN, though simple in its construct and devoid of data distribution assumptions, suffers when processing power is limited, given its requirement to compute distances between every training and new data point. The sensitivity of KNN to the choice of ‘K' has been reported by studies such as Sameen et al. (2020). SVM’s strength lies in its ability to grapple with high-dimensional data and intricate non-linear predictor-response relationships (Yao et al., 2008). However, SVM’s sensitivity to kernel function choices and the regularization value, as corroborated in our study, is a limitation noted by Huang and Zhao (2018).
According to the findings of this research, the 2 ML algorithms most useful for LSM are RF and XGB. Both algorithms have the advantage of being capable of handling high-dimensional data and non-linear correlations between input characteristics and output. RF’s resilience to data noise and outliers has been highlighted by Dou et al. (2019), whereas XGB’s speed and robustness to missing data are mentioned in Biswas et al. (2022). However, the potential computational intensiveness of RF and the sometimes opaque results of XGB, as observed in our study, are consistent with the findings of Merghadi et al. (2020). Despite these limitations, both these models hold promise for LSM, and the choice between them should be reasonable, considering data characteristics and the study’s objectives.
Adopting the ML-based approach for LSM holds substantial practical implications for regions like South Korea. Enhanced predictive accuracy not only aids in more effective resource allocation for disaster prevention but also offers a robust foundation for policymaking at both local and national scales. Proactively identifying high-risk zones, authorities can prioritize infrastructure development, design better evacuation strategies, and optimize disaster response protocols. This research thus paves the way for an integrated, data-driven approach to landslide management, potentially safeguarding communities and infrastructures against the devastating impacts of unforeseen landslides.
Despite the promising outcomes of this research, it is crucial to recognize its limitations. Data availability restricted our study to a specific timeframe and region, potentially affecting broader generalizations. Moreover, while the chosen ML algorithms offer advanced predictions, their complexity could pose challenges in real-time applications or when adapting to other regions with distinct geological characteristics. Future research could explore integrating diverse datasets for better model training and investigating simpler yet efficient algorithms. Additionally, cross-regional studies would be invaluable in assessing the universal applicability of the ML-based LSM approach.
5 Conclusion
The application of 6 ML algorithms for LSM in Inje County, South Korea, has revealed distinct efficiencies among the algorithms. RF and XG perform particularly well in accurately classifying landslide-prone areas, balancing precision and recall, and having PCC values up to about 94%. The KNN and SVM models with a PCC score of roughly 92% also performed well in correctly classifying landslide-prone areas. The two models, LR and GNB, have the lowest efficiency, corresponding to a PCC value of only about 87%. Despite this, the results demonstrate that the ML approach is superior to the existing statistical approach with logistic regression, which has an accuracy of about 75.2%.
This study provides a valuable starting point for further research into using ML techniques for LSM in South Korea and other regions. The RF and XGB models are highly recommended for LSM usage in South Korea. However, it is essential to consider the trade-offs between the performance and simplicity of implementation and interoperability. The efficiency of algorithms differs from location to region for various reasons, including geomorphology, land uses, and other factors.
The broader implications of this finding can potentially reshape disaster management policies in South Korea. A shift from traditional models to ML-based LSMs can facilitate more accurate predictions, allowing authorities to pre-emptively address and mitigate landslide risks in vulnerable zones. This study will substantially impact the understanding of landslide risk in Inje County. It will be valuable in developing effective mitigation techniques for landslides in the place.
Data availability statement
The raw data supporting the conclusion of this article will be made available by the authors, without undue reservation.
Author contributions
X-HL: Formal Analysis, Visualization, Writing–original draft. SE: Formal Analysis, Investigation, Writing–review and editing. CC: Data curation, Investigation, Visualization, Writing–original draft. DN: Methodology, Writing–review and editing. MY: Data curation, Investigation, Writing–review and editing. GL: Supervision, Writing–review and editing.
Funding
The author(s) declare financial support was received for the research, authorship, and/or publication of this article. This research was supported by the Disaster-Safety Platform Technology Development Program of the National Research Foundation of Korea (NRF), funded by the Ministry of Science and ICT. (No. 2022M3D7A1090338).
Conflict of interest
The authors declare that the research was conducted in the absence of any commercial or financial relationships that could be construed as a potential conflict of interest.
Publisher’s note
All claims expressed in this article are solely those of the authors and do not necessarily represent those of their affiliated organizations, or those of the publisher, the editors and the reviewers. Any product that may be evaluated in this article, or claim that may be made by its manufacturer, is not guaranteed or endorsed by the publisher.
References
Ado, M., Amitab, K., Maji, A. K., Jasińska, E., Gono, R., Leonowicz, Z., et al. (2022). Landslide susceptibility mapping using machine learning: A literature survey. Remote Sens. 14 (13), 3029. doi:10.3390/rs14133029
Akinci, H., and Zeybek, M. (2021). Comparing classical statistic and machine learning models in landslide susceptibility mapping in Ardanuc (Artvin), Turkey. Nat. Hazards 108 (2), 1515–1543. doi:10.1007/s11069-021-04743-4
Atkinson, P. M., and Massari, R. (2011). Autologistic modelling of susceptibility to landsliding in the Central Apennines, Italy. Geomorphology 130 (1), 55–64. doi:10.1016/j.geomorph.2011.02.001
Ayalew, L., and Yamagishi, H. (2005). The application of GIS-based logistic regression for landslide susceptibility mapping in the Kakuda-Yahiko Mountains, Central Japan. Geomorphology 65 (1), 15–31. doi:10.1016/j.geomorph.2004.06.010
Azarafza, M., Azarafza, M., Akgün, H., Atkinson, P. M., and Derakhshani, R. (2021). Deep learning-based landslide susceptibility mapping. Sci. Rep. 11 (1), 24112. doi:10.1038/s41598-021-03585-1
Biswas, N. K., Stanley, T. A., Kirschbaum, D. B., Amatya, P. M., Meechaiya, C., Poortinga, A., et al. (2022). A dynamic landslide hazard monitoring framework for the Lower Mekong Region. Front. Earth Sci. 10, 1057796. doi:10.3389/feart.2022.1057796
Caleca, F., Tofani, V., Segoni, S., Raspini, F., Franceschini, R., and Rosi, A. (2022). How can landslide risk maps be validated? Potential solutions with open-source databases. Front. Earth Sci. 10, 998885. doi:10.3389/feart.2022.998885
Cardinali, M., Reichenbach, P., Guzzetti, F., Ardizzone, F., Antonini, G., Galli, M., et al. (2002). A geomorphological approach to the estimation of landslide hazards and risks in Umbria, Central Italy. Nat. Hazards Earth Syst. Sci. 2 (1/2), 57–72. doi:10.5194/nhess-2-57-2002
Chae, B. G., Park, H. J., Catani, F., Simoni, A., and Berti, M. (2017). Landslide prediction, monitoring and early warning: A concise review of state-of-the-art. Geosciences J. 21 (6), 1033–1070. doi:10.1007/s12303-017-0034-4
Chen, T., and Guestrin, C. (2016). “XGBoost: A scalable tree boosting system,” in Proceedings of the 22nd ACM SIGKDD international conference on knowledge discovery and data mining (San Francisco, California, USA: Association for Computing Machinery).
Chikalamo, E. E., Mavrouli, O. C., Ettema, J., van Westen, C. J., Muntohar, A. S., and Mustofa, A. (2020). Satellite-derived rainfall thresholds for landslide early warning in Bogowonto Catchment, Central Java, Indonesia. Int. J. Appl. Earth Observation Geoinformation 89, 102093. doi:10.1016/j.jag.2020.102093
Cortes, C., and Vapnik, V. (1995). Support-vector networks. Mach. Learn. 20 (3), 273–297. doi:10.1007/BF00994018
Cover, T., and Hart, P. (1967). Nearest neighbor pattern classification. IEEE Trans. Inf. Theory 13 (1), 21–27. doi:10.1109/TIT.1967.1053964
Cramer, J. S. (2002). The origins of logistic regression. Rotterdam, Netherlands: Tinbergen Institute Working Paper No. 2002-119/4. doi:10.2139/ssrn.360300
Dou, J., Yunus, A. P., Tien Bui, D., Merghadi, A., Sahana, M., Zhu, Z., et al. (2019). Assessment of advanced random forest and decision tree algorithms for modeling rainfall-induced landslide susceptibility in the Izu-Oshima Volcanic Island, Japan. Sci. Total Environ. 662, 332–346. doi:10.1016/j.scitotenv.2019.01.221
Eker, A. M., Dikmen, M., Cambazoğlu, S., Düzgün, Ş. H. B., and Akgün, H. (2015). Evaluation and comparison of landslide susceptibility mapping methods: A case study for the ulus district, bartın, northern Turkey. Int. J. Geogr. Inf. Sci. 29 (1), 132–158. doi:10.1080/13658816.2014.953164
Fernández, A., García, S., Galar, M., Prati, R. C., Krawczyk, B., and Herrera, F. (2018). Learning from imbalanced data sets. Springer Cham. doi:10.1007/978-3-319-98074-4
Highland, L. M., and Bobrowsky, P. (2008). The landslide handbook—a guide to understanding landslides. Reston, Virginia: U.S. Geological Survey Circular.
Hong, H., Shahabi, H., Shirzadi, A., Chen, W., Chapi, K., Ahmad, B. B., et al. (2019). Landslide susceptibility assessment at the wuning area, China: A comparison between multi-criteria decision making, bivariate statistical and machine learning methods. Nat. Hazards 96 (1), 173–212. doi:10.1007/s11069-018-3536-0
Huabin, W., Gangjun, L., Weiya, X., and Gonghui, W. (2005). GIS-Based landslide hazard assessment: an overview. Prog. Phys. Geogr. Earth Environ. 29 (4), 548–567. doi:10.1191/0309133305pp462ra
Huang, F., Cao, Z., Guo, J., Jiang, S. H., Li, S., and Guo, Z. (2020). Comparisons of heuristic, general statistical and machine learning models for landslide susceptibility prediction and mapping. CATENA 191, 104580. doi:10.1016/j.catena.2020.104580
Huang, Y., and Zhao, L. (2018). Review on landslide susceptibility mapping using support vector machines. CATENA 165, 520–529. doi:10.1016/j.catena.2018.03.003
Kadavi, P. R., Lee, C. W., and Lee, S. (2019). Landslide-susceptibility mapping in Gangwon-do, South Korea, using logistic regression and decision tree models. Environ. Earth Sci. 78 (4), 116. doi:10.1007/s12665-019-8119-1
Kim, K., Koo, K., Yoon, H., Lee, C., Won, M., Woo, C., et al. (2011). Forest disasters 2011. Seoul: Korea Forest Research Institute.
Korea Forest Service (2021). Landslide information system. Available At: https://sansatai.forest.go.kr/gis/main.do (Accessed February 22, 2023).
Lee, B., An, H., Lee, C., Seo, K., Woo, C., Kwon, C., et al. (2021). Forest disaster white paper". Seoul: National Institute of Forest Science, 2020.
Lee, C., Woo, C., Kim, D., Seo, J., Kwon, H., and Yun, H. (2015a). Development of landslide disaster prevention system in urban living area. South Korea: National Institute of Forest Science.
Lee, M. J., Park, I., Won, J. S., and Lee, S. (2016). Landslide hazard mapping considering rainfall probability in Inje, Korea. Geomatics, Nat. Hazards Risk 7 (1), 424–446. doi:10.1080/19475705.2014.931307
Lee, S. (2005). Application of logistic regression model and its validation for landslide susceptibility mapping using GIS and remote sensing data. Int. J. Remote Sens. 26 (7), 1477–1491. doi:10.1080/01431160412331331012
Lee, S., and Min, K. (2001). Statistical analysis of landslide susceptibility at Yongin, Korea. Environ. Geol. 40 (9), 1095–1113. doi:10.1007/s002540100310
Lee, S., Won, J. S., Jeon, S. W., Park, I., and Lee, M. J. (2015b). Spatial landslide hazard prediction using rainfall probability and a logistic regression model. Math. Geosci. 47 (5), 565–589. doi:10.1007/s11004-014-9560-z
Liu, S., Wang, L., Zhang, W., He, Y., and Pijush, S. (2023). A comprehensive review of machine learning-based methods in landslide susceptibility mapping. Geol. J. 58 (6), 2283–2301. doi:10.1002/gj.4666
Lombardo, L., Opitz, T., Ardizzone, F., Guzzetti, F., and Huser, R. (2020). Space-time landslide predictive modelling. Earth-Science Rev. 209, 103318. doi:10.1016/j.earscirev.2020.103318
Lv, L., Chen, T., Dou, J., and Plaza, A. (2022). A hybrid ensemble-based deep-learning framework for landslide susceptibility mapping. Int. J. Appl. Earth Observation Geoinformation 108, 102713. doi:10.1016/j.jag.2022.102713
Ma, Y., and He, H. (2013). Imbalanced learning: foundations, algorithms, and applications. Wiley-IEEE Press. doi:10.1002/9781118646106
Maes, J., Kervyn, M., de Hontheim, A., Dewitte, O., Jacobs, L., Mertens, K., et al. (2017). Landslide risk reduction measures: A review of practices and challenges for the tropics. Prog. Phys. Geogr. Earth Environ. 41 (2), 191–221. doi:10.1177/0309133316689344
Merghadi, A., Yunus, A. P., Dou, J., Whiteley, J., ThaiPham, B., Bui, D. T., et al. (2020). Machine learning methods for landslide susceptibility studies: A comparative overview of algorithm performance. Earth-Science Rev. 207, 103225. doi:10.1016/j.earscirev.2020.103225
Mersha, T., and Meten, M. (2020). GIS-based landslide susceptibility mapping and assessment using bivariate statistical methods in Simada area, northwestern Ethiopia. Geoenvironmental Disasters 7 (1), 20. doi:10.1186/s40677-020-00155-x
Pardeshi, S. D., Autade, S. E., and Pardeshi, S. S. (2013). Landslide hazard assessment: recent trends and techniques. SpringerPlus 2 (1), 523. doi:10.1186/2193-1801-2-523
Pham, B. T., Pradhan, B., Tien Bui, D., Prakash, I., and Dholakia, M. B. (2016). A comparative study of different machine learning methods for landslide susceptibility assessment: A case study of uttarakhand area (India). Environ. Model. Softw. 84, 240–250. doi:10.1016/j.envsoft.2016.07.005
Piciullo, L., Calvello, M., and Cepeda, J. M. (2018). Territorial early warning systems for rainfall-induced landslides. Earth-Science Rev. 179, 228–247. doi:10.1016/j.earscirev.2018.02.013
Pourghasemi, H. R., Teimoori Yansari, Z., Panagos, P., and Pradhan, B. (2018). Analysis and evaluation of landslide susceptibility: A review on articles published during 2005–2016 (periods of 2005–2012 and 2013–2016). Arabian J. Geosciences 11 (9), 193. doi:10.1007/s12517-018-3531-5
Rahman, G., Bacha, A. S., Ul Moazzam, M. F., Rahman, A. U., Mahmood, S., Almohamad, H., et al. (2022). Assessment of landslide susceptibility, exposure, vulnerability, and risk in shahpur valley, eastern hindu kush. Front. Earth Sci. 10, 953627. doi:10.3389/feart.2022.953627
Reichenbach, P., Rossi, M., Malamud, B. D., Mihir, M., and Guzzetti, F. (2018). A review of statistically-based landslide susceptibility models. Earth-Science Rev. 180, 60–91. doi:10.1016/j.earscirev.2018.03.001
Sahin, E. K., Colkesen, I., and Kavzoglu, T. (2020). A comparative assessment of canonical correlation forest, random forest, rotation forest and logistic regression methods for landslide susceptibility mapping. Geocarto Int. 35 (4), 341–363. doi:10.1080/10106049.2018.1516248
Sameen, M. I., Pradhan, B., Bui, D. T., and Alamri, A. M. (2020). Systematic sample subdividing strategy for training landslide susceptibility models. CATENA 187, 104358. doi:10.1016/j.catena.2019.104358
Shano, L., Raghuvanshi, T. K., and Meten, M. (2020). Landslide susceptibility evaluation and hazard zonation techniques – A review. Geoenvironmental Disasters 7 (1), 18. doi:10.1186/s40677-020-00152-0
Stanley, T. A., Kirschbaum, D. B., Benz, G., Emberson, R. A., Amatya, P. M., Medwedeff, W., et al. (2021). Data-driven landslide nowcasting at the global scale. Front. Earth Sci. 9, 640043. doi:10.3389/feart.2021.640043
Thirugnanam, H., Ramesh, M. V., and Rangan, V. P. (2020). Enhancing the reliability of landslide early warning systems by machine learning. Landslides 17 (9), 2231–2246. doi:10.1007/s10346-020-01453-z
Tin Kam, H. (1998). The random subspace method for constructing decision forests. IEEE Trans. Pattern Analysis Mach. Intell. 20 (8), 832–844. doi:10.1109/34.709601
Tomek, I. (1976). Two modifications of CNN. IEEE Trans. Syst. 6 (11), 769–772. doi:10.1109/TSMC.1976.4309452
Tran, T. V., Alvioli, M., and Hoang, V. H. (2022). Description of a complex, rainfall-induced landslide within a multi-stage three-dimensional model. Nat. Hazards 110 (3), 1953–1968. doi:10.1007/s11069-021-05020-0
Wang, H., Zhang, L., Yin, K., Luo, H., and Li, J. (2021). Landslide identification using machine learning. Geosci. Front. 12 (1), 351–364. doi:10.1016/j.gsf.2020.02.012
Wang, X., Du, A., Hu, F., Liu, Z., Zhang, X., Wang, L., et al. (2023). Landslide susceptibility evaluation based on active deformation and graph convolutional network algorithm. Front. Earth Sci. 11, 1132722. doi:10.3389/feart.2023.1132722
Woo, C., Kwon, H., Lee, C., and Kim, K. (2014). Landslide hazard prediction map based on logistic regression model for applying in the whole country of South Korea. J. Korean Soc. Hazard Mitig. 14 (6), 117–123. doi:10.9798/KOSHAM.2014.14.6.117
Yalcin, A. (2008). GIS-Based landslide susceptibility mapping using analytical hierarchy process and bivariate statistics in ardesen (Turkey): comparisons of results and confirmations. CATENA 72 (1), 1–12. doi:10.1016/j.catena.2007.01.003
Yalcin, A., Reis, S., Aydinoglu, A. C., and Yomralioglu, T. (2011). A GIS-based comparative study of frequency ratio, analytical hierarchy process, bivariate statistics and logistics regression methods for landslide susceptibility mapping in Trabzon, NE Turkey. CATENA 85 (3), 274–287. doi:10.1016/j.catena.2011.01.014
Yao, X., Tham, L. G., and Dai, F. C. (2008). Landslide susceptibility mapping based on support vector machine: A case study on natural slopes of Hong Kong, China. Geomorphology 101 (4), 572–582. doi:10.1016/j.geomorph.2008.02.011
Ye, C., Tang, R., Wei, R., Guo, Z., and Zhang, H. (2023). Generating accurate negative samples for landslide susceptibility mapping: A combined self-organizing-map and one-class SVM method. Front. Earth Sci. 10, 1054027. doi:10.3389/feart.2022.1054027
Yoo, N. J., Lee, C. J., Choi, Y. J., and Lee, H. S. (2009). “A study on disaster and restoration of debris flow landslides at Inje, Kangwon Province, Korea,” in 17th international conference on soil mechanics and geotechnical engineering (ICSMGE) (Alexandria, Egypt: IOS Press).
Youssef, A. M., and Pourghasemi, H. R. (2021). Landslide susceptibility mapping using machine learning algorithms and comparison of their performance at Abha Basin, Asir Region, Saudi Arabia. Geosci. Front. 12 (2), 639–655. doi:10.1016/j.gsf.2020.05.010
Zêzere, J. L., Pereira, S., Melo, R., Oliveira, S. C., and Garcia, R. A. C. (2017). Mapping landslide susceptibility using data-driven methods. Sci. Total Environ. 589, 250–267. doi:10.1016/j.scitotenv.2017.02.188
Zhang, J., and Mani, I. (2003). “KNN approach to unbalanced data distributions: A case study involving information extraction,” in ICML'2003 workshop on learning from imbalanced data sets II (Washington, DC: ICML).
Keywords: disaster management, extreme gradient boosting (XGB), feature importance, landslide, landslide probability, landslide susceptibility mapping (LSM), random forest (RF), risk map
Citation: Le X-H, Eu S, Choi C, Nguyen DH, Yeon M and Lee G (2023) Machine learning for high-resolution landslide susceptibility mapping: case study in Inje County, South Korea. Front. Earth Sci. 11:1268501. doi: 10.3389/feart.2023.1268501
Received: 28 July 2023; Accepted: 08 September 2023;
Published: 20 September 2023.
Edited by:
Sandipan Das, Symbiosis International University, IndiaReviewed by:
Subham Roy, University of North Bengal, IndiaParama Baanerji, West Bengal State University, India
Copyright © 2023 Le, Eu, Choi, Nguyen, Yeon and Lee. This is an open-access article distributed under the terms of the Creative Commons Attribution License (CC BY). The use, distribution or reproduction in other forums is permitted, provided the original author(s) and the copyright owner(s) are credited and that the original publication in this journal is cited, in accordance with accepted academic practice. No use, distribution or reproduction is permitted which does not comply with these terms.
*Correspondence: Giha Lee, bGVlZ2loYUBrbnUuYWMua3I=