 Yalei Zhe
 Kepeng Hou1
- 1Faculty of Land Resources Engineering, Kunming University of Science and Technology, Kunming, China
- 2Institute of Mining Engineering, Guizhou Institute of Technology, Guiyang, China
Underground mining in Karst Plateau landform area may cause the loss of support for the upper rock stratum, resulting in rock collapse and large-scale subsidence of the ground surface. Also, the formation of a large-scale goafs may further lead to geo-hazards such as collapse, water gushing, slope instability and so on in the area. To reduce the impact of goaf settlement on local strata stability, this paper established a standardized safe mining detection model for goafs based on the geological safety characteristics of mining goafs. With reference to the statistical analysis of the geological conditions in the mining area, a numerical model with 358 goafs and the proposed mining area was established using FLAC3D numerical software. The surface subsidence and variations of plastic zone in the mining area were comprehensively analyzed. The results indicated that there was a correlation between the stability of the mining area and the geological occurrence conditions of the goafs. By quantitatively taking the values from standardized safety mining detection models, the standardized safety mining detection and warning technique was finally established. The findings can provide technical guidance for safety detection and early warning in the whole process of underground goaf mining in Karst Plateau karst development zone.
1 Introduction
Due to the historical reasons such as poor mine supervision and unstandardized mining, many metal and non-metal mines in China have abandoned a large number of unprocessed goafs of various sizes and shapes. Especially since the 1980s, indiscriminate mining under chaotic mining order has created numerous unidentified goafs, which have emerged as one of the most significant risk sources affecting the safe mining and the safety of the lives and property of the inhabitants around the goafs (liao et al., 2008; He et al., 2020; Liu and Li, 2023). Elimination of threats to resource extraction requires surveying and mapping of the goafs to identify their distribution, scale and risk levels.
Extensive studies on the goafs have been conducted by scholars worldwide from the remote sensing and survey perspective to validate the reliability of the resistivity tomography (ERT) method. (Martínez-Pagán et al., 2013) conducted experiments in the semiarid climatic region of La Sierra Minera. Since the space of the cave was occupied by air, one might expect a high electrical resistivity contrast between the cave itself and the host rock. (Yu et al., 2018) utilized the large-loop transient electromagnetic approach to detect the water-rich goaf. The inversion results confirmed that the resistivity of water-rich goaf often exhibited a very low resistivity, and the resistivity contour line behaved as a sharp closed circle. (Chen et al., 2021) examined the developmental characteristics of the goafs in the working zone through the layout of the Transient Electromagnetic Method(TEM) survey line. Subsequently, based on this working zone, the magnetotelluric sounding method was adopted to verify the delineated goafs by TEM, and the anomalous apparent resistivity surface obtained by these two methods was basically constant. In view of the problems of existing methods for solving the parameters of goaf spatial features, (Wei et al., 2022) proposed a method of identifying the spatial location of underground coal goafs by using the minimum unit probability integration merging method and optimized quantum annealing.
Regarding the studies on the goaf stability issues, (Ma, 2021) investigated the creep failure law of coal pillars in the room pillar goaf under overburden loading, where the critical instability state in the dynamic instability process of coal pillars was determined, and the pillar goaf stability evaluation system with multiple indices was established based on the fuzzy exhaustive evaluation method. (Ning et al., 2019). used Mathews stability diagram method to calculate the allowable hydrological radius of rocks in the goaf of Huanggang iron ore mining, and then determined the stability grade of the goaf. Based on 110 goaf samples, (Huang and Chu, 2019) combined random forest algorithm with recursive feature elimination theory to screen out the indexes that contribute more information to the hazard grading of the goafs, and they realized the streamlined dimensionality reduction of the evaluation index system of the goaf. In addition, a large number of researchers also performed computational analysis on goaf stability with the finite difference method or the finite element method (Zhang et al., 2010; Sariandi et al., 2018; Wang et al., 2018; Jia and Xue, 2021).
In terms of quarry area management, (Wang et al., 2023) dealt with goaf-related hazards in advance at specific working faces by enhancing continuous monitoring of water levels and volumes. The most widely available approach for ground pressure management is to use the waste rock, tailings sand, concrete and other materials to fill the goafs (Deng et al., 2009; Feng and Huang, 2020; Liu et al., 2022; Yu et al., 2022; Zu et al., 2023).
In summary, previous studies on goaf detection methods and stability evaluation have mostly focused on goaf detection timing management. Currently, there are no scholars studying goaf detection timing management. The geological conditions of underground goaf in karst development zone are complex, the changing morphology of the ore body, the historical legacy of mining, the disorder and chaos of the early mining, the intemperate mapping, the lack of detailed information and goaf management and the collapse or closure of roadways and goafs in some cases have made it difficult to verify the distributional status of some goafs, resulting in the original hidden goafs becoming even more mysterious (Chun et al., 2020; Li et al., 2021; Li et al., 2021). Therefore, it is difficult to carry out surface subsidence stability warning technology for safe mining in goaf. This article is the first to apply the Eisenhower Rule, Priority Formula and Monte Carlo method of operations research to the construction of a standardized model for goaf safety detection. The simulation results of the whole mining process using the FLAC3D were applied to the standardized model, which realized the goaf classification and efficient detection at different periods. The findings can make the use of human and financial resources to deal with goaf detection and safety hazards more reasonable, scientific and proactive. The research results can provide useful references for the subsequent monitoring and warning of goaf disasters in mines, and provide guarantees for the safety production of mines.
2 Standardized safety detection model
In the process of mine production and construction, the safety problems brought by the potential hazards of the goafs to the production and the surrounding environment should be correctly addressed, while the safety management policy of prevention oriented and comprehensive treatment should be adhered to. In this paper, by adopting the Eisenhower Rule, the Priority Formula and Monte Carlo method and combining the safety characteristics of the goafs themselves, four safety quadrants for goaf detection grading were classified, and finally a standardized safety detection model for goaf was developed, as shown in Figure 1.
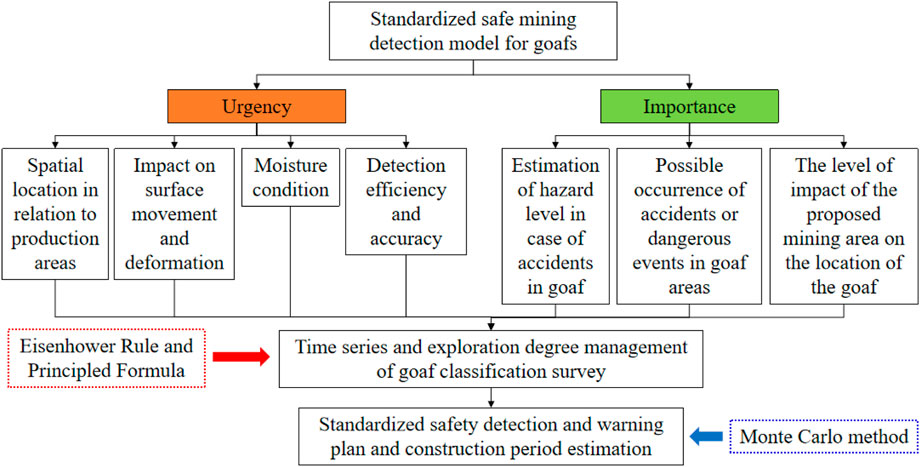
FIGURE 1. Standardized safety detection model for goaf.
The specific construction method of the standardized safety detection model for goafs in Figure 1, as well as the adopted Eisenhower Rule, Priority Formula and Monte Carlo method are described in detail in Sections 3 and 4.
3 Eisenhower Rule time series management
3.1 Eisenhower Rule
Eisenhower Rule, also known as ‘the Four Quadrant Rule’, was introduced by Dwight David Eisenhower. The division of things to be done into four quadrants based on the urgent, non-urgent, important and unimportant arrangement helps us to gain a deep understanding of time and efficient management (Henjewele et al., 2013; Dai, 2019; Li et al., 2020; Luo et al., 2021).
Quadrant 1: this quadrant contains urgent and important matters that should be addressed on a priority basis. The goaf in this quadrant belongs to the high risk and susceptible category. On the one hand, the goaf in this quadrant leads to the deterioration of mining conditions, and directly threaten the production safety of underground operations. On the other hand, it severely affects the life and property safety of surrounding residents, while the degree of detection directly determines the safety of the mine production and the production cycle. Therefore, the level of exploration requires a high level of over 90%.
Quadrant 2: this quadrant contains urgent but unimportant events, so events in this quadrant are very deceptive and tend to take up a lot of valuable time of many people. The goaf in this quadrant falls into the category of low-risk and high-sensitivity. If the goaf is close to the production zone but relatively spatially independent, it will be in relative stable state. Detection work in this quadrant is needed, but the degree of detection can be appropriately reduced, above 50% is sufficient; while appropriate methods could be chosen to categorize the goaf types.
Quadrant 3: this quadrant contains events that are mostly trivial tasks, with no time urgency and no importance. It is manifested by the fact that the goaf in the quadrant is in the low-risk and low-sensitivity category, where the goaf is far away from the production zone, and has good stability and anti-interference. Even if the goaf is destroyed, the safety of production will not be affected. The detection of the goaf in this region is the icing on the cake, only need to reach over 10%, and may favor the detection tasks.
Quadrant 4: this quadrant differs from Quadrant 1 in that the events in this quadrant are not time-critical; however, they have significant impacts. It is manifested by the fact that the goaf in this region falls into the category of high-risk and low-sensitivity, while the goaf is normally in a stable state. There are spatial overlap, denser void areas, thin pinched walls of the endowment and high mining disturbance, which can easily cause large-scale catastrophic accidents. The extent and capacity of the next mine design can be more strongly influenced by the area of the mine goaf. The goaf in this region requires detection with a high degree, must reach over 70%, and they belong to the conservative object.
Based on the above elaboration of the four quadrants, the time management of the goaf survey and the degree of detection of the Eisenhower schematic diagram is drawn in Figure 2, and the goaf detection sequence in the quadrant is shown in Figure 3.
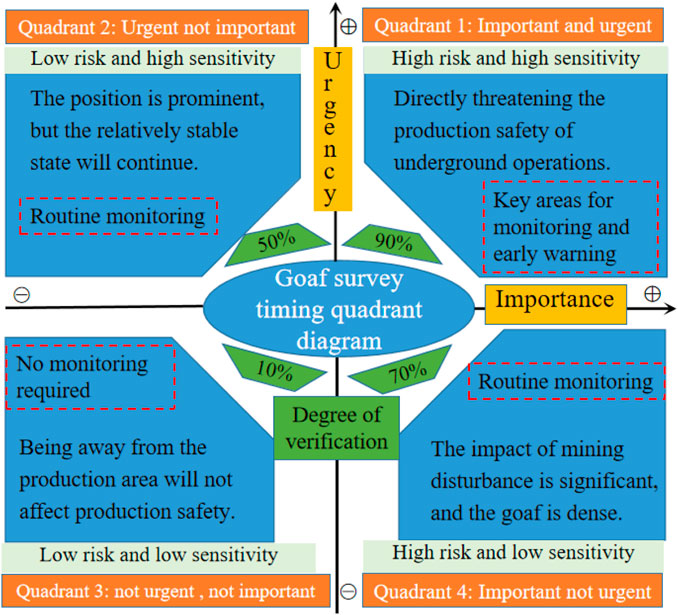
FIGURE 2. Eisenhower diagram of managing the timing of goaf investigations and the degree of exploration.
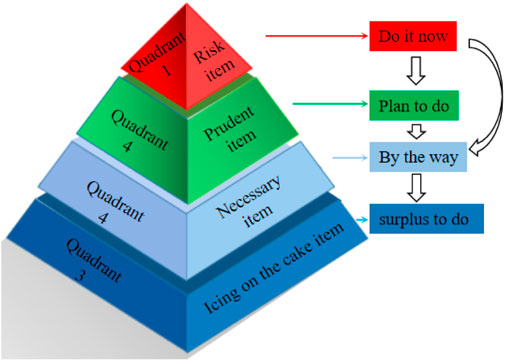
FIGURE 3. The order of detection of each quadrant goaf.
3.2 Method of quantifying the temporal sequence of goaf detection and investigation
3.2.1 The degree of emergency
Based on the relationship between the goaf and the mine engineering layout, and with respect to the urgency of the goaf detection survey, the time of surface deformation and stabilization, the accuracy of detection and the accumulation of water in the former hole were evaluated, and the specific values were.
(1) The area close to the proposed project was characterized by a concentration of personnel, equipment and frequent activities. Therefore, the closer the midsection to the proposed goaf of production resumption at this time, the greater the impact of leftover goaf on production, therefore the investigation and detection should be performed first with respect to temporal urgency (Guo et al., 2014; Liu et al., 2023a; Liu et al., 2023b). We denoted this urgency by J, which took the range of values [1 - Number of middle sections from the proposed goaf] = [1 - n].
(2) In general, the impact of goaf on surface deformation can be divided into three stages. The initial period was the occurrence of subsidence of 10 mm in the main section of the surface displacement basin. The surface subsidence rate was greater than 50 mm/month (the dip angle of the ore body ɑ ≤ 45°) or the surface subsidence rate was greater than 30 mm/month (the dip angle of the ore body ɑ > 45°), which can be regarded as the active period. In six consecutive months, the subsidence value did not exceed 30 mm was considered as the end of the period of surface movement and as the recession period, i.e., the stabilization period. This tightness is denoted by T, which takes the values of [0 - the time needed for the surface movement deformation to stabilize] = [0-n]. The approximate continuation time of the surface deformation in the project area can be deduced from Equation 1, if the surface deformation of the mine is not monitored (Wang and Zhen, 2021):
where
(3) The detection depth has a great impact on the efficiency and accuracy of goaf detection, a number of commonly used and matured means of physical prospecting can be divided into several levels: very shallow goaf (<40 m), shallow goaf (50–150 m), medium-deep goaf (150–400 m), deep goaf (>400 m). Tightness was denoted by S and took values in the range of [very shallow, shallow, medium-deep, deep] = (liao et al., 2008; He et al., 2020; Liu and Li, 2023; Martínez-Pagán et al., 2013).
(4) The water damage caused by the old holes in the goaf was characterised by the strong suddenness, large volume of water in initial stage and great difficulty in prevention and control. The occurrence of water damage in the old holes of the same layer usually causes great damages and enormous economic losses. Therefore, there is a urgent need to utilize advanced sensing means to identify the distribution and size of the goafs and to obtain their water storage capacities (Gui et al., 2016; Qiu et al., 2018). We denoted this tightness by W, which took the following range of values:
3.2.2 Significance
To determine the significance of the goaf detection survey based on the degree of deterioration in mining conditions caused by the goaf, the impact of several aspects on mine production and safety was assessed. These aspects involve the large-scale bubble fall and rock offset, surface collapse, hazards endangering agricultural land and buildings, as well as casualties and equipment damage in underground connected workplace caused by high-speed air waves and shock waves of goaf sudden collapse, etc. (Zhang et al., 2023; Zhang et al., 2023; Gao et al., 2023; Li et al., 2023) Specific values were taken as follows:
1) The valuation of the risk level in case of an accident in the extraction zone was indicated by P (Jiang et al., 2021; Pei et al., 2021). The larger, more numerous and denser the midsection goafs were, the more serious the consequences of destabilization damage would be. With reference to the internationally accepted risk evaluation standard ‘System Safety Standard Practice’ (U.S. military standard MIL-STD-882D), a four-level control relationship was established based on the characteristics of the goafs, as shown in Table 1, which was then utilized to estimate the occurrence level of accidents for each midsection goaf assignment.
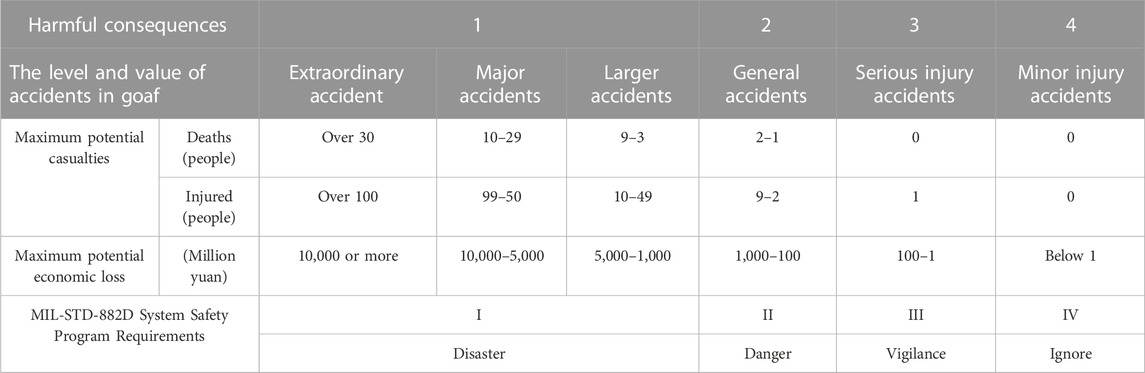
TABLE 1. Estimation of hazard level for accidents in goafs.
2) The possibility fraction of the accidents or hazardous events occurring in the goafs was expressed by G. The value was selected according to the displacement and deformation of the surrounding rock in the goaf and the distribution of the plastic zone. If the displacement in the middle section is small and there is no plastic zone, it indicates that the goaf is relatively stable. Otherwise, it means that the goafs were very prone to deformation damage. The range of probability values is shown in Table 2.
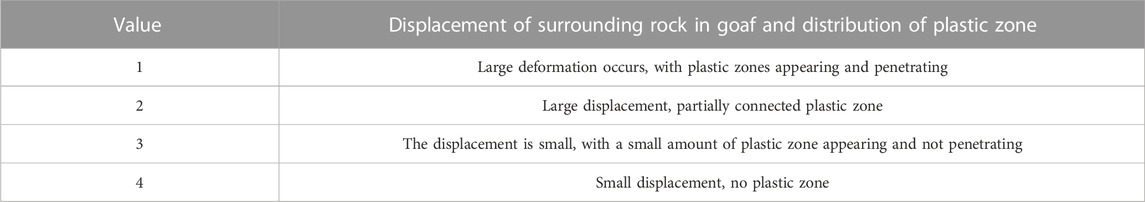
TABLE 2. The probability value of accidents or dangerous events occurring in the goaf.
3) The grade of the part where the mining goafs were located that was affected by the mining movement of the proposed mining area was expressed by I. Its value was selected based on the deformation results of the rock masses in each midsection of the ore body quarry from the numerical simulation calculation described above. The value range [critical impact area, less impact area] = [1, 0]. If the midsection of the rock movement did not change with the increase of the mining depth, the midsection was considered to be less disturbed by the lower ore body mining. The value of 0 was taken where it was in the less affected part, and the value of 1 was taken in the opposite case.
Considering the importance of the parameters, it is expressed as Equation 2, which is called the ‘Priority Formula’.
The Eisenhower Rule is a direct expression of Operations Research and is effective in improving efficiency. However, its shortcomings are also more obvious, whereas it is not possible to plan quantitatively and finely for many complicated matters. In this paper, the Eisenhower Rule and Priority Formula were adopted, and the end point was taken as the origin of the "十" quadrant. The upper right quadrant was for important and urgent events, the upper left quadrant was for unimportant but urgent events, the lower right quadrant was for important but not urgent events, and the lower left quadrant was for unimportant and not urgent events. The orders of priority were: upper right, upper left, lower right, lower left. If there were fewer hidden problems in the same quadrant, it can be simplified to prioritize the problems from largest to smallest using the
Therefore, according to the Eisenhower Rule and the ‘Priority Formula’ derived from quantitative values of urgency and importance, a new perspective on the detection management of the goaf was proposed. Not all goafs must be detected, and those that were left over from history and were not verified in a short period of time can be classified as the category of ‘black box’. For those goafs that had no impact on production safety and the surrounding environment, there was no need to make great efforts to perform the detection and investigation, whereas the risk control could be conducted based on the past information.
4 Monte Carlo method duration estimation
The calculation of project duration using the traditional critical path (CPM) and plan review technique (PERT) in the planning stage will be affected by various uncertainties, so the calculated duration is bound to have some errors. In this paper, the Monte Carlo method and computer programming were utilized to realize the multiple cycles of the duration of the goaf exploration and investigation.
Monte Carlo method is also known as computerized stochastic simulation method (Niu et al., 2020). Using a random number generator to generate the cumulative probability value of a variable, the corresponding variable value can be calculated through the cumulative probability, which is equivalent to a randomly generated variable value. The random benefit index is then calculated by the randomly generated variable. Repeating this process N times yields N sets of benefit indexes. When the number of repetitions N is large enough, the probability distribution of the benefit index can be obtained.
Following the operational idea, the procedures of the Monte Carlo simulation method in project time management in this paper are as follows.
(1) Determine the type of probability distribution of the random variable, which can be assumed to be a modified triangular distribution.
(2) Generation of random numbers. The Rand function was adopted to generate random numbers between 0 and 1.
(3) Obtain statistical data. Considering that the plan review technique used the three-time estimation to calculate the process time, the triangular distribution formula was introduced and coded into the program, After running the program, the value of the duration
where
(4) Determine the type of probability distribution. Once enough statistical data were obtained, a probability statistical chart can be plotted using Excel to make a qualitative assumption about the probability distribution of the activity.
(5) Determine the distribution parameters for the project duration.
5 Engineering applications
After decades of mining in Baiyang and Duimenshan mine sections of Bainiuchang mining area in Mengzi City, Yunnan Province, there are many hidden dangers in safety production. The priority task of mine recovery is to analyse the stability of the current goafs and to investigate the relationship between the mining of the lower ore body and the original goafs, so as to ensure the safe exploitation of the mine resources. However, the disorderly mining activities within the mining area under the influence of historical reasons did not yet form a more complete graph data for the scope of exploration/mining, and also there was a lack of systematic planning for exploration/mining activities. There is a lack of comprehensive research on exploration projects. The ‘shape’ (the morphological characteristics of the ore body), ‘quality’ (the distribution characteristics and the change law of the mine grade) and the ‘symbiosis’ (ore type, the law of mineral symbiosis) was not clear. The large proportion of low-grade mineral reserves, the serious imbalance of tertiary ore quantity as well as the serious blindness of project construction had resulted in a large number of goafs left in the mining (exploration) midsection at various elevations, with different sizes and shapes. Some of the roadways and goafs collapsed and were inaccessible to personnel, bringing greater difficulties to the survey and detection of the goafs.
5.1 Detection survey timing management
On the basis of the preliminary results of the mine engineering geology and goaf investigation, the FLAC3D was utilized to develop a three-dimensional numerical model to compute and analyze the mining process. For the scientific and reasonable survey of goafs and the detection level classification, the stress-strain laws of the rock masses in both the Baiyang and Duimenshan mine sections were investigated, which realized the purpose of highlighting the key goafs, graded detection and comprehensive processing, and guided the resumption of mining work and production. The model size of the two ore sections is the same. The X direction is perpendicular to the ore body and the length is 3500 m. Direction Y is the ore body trend, 4000 m long; The Z direction is vertical, the bottom elevation of the model is 900 m, and the top elevation simulates the actual terrain of the mine.
5.1.1 Numerical modeling of the goaf
The two mining sections are far away from each other, and are in no interactive influence. Therefore, the two mining sections were modeled separately, where the distributions of goafs are presented in Figures 4, 5.
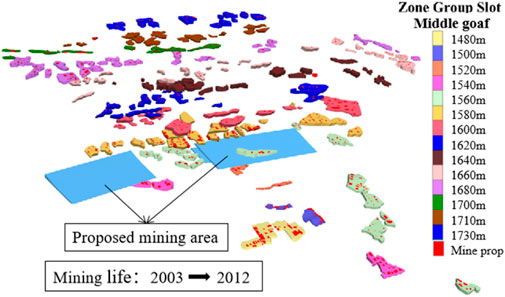
FIGURE 4. Distribution of empty areas in Baiyang mine section.
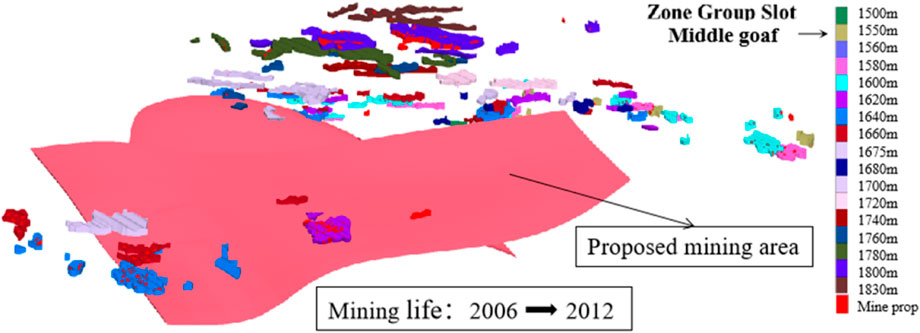
FIGURE 5. Distribution map of the goafs in the Duimenshan section.
5.1.2 Analysis of the current situation
The site survey shows that the mining time of the goafs between the 1,480 m and 1730 m midsections in the Baiyang mine section were from year 2003–2012, and those between the 1,500 m and 1830 m midsections in the Duimenshan mine section were from year 2006–2012. Under the comprehensive consideration of the accuracy of the computational results and computational workload, the actual back-mining steps were simplified to facilitate numerical analysis of the entire excavated goafs during the simulation computation. The mining site in the same mining time was excavated and finished at one time, while each goaf at midsection was sequentially excavated from top to bottom. Due to the large number of nephograms of the calculation results, some of the calculation results of the Baiyang mine section are selected for presentation, and the rest of the calculation results are displayed in graphs.
(1) Rock mass displacement
The Baiyang mine section after 10 years of mining formed the current situation of the goafs. Numerical simulation results of the displacement nephogram of the current mining are shown in Figure 6, where the maximum displacement was 21.5 cm. The subsidence of the goaf roof was basically proportional to the exposed area of the goaf, whereas a larger exposed area of the goaf led to a greater roof subsidence. Some of the goafs were in a continuous state with an overall poor stability. Due to the large exposed area, the roof falling, pillar destabilization and other hazards may occur in some individual goafs.
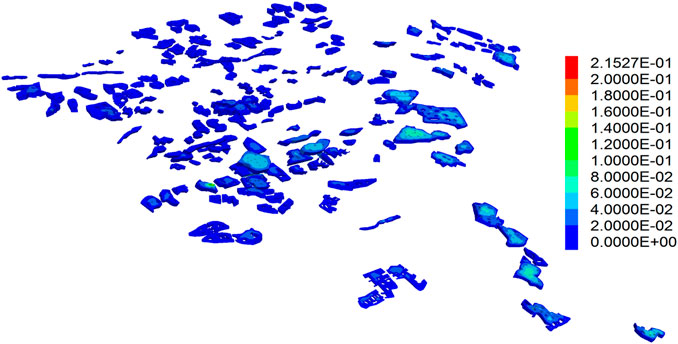
FIGURE 6. Displacement distribution nephogram of Baiyang mine Section induced by the current mining (Unit: m).
Figure 7 illustrates the nephogram of surface subsidence caused by the current mining. The range and value of the subsidence were both small, with a maximum value of 12.2 mm, which indicated that the current surface was in a stable state.
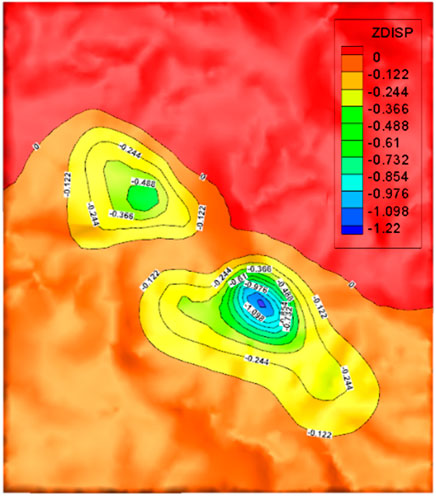
FIGURE 7. Nephogram of surface subsidence due to current mining in Baiyang mine section (unit: cm).
With the increase of the mining age, the trends of surface subsidence and rock mass displacement of the quarry in the Baiyang and Duimenshan mine sections are shown in Figures 8, 9. When the midsections at 1,640 m and 1,620 m of Baiyang mine section were mined in 2007, the slope of the displacement curve was steeper, indicating a greater impact on rock mass displacement and surface subsidence of the quarry.
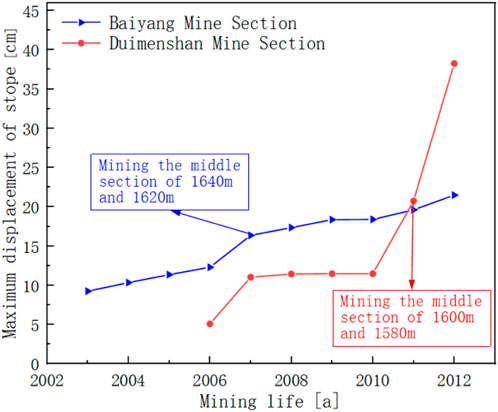
FIGURE 8. The change tend of the rock mass in goaf.
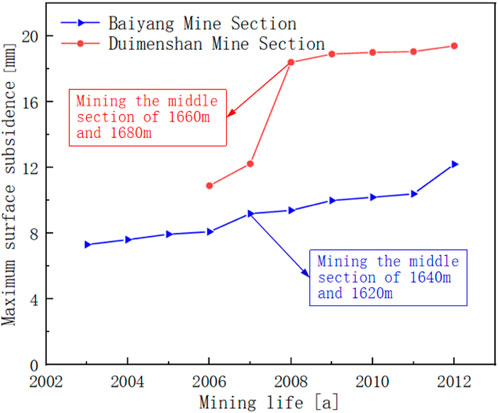
FIGURE 9. The change trend of surface subsidence.
When the midsections at 1,660 m and 1,680 m of Duimenshan mine section were mined in 2008, the surface subsidence curve became steeper, which indicated that the mining had a greater impact on surface subsidence. When the ore body below 1,600 m was mined in 2010, the displacement curve became steeper, indicating that mining of the lower ore body had a more significant impact on the movement and deformation of the rock masses.
(2) Plastic zone
Figure 10 shows the distribution of the plastic zone in the rock mass of the goafs that obtained by the numerical simulation after 10 years of mining in the Baiyang mine section. In the region where the exposed area was large and the goafs were densely packed, a large area of plastic zone occurred, and the rock mass may be deformed and damaged.
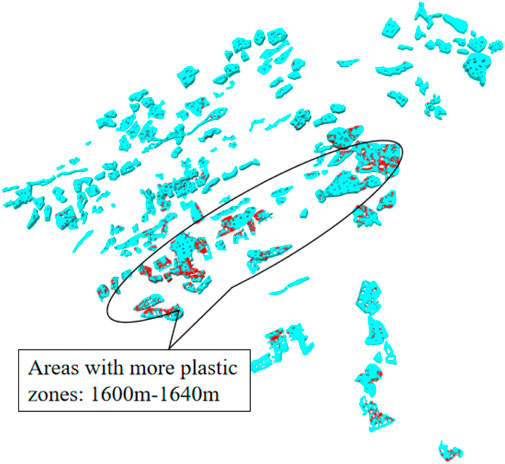
FIGURE 10. The distribution of the plastic zone in the current goafs in the Baiyang mine section.
Figure 11 shows the variations of the plastic zone volume in the quarry rock mass in the Baiyang and Duimenshan mine sections with the increasing mining age. When the midsections at 1,640 m and 1,620 m of the Baiyang mine section as well as the ore body below 1,600 m of the Duimenshan mine section were mined in 2007, the volume curve of the plastic zone steepened, which indicated that the stability of the goafs formed by the mining in these midsections was relatively poor.
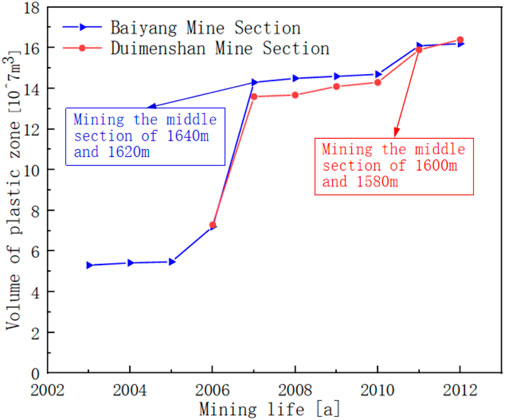
FIGURE 11. Volume variations of the plastic zone in quarry rock masses in two mining sections.
5.1.3 Analysis of the impact of mining on the proposed goaf
The proposed mining areas in the Baiyang and Duimenshan mine sections were between 1,560 m and 1,580 m midsections, as well as 1,660 m and 1760 m midsections, respectively. The regions with the mining deformation values greater than 1 cm, greater than 0.1 cm and smaller than 1 cm and less than 0.1 cm were defined as the regions of greater impact, less impact and no impact, respectively. The degree and range of impacts on these two sections of the mine are circled as presented in Figures 12, 13 in both the horizontal and vertical directions.
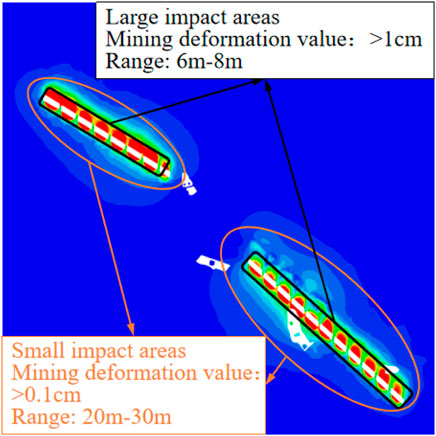
FIGURE 12. The impact range on two sections in horizontal direction.
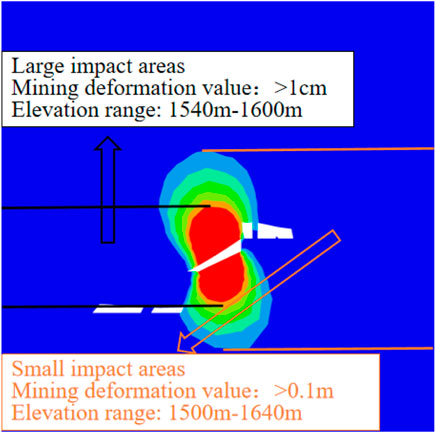
FIGURE 13. The impact range on two sections in vertical direction.
As indicated in the circled range of the impact, after the proposed goaf of the Baiyang mine section was mined, the range of the greatest impact was 6–8 m in horizontal direction while that was about 20 m in vertical direction, i.e., from the midsection of 1,540 m to the midsection of 1,600 m. After the proposed goaf of Duimenshan mine section was mined, the range of the greatest impact was 100 m in horizontal direction while that was approximately 180 m in vertical direction, i.e., the 1,600 m midsection to the 1780 m midsection.
5.1.4 Theoretical calculation of plastic zone radius
Modern ground pressure theory believes that the load borne by the support is the total gravity of the rock in the upper plastic zone, independent of the overlying rock layer. Therefore, as long as the pillar can withstand the gravity of the rock in the plastic zone of the roof surrounding rock after mining, the long-term stability of the roof and pillar system can be ensured. The bearing mechanism of the pillar is shown in Figure 14.
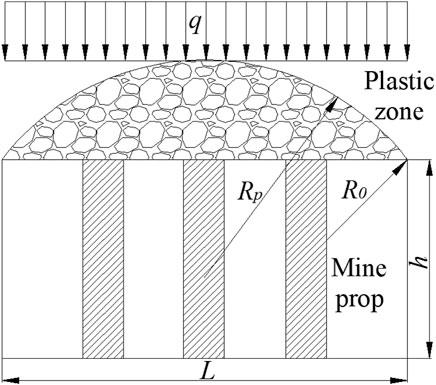
FIGURE 14. Schematic diagram of pillar bearing mechanism.
After mining the ore block, ignoring the influence of the pillar on the range of plastic zone in the roof surrounding rock, solving the Kastner formula can obtain the radius of the plastic zone in the roof surrounding rock, which is:
Where
Practice has shown that the radius of the plastic zone is less affected by the shape of the excavation section, and can be approximated as the equivalent excavation radius, which is replaced by the outer circle radius of different shapes in calculation. For ore blocks, the equivalent excavation radius
Where
The vertical self weight stress at the excavation site is:
Where
The bulk density
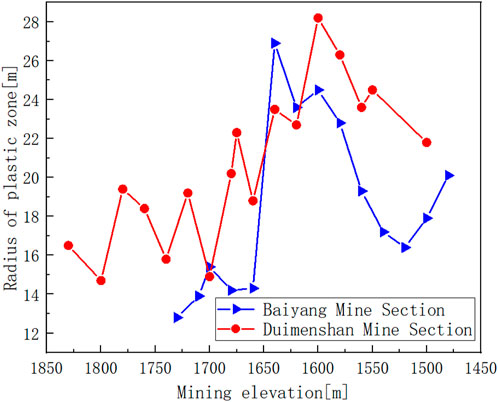
FIGURE 15. Maximum plastic radius of overlying surrounding rock at each mining level stope.
From Figure 15, it can be seen that during the mining of 1640 m in the Baiyang ore section, the radius of the plastic zone is the largest, at 26.9 m. However, during the mining of 1600 m in Damenshan, the radius of the plastic zone is the largest, at 28.2 m, which is in good agreement with the numerical simulation results.
5.1.5 Timing management
The indicators of importance and urgency proposed in the previous section were quantified based on the results of the investigation and numerical simulation of the goafs in the Baiyang and Duimenshan mine sections of the Mengzi mine. The impact of the current goafs on the surface subsidence was determined by Equation 2, and the maximum duration of surface displacement was 3.5 years. Considering that it has been more than 10 years since the mine ceased production in 2012, the urgency value T was therefore set to be 0, and the values of the rest parameters are shown in Table 3.
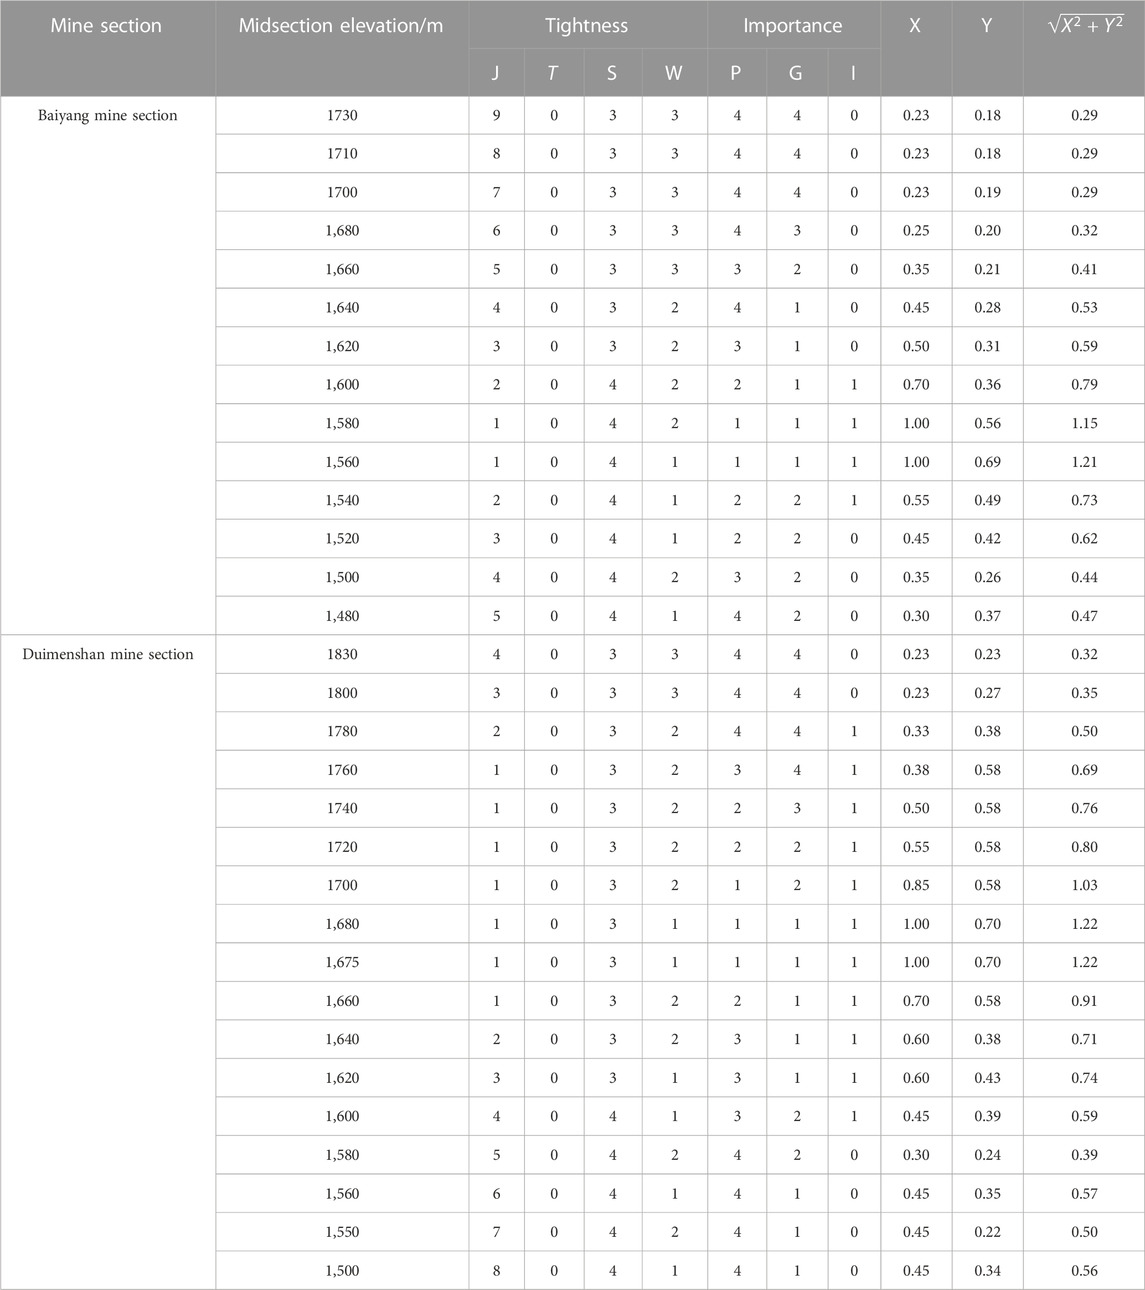
TABLE 3. Quantification of urgency and importance.
The results are plotted in a four-quadrant Eisenhower Rule diagram, where the midpoint of the four quadrant division is the average of the calculated results of urgency X and importance Y in Table 3, as illustrated in Figure 16.
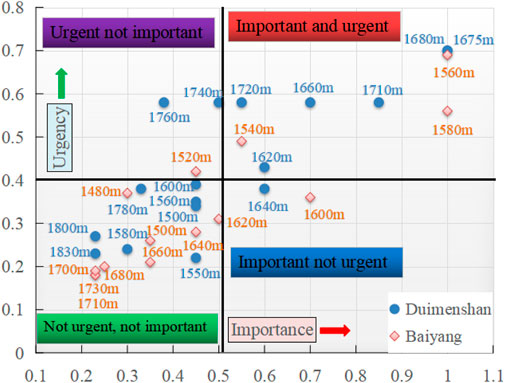
FIGURE 16. Survey time sequence management chart.
It can be seen from the figure above that, prior to the resumption of production activities in the mine, the most primary and core detection areas for the goafs were as follows: midsections of the 1,540 m, 1,560 m and 1,580 m of the Baiyang mine section, midsections of the 1,620 m, 1,660 m, 1,675 m, 1,680 m, 1710 m and 1720 m of the Duimenshan mine section. The results of this study are presented in Table 4, it can be seen that there was a higher requirement for the degree of investigation and detection of the goafs. The secondary ones were the midsections of the 1,520 m, 1740 m, and 1760 m of the Duimenshan mine section. The final ones were 1,600 m midsection of Baiyang mine section and 1,640 m midsection of Duimenshan mine section. Except for the above-mentioned goaf, all other goaf areas belong to the “black box” category, with a total of 18 midsections. These goaf areas will be supplemented with exploration in the remaining time after the above investigation is completed.
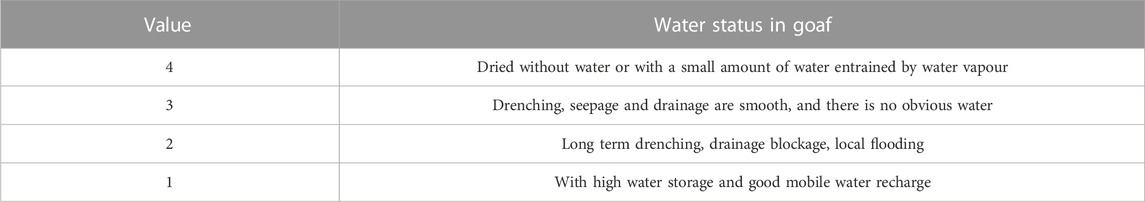
TABLE 4. The urgency of water damage detection in the goaf is taken.
5.2 Duration estimation
Section 5.1 specifies the scope and priority of the detection survey that must be carried out before the resumption of work and production in the mine, in addition to the goafs within the scope of the ‘black box’. Two groups of personnel were arranged to carry out the detection survey at the same time, the detection work is mainly carried out using TEM, the network diagram is shown in Figure 17.

FIGURE 17. Time series network diagram of goaf detection survey.
5.2.1 Monte Carlo simulation process
The 14 investigation processes in the network diagram were distributed over 2 paths
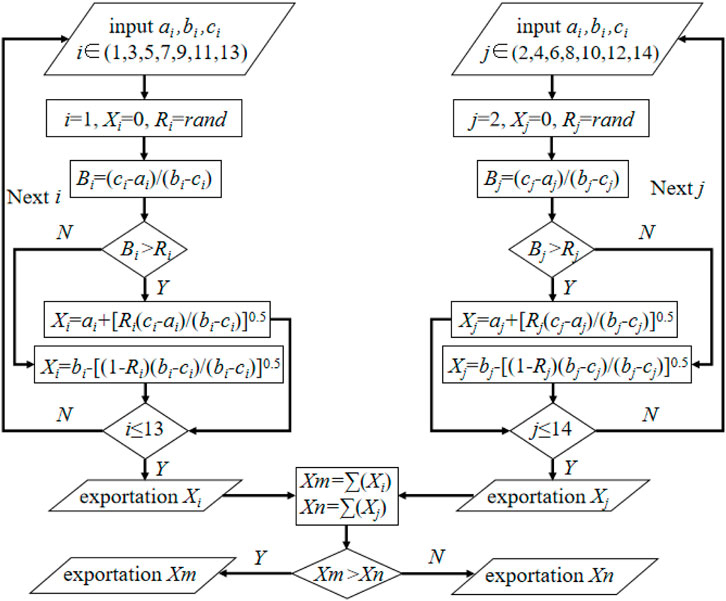
FIGURE 18. Block diagram of the calculation program.
The time parameters of each investigated process with specific three-time estimation data are shown in Table 5.
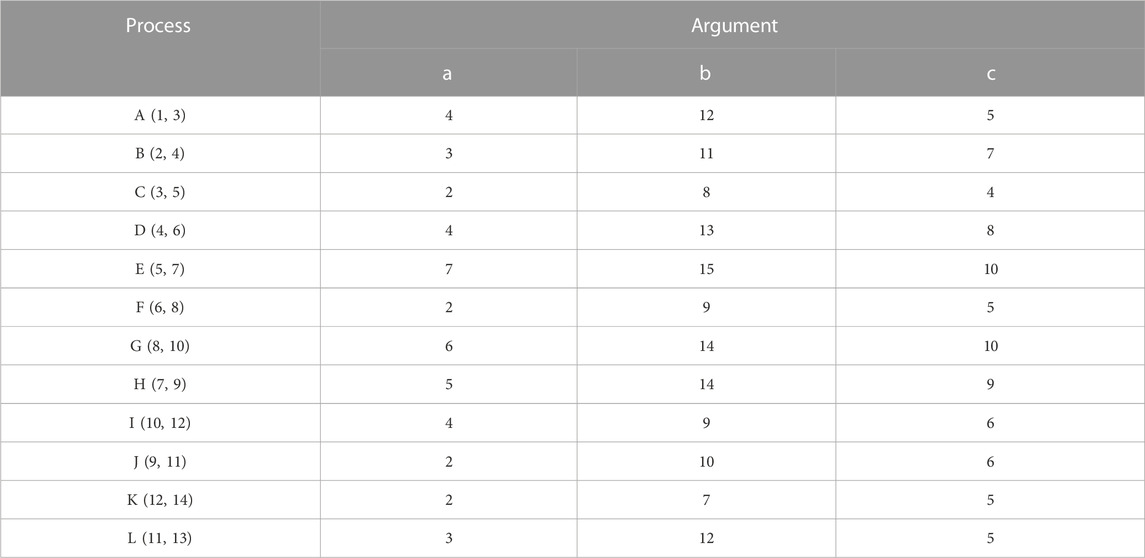
TABLE 5. Estimation of the operation 3.
5.2.2 Simulation results
Statistical analysis of the 1,000 sets of calculation results after 1,000 cycles of the Monte Carlo calculation program was performed to obtain a probability distribution graph about the survey duration for goaf detection, as indicated in Figure 19. By connecting the histogram into a smooth curve, it can be qualitatively determined that the construction duration of the project fully conformed to the Normal distribution. There was a 90% probability that the construction duration was between 43 and 56 d, and it can be determined that the most probable construction duration of the project was 48 d.
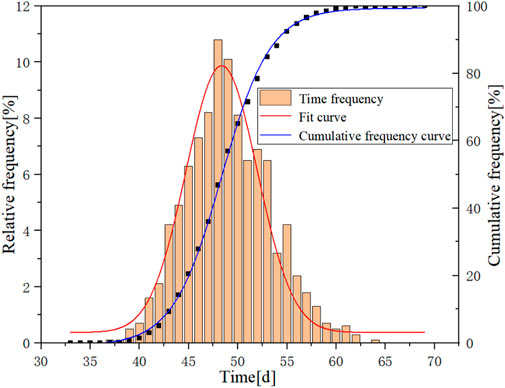
FIGURE 19. Probability distribution chart.
6 Discussion
There are many factors that affect the stability of goaf and the safety of production areas. The construction of a standardized safety mining detection model for goaf in this article considers a total of 7 factors in terms of urgency and importance, which may not be comprehensive enough. In terms of detection, different detection methods have different advantages, disadvantages, and applicable conditions, which requires a lot of space to discuss. The construction of the model is only based on the analysis of conventional detection methods, without fully considering the impact of various methods.
The construction of the model in this article is applicable to mines that use open pit mining. During the analysis process, it is necessary to quantify the various parameters of urgency and importance. Therefore, it is necessary to have some basic data on the remaining goaf of the mine. In the early stage, it is necessary to conduct a review of production design data and the actual situation on site.
7 Conclusion
(1) This article is the first to apply the three important theories of operational research, Eisenhower Rule, Priority Formula and Monte Carlo method, to the construction of a standardized model for goaf safety detection, which can provide technical guidance for the entire process of safety detection and early warning in underground goaf mining.
(2) Quantifying the urgency and importance of goaf detection and investigation, achieving hierarchical, phased, and time series management, can highlight key goaf areas and drive comprehensive goaf detection work in mines.
(3) Applying the FLAC3D numerical simulation results of the mine to the model saves a lot of manpower and material resources in the exploration work, and accelerates the pace of resuming work and production.
Data availability statement
The original contributions presented in the study are included in the article/supplementary material, further inquiries can be directed to the corresponding author.
Author contributions
YZ: Conceptualization, Data curation, Formal Analysis, Methodology, Writing–original draft. KH: Funding acquisition, Methodology, Resources, Supervision, writing–review and editing. XN: Investigation, Methodology, Software, Writing–review and editing. WL: Funding acquisition, Methodology, Supervision, Writing–review and editing.
Funding
The author(s) declare financial support was received for the research, authorship, and/or publication of this article. The work described in this paper was supported by the Guizhou Provincial Science and Technology Project [No. QKHZC (2021) General 407] and the New Talent Training Project of the Guizhou Institute of Technology (No. GZLGXM-29).
Conflict of interest
The authors declare that the research was conducted in the absence of any commercial or financial relationships that could be construed as a potential conflict of interest.
Publisher’s note
All claims expressed in this article are solely those of the authors and do not necessarily represent those of their affiliated organizations, or those of the publisher, the editors and the reviewers. Any product that may be evaluated in this article, or claim that may be made by its manufacturer, is not guaranteed or endorsed by the publisher.
References
Chen, F., Wang, X., Wang, Z., and Zheng, J. (2021). Study on the application of comprehensive geophysical prospecting technology for the goaf detection in coal mine. IOP Conf. Ser. Earth Environ. Sci. 660 (1), 012109. doi:10.1088/1755-1315/660/1/012109
Chun, B., Meng, X., and Jun, M. (2020). Hazards of environmental disruption in mine goafs and stability evaluation in gaofeng mining area. Nat. Environ. Pollut. Technol. 19 (3), 005. doi:10.46488/NEPT.2020.V19I03.005
Dai, Y. (2019). A preliminary study on the disposal sequence of a gate safety hazard. Municipal·Traffic·Water Resour. Eng. Des. 3, 149–150+153. doi:10.13616/j.cnki.gcjsysj.2019.02.050
Deng, J., Meng, Z., and Mao, J. (2009). Potential hazard evaluation and treatment of mine goaf in orebody. Metal. Mine 8, 126–129.
Feng, P., and Huang, D. (2020). Study on application of goaf management and residual mining technology in niujuan deposit. E3S Web Conf. 165, 03041. doi:10.1051/e3sconf/202016503041
Gao, Y., Yu, Z., Chen, W., Yin, Q., Wu, J., and Wang, W. (2023). Recognition of rock materials after high-temperature deterioration based on SEM images via deep learning. J. Mater. Res. Technol. 05, 273–284. doi:10.1016/j.jmrt.2023.05.271
Gui, H., Sun, L., and Chen, S. (2016). Research on goaf water features and disaster formation mechanism in China coalmines. IOP Conf. Ser. Earth Environ. Sci. 44 (4), 042036. doi:10.1088/1755-1315/44/4/042036
Guo, X., Dou, L., Xu, B., Tang, S., Wen, X., and Wu, B. (2014). Metagenomic profiles and antibiotic resistance genes in gut microbiota of mice exposed to arsenic and iron. Coal Sci. Technol. 42 (02), 1–8. doi:10.1016/j.chemosphere.2014.03.068
He, R., Han, Z., Zhou, Y., Liu, H., and Liu, Y. (2020). Analysis on disaster characteristics and preventive measures of goaf in metal and non-metal mines. Min. Res. Dev. 40 (9), 33–38. doi:10.13827/j.cnki.kyyk.2020.09.007
Henjewele, C., Fewings, P., and Pantaleo, D. (2013). De-marginalising the public in PPP projects through multi-stakeholders management. J. Financial Manag. Prop. Constr. 1 8 (2), 210–231. doi:10.1108/jfmpc-05-2013-0021
Huang, X., and Chu, F. (2019). Risk grade evaluation model of goaf based on logical regression and clustering algorithm. Ment. Mine 8, 179–184. doi:10.19614/j.cnki.jsks.201908030
Jia, H., and Xue, J. (2021). The stability study of goaf based on C-ALS data point cloud and FLAC3D Coupled modeling. E3S Web Conf. 261, 03053. doi:10.1051/e3sconf/202126103053
Jiang, H., Ye, Y., Hu, N., Wang, Q., Chen, H., and Wu, M. (2021). The risk assessment of goaf based on the ariable weight synthesizing weights grey target model. China Min. Mag. 30 (10), 106–113.
Li, L., Wu, D., and Liu, Y. (2020). Study on permanent basic farmland demarcation around the city with the fourquadrant method. Chin. J. Agric. Resour. Regional Plan. 41 (5), 87–97.
Li, X., Wang, J., and Guo, X. (2021a). Analysis and Practice of detection methods for goafs in complex coal mines. J. Phys. Conf. Ser. 2006 (1), 012056. doi:10.1088/1742-6596/2006/1/012056
Li, X., Zhang, X., Shen, W., Zeng, Q., Chen, P., Qin, Q., et al. (2023). Research on the mechanism and control technology of coal wall sloughing in the ultra-large mining height working face. Int. J. Environ. Res. Public Health 20 (2), 868. doi:10.3390/ijerph20010868
Li, Z., Xu, Y., Liu, H., Zhai, X., Zhao, S., and Yu, Z. (2021b). Numerical analysis on the potential danger zone of compound hazard in gob under mining condition. Process Saf. Environ. Prot. 147, 1125–1134. doi:10.1016/j.psep.2021.01.043
liao, G., Peng, X., Wang, Y., Hu, J., Li, Q., and Ma, H. (2008). Practice about evaluation technology in disposing the hidden trouble in large complicated group mined-out stope. J. Saf. Sci. Technol. 4 (1), 15–20.
Liu, S., and Li, X. (2023). Experimental study on the effect of cold soaking with liquid nitrogen on the coal chemical and microstructural characteristics. Environ. Sci. Pollut. Res. 30 (3), 36080–36097. doi:10.1007/s11356-022-24821-9
Liu, S., Sun, H., Zhang, D., Yang, K., Li, X., Wang, D., et al. (2023b). Experimental study of effect of liquid nitrogen cold soaking on coal pore structure and fractal characteristics. Energy 275 (7), 127470. doi:10.1016/j.energy.2023.127470
Liu, S., Sun, H., Zhang, D., Yang, K., Wang, D., Li, X., et al. (2023a). Nuclear magnetic resonance study on the influence of liquid nitrogen cold soaking on the pore structure of different coals. Phys. Fluids 35 (1), 012009. doi:10.1063/5.0135290
Liu, Z., Deng, D., Feng, J., Wang, R., Fan, J., and Ma, Y. (2022). Study on natural settlement index characteristics of iron-bearing tailings applied to goaf filling treatment. Sustainability 14 (17), 10739. doi:10.3390/su141710739
Luo, Y., He, L., Ma, Z., Chen, Z., and Zhou, L. (2021). Clearing the design barriers of international EPC project via the technique of project stakeholders management and quadrant method. J. Eng. Manag. 35 (1), 55–59. doi:10.13991/j.cnki.jem.2021.01.010
Ma, H. (2021). Coupling effect of coal pillar-roofand stability evaluation of pillar goaf. Xuzhou: China University of Mining and Technology.
Martínez-Pagán, P., Gómez-Ortiz, D., Martín-Crespo, T., Manteca, J. I., and Rosique, M. (2013). The electrical resistivity tomography method in the detection of shallow mining cavities. A case study on the Victoria Cave, Cartagena (SE Spain). Eng. Geol. 156, 1–10. doi:10.1016/j.enggeo.2013.01.013
Ning, Y., Jiang, F., and Lin, W. (2019). Study on stability evaluation and treatment scheme of goaf in Huanggang iron mine. Min. Res. Dev. 39 (8), 74–77. doi:10.13827/j.cnki.kyyk.2019.08.015
Niu, Q., Song, X., and Zhang, H. (2020). Risk AssessmentofBuildingsatServiceStage basedon Monte Carlo method. J. Xuzhou Inst. Technol. ( Nat. Sci. Ed. ) 35 (2), 86–92. doi:10.15873/j.cnki.jxit.000357
Pei, Y., Wu, J., Sun, Q., Zhang, Z., and Yang, X. (2021). Improved GA-BP risk level evaluation model for complex goaf in mines. Chin. J. Undergr. Space Eng. 17, 979–984.
Qiu, H., Qiu, W., Tong, S., and Zhang, H. (2018). Overview of goaf water hazards control in China coalmines. Arabian J. Geosciences 11 (3), 12517. doi:10.1007/s12517-018-3391-z
Sariandi, F., Putra, G. V., Setyorini, G. V., and Saptono, S. (2018). Stope stability analysis of limestone ex-mined area at Ponjong sub-district Special Region of Yogyakarta using finite element method. IOP Conf. Ser. Earth Environ. Sci. 212, 012037. doi:10.1088/1755-1315/212/1/012037
Wang, C., Lu, Y., Cui, B., Hao, G., and Zhang, X. (2018). Stability evaluation of old goaf treated with grouting under building load. Geotechnical Geol. Eng. 36 (4), 2553–2564. doi:10.1007/s10706-018-0482-2
Wang, N., Wang, Z., Sun, Q., and Hui, J. (2023). Coal mine goaf interpretation: survey, passive electromagnetic methods and case study. Minerals 13 (3), 422. doi:10.3390/min13030422
Wang, Y., and Zhen, Z. (2021). Study on the law of surface subsidence and deformation in goaf. Sci. Technol. Innovation 6, 35–37.
Wei, T., Guo, G., Li, H., Wang, L., Yang, X., and Wang, Y. (2022). Fusing minimal unit probability integration method and optimized quantum annealing for spatial location of coal goafs. KSCE J. Civ. Eng. 26 (5), 2381–2391. doi:10.1007/s12205-022-1034-0
Yu, C., Liu, X., Liu, J., Li, E., Yue, P., and Yan, S. (2018). Application of transient electromagnetic method for investigating the water-enriched mined-out area. Appl. Sci. 8 (10), 1800. doi:10.3390/app8101800
Yu, H., Li, S., and Wang, X. (2022). The recent progress China has made in the backfill mining method, Part III: practical engineering problems in stope and goaf backfill. Minerals 12 (1), 88. doi:10.3390/min12010088
Zhang, J., Li, X., Qin, Q., Wang, Y., and Gao, X. (2023b). Study on overlying strata movement patterns and mechanisms in super-large mining height stopes. Bull. Eng. Geol. Environ. 82 (3), 142. doi:10.1007/s10064-023-03185-5
Zhang, L., Shen, W., Li, X., Wang, Y., Qin, Q., Lu, X., et al. (2023a). Abutment pressure distribution law and support analysis of super large mining height face. Int. J. Environ. Res. Public Health 20 (1), 227. doi:10.3390/ijerph20010227
Zhang, Y., Cao, P., Yuan, H., and Dong, L. (2010). Numer. Simul. Stab. Complicat. Goaf 27 (2), 233–238.
Keywords: Karst Plateau zone, surface subsidence, security detection, numerical model, early warning technique
Citation: Zhe Y, Hou K, Niu X and Liang W (2023) Early warning technique research of surface subsidence for safe mining in underground goaf in Karst Plateau zone. Front. Earth Sci. 11:1266649. doi: 10.3389/feart.2023.1266649
Received: 25 July 2023; Accepted: 25 August 2023;
Published: 06 September 2023.
Edited by:
Xuelong Li, Shandong University of Science and Technology, ChinaReviewed by:
Lei Shi, China University of Mining and Technology, ChinaYu Xuguang, Tangshan Vocational and Technical College, China
Copyright © 2023 Zhe, Hou, Niu and Liang. This is an open-access article distributed under the terms of the Creative Commons Attribution License (CC BY). The use, distribution or reproduction in other forums is permitted, provided the original author(s) and the copyright owner(s) are credited and that the original publication in this journal is cited, in accordance with accepted academic practice. No use, distribution or reproduction is permitted which does not comply with these terms.
*Correspondence: Xiangdong Niu, bml1eGlhbmdkb25nQHN0dS5rdXN0LmVkdS5jbg==