 Emre Mulumulu
 Orhan Polat
 Francisco J. Chávez-García3
95% of researchers rate our articles as excellent or good
Learn more about the work of our research integrity team to safeguard the quality of each article we publish.
Find out more
ORIGINAL RESEARCH article
Front. Earth Sci. , 14 November 2023
Sec. Solid Earth Geophysics
Volume 11 - 2023 | https://doi.org/10.3389/feart.2023.1265986
We have studied Rayleigh wave group velocities beneath the Aegean region of Türkiye using ambient noise tomography. Noise data were gathered from 43 broadband seismic stations belonging to three permanent broad-band arrays. The cross-correlation method was used to estimate empirical Green’s functions. Group velocities of the fundamental mode Rayleigh waves were determined using multiple filter technique. We measured dispersion for each station pair in a period range of 2–12 s and computed maps of group velocity distribution using the fast marching surface tomography method. The group velocity maps correlate well with the geological and tectonic features of the region, displaying low velocities for the Quaternary alluvial basins, moderate velocities for Cretaceous rocks, and high velocities for the regions where gneiss and granitoid rocks outcrop. Low velocity anomalies may be associated with the grabens and horsts formed by faulting and to deep mantle flow. We detect potential offshore geothermal zones in Izmir and Candarli Bay. The information from broad-band networks improves the resolution of crustal surface wave velocity structures, particularly for shallow depths. This improvement will support the assessment of seismic hazard, as the shallow layers of the crust contribute significantly to seismic activity.
The Aegean region of Türkiye is located on the western part of the Anatolian plate (AnP), sitting between three major tectonic plates: African (AfP), Eurasian (E.P) and Arabian. The AfP subducts beneath the E.P (along the arc systems such as Hellenic Arc-HA, Florence Rise-FR, Cyprus Arc-CA) resulting in intracontinental convergence and north-south shortening. The AnP switched to a north-south extensional regime in the latest Oligocene-early Miocene, and consequently exhibits a number of approximately east-west trending grabens and intervening horst blocks. At present, the AnP is being pushed to the west with counter-clockwise rotational motion along the North Anatolian Fault (NAF) zone. The kinematics of active faults are mainly normal oblique with a small strike-slip component (Ozdemir and Ince, 2005). Alluvial sediments in grabens were deposited during the early Miocene (Jolivet et al., 2013) when the north-south extension created east-west aligned grabens (e.g., Kucuk Menderes-KMG, Buyuk Menderes-BMG, Denizli-DG, Sarigol-SG, Alasehir-Gediz-AGG, and Manisa-MG) and horsts (e.g., Babadag-BaH, Bozdag-BoH, and Spil-SH) structures with an elevation up to 1,500 m (Yilmaz et al., 2000). The shaded relief topography shown in Figure 1 correlates well with the tectonic and geomorphologic structures in the study area.
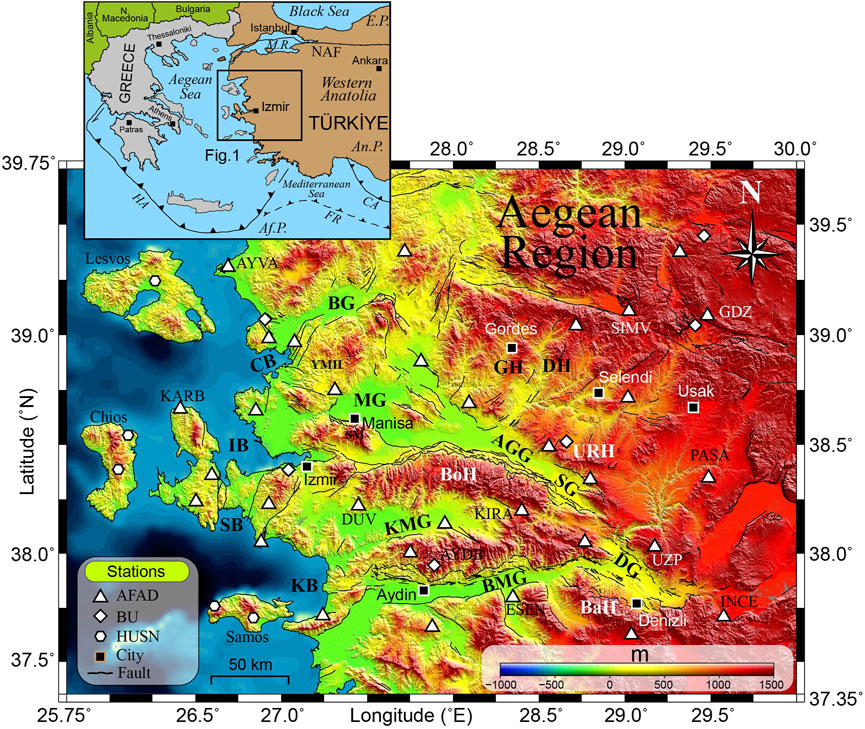
FIGURE 1. Inset: the solid rectangle indicates the studied area shown in the main figure, AfP, African Plate; AnP, Anatolian Plate; CA, Cyprus Arc; EP, Eurasia Plate; FR, Florence Rise; HA, Hellenic Arc; MR, Marmara Region; NAF, North Anatolian Fault. Main figure: shaded relief map illustrating topography, geomorphology and tectonics of the Aegean region of Türkiye. Stations are shown with white symbols (43 broad-band in total). Triangles, diamonds, and hexagons indicate stations belonging to three different arrays, two from Türkiye (AFAD:Disaster and Emergency Management Authority and BU:Bogazici University) and a third one from Greece (HUSN:Hellenic Unified Seismic Network) respectively. Only the stations discussed in the text are identified. Faults are shown with black solid lines and were compiled from Emre et al. (2013). Filled squares indicate the location of major cities. Abbreviations shown are AGG, Alasehir-Gediz Graben; BaH, Babadag Horst; BG, Bakircay Graben; BMG, Buyuk Menderes Graben; BoH, Bozdag Horst; CB, Candarli Bay; DG, Denizli Graben; DH, Demirci Horst; GH, Gordes Horst; IB, Izmir Bay; KB, Kusadasi Bay; KMG, Kucuk Menderes Graben; MG, Manisa Graben; SB, Sigacik Bay; SG, Sarigol Graben; SM, Spil Mountain; URH, Umurbey-Rahmanli Horst; YMH, Yuntdagi-Maruflar Horst.
During the Oligocene-Middle Miocene, there was widespread magmatic activity in Western Anatolia, which waned at the end of the Middle Miocene. This intrusive volcanism produced high mountain ranges aligned northeast-southwest. A new set of northeast-southwest trending oblique faults were formed under the transtensional regime. This produced other grabens (e.g., Bakircay-BG placed between Gordes and Selendi cities) and horst (Demirci-DH, Gordes-GH, Yuntdagi-Maruflar-YMH, Umurbey-Rahmanli-URH) systems. During Miocene-Pliocene, the horst-graben morphology was considerably reduced as a result of severe erosion (Yang et al., 2021). Consequently, low-relief narrow plateau and horst surfaces were established. The Early to Middle Miocene volcanics, marls and pyroclastic rocks widely outcrop around those horsts (e.g., YMH).
The study area is a part of Menderes Massif and Bornova flysch zone (Okay and Altiner, 2007) the surface geology exhibits six principal geologic formations (Figure 2A). The sedimentary associations consist predominantly of undifferentiated Quaternary alluvial units. They are widely available all along graben structures. Miocene volcano-sediments generally outcrop at the western and northern part of the study area, and covered by marl and equivalent units while different formations are also emplaced (Cirmik and Pamukcu, 2017). The areas situated at the eastern and western part of Izmir city, and the south of Manisa city, are represented by Late Cretaceous units in which the Senonian flysch containing limestones, are the main formation. The massive Mesozoic (generally Jura-Late Cretaceous) aged rocks are observable at the western extremity of the study area (terrestrial area of IB) by consisting of Permo-Carboniferous or Triyas carbonates. Other massive metamorphic rocks crop out on horst structures formed mainly by gneiss and granites or quartzite with weak foliation of schists (Yilmaz et al., 2000; Akcay et al., 2006). The digital elevation models obtained from the shuttle radar topography mission (SRTM) were used to generate main highlands and basins bordered by east-west (and northeast-southwest) aligned horst and graben structures (Figure 2B).
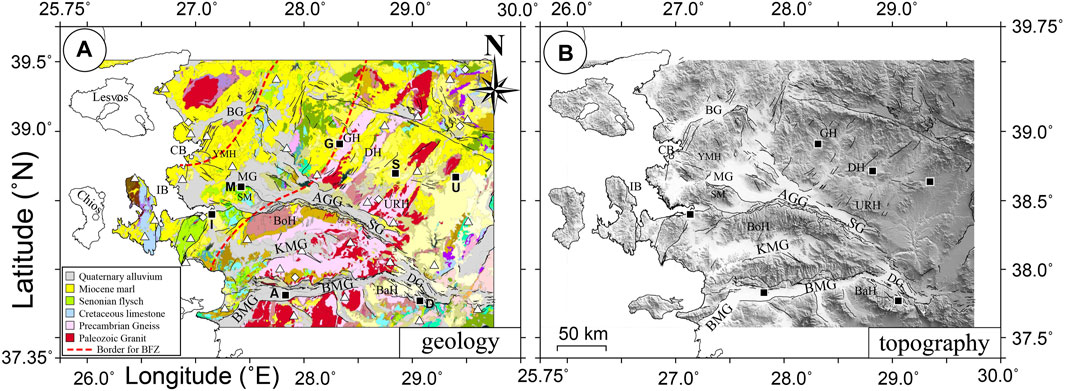
FIGURE 2. Maps for; (A) Surface geology (modified from Akbas et al., 2011), (B) Shaded relief topography. Abbreviations indicate tectonic features. BFZ means border of the Bornova flysch zone (Okay and Altiner, 2007).
The Aegean region of Türkiye is affected by frequent seismic activity, mostly of low magnitude (Coban and Sayil, 2019; Ozturk, 2019; Ankaya Pamukcu et al., 2021), and shows high heat flow (Pazvantoglu et al., 2021) and geothermal activity (Ozer and Polat, 2017a). Only few moderate earthquakes have been recorded in the study area (e.g., Mw6.2 Lesvos-Izmir earthquake on 12 June 2017, Mw6.5 Bodrum-Kos earthquake on 21 July 2017). Cities that are located in low velocity areas (e.g., Izmir, Manisa, Aydin, Denizli) were significantly affected by the recent earthquake of 30 October 2020 (Mw6.8) near Samos island, Greece. A detailed study of the damages for this event has been presented in (Dogan et al., 2021). Since the seismicity in the region is lot to moderate, it is difficult to constrain the mechanical properties of the underground structure using dispersion analysis of earthquake records. Low magnitude events are usually recorded at small distances providing information only for shallow depths. For this reason, an accurate Rayleigh wave velocity model is not available in our studied area. Such a model is necessary to better understand earthquake hazard and to define appropriate seismic risk mitigation measures (Bilen and Polat, 2022). An adequate Rayleigh wave velocity model for the crustal structure of the region would allow to improve the accuracy of hypocenter location which is critical to understand present tectonics in the region. The Aegean region of Türkiye is one of the world’s leading producers of geothermal energy (Acevedo et al., 2019; Ozer and Ozyazicioglu, 2019; Ahadov and Ozturk, 2022). For this reason, improving our knowledge of the crustal structure of this region would greatly help to better identify the relations between geology and the distribution of geothermal reservoirs.
In the last 15 years, the number of ambient noise tomography (ANT) studies has increased dramatically. They have been applied to geology characterization (Picozzi et al., 2009; Chavez-Garcia, and Raptakis, 2016; Kil et al., 2021), exploration of geothermal resources (Lehujeur et al., 2021; Ozer et al., 2022), geothermal monitoring (Obermann et al., 2015) and tectonic/fault mapping (Nicolson et al., 2012; Li and Lin, 2014; Brandmayr et al., 2016; Cubuk-Sabuncu et al., 2017; Monsalve-Jaramillo et al., 2018; Schippkus et al., 2018; Sahin et al., 2019; Zulfakriza et al., 2020; Cardenas-Soto et al., 2021; Zhang et al., 2022; Turunctur et al., 2023). The present development of broadband arrays in western Anatolia gives an opportunity to apply ANT to the determination of the crustal structure of this region. We analyze ambient noise records from stations belonging to three permanent seismologic arrays to determine the group velocity distribution of the upper crust, in particular its relation with the distribution of basins and horsts. The use of stations from three different arrays allows us to get a dense ray path coverage. We compute a tomographic inversion of our results and show velocity distribution in the 2–12 s period band. Rayleigh wave velocity variations are in good agreement with the geology of the region and confirm the reported low velocity structures which play a very important role in generating diffracted waves and amplifying ground motion in basins, where densely populated cities are usually located (Chavez-Garcia, 2007; Saygin et al., 2016; Mulumulu et al., 2020). Our results are the first contribution to build a crustal model based on Rayleigh wave group velocities, a model that is needed for the Aegean region of Türkiye.
Our data come from three different permanent networks: AFAD, BU, HUSN. All of the instruments are three-component broadband seismometers. The sensors are Guralp CMG-3ESPC or CMG-3T with a 60 s or 30 s free period for AFAD, 3ESPC or 6TD sensors for BU, and Streckheisen STS-2 or Nanometrics Trillium Trillium-120P sensors with a free period of 120 s for HUSN network. The distance between stations spans the range 10–335 km (Figure 1). We used data from total of 43 stations (32, 6, and 5 stations from AFAD, BU, and HUSN, respectively).
Velocity structure, tectonic features and the interstation distance are key factors in defining the frequency range for which ANT is useful. It has often been shown that, on the long term, the seismic noise may be approximated as a diffuse field. When this interpretation applies, long term average time-domain correlations of seismic noise between two stations approximate the Green´s function of the medium between the two observation sites (Wapenaar, 2004; Weaver and Lobkis, 2004; Roux et al., 2005). The Rayleigh wave pulse that emerges from the correlation between two stations will be symmetric about the origin time with causal (positive time) or acausal (negative time) pulses when the noise sources are evenly distributed. Chavez-Garcia and Rodriguez (2007) showed that, when the interstation distance becomes much larger than the dominant wavelength, the fundamental mode of Rayleigh waves is the most stable propagation mode in time domain. In this study, we compute time domain cross-correlations using 3 months of continuous noise data recorded in 2021. The large correlation between the vertical and radial parts indicates that Rayleigh wave propagation is dominant in the noise cross-correlations and the Love waves may also emerge in the cross-correlation of the traversal components (Campillo and Paul, 2003; Kang and Shin, 2006). We chose to analyze seismic noise recorded in the vertical component only. In this way, we can confidently identify any emerging surface wave pulse as a Rayleigh wave. We analyze on the vertical component of the noise data records to avoid ambiguity with possible Love waves. One-hour windows were selected from the continuous data streams, were baseline corrected (offset and linear trend) and the instrument response was removed. Then, a 0.04–0.5 Hz bandpass filter was applied, and the data were resampled to 25 sps. After computation of cross-correlation, the traces were normalized in the time domain (Chavez-Garcia and Rodriguez, 2007) before computing an average for each station pair. Signal-to-noise ratio (SNR) of the result was improved using the phase-weighted stack (PWS) technique (Schimmel and Gallart, 2007) to compute averages. The PWS technique enhances weak but coherent signals by stacking individual correlation windows using weights that depend on the coherence measured with instantaneous phase. Rayleigh wave group velocities were determined for each average cross-correlation function using the multiple filter technique (Dziewonski et al., 1969; Herrmann, 1985; Hermann, 2013). Finally, the spatial variations of Rayleigh wave velocity in the period range from 2 to 12 s were determined using a non-linear iterative 2-D tomography (Rawlinson et al., 2008).
We obtained 716 high quality empirical Green’s functions (EGF), with SNR larger than 10, out of a total of 903 possible pairs for 43 stations. Figure 3A shows an example of average EGFs estimated from average cross-correlations for the vertical component of INCE station and the rest of the stations. The EGFs are plotted according to interstation distance. The waveforms are asymmetrical in relation to zero lag time, implying that the noise sources were unevenly distributed. The average Rayleigh wave propagation velocity is around 2.6 km/s. Figure 3B shows average cross-correlations for AYDB-KIRA, ESEN-PASA, and KARB-SIMV station pairs with 53, 117, and 231 km interstation distances respectively. The asymmetry of the cross-correlations with respect to zero lag time is apparent at each station pair, with the signal emerging only at positive times. This means that most energy in the ambient noise wave field propagates from the southwest (AYDB, ESEN, KARB) to northeast (KIRA, PASA, SIMV). Figure 3C shows the energy distribution for these correlation functions in the period-group velocity plane showing clearly the group velocity dispersion of the fundamental mode Rayleigh-waves. A dispersion curve is easily picked from the locations of the maximum amplitudes in this plane in the period ranges 1.4 to 6 for AYDB-KIRA, 2 to 10 for ESEN-PASA and 3 to 12 for KARB-SIMV station pairs.
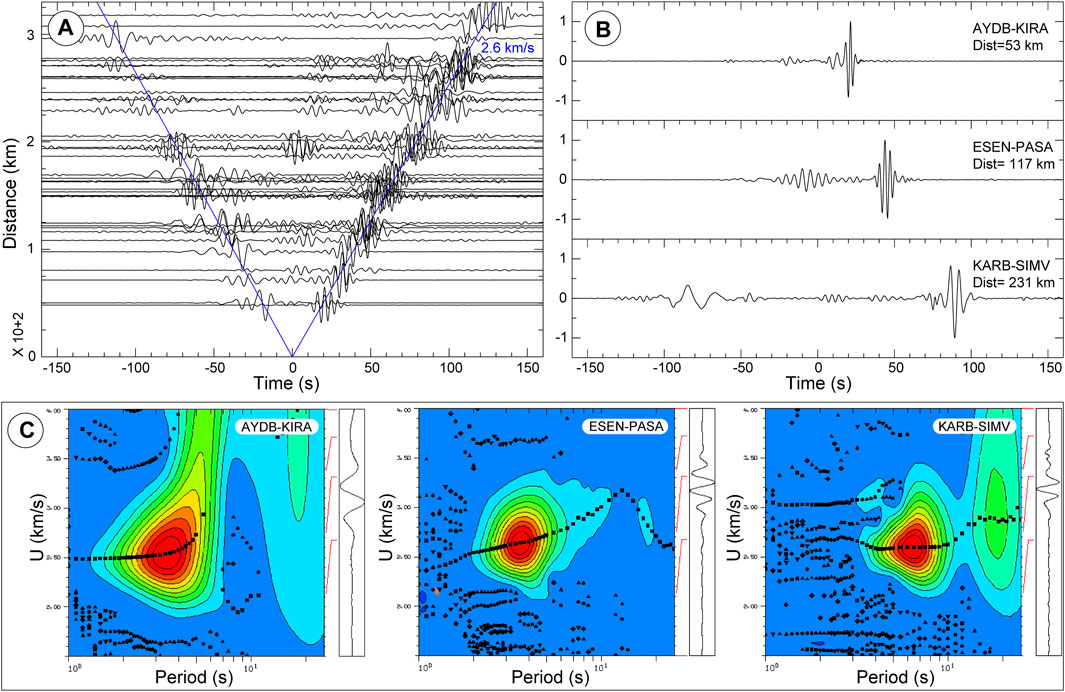
FIGURE 3. (A) Record section showing the EGFs computed for all station pairs that include station INCE plotted as a function of interstation distance. Waveforms are normalized and bandpass filtered between 0.04 and 0.5 Hz. A clear Rayleigh wave pulse propagates with a group velocity around 2.6 km/s (blue solid line). (B) Phase-weighted stacked cross-correlations for AYDB-KIRA, ESEN-PASA, and KARB-SIMV station pairs. (C) Examples of the multiple-filter analysis (MFA) for EGFs.
Given the large amount of data we have available, we are able to investigate possible variations in the results as a function of period of the year and length of the analyzed data. An example is shown in Figure 4 for two station pairs, DUV-UZP and AYVA-GDZ. We show average cross-correlation functions for the complete year of data, for the first 6 months of the year and for three different choices of a 3-month period. In spite of slight amplitude differences, the Rayleigh wave pulse is present in all cross-correlation traces, with the exception of the 3-month summer period for AYVA-GDZ station pair. Clearly, 3 months are enough to compute a reliable EGF average from cross-correlation of seismic noise, even if 1-year data allows to get a larger SNR, as shown by the relative amplitudes of the Rayleigh wave pulse and the spurious signal close to zero lag time. Figure 4 also shows again the asymmetry of our results, pointing to a non-homogeneous distribution of noise sources. Both station pairs show clear pulses for positive lag time. This suggests that source of ambient noise to the West are more energetic than noise sources to the East of the studied region.
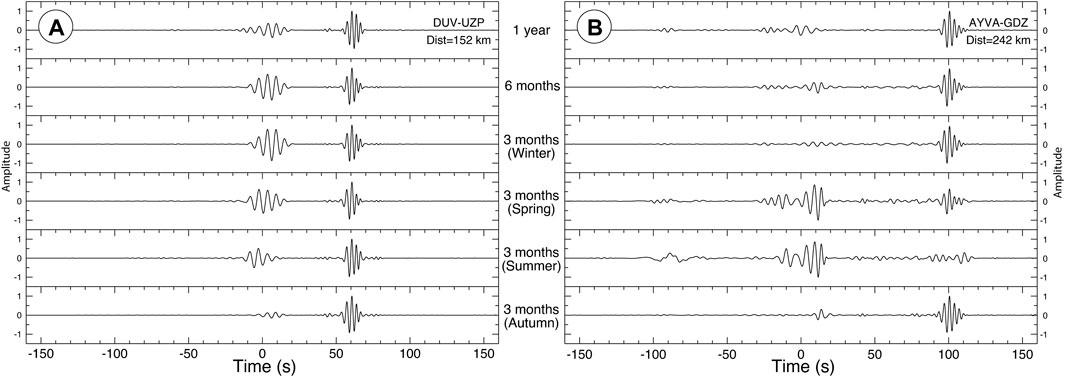
FIGURE 4. Cross-correlations for two different station pairs for different lengths of data between 3 months and the complete year and choosing different 3-month periods along the year (Winter: Dec-Jan-Feb, Spring: Mar-Apr-May, Summer: Jun-Jul-Aug, Autumn: Sep-Oct-Nov), (A) DUV-UZP. (B) AYVA-GDZ. With only one exception for a 3-month period for pair AYVA-GDZ, all traces allow to identify a clear Rayleigh pulse. All the signals are clearly asymmetric, with a useful pulse appearing only for the positive lag. Most of the energy in the ambient noise wave field for these pairs propagates from west (DUV, AYVA) to east (UZP, GDZ) directions. Location of station pairs is given in Figure 1.
Our results have no useful information for periods below 1 s (Figure 5). The number of group velocity values determined from group velocity dispersion curves for all station pairs is larger than 400 in the period range from 2 to 12 s (Figure 5A). Figure 5B shows all group velocity dispersion curves determined from ambient noise. In the period range from 2 to 12 s we observe average velocity to increase slowly between 2.5 and 2.8 km/s. However, the scatter of individual curves is quite significant, pointing to large variations in the studied area. The values of period for which a group velocity could be measured is weakly correlated with distance between station pairs. As distance increases, the minimum period value for which a group velocity could be estimated also increases but the increment is small (Figure 5C).
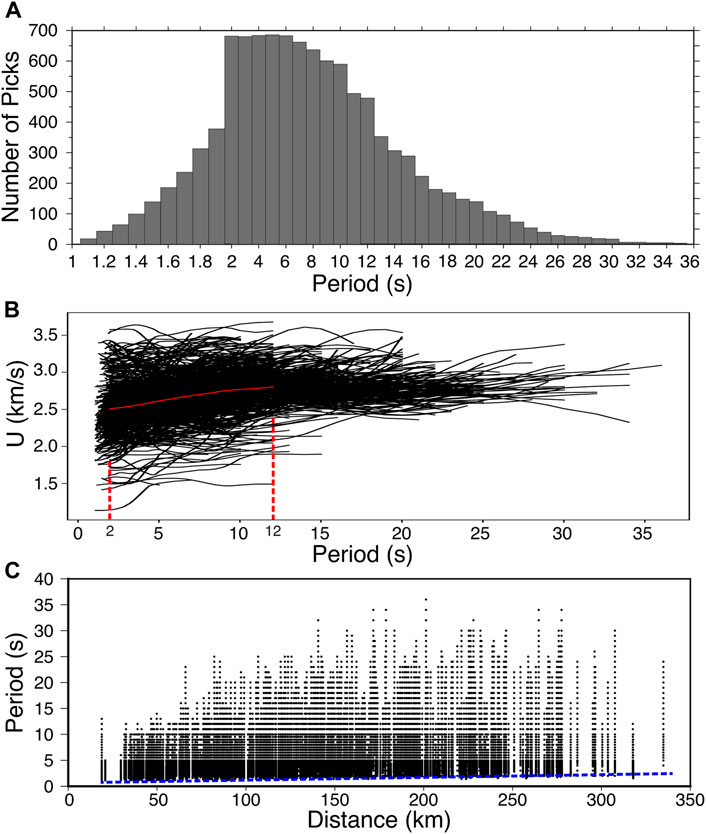
FIGURE 5. Rayleigh wave group velocity values as a function of period. (A) Number of individual group velocity estimates for each period. (B) All group velocity dispersion curves are plotted together. Average group velocities (indicated by the red solid line) vary from 2.5 to 2.8 km/s between 2 and 12 s period. (C) Distribution of period values for which a group velocity was estimated as a function of distance between station pairs. Group velocities were determined mainly for period values below 12 s. The dashed line at the bottom of the plot highlights the small increase in minimum period with increasing distance between station pairs.
Each dispersion curve determined from ambient noise cross-correlation corresponds to the average group velocity between the two stations analyzed, that is a given path along the surface. Given the large number of paths for which we have information, it is possible to compute a tomography inversion to determine Rayleigh wave group velocity variations along the surface of the region. If we analyze group velocities for each period value, the problem is inherently 2D given that Rayleigh waves propagate along the free surface. Structural variations with depth will be revealed by velocity shifts as a function of period. We have analyzed periods between 2 and 12 s with 1 s increment. After measuring the group velocities between available stations, the tomography of the medium is computed and the spatial variations of Rayleigh wave velocities are mapped. We applied the Fast Marching Surface Tomography (FMST) algorithm, which is a non-linear tomographic inversion scheme combining forward computation with a subspace inversion method (Rawlinson and Sambridge, 2005). At each iteration, travel times are computed from the length of the path crossing each square cell and its current group velocity and compared with the observed travel time for each path. The error between observed and computed travel times is used in a standard L-curve analysis to determine the optimum damping (ε) and smoothing (η) parameters. These parameters control the trade-off between data fit and model perturbation relative to the reference model and model smoothness. The damping factor ensures that the changes in the model remain small at each iteration. The smoothness of the solution model is determined by the smoothing factor. The optimal damping and smoothing parameters are searched between 0 and 1,000. We found the optimal damping and smoothing parameters to be ε = 11 and η = 11 from the trade-off curves. The optimal parameters ensure a reasonable enhancement in data fitness. For the starting model, we used a constant velocity field calculated from the average velocity of all dispersion measurements for each working period. The error is estimated using the root mean square (rms) given by:
where n is the number of travel times available for each period, tm is the computed travel time and to is the observed travel time for path number i. The final misfit between observed and the calculated are given in Table 1.
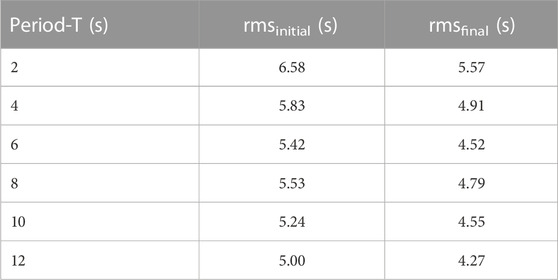
TABLE 1. Traveltime misfit values for the starting and final models of the group velocity map inversion. The root mean square (rms) is calculated using Eq. 1.
Synthetic checkerboard tests were used to determine the resolution of the available paths. We set an initial 2-D problem composed of an alternating pattern of low and high velocity perturbations in checkerboard models. Different cell sizes between 0.15o and 0.30o were evaluated. Using a cell size of 0.2o, the checkerboard perturbation models are recovered satisfactorily. Figure 6A shows the checkerboards that were recovered from the inversion using our available paths. Figure 6B shows the ray paths that were used to recover the checkerboard test models. The number of ray paths that were used for periods of 2, 44, and 6 s, are 682, 684, and 683 respectively. For longer periods, the number of available paths decreases down to 479 for 12 s. The synthetic test results show that the velocity pattern is well recovered for periods up to 12 s, even if the number of available paths is smaller.
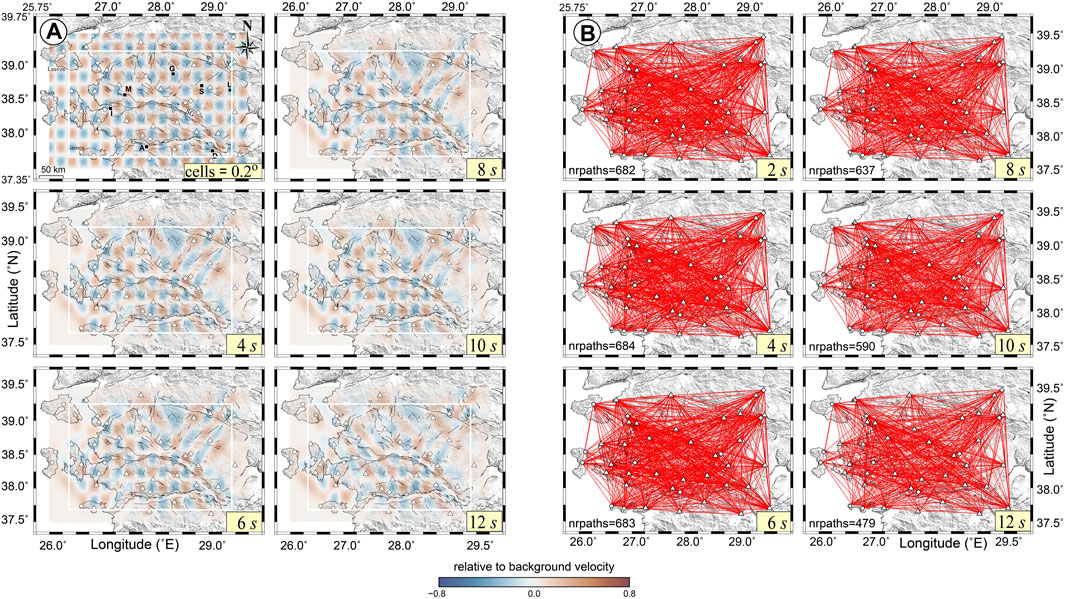
FIGURE 6. Maps for; (A) the checkerboard resolution tests for periods up to 12 s. First figure shows initial checkerboard model. The white rectangles identify the region where the results are satisfactory. The input of the checkerboard tests is an alternating pattern of positive and negative velocity squares with a maximum perturbation of 0.8 km/s. A, D, G, I, M, S, U are the cities of Aydin, Denizli, Gordes, Izmir, Manisa, Selendi, and Usak, respectively. Other abbreviated letters indicate name of tectonic features (see Figure 1), (B) distribution of ray paths for each period. The number of available ray paths (nrpaths) at different periods are given on the lower corners of each panel.
Figure 7 shows the final group velocity distribution maps obtained from our data as a function of period between 2 and 12 s. Although uneven distribution of available propagation paths may cause artifacts, no evident smearing effects are observed in our results with the exception of cells at the edges for which very fewer paths are available. We have defined a region where we considered our results reliable using the number of paths within each cell. Arbitrarily, we chose 30 paths as a minimum and consider that cells including at least that number of paths have a group velocity that is well constrained.
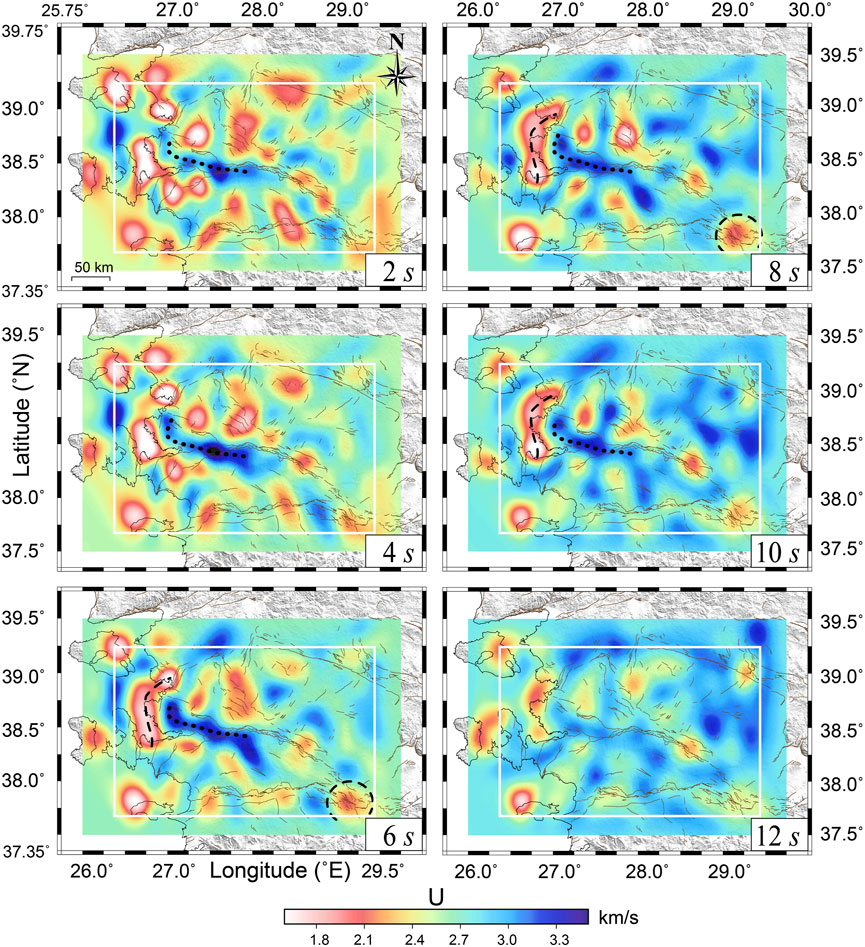
FIGURE 7. Rayleigh wave velocity maps obtained from our tomography analysis for 2, 4, 6, 8, 10, and 12 s. Group velocities are mostly in the 1.8–3.3 km/s range. The area that we considered is well resolved area is indicated by white rectangles. The thick dashed and dotted lines follow our interpreted low (LVZ) and high (HVZ) velocity zones.
It is generally accepted that Rayleigh waves group velocities are sensitive to shear wave velocities at depths about half their wavelength (Szanyi et al., 2013; Dias et al., 2015; Martha et al., 2017; Sarjan et al., 2021). On the other hand, computation of sensitivity kernels (Nicolson et al., 2012; Li and Lin, 2014) showed that fundamental-mode Rayleigh wave group velocities at about 10–12 s periods can detect the shear wave structure at depths between 12 and 15 km. We cannot estimate wavelength as it depends on phase velocity. However, group and phase velocities will be similar if group velocities are relatively constant, as they are in our results. Therefore, we may estimate that our results reflect shear wave structure in the 1–10 km depth range.
In the 2–4 s period range, the western part of the studied region, including inland and offshore areas, is characterized by a low velocity zone (LVZ) with a group velocity about 1.8 km/s. In addition, there is a distinct high velocity zone (HVZ) in the middle of the studied area with a group velocity of 3 km/s. This high velocity zone, indicated by a thick dotted line in Figure 6, is elongated at an almost W-E direction and bends to a N-S direction at its western end, following precisely Bozdag Horst (BoH in Figure 1). This velocity maximum stands out because sedimentary basins its north and south are characterized by low velocities. In the northern part of the studied area, between latitude 38.5 and 39, a sequence of low and high velocities appear which most likely correspond to the horst-graben systems in the area.
In the period range between 6 and 10 s, low velocity anomalies are predominant in offshore areas. With increasing period, these anomalies form a N-S oriented single body (highlighted by a thick dashed line in Figure 7). This LVZ (group velocity smaller than 2.0 km/s) appears consistently up to 10 s period. It probably corresponds to a thick sedimentary sequence in the area. Most of the LVZs and HVZs that were identified at smaller periods, may still be observed at 10 s period. Velocities of horst and graben structures increase with period. In the maps for 6 and for 8 s period, we have emphasized a low velocity anomaly in the southeast corner of the studied area with a thick dashed circle. For smaller periods, this anomaly shows relatively high velocities (about 2.4 km/s), which decrease to 2.1 km/s at 6 and 8 s period. We interpret this feature as a small horst inside a larger basin.
At 12 s, the observed offshore low velocity zone may still be identified with a smaller spatial extension and with a group velocity that increases from 1.9 to 2.3 km/s. Other prominent LVZs exist in inland (e.g., MG, AGG) with velocity in the range 2.3–2.5 km/s, close to horst structures (e.g., URH, DH). The basin in the southeast end of the study area, has a velocity of ∼2.5 km/s. On the other hand, a HVZ seen near the URH becomes prominent with a velocity increase from 2.9 (at 6 s) to 3.4 km/s.
We will now compare our tomography results with previous observations in our studied area. Our results for Rayleigh wave group tomography correlate well with the geological and tectonic characteristics in the study area. In general, group velocity results are limited with low period ranges (thin crustal depths) in the study region where a clear fault zone signature is not present as similarly suggested by Fichtner et al. (2013) and Delph et al. (2015).
For comparison, a tomographic image of the surface group wave velocity obtained from this study for 2 s period (Figure 8A) is shown together with Bouger gravity anomaly (Figure 8B), heat flow (Figure 8C), and magnetic (Figure 8D) results reported by Gonenc et al., 2012, Pamukcu et al., 2019, Pazvantoglu et al., 2021; Teknik et al., 2023.
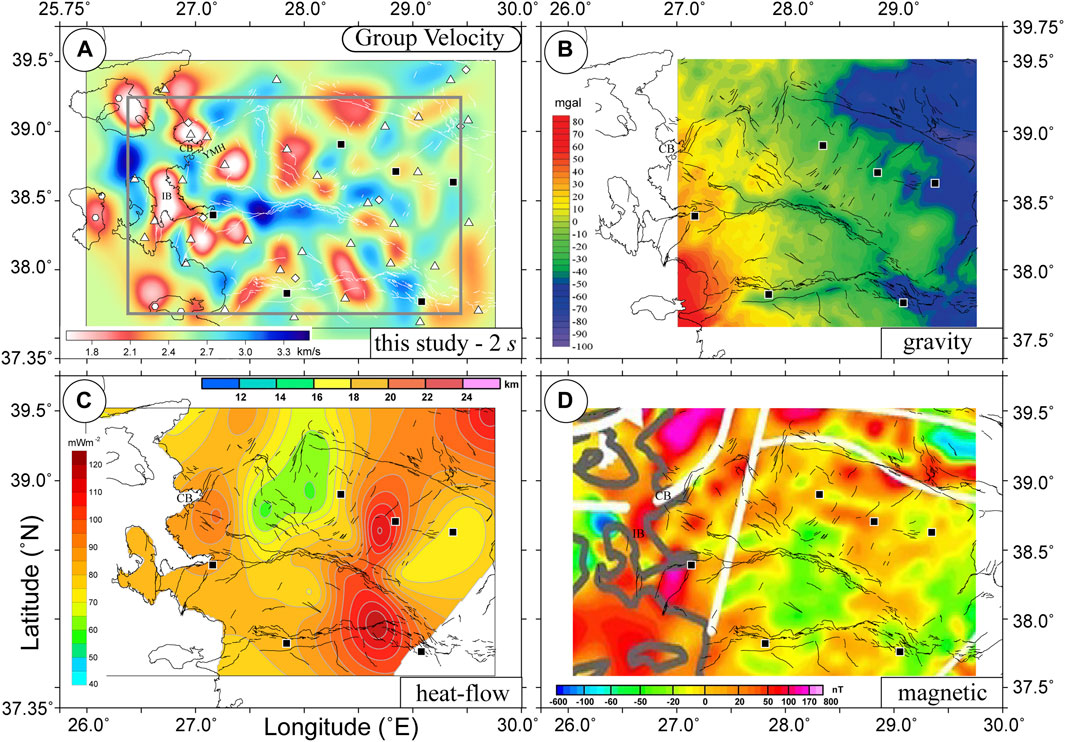
FIGURE 8. Maps for; (A) Surface group velocity of this study, (B) Gravity anomaly (Gonenc et al., 2012), (C) Heat flow (Pazvantoglu et al., 2021), and (D) Magnetic (Teknik et al., 2023).
We interpret the low velocity zones in offshore areas (e.g., IB, CB) as sedimentary sequences overlying a Miocene basement. The size of the IB low velocity zone is 50 × 20 km (Figure 8A). The IB low velocity zone has been recently mapped down to 1.7 km depth on an SW-NE aligned seismic reflection profile with a Vp about 2.4 km/s (Altan et al., 2023), in good agreement with our result (<1.6 km/s for Rayleigh waves). The size of the other low velocity body (CB) is 20 × 20 km, mainly inland. These low velocity bodies are bounded by a high velocity ridge confirming the ridge-basin structure and the ongoing erosional surfaces (Goktas, 2016). Between 6 and 10 s periods, these low velocity zones are clear and combine in a single structure with a slight velocity increase from 1.8 km/s to 2.1 km/s. A different concave arc-shape low velocity structure (80 km long) appears between IB and CB, and persists at 10 s period, for which sediment thickness has been estimated between 5 km and 9.75 km using magnetic inversion, Curie depths, and local earthquakes, respectively (Ozer and Polat, 2017b; c). For periods larger than 12 s, the offshore low velocity zone disappears (Figure 7). Teknik et al. (2023) identified a large magnetic anomaly (∼100 nT) at the location of LVZ’s aligned on IB and CB (Figure 8D), which he associated to magmatic intrusions. Hence, IB and CB may be interpreted as having a volcanic origin and may represent the Late Miocene extensional period that affected the study area. Inland, our low velocity anomalies are in good agreement with high heat flow and low magnetic values around 28.5oE-38.0oN up to 6 s period, supporting their interpretation in terms of tectonic and volcanic activity.
Our results are relevant in relation to geothermal energy in Türkiye. 80% of the Turkiye’s geothermal energy is produced in the Aegean region (Ozer and Ozyazicioglu, 2019). Geothermal fields are dependent on a heat source (such as the cooling magma mass), a permeable reservoir rock, an impermeable overburden, and large water circulation (Ozguler et al., 1983). The combination of low seismic velocities and high heat flow surrounded by fault systems are important factors. Our low velocity zones (<2.3 km/s) are correlated with high heat flow values (>100 mWm−2), positive magnetic anomalies (>10 nT) and low body (Vp) waves (Ozer and Polat, 2018) around E-W aligned grabens such as Alasehir-Gediz, Sarigol and Buyuk Menderes. These areas coincide with operating geothermal power plants. Similar combinations of those factors are also clear around latitude 39 and longitude 27. There are two distinct low velocity zones located NW and SE of the Yuntdagi-Maruflar Horst (YMH). These areas show low Vp (<4 km/s), high heat flow (>85 mWm−2) and positive magnetic anomalies (>20 nT) making them suitable candidates for geothermal exploration.
The low velocities (<1.7 km/s) observed around offshore areas between latitude 38–39 and longitude 26.5–2.75. These areas highlight large magnetic anomalies (>40 nT) and neighboring inland parts highlight large heat flows (>90 mWm−2). Except for a few initiatives in Indonesia and Iceland (Karason et al., 2013; Sircar et al., 2023), the offshore geothermal technology has only had small-scale developments. However, if societal requirements push for the development of offshore geothermal facilities, we are convinced that the low velocity zones delineated in our study are very attractive targets, as suggested by Altan et al. (2023).
In areas of lot to moderate seismicity, it is not possible to get enough earthquake data to explore the subsurface structure using tomographic methods. This is certainly the case of the Aegean region of Türkiye, where detailed information about the subsurface velocity structure is an acute necessity to better understand seismicity and to mitigate its effects. We have taken advantage of one whole year of seismic noise data recorded by 43 broadband stations belonging to three different networks to examine the subsurface structure using cross correlation of ambient noise. Average cross-correlation of seismic noise allows estimating the Green’s function between station pairs, from which surface waves may be identified. We have used the vertical component to identify without ambiguity Rayleigh waves pulses. Multiple filter analysis allowed us to compute group velocity between station pairs in the period range from 2 to 12 s. Out of a possible 903 station pairs, we estimated group velocities for a total of 716 paths in our studied region. These velocities were used to compute tomographic maps of Rayleigh waves group velocities.
The quantity and quality of our results allowed us to rule out significant seasonal variation in the ambient noise records. We showed that 3 months period was enough to get a reliable result. Fault limits between east-west oriented grabens and horsts (including northeast-southwest aligned narrow horst blocks) are readily identified in our velocity maps. Our results are in very good agreement with the geologic and tectonic characteristics of the region, showing low velocities for the Quaternary alluvial basins, moderate velocities for Cretaceous rocks, and high velocities for the regions where gneiss and granitoid basement rocks outcrop. Thus, our results are able to characterize geological features in the region in terms of velocity structure. Moreover, our velocity maps allow us to correlate velocity structures as a function of period with gravity, magnetic, and heat-flow anomalies that have been lined to geothermal energy production areas. This good correlation allows us to point to offshore areas that have a high potential for future geothermal energy development.
We have shown that ambient noise tomography is a very useful tool to characterize Western Anatolia in terms of Rayleigh wave group velocities. The results are well correlated with geology and tectonics, and also with very different geophysical measurements, making ambient noise tomography a useful complement. This is especially the case in the exploration of new geothermal energy prospects. Of course, the regional character of the networks used limited strongly the results in the low period range. For this reason, our results are limited at the local scale. The objective of a follow-up manuscript will focus on estimation of a 3-D shear-wave velocity structure of the Aegean region of Türkiye from the inversion of group velocity dispersion curves.
The datasets presented in this study can be found in online repositories. The names of the repository/repositories and accession number(s) can be found below: http://tdvms.afad.gov.tr, http://www.koeri.boun.edu.tr/sismo/2/en, http://www.geophysics.geol.uoa.gr/stations/gmaps3/leaf_stations.php?map=2&lng=en.
EM: Conceptualization, Data curation, Formal Analysis, Investigation, Methodology, Resources, Software, Supervision, Validation, Visualization, Writing–review and editing. OP: Funding acquisition, Project administration, Writing–original draft, Writing–review and editing. FC-G: Formal Analysis, Methodology, Software, Validation, Writing–review and editing.
The author(s) declare financial support was received for the research. This research is supported by Dokuz Eylul University (DEU-BAP) with the project number of FDK-2023-3133.
This research is a part of the PhD thesis of EM in Dokuz Eylul University (DEU), Izmir-Türkiye, and supported by DEU-BAP with the project number FDK-2023-3133. We are grateful to the editor, Claudia Pavez-Orrego, and two reviewers for their critical remarks, which helped us to improve the original manuscript. The first author spent a considerable time of his PhD in Mexico City for this work, with support from the international exchange program of Coordinación de la Investigación Científica of Universidad Nacional Autónoma de México (UNAM). The authors thank the Disaster and Emergency Management Authority (AFAD, Türkiye), Bogazici University (BU, Türkiye) and Hellenic Unified Seismic Network (HUSN, Greece) for making their data publicly available via an open access web portal. The numerical computations reported in this research benefited from the 168-core Linux processors at ULAKBIM High Performance and Grid Computing Center (TRUBA resources) of the TUBITAK (The Scientific and Technological Research Council of Türkiye). Topography was obtained from the SRTM image (doi: 10.5066/F7K072R7). The Seismic Analysis Code (SAC) and Generic Mapping Tools (GMT) were used for preparing the plots (Wessel et al., 1995; Goldstein et al., 2003; Goldstein and Snoke 2005).
The authors declare that the research was conducted in the absence of any commercial or financial relationships that could be construed as a potential conflict of interest.
All claims expressed in this article are solely those of the authors and do not necessarily represent those of their affiliated organizations, or those of the publisher, the editors and the reviewers. Any product that may be evaluated in this article, or claim that may be made by its manufacturer, is not guaranteed or endorsed by the publisher.
Acevedo, J., Fernandez-Viejo, G., Llana-Funez, S., Lopez-Fernandez, C., and Olona, J. (2019). Ambient noise tomography of the southern sector of the Cantabrian Mountains, NW Spain. Geophys. J. Int. 219, 479–495. doi:10.1093/gji/ggz308
Ahadov, B., and Ozturk, S. (2022). Spatial variations of fundamental seismotectonic parameters for the earthquake occurrences in the Eastern Mediterranean and Caucasus. Nat. Hazards 111 (3), 2177–2192. doi:10.1007/s11069-021-05170-1
Akbas, B., Akdeniz, N., Aksay, A., Altun, I. E., Balci, V., Bilginer, E., et al. (2011). Geological map of Turkiye, 1:1.250.000 scale. Ankara, Turkiye: General Directorate of Mineral Research and Exploration (MTA), Special publication series-30.
Akcay, M., Ozkan, H. M., Moon, C. J., and Spiro, B. (2006). Geology, mineralogy and geochemistry of the gold-bearing stibnite and cinnabar deposits in the Emirli and Halıköy areas (Ödemiş, İzmir, West Turkey). Ore Geol. Rev. 29 (1), 19–51. doi:10.1016/j.oregeorev.2004.12.006
Altan, Z., Ocakoglu, N., and Bohm, G. (2023). Neogene stratigraphic architecture and three-dimensional velocity structure beneath the Gulf of İzmir (western Anatolia) from reflection traveltime tomography. J. Asian Earth Sci. 244, 105538. doi:10.1016/j.jseaes.2022.105538
Ankaya Pamukcu, O., Dogru, F., Cirmik, A., and Gones, D. (2021). Seismic a and b-values and crustal parameters of Samos island-aegean sea, Lesvos island-Karaburun, Chios island-Gökova bay earthquakes. Turkish J. Earth Sci. 30 (S1), 833–850. doi:10.3906/YER-2107-13
Bilen, E., and Polat, M. (2022). Opinions of the teacher candidates concerning earthquake awareness. Turkish J. Earth Sci. 4 (1), 155–173. doi:10.46464/tdad.1098199
Brandmayr, E., Kuponiyi, A. P., Arroucau, P., and Vlahovic, G. (2016). Group velocity tomography of the upper crust in the eastern Tennessee seismic zone from ambient noise data. Tectonophysics 688, 148–156. doi:10.1016/j.tecto.2016.09.035
Campillo, M., and Paul, A. (2003). Long-range correlations in the diffuse seismic coda. Science 299, 547–549. doi:10.1126/science.1078551
Cardenas-Soto, M., Reyes-Pimentel, T. A., Tago, J., and Natarajan, T. (2021). Ambient noise tomography of the Popocatepetl volcano using the principal Green tensor components. J. Seismol. 25, 1089–1102. doi:10.1007/s10950-021-10021-4
Chavez-Garcia, F. J. (2007). “Site effects: from observation and modelling to accounting for them in building codes,” in Earthquake geotechnical engineering. Editor K. D. Pitilakis (Dordrecht, NL: Springer), 53–72.
Chavez-Garcia, F. J., and Raptakis, D. (2017). Local amplification and subsoil structure at a difficult site: understanding site effects from different measurements. Soil Dyn. Earthq. Eng. 92, 334–344. doi:10.1016/j.soildyn.2016.10.008
Chavez-Garcia, F. J., and Rodriguez, M. (2007). The correlation of microtremors: empirical limits and relations between results in frequency and time domains. Geophys. J. Int. 171, 657–664. doi:10.1111/j.1365-246X.2007.03529.x
Cirmik, A., and Pamukcu, O. (2017). Clarifying the interplate main tectonic elements of Western Anatolia, Turkey by using GNSS velocities and Bouguer gravity anomalies. J. Asian Earth Sci. 148, 294–304. doi:10.1016/j.jseaes.2017.09.001
Coban, K. H., and Sayil, N. (2019). Evaluation of earthquake recurrences with different distribution models in western Anatolia. J. Seismol. 23, 1405–1422. doi:10.1007/s10950-019-09876-5
Cubuk-Sabuncu, Y., Taymaz, T., and Fichtner, A. (2017). 3-D crustal velocity structure of western Turkey: constraints from full-waveform tomography. Phys. Earth Planet. Interiors 270, 90–112. doi:10.1016/j.pepi.2017.06.014
Delph, J. R., Biryol, C. B., Beck, S. L., and Zandt, G. (2015). Shear wave velocity structure of the Anatolian Plate: anomalously slow crust in southwestern Turkey. Geophys. J. Int. 202, 261–276. doi:10.1093/gji/ggv141
Dias, R. C., Julia, J., and Schimmel, M. (2015). Rayleigh-wave, group-velocity tomography of the Borborema province, NE Brazil, from ambient seismic noise. Pure Appl. Geophys. 172, 1429–1449. doi:10.1007/s00024-014-0982-9
Dogan, G. G., Yalciner, A. C., Yuksel, Y., Ulutas, E., Polat, O., Guler, I., et al. (2021). The 30 October 2020 Aegean Sea tsunami: post-event field survey along Turkish coast. Pure Appl. Geophys. 178 (3), 785–812. doi:10.1007/s00024-021-02693-3
Dziewonski, A., Bloch, S., and Landisman, M. (1969). A technique for the analysis of transient seismic signals. Bull. Seismol. Soc. Am. 59, 427–444. doi:10.1785/BSSA0590010427
Emre, O., Duman, T. Y., Ozalp, S., Elmaci, H., Olgun, S., and Saroglu, F. (2013). Active fault map of Turkiye with an explanatory text, 1:1.250.000 scale. General Directorate of Mineral Research and Exploration (MTA), Special publication series-30, Ankara, Turkiye.
Fichtner, A., Saygin, E., Taymaz, T., Cupillard, P., Capdeville, Y., and Trampert, J. (2013). The deep structure of the North Anatolian Fault zone. Earth Planet. Sci. Lett. 373, 109–117. doi:10.1016/j.epsl.2013.04.027
Goktas, F. (2016). Neogene stratigraphy of the izmir-outer-bay islands. Bull. Mineral Res. Explor., 1–24. doi:10.19111/bmre.86643
Goldstein, P., Dodge, D., Firpo, M., and Lee, M. (2003). “SAC2000: signal processing and analysis tools for seismologists and engineers,” in The IASPEI international handbook of earthquake and engineering seismology. Editors W. H. K. Lee, H. Kanamori, P. C. Jennings, and C. Kisslinger (London: Academic Press).
Goldstein, P., and Snoke, A. (2005). SAC availability for the IRIS community. Incorporated Institutions for Seismology Data Management Center Electronic Newsletter.
Gonenc, T., Pamukcu, C., and Deliormanli, A. H. (2012). The investigation of hot spots in western anatolia by geophysical and mining approaches. Energy Sources, Part A Recovery, Util. Environ. Eff. 34 (9), 775–792. doi:10.1080/15567031003627914
Herrmann, R. B. (1985). Computer programs in seismology, 8. Saint Louis, MO: Saint Louis University.
Herrmann, R. B. (2013). Computer programs in seismology: an evolving tool for instruction and research. Seismol. Res. Lett. 84 (6), 1081–1088. doi:10.1785/0220110096
Jolivet, L., Faccenna, C., Huet, B., Labrousse, L., Le Pourhiet, L., Lacombe, O., et al. (2013). Aegean tectonics: strain localisation, slab tearing and trench retreat. Tectonophysics 1-33, 1–33. doi:10.1016/j.tecto.2012.06.011
Kang, T.-S., and Shin, J. S. (2006). Surface-wave tomography from ambient seismic noise of accelerograph networks in southern Korea. Geophys. Res. Lett. 33, L17303. doi:10.1029/2006GL027044
Karason, B., Gudjonsdottir, M. S., Valdimarsson, P., and Thorolfsson, G. (2013). Utilization of offshore geothermal resources for power production. 38.workshop on geothermal reservoir engineering on 11-13 February 2013. Stanford, California: Stanford University.
Kil, D., Hong, T. K., Chung, D., Kim, B., Lee, J., and Park, S. (2021). Ambient noise tomography of upper crustal structures and Quaternary faults in the Seoul metropolitan area and its geological implications. Earth Space Sci. 8, e2021EA001983. doi:10.1029/2021EA001983
Lehujeur, M., Chevrot, S., Villasenor, A., Masini, A., Saspiturry, N., Lescoutre, R., et al. (2021). Three-dimensional shear velocity structure of the Mauleon and Arzacq basins (western Pyrenees). BSGF - Earth Sci. Bull. 192, 47. doi:10.1051/bsgf/2021039
Li, P., and Lin, G. (2014). Adaptive ambient noise tomography and its application to the Garlock Fault, southern California. Geophys. J. Int. 197, 1236–1249. doi:10.1093/gji/ggu073
Martha, A. A., Cummins, P., Saygin, E., Widiyantoro, S., and Masturyono, (2017). Imaging of upper crustal structure beneath East Java-Bali, Indonesia with ambient noise tomography. Geosci. Lett. 4, 14. doi:10.1186/s40562-017-0080-9
Monsalve-Jaramillo, H., Valencia-Mina, W., Cano-Saldana, L., and Vargas, C. A. (2018). Modeling subduction earthquake sources in the central-western region of Colombia using waveform inversion of body waves. J. Geodyn. 116, 47–61. doi:10.1016/j.jog.2018.02.005
Mulumulu, E., Ozer, C., Gok, E., Chavez-Garcia, F. J., and Polat, O. (2020). Doğal gürültü tomografisinden İzmir İç Körfezi’nin 3-B üst kabuk hiz yapisi. J. Fac. Eng. Archit. Gazi Univ. 35 (1), 255–274. doi:10.17341/gazimmfd.460109
Nicolson, H., Curtis, A., Baptie, B., and Galetti, E. (2012). Seismic interferometry and ambient noise tomography in the British Isles. Proc. Geologists' Assoc. 123 (1), 74–86. doi:10.1016/j.pgeola.2011.04.002
Obermann, A., Kraft, T., Larose, E., and Wiemer, S. (2015). Potential of ambient seismic noise techniques to monitor the St. Gallen geothermal site (Switzerland). J. Geophys. Res. Solid Earth 120, 4301–4316. doi:10.1002/2014JB011817
Okay, A. I., and Altiner, D. (2007). A condensed mesozoic succession north of Izmir: a fragment of the Anatolide-Tauride platform in the Bornova flysch zone. Turk J. Earth Sci. 16 (3), 1. Available at: https://journals.tubitak.gov.tr/earth/vol16/iss3/1.
Ozdemir, A., and Ince, I. (2005). Geology seismotectonics and soil liquefaction susceptibility of Ilgın (west-central part of Turkey) residential area. Eng. Geol. 77 (1-2), 169–188. doi:10.1016/j.enggeo.2004.10.002
Ozer, C., Ozturk, S., and Pamuk, E. (2022). Tectonic and structural characteristics of Erzurum and its surroundings (Eastern Turkey): a detailed comparison between different geophysical parameters. Turkish J. Earth Sci. 31, 1–6. doi:10.3906/yer-2106-18
Ozer, C., and Ozyazicioglu, M. (2019). The local earthquake tomography of Erzurum (Turkey) geothermal area. Earth Sci. Res. J. 23 (3), 209–223. doi:10.15446/esrj.v23n3.74921
Ozer, C., and Polat, O. (2017a). Local earthquake tomography of Izmir geothermal area, Aegean region of Turkey. Boll. Geofis. Teor. Appl. 58 (1), 17–42. doi:10.4430/bgta0191
Ozer, C., and Polat, O. (2017b). İzmir ve çevresinin 3-B kabuk hız yapısı. J. Fac. Eng. Archit. Gazi Univ. 32 (3), 733–747. doi:10.17341/gazimmfd.337620
Ozer, C., and Polat, O. (2017c). İZMİR VE ÇEVRESİNİN 1-B (BİR-BOYUTLU) SİSMİK HIZ YAPISININ BELİRLENMESİ. J. Sci. Eng. 19, 147–168. doi:10.21205/deufmd.2017195512
Ozer, C., Gok, E., and Polat, O. (2018). Three-Dimensional seismic velocity structure of the Aegean region of Turkey from local earthquake tomography. Ann. Geophys. 61 (1), SE111. doi:10.4401/ag-7543
Ozguler, M. E., Turgay, C., and Sahin, H. (1983). Geophysical studies in Denizli geothermal field. MTA J. 99–100. https://dergipark.org.tr/tr/download/article-file/583139.
Ozturk, S. (2015). A study on the correlations between seismotectonic b-value and Dc-value, and seismic quiescence Z-value in the Western Anatolian region of Turkey. Austrian J. Earth Sci. 108 (2), 172–184. doi:10.17738/ajes.2015.0019
Pamukcu, O., Gonenc, T., Cirmik, A., Pamukcu, C., and Erturk, N. (2019). The geothermal potential of büyük menderes graben obtained by combined 2.5-d normalized full gradient results. Pure Appl. Geophys. 176 (11), 5003–5026. doi:10.1007/s00024-019-02227-y
Pazvantoglu, E., Erkan, K., Salk, M., Akkoyunlu, B. O., and Tayanc, M. (2021). Surface heat flow in western Anatolia (Turkey) and implications to the thermal structure of the Gediz graben. Turkish J. Earth Sci. 30 (9), 1. doi:10.3906/yer-2105-28
Picozzi, M., Parolai, S., Bindi, D., and Strollo, A. (2009). Characterization of shallow geology by high-frequency seismic noise tomography. Geophys. J. Int. 176, 164–174. doi:10.1111/j.1365-246X.2008.03966.x
Rawlinson, N., Hauser, J., and Sambridge, M. (2008). Seismic ray tracing and wave front tracking in laterally heterogeneous media. Adv. Geophys. 49, 203–273. doi:10.1016/S0065-2687(07)49003-3
Rawlinson, N., and Sambridge, M. (2005). The fast marching method: an effective tool for tomographic imaging and tracking multiple phases in complex layered media. Explor. Geophys. 36, 341–350. doi:10.1071/EG05341
Roux, P., Sabra, K. G., Kuperman, W. A., and Roux, A. (2005). Ambient noise cross correlation in free space: theoretical approach. J. Acoust. Soc. Am. 117, 79–84. doi:10.1121/1.1830673
Sahin, S., Abubakar, I., Ozcelik, M., Abdelwahed, M. F., and Oksum, E. (2019). Neotectonic structures imaged by seismic velocity along the Isparta angle. Arab. J. Geosci. 12, 230. doi:10.1007/s12517-019-4377-1
Sarjan, A. F. N., Zulfakriza, Z., Nugraha, A. D., Rosalia, S., Wei, S., Widiyantoro, S., et al. (2021). Delineation of upper crustal structure beneath the island of Lombok, Indonesia, using ambient seismic noise tomography. Front. Earth Sci. 9, 560428. doi:10.3389/feart.2021.560428
Saygin, E., Cummings, P. R., Cipta, A., Hawkins, R., Pandhu, R., Murjaya, J., et al. (2016). Imaging architecture of the Jakarta Basin, Indonesia with transdimensional inversion of seismic noise. Geophys. J. Int. 204 (2), 918–931. doi:10.1093/gji/ggv466
Schimmel, M., and Gallart, J. (2007). Frequency-dependent phase coherence for noise suppression in seismic array data. J. Geophys. Res. 112, B04303. doi:10.1029/2006JB004680
Schippkus, S., Zigone, D., and Bokelmann, G.the AlpArray Working Group (2018). Ambient-noise tomography of the wider Vienna Basin region. Geophys. J. Int. 215, 102–117. doi:10.1093/gji/ggy259
Sircar, A., Bist, N., and Yadav, K. A. (2023). A comprehensive review on exploration and exploitation of offshore geothermal energy. Mar. Syst. Ocean. Techol. 17, 135–146. doi:10.1007/s40868-022-00120-3
Szanyi, G., Graczer, Z., and Gyori, E. (2013). Ambient seismic noise Rayleigh wave tomography for the Pannonian basin. Acta Geod. geophys. 48, 209–220. doi:10.1007/s40328-013-0019-3
Teknik, V., Artemieva, I. M., and Thybo, H. (2023). Geodynamics of the central Tethyan belt revisited: inferences from crustal magnetization in the Anatolia-Caucasus-Black Sea region. Tectonics 42, e2022TC007282. doi:10.1029/2022TC007282
Turunctur, B., Eken, T., Chen, Y., Taymaz, T., Houseman, G. A., and Saygin, E. (2023). Crustal velocity images of northwestern Turkiye along the North Anatolian Fault Zone from transdimensional bayesian ambient seismic noise tomography. Geophys. J. Int. 234 (1), 636–649. doi:10.1093/gji/ggad082
Wapenaar, K. (2004). Retrieving the elastodynamic Green’s function of an arbitrary inhomogeneous medium by cross correlation. Phys. Rev. Lett. 93, 254301, 254301. doi:10.1103/PhysRevLett.93.254301
Weaver, R. L., and Lobkis, O. I. (2004). Diffuse fields in open systems and the emergence of the Green’s function (L). J. Acoust. Soc. Am. 116, 2731–2734. doi:10.1121/1.1810232
Wessel, P., Luis, J. F., Uieda, L., Scharroo, R., Wobbe, F., Smith, W. H. F., et al. (2019). The generic mapping tools version 6. Geochem. Geophys. Geosystems 20, 5556–5564. doi:10.1029/2019GC008515
Yang, X., Becker, F., Knitter, D., and Schütt, B. (2021). An overview of the geomorphological characteristics of the pergamon micro-region (bakırçay and madra river catchments, aegean region, west Turkey). Land 10, 667. doi:10.3390/land10070667
Yilmaz, Y., Genc, S. C., Gurer, F., Bozcu, M., Yilmaz, K., Karacik, Z., et al. (2000). When did the western anatolian grabens begin to develop? Geol. Soc. Lond. Spec. Publ. 173 (1), 353–384. doi:10.1144/GSL.SP.2000.173.01.17
Zhang, S., Zhang, G., Feng, X., Li, Z., Pan, L., Wang, J., et al. (2022). A crustal LVZ in Iceland revealed by ambient noise multimodal surface wave tomography. Front. Earth Sci. 10, 1008354. doi:10.3389/feart.2022.1008354
Keywords: Aegean region of Türkiye, ambient noise tomography, cross-correlations, Rayleigh-wave velocity, geothermal exploration
Citation: Mulumulu E, Polat O and Chávez-García FJ (2023) Ambient noise tomography of the Aegean region of Türkiye from Rayleigh wave group velocity. Front. Earth Sci. 11:1265986. doi: 10.3389/feart.2023.1265986
Received: 24 July 2023; Accepted: 30 October 2023;
Published: 14 November 2023.
Edited by:
Claudia Pavez-Orrego, SINTEF, NorwayReviewed by:
Sakir Sahin, Süleyman Demirel University, TürkiyeCopyright © 2023 Mulumulu, Polat and Chávez-García. This is an open-access article distributed under the terms of the Creative Commons Attribution License (CC BY). The use, distribution or reproduction in other forums is permitted, provided the original author(s) and the copyright owner(s) are credited and that the original publication in this journal is cited, in accordance with accepted academic practice. No use, distribution or reproduction is permitted which does not comply with these terms.
*Correspondence: Orhan Polat, b3JoYW4ucG9sYXRAZGV1LmVkdS50cg==
Disclaimer: All claims expressed in this article are solely those of the authors and do not necessarily represent those of their affiliated organizations, or those of the publisher, the editors and the reviewers. Any product that may be evaluated in this article or claim that may be made by its manufacturer is not guaranteed or endorsed by the publisher.
Research integrity at Frontiers
Learn more about the work of our research integrity team to safeguard the quality of each article we publish.