 Liu Yang1,2*
 Tang Chuan
95% of researchers rate our articles as excellent or good
Learn more about the work of our research integrity team to safeguard the quality of each article we publish.
Find out more
ORIGINAL RESEARCH article
Front. Earth Sci. , 28 December 2023
Sec. Environmental Informatics and Remote Sensing
Volume 11 - 2023 | https://doi.org/10.3389/feart.2023.1265852
This article is part of the Research Topic Advances and Applications of Artificial Intelligence and Numerical Simulation in Risk Emergency Management and Treatment, volume II View all 13 articles
Due to warm and humid air currents of the Indian Ocean and the southwest monsoon, the Palong Zangbo catchment in southeastern Tibet has developed oceanic glaciers in the valley, and the activity of glacial debris flows has been gradually intensified under neotectonic activity, frequent earthquakes, climate change, and extreme rainfall. In this paper, the topographic and morphological data of the debris flow basin, the dynamic evolution characteristics of glaciers and glacial lakes were analyzed by using multisource long-term series of remote sensing images. Simultaneously, the distribution of moraines and landslide sources were extracted based on satellite image. In addition, climate change in the study area was analysed using temperature and rainfall data from the last 40 years, revealing that the average temperature in the study area from May to October presented a fluctuating tendency as a whole, especially after 2013, when the temperature gradually increased. As these temperature changes led to continuous melting of the glaciers in the study area, the glacier area decreased from 8,300 km2 in 1988–4,584 km2 in 2019, which decreased nearly 45%. However, the number and area of glacial lakes in the study area gradually increased under a power-law trend, which further led to a significant increase on the possibility of glacial lake rupture in the study area. Due to the joint effects of earthquakes, glacier melting and glacial lake collapse, the debris flows in the study area were well developed, and a total of 122 debris flows were found with varying channel lengths, areas and material sources. Importantly, the characteristics of the glaciers, glacial lakes and climate change in the study area have indicated that the glaciers have retreated, the number of glacial lakes has increased, and the risk of debris flow in this basin will increase in the future. Therefore, it is necessary to strengthen monitoring and early warnings on floods due to glacial lake collapses and debris flows in the study area to improve the risk management of debris flows and floods and the prevention and mitigation of disasters.
The south eastern region of the Qinghai-Tibet Plateau is a typical alpine canyon area in China with active oceanic glacial activity (Wu et al., 2019). The area is characterised by a fragile ecological and geological environment resulting from high-intensity earthquakes, highland stress, strong tectonic activity and deep river formation, and geological disasters such as rockfalls, landslides, debris flows, ice avalanches and avalanches frequently occurring in this area (Huang et al., 2021). According to the research, there have been 430 watersheds which experienced debris flow in the history of Nyingchi region. The highest frequency of debris flow outbreaks reaches 21 times a year (Chen et al., 2011). In particular, with climate change, the increasing melting glaciers and the glacial lakes outburst have led to frequent glacial debris flow disasters in the southeast of the Qinghai-Tibet Plateau (Liu et al., 2011; Wei et al., 2018; Wang et al., 2014). Among them, the specific debris flows induced by melting snow, glacial lake outbursts, and rainfall along the Palong Zangbo River are extremely developed, which poses great risks and threats to the Sichuan‒Tibet Highway, the Sichuan‒Tibet Railway and the mountain towns along these routes (Cui et al., 2014; Huang et al., 2021). Therefore, further analysis of the long-term activity characteristics of glacial debris flows in the region is of great significance for disaster prevention and mitigation.
As a fluid coupled with fluids and solids, the formation process of debris flows is the result of the combination of steep terrain, abundant material sources and strong hydrodynamics. The Palong Zangbo Valley passes through the Jiali Fault Zone, where strong tectonic uplift, river bank erosion and glaciation lead to steep mountain slopes in the area (Huang et al., 2021). Particularly, under the action of earthquakes, a large number of rockfalls and landslides in the basin have been triggered (Chigira et al., 2010; Tang et al., 2011). At the same time, strong freeze‒thaw cycles have led to the storage of plentiful loose solid material in the watershed of the region, especially with the melting glaciers, which have led to the accumulation of a large amount of moraine in the channel, providing sufficient material sources for the debris flow. Numerous studies have been carried out on the shear failure characteristics and stability of moraine soils (Xie et al., 2019; Fu et al., 2021), which is of great significance on revealing the initiation mechanism of glacial debris flows. However, the sources of materials in the glacial watershed change with the melting of glaciers, resulting in certain differences and dynamics in the outbreak characteristics of glacial debris flows. Studies have shown that the development of glacial debris flows is controlled by factors such as glacier thickness, glacier area, lake area, rainfall intensity, temperature, watershed area, source volume, and longitudinal grade of channels, among which high temperature and rainfall are key factors to glacial debris flow outbreaks (Yan, 2020). In addition, the Palong Zangbo Valley is a highland thermal anomaly area (Huang et al., 2021), which directly leads to the gradual melting of glaciers along the Palong Zangbo River Basin, and abundant moraine provides a sufficient source for the debris flows. With melting glaciers, the areas and water levels of glacial lakes have increased (Li D. et al., 2021), and glacial lakes have the potential to repeatedly burst (Yang et al., 2011a). For example, from 1983 to 1986, there were multiple debris flows from glacial lake outbursts in the Peilong gully, of which debris flows induced by collapsing glacial lakes erupted in 1988 in the Midui gully, a barrage lake was generated from the debris flow in the Guxiang gully in 1975 and 2005, then the Guxiang debris flow erupted due to lake rupture, and the Tianmo debris flow was caused by ice and snow meltwater and rainfall in 2007. Although the above studies about Midui gully, Guxiang gully and Tianmo guly have clearly revealed the initiation mechanism and activity characteristics of glacial debris flows, with the gradual intensification of global warming. Research on the relationship between dynamic laws of glaciers and glacial lakes with the formation of debris flows is remain poorly understood (Medeu et al., 2022; Racoviteanu et al., 2022), which further leads to an insufficient understanding of the long-term activities of glacial debris flows. Therefore, an understanding of the dynamic response process between temperature change and glacial lakes, as well as the dynamic changes in the development status of moraine due to heating, is the basis to analyse the activity of glacial collapse debris flows.
Impacted by the steep terrain, the ground surveys, UAV aerial photography technology and laser scanning are difficult to monitor the glacier changes on a large scale. Numerous previous studies indicated that remote sensing and GIS can effectively monitor the evolution of glaciers and glacial lake in alpine regions by identifying information on glaciers and glacial lakes from satellite images (Shrestha et al., 2016; Bajracharya et al., 2014). For example, many researchers have monitored the long-term dynamics of glaciers using high-definition remote sensing images (Bajracharya et al., 2014). Simultaneously, the long-term evolution of glacial lakes in Boqu in the central Himalayas were also monitored based on satellite images (Chen et al., 2007; Wang et al., 2014; Zhang et al., 2015; Nie et el., 2017; Li D. et al., 2021; Su et al., 2021). However, although changes in glaciers and glacial lakes have been well documented in the previous studies, the influencing factors of the dynamic evolution of glaciers and glacial lakes are not fully understood.
Importantly, with the gradual increase of glacial melting and the water level of moraine lakes, flood events caused by glacial lake ruptures have occurred frequently in recent years (Liu et al., 2014; Riaz et al., 2014). More and more works have documented the chain disaster events induced by changes in glaciers and glacial lakes (Yang et al., 2011b; Cook et al., 2018; Li Y. et al., 2021; Shangguan et al., 2021; Zhang et al., 2021). Obviously, understanding the response relationship between temperature changes to glaciers and glacial lakes and its impact on glacial debris flow activity will provide some guidance for monitoring and providing early warnings on glacial debris flows and preventing risk in the region. This is important for disaster prevention and reduction under climate change. The main purpose of this study is 1) analysis the dynamic evolution of glaciers and glacial lakes; 2) understanding the influence of climate change on evolution of glaciers and glacial lakes evolution; 3) revealed the impact of glacier and glacial lake changes on the activity of glacial debris flow.
The study area is located in the section from Ranwu to Thongmai in the Palong Tsangpo Basin, mainly in Bomi, Nyingchi (Figure 1). The study area is 16,021.12 km2, the highest elevation is 6,650 m a.s.l, the lowest elevation is 2000 m a.s.l, the maximum altitude difference is approximately 4,650 m a.s.l, and a large number of oceanic glacier gullies have developed upstream. Glacial, alpine canyon, and river accumulation landforms are extremely well developed. This area, located on the northern Qinghai-Tibet Plateau, is at the junction of the northern Tibetan and the Himalayan massif and is a typical deep alpine canyon. In addition, the Jiali Fault and the Zamu-Maniwen Fault pass through the study area (He et al., 2005). The geological structure around the study area is extremely complex, and there is frequent seismic activity in the area due to the activity belts of the Namtso-Zhongsha, Jiali-Ranwu and Metuo structures. According to previous researches, there have been as many as 9 strong earthquakes with surface wave magnitude of 6.0 (Ms 6.0) or above in the region in the past 60 years, and approximately 50 earthquakes of Ms 4.7 to Ms 5.9 magnitudes. One of the most representative seismic events was the Ms 8.6 earthquake that occurred in Chayu County on 15 August 1950.
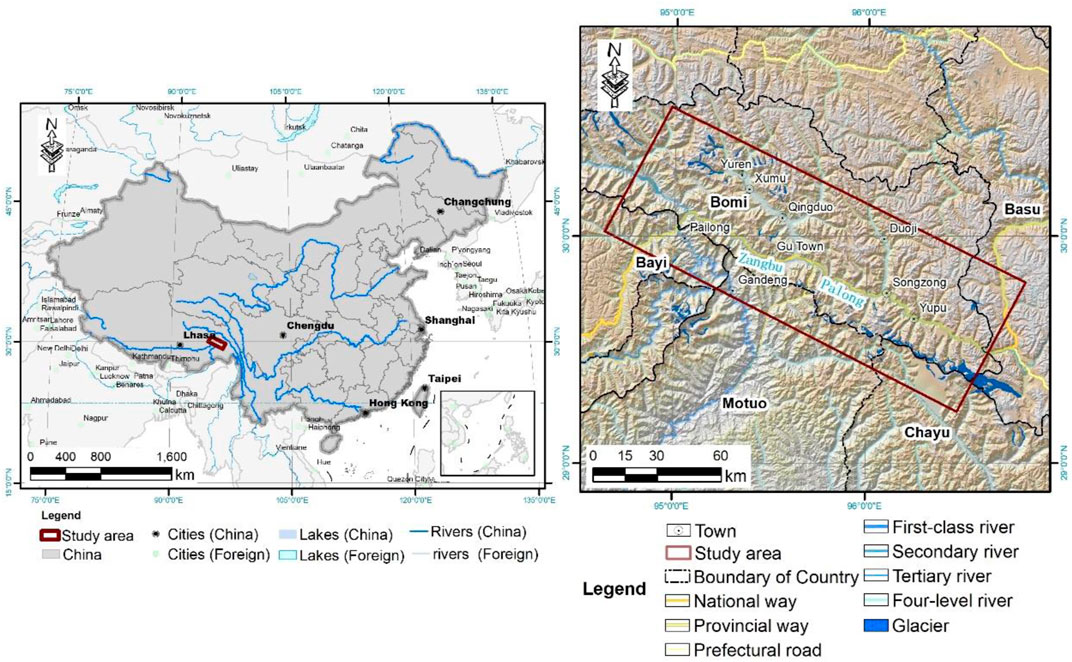
FIGURE 1. Geographical map of the study area.
Climatic conditions are the main triggers for geological disasters in the region, and the study area has the monsoon climate of the temperate semi-humid plateau in southeastern Tibet, which is affected by the warm and humid air flow of the Indian Ocean and the southwestern monsoon. The annual average temperature in the study area is 8.5°C, and the lowest temperature is in January, when the average temperature is approximately −0.2°C, while the highest temperature is in July, when the average temperature is approximately 16.4°C. Overall, the highest temperature of the year is 31 °C and the lowest temperature is −20.3°C. The average annual rainfall is approximately 977.1 mm, and the rainfall from March to October accounts for approximately 93.5% of the total annual precipitation.
To monitor the dynamic changes in glaciers and glacial lakes in the watershed of the study area over time, this study collected QuickBird, IKONOS, SPOT-5 and Landsat images from 1988 to 2019. Table 1 shows that the QuickBird satellite image resolution is 0.61 m, the SPOT5 image resolution is 2.5 m, and the IKONOS image resolution is 1 m. The multispectral ETM+ and TM image resolutions are 30 m. In addition, ASTER GDEM data measured by the EARTH observation satellite Terra of NASA were collected with a resolution of 30 m.
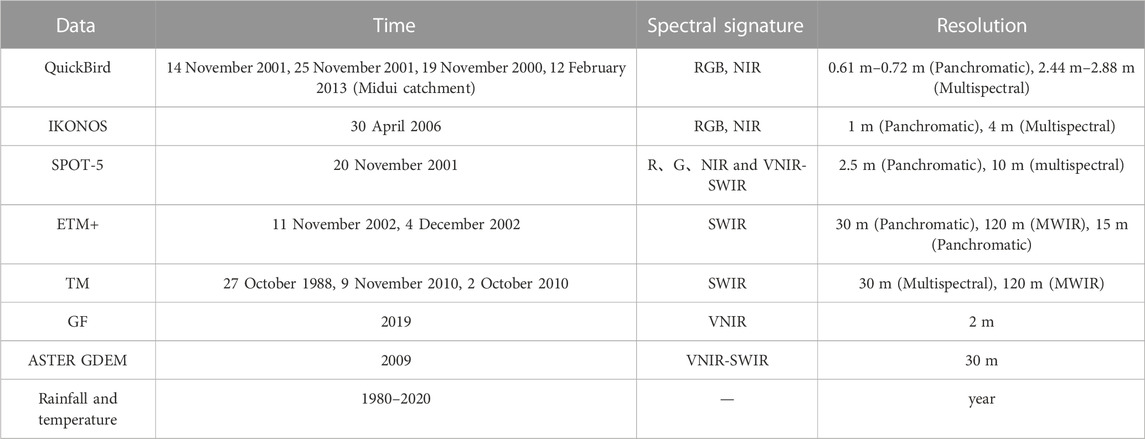
TABLE 1. The information of data used in this study.
Subsequently, the collected remote sensing data were processed by band combination, geometric correction, image fusion, image mosaicking and cropping, based in ERDAS 9.2, ENVI 5.0 and ARCGIS 10. Then, compared to the raw data, the geometric accuracy, density, texture and tone information of the processed images were significantly enhanced, improving the interpretation accuracy and quality of the remote sensing images. Finally, the evolution of glacier, glacial lake and their impact on glacial debris flow activity were analysed according to the technical flowchart, as shown in Figure 2.
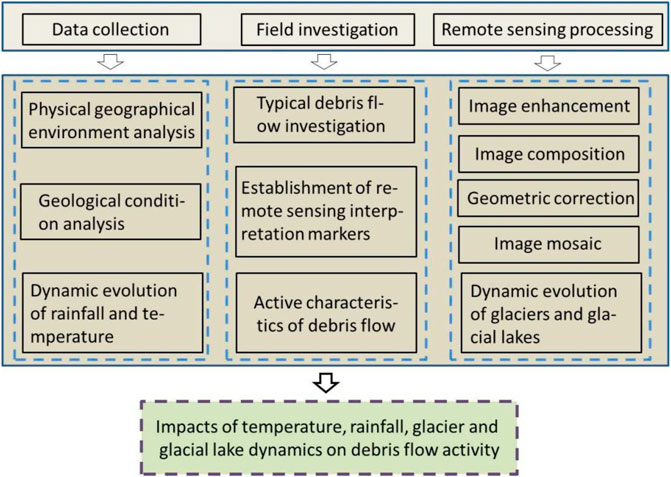
FIGURE 2. Technical flowchart in this study.
Regional reflection characteristics vary due to different textures, compositions, and shading of materials on the surface; thus, materials are shown in varying shades and shapes in remote-sensing images. Based on these features, a supervised classification method has been adopted to automatically extract the materials. In this region, glaciers in bright white are mainly distributed above the alpine snow line, such as in the ice bucket or inside the ice tongue (Figure 3A), and perennial snow and ice, shown in white and covered by shadows, are mainly distributed below the altitude of the formation glacier, on shady mountain slopes, or in gently sloping areas with low amounts of sunshine; in addition, glacial lakes in dark blue are generally distributed in glaciers and in the lower parts of the perennial snow and ice, and the terrain is relatively gentle (Figure 3B). To fully understand the development characteristics of glacial snow and glacial lakes in the study area, the samples were selected based on the collected TM and ETM+ remote sensing images and the visual interpretation of glaciers, glacial lakes and other geographical features. Then supervised classification, a process of assigning a class value to a set of grid cells in a raster GIS database based on the values of similar grid cells that have been a priori classified as representative of a class or group (Abburu and Golla, 2015; Merry et al., 2023), was performed on the ENVI 5.0 platform to automatically identify and extract the glaciers, glacial lakes and snow of three remote sensing images from 1988, 2002 and 2010.
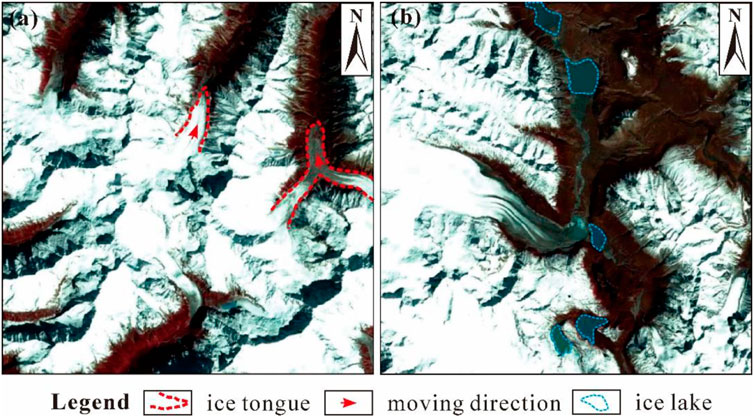
FIGURE 3. Glacier and glacial lake identification markers. (A) Glacier, (B) Glacial lake.
The limitation of using supervised classification for automatic identification and extraction is that it incorrectly combines materials with similar glacier features into the same category as mountain shadows. Therefore, in this paper, two kinds of remote sensing information of glacial lakes that were extracted by both unsupervised and supervised classification methods were compared and verified in the field, and then sifts and clusters of the remote sensing information were determined by the supervised classification method to remove and synthesise the small classification fragments to obtain reliable and accurate results on the materials and to further reveal the dynamic changes in glaciers and glacial lakes.
In addition, a large number of landslides have developed in the debris flow basin of the study area, and abundant moraine material with melting glaciers has also accumulated in the channel, providing sufficient material for debris flows. Based on field investigation, this study first constructed identification markers of debris materials, moraines, debris flow accumulation fans and other landslides and then combined them with high-definition remote sensing images using the ArcGIS technology platform. A manual, interactive interpretation of moraines was performed on the landslide sources and accumulation fans in the debris flow basin, and the source information of debris flow in the basin was constructed.
To analyse the effects of dynamic changes such as temperature, rainfall and ground temperature on glaciers and glacial lakes in the study area, the average monthly rainfall and temperature data of the study area from 1988 to 2019 were collected. The data show that in the study region, temperatures higher than 0 °C from May to October were positively correlated with the melting of glacial snow. Therefore, in this paper, the average temperature from May to October each year was considered as the influencing factor of or the reaction temperature to glacial snow melt. Meanwhile, the average monthly rainfall in each year from 1988 to 2019 in the study area was also considered as the influencing factor for interannual glacier and glacial lake dynamics.
Geothermal remote sensing inversion based on the radiation transmission equation is a common method to obtain regional geothermal data. Specifically, by this method, the thermal radiation received by the sensor is inverted into the real ground temperature after correction on the atmospheric radiation, observation angle and amount of radiation on the specific surface (Dash et al., 2002). The split window algorithm is the most common technique for retrieving land surface temperature, in which the Qin algorithm (Qin and Karnieli, 1999) can effectively retrieve the surface temperature corresponding to any cell on the image. The equations are as follows:
where Ts is the surface temperature; T4 and T5 are the brightness temperatures of thermal infrared channels 4 and 5 of the cells, with K as the absolute temperature; εi is the specific emissivity in channel i; and Ti(θ) is the atmospheric transmittance of electromagnetic waves in channel i under the zenith angle θ of the sensor.
In glacial areas, temperature is key to the growth and ablation of glacier formation, that is, temperature is a sensitive factor to dynamic changes in glaciers. In this study, the rainfall and temperature monitoring data were collected from a weather station. By analysing the monthly average temperature data over the past 40 years in the Palong Zangbo Valley, it was found that the temperatures from May to October were higher than zero degrees, which was conducive to glacier melting and the water level elevation of glacial lakes. Thus, the average temperature of the above period was analysed to reveal the dynamic changes. In Figure 4, the average temperature variation in the study area in the period ranged from 5.5°C to 7.5°C over the past 40 years. Overall, the temperature in the study area presented a growing increase in the first 4–5 years and then continuously decreased in the following 4–5 years, that is, the pulsed and dynamic temperature change presented in 4–5 years as a cycle. However, the temperature significantly increased from 2012 to 2017 and then tended to rise slowly. This dynamic change in temperature leads to some dynamic differences in the glacier ice and snow cover area and the water level of the glacial lakes in the study area, and it also has an impact on the ground temperature.
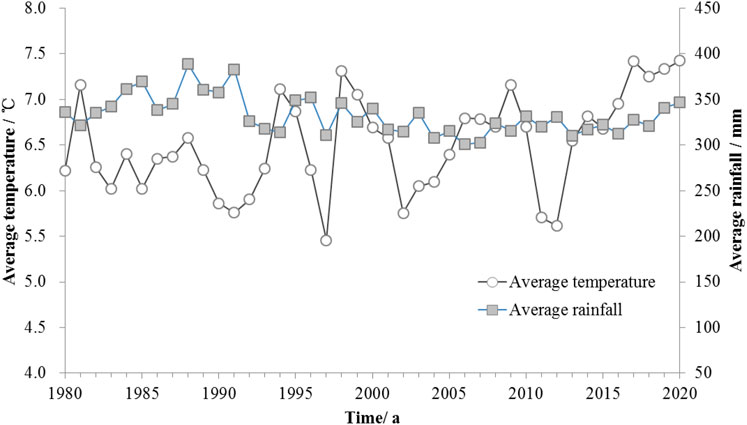
FIGURE 4. Dynamic changes in temperature and rainfall in the study area.
In Figure 5A, the geothermal variation ranged from −9°C to 46 °C in the study area in 2002, which was mainly concentrated in the central part of the study area, and the geothermal temperatures in the northwest and southeast regions were relatively high. As the average temperature from May to October in the study area increased from 5.8°C in 2002°C to 6.7°C in 2010, the maximum geothermal temperature in the study area also increased to 53 °C (Figure 5B). As the overall ground temperature increased, the range of low temperature areas decreased. In 2013, the geothermal variation range of the study area was from −12°C to 43°C, and the ground temperature in the northwest region of the study area significantly decreased, while the range of the low temperature in the central zone expanded (Figure 5C). Until 2017, the minimum and maximum ground temperatures were −10°C and 43°C, respectively (Figure 5D). Compared with the previous period, the coverage of the high temperature area increased significantly in 2017, and the low temperature zones were distributed sporadically in the study region. The dynamic differences in time and space between air temperature and ground temperature further led to the dynamic variability of glaciers and glacial lakes in the study area, which was conducive to the development of glacial debris flows.
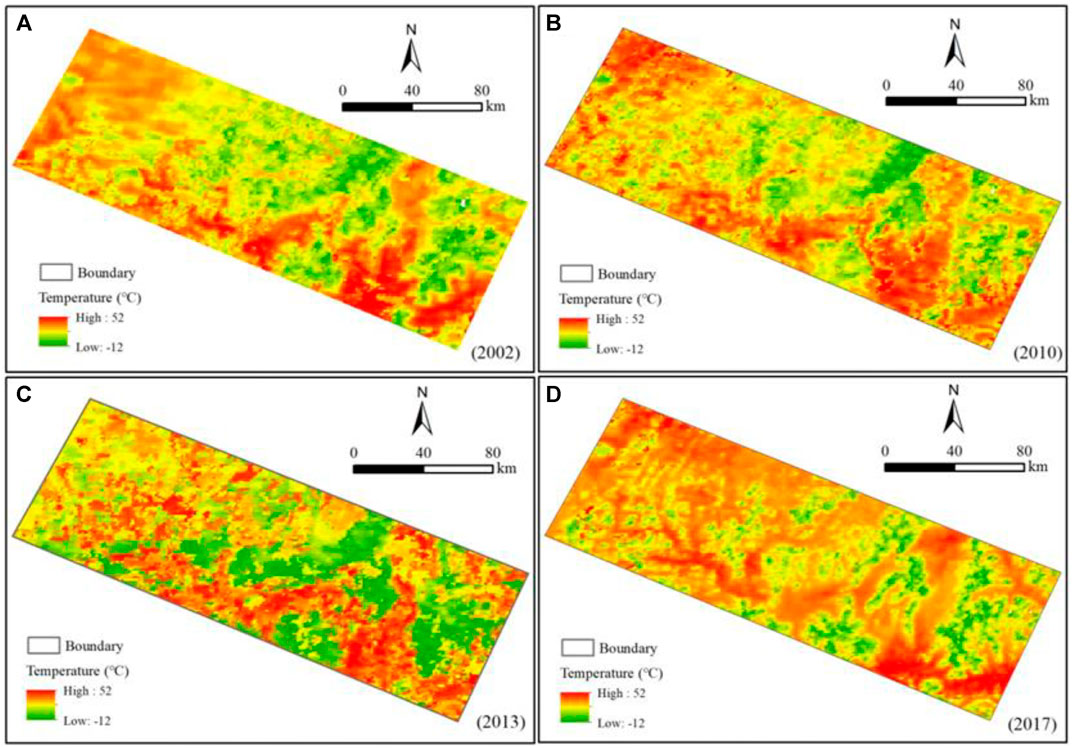
FIGURE 5. Spatiotemporal difference in geothermal temperature in the study area.
In addition, the average annual rainfall in the study area from 1980 to 2020 was mostly concentrated between 300 mm and 350 mm and presented pulsed and dynamic changes (Figure 4), but it had slight dynamic differences. However, before 2013, the rainfall and temperature in the study area showed the opposite dynamic trend, that is, the rainfall decreased gradually with increasing temperatures over the years (Figure 4). However, in 2013, the rainfall and temperature in the study area had the same dynamic change trend; that is, the temperature increased with the growing rainfall that year. With rising air and ground temperatures, the glacial meltwater in the study area increased, while increased rainfall led to further increases in runoff in the basin. Therefore, the risk of glacial debris flows and debris flows due to glacial lake collapse in the study area was further increased, and the landslide activity was enhanced.
The above analysis revealed that the air temperature, ground temperature and rainfall in the study area changed dynamically over time, which exacerbated glacial activity, resulting in dynamic changes in glacial lakes and further affecting the glacial debris flow activity to some extent. To reveals the dynamic differences between glaciers and glacial lakes under the dynamic changes in climatic conditions and ground temperature. The maximum likelihood classifier in the ERDAS platform was used to supervise the classification of glacial lakes. Simultaneously, the distribution maps of glacial lakes in different periods in the study area were obtained after cluster, filtration and removal analysis. In order to enhance the accuracy of the supervised classification results, we conducted visual interpretation and field investigations for verification purposes (Figure 6), and the accuracy of automatic classification results is approximately 97%, indicating that the classification method used in this article is reliable. Figure 8 shows that the glacier coverage area of the study area in 1988 was approximately 8,300 km2 and that the glaciers were mainly distributed in the eastern and northern alpine areas of the study area (Figure 7A). In 2002, the average temperature in the study area in the period from May to August was as high as 5.76°C, which led to the continuous melting of glacial snow in the eastern and northeastern of the study area (Figures 7A,B), the glacier area decreased from 8,300 km2 in 1988–8,284 km2 in 2002, a decrease of 0.2% compared to that of 1988 (Figure 8). From 2002 to 2010, the temperature of the study area gradually increased overall (Figure 4), resulting in the gradual melting of glaciers in most areas, and the glacier area decreased to approximately 5,276 km2 (Figure 8), while the geothermal data showed an increasing tendency in the eastern and northeastern of the study area (Figure 5). As a result, the glacier coverage in the northeastern and northeastern of the study area decreased significantly from 2002 to 2010 (Figure 7C). From 2010 to 2019, glaciers continued to melt in the southwestern area, and the area decreased from 5,276 km2 in 2010–4,584 km2 in 2019 (Figures 7C–F; Figure 8), a reduction of approximately 13%. This suggested that glacier melting has accelerated in this century. Statistics on the glacier area in the past 30 years from 1988 to 2019 showed that as the global temperature has been gradually rising, the glacier snow in the study area has been gradually melting, and the glacier area has linearly decreased accordingly (Figure 8).
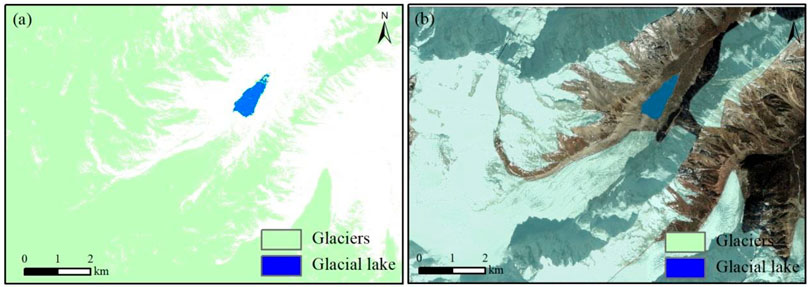
FIGURE 6. Comparison of classification results and translation results. (A) Classification results, (B) Interpretation.
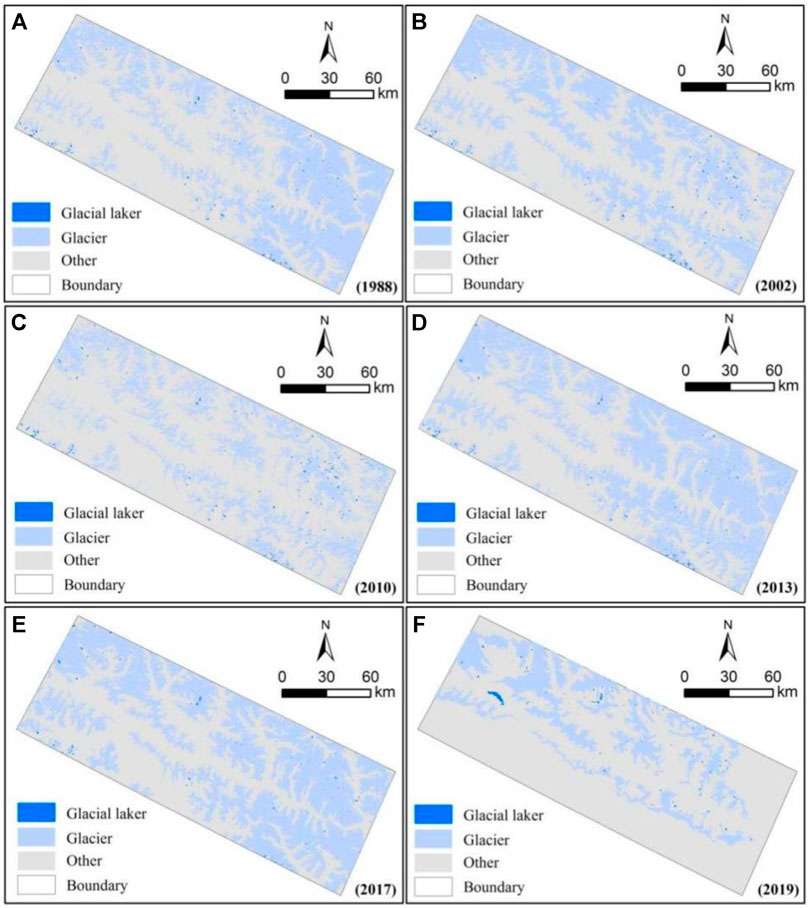
FIGURE 7. Distribution characteristics of glaciers and glacial lakes during 1988–2019. (A) 1988, (B) 2002, (C) 2010, (D) 2013, (E) 2017, (F) 2019.
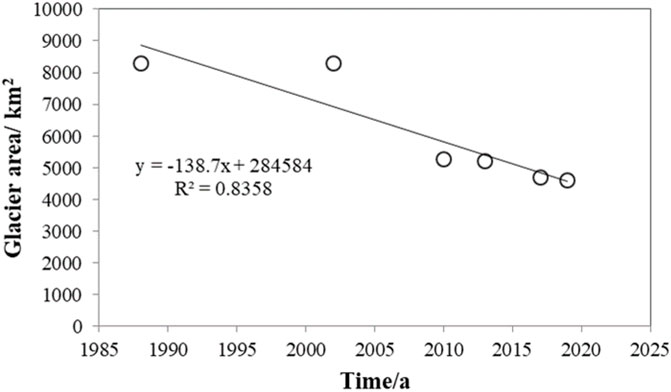
FIGURE 8. The dynamic evolution of glacial area.
The melting of glacial snow will inevitably lead to changes in the number and area of glacial lakes in the study area. To study the dynamic response of glacial lakes to air temperature and glacial snow melting in the study area, based on the results of a supervised classification and combined with ArcGIS statistical software, the number and area of glacial lakes in each time period were statistically analysed (Figure 9). The results concluded that in 1988, there were approximately 280 glacial lakes occupying approximately 30 km2 in the study area. With the rapid melting of glacial snow, the number and area of glacial lakes in the study area increased slowly from 1988 to 2002, but there was a rapid increase from 2002 to 2017 (Figure 9), which was because since 2002, the average temperature in the study area from May to October has shown a gradually increasing trend overall (Figure 4). As the glacier retreated, some of the original glacier cover areas formed glacial lakes, while the melting of glacial snow cover led to a further increase in the water level of the previously developed glacial lakes, resulting in a rapid increase in the number and area of glacial lakes. From 2017 to 2019, the amount and area of glacial lakes in the study area continued to increase steadily but slowly (Figure 9), which may be because from 2017 to 2019, the average temperature slowly increased in the period from May to October, decelerating the melting of glacier snow. Meanwhile, the higher the altitude is, the lower the temperature is, and the more slowly the glacier melts. Therefore, with the rapid melting of glacial snow in low-altitude areas during the period, the number and area of glacial lakes increased rapidly. However, the glacial snow in high-altitude areas may melt only at higher or extremely high temperatures; therefore, the melting of glacial snow in high-altitude areas may slow down gradually, as did the increase in the number and area of glacial lakes.
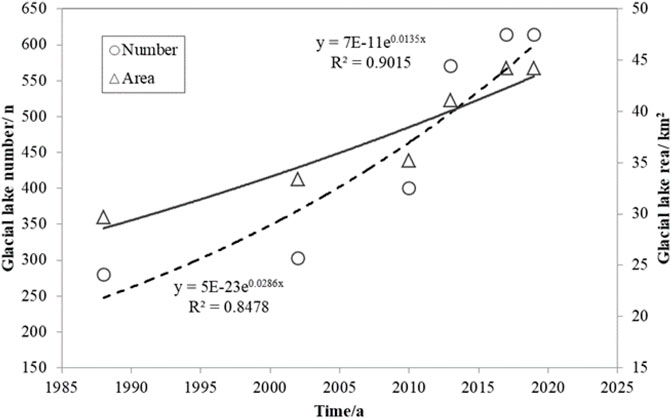
FIGURE 9. The long-term evolution of number and area of glacial lakes.
However, glacial snow in an ocean valley glacier is strongly affected by the summer monsoon from the Indian Ocean and is characterised by high accumulation and rapid melting. Although slight climate change will cause the glaciers to greatly retreat or advance, the number and area of glacial lakes in the study area presented a power-law increasing trend in general (Figure 9). With the growing area and water level of glacial lakes, the likelihood of glacial lake rupture in the study area will gradually increase, which will further induce glacial lake collapse debris flows.
Climate change is an important driving factor for the dynamic changes of glaciers and glacial lakes. In order to analyze the response of temperature evolution on changes in glaciers and glacial lake, the average temperature, glaciers area and glacial lake area are used for coupling analysis of their dynamic response relationships. Figure 11A shows an opposite trend between temperature changes and glacier area changes, i.e., the average temperature gradually decreased between 1988 and 2002, but the decrease in temperature leads to a temporarily intensification of the glacier formation process. Therefore, the glaciers area increased slightly during this period. However, the average temperature increased after 2002, this leads to continuous melting of glaciers, and the area of glaciers decreased during this period (Figure 10A).
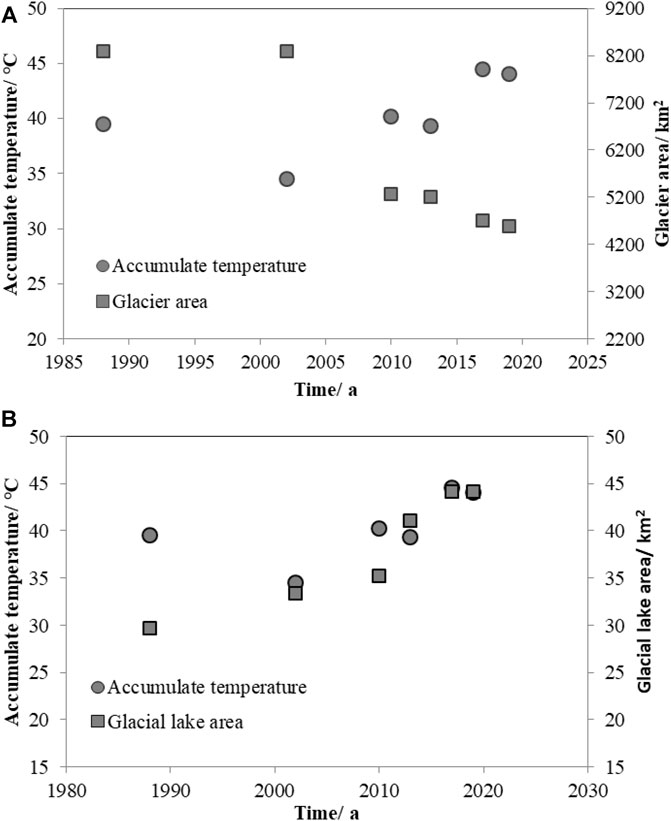
FIGURE 10. Dynamic response of temperature and glaciers and glacial lake. (A) The dynamic response relationship between temperature and glacier area, (B) The dynamic response relationship between temperature and glacial lake area.
Inconsistent with the evolution of glacier area, the glacial lake area generally increased between 1988 and 2017. However, as the process of glacier melting intensifies, some glacial lakes experience a process of collapse, and glacier degradation leads to the loss of water supply to glacial lakes. These have led to the disappearance of some glacial lakes in the study area, and the area of glacial lakes has gradually declined after 2017 (Figure 10B).
With climate change glacier snow has melted at an accelerated rate, and glacial debris flows in the Palong Zangbo Valley have become more active. The debris flow visual interpretation of remote sensing images is mainly based on the extraction of the watershed, distribution of loose solid material, erosion characteristics of the channel and the morphological characteristics of the accumulation fan. Remote sensing images combined with field surveys have detected 122 debris flow basins along the Ranwu to Tongmai section of the Palong Zangbo River, including 58 on the right bank and 64 on the left bank (Figure 11). Impacted by the climate change, debris flows frequently break out in these regions, causing serious damage to infrastructure. For example, a catastrophic debris flow in the Midui basin was trigged by the glacier collapse surge in 1988. Field investigation found that the maximum discharge of debris flow is about 1,000 m3/s. A total of 18 bridges and G318 road were destroyed by this debris flow. In addition, the debris flow widely occurred in Guxiang basin after 1955, and the G318 road frequently destroyed by the Guxiang debris flow.
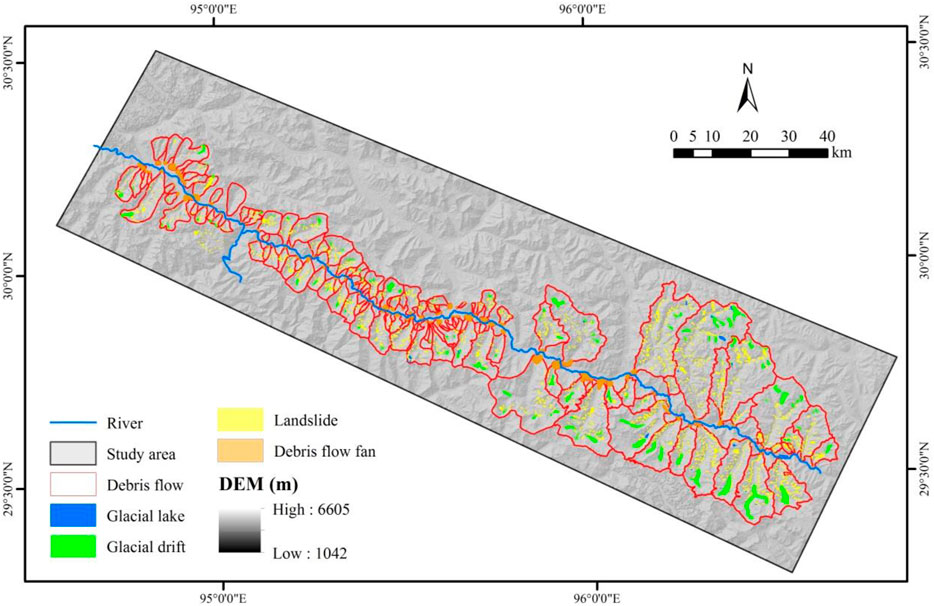
FIGURE 11. Distribution characteristics of glacier debris flows.
Additionally, Figure 12 shows that the area of debris flow in the study area varied from 1.24 km2 to 319.13 km2, among which debris flows with a drainage area of less than 50 km2 accounted for 84% of the total and were mainly concentrated in the western part of the study area. With the increase on the watershed area, the channel length also increased (Figure 13). Figure 13 shows that the range of the channel length of the debris flow in the study area was between 1,500 m and 35,000 m. Only 25% of the watersheds had a channel length longer than 7,000 m, and watersheds with longer channel lengths were mainly developed in the southeastern part of the study area. In addition, the area is located in southeastern Tibet, where geological tectonic activity is relatively active. In addition to triggering a large number of coseismic landslides, earthquakes have also formed a large number of damaged mountains. Under the action of rainfall, many shattered mountains gradually became unstable and formed post-earthquake landslides. Therefore, according to the interpretation results of the remote images, landslides are well developed in the study area, but there are significant differences in the development of landslides for watersheds. Figure 14 shows that the landslide coverage area was generally less than 1 km2 in a watershed area under 25 km2, but the landslide coverage area increased linearly with the outbreak of large landslides in the basin and the increasing watershed area, which may be because with the increase in the watershed area and the melting of glaciers and snow in the middle and upper reaches of the watershed, the free face is more developed, and at the same time, with the intensification of freeze‒thaw cycles and glacier erosion, some slopes become unstable and form landslides. Of course, as the glacier gradually retreats, the released moraine also gradually increases. Figure 15 shows that approximately 70% of the watershed’s moraine coverage area was under 2 km2, but the moraine coverage increased linearly with increasing watershed area. Figure 11 shows that most of the moraine accumulated in the middle and upper reaches of each basin and the moraine was well developed in the debris flow basin in the southeastern part of the study area.
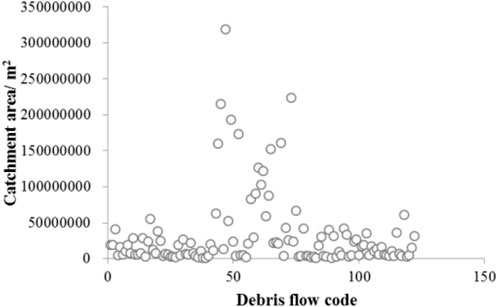
FIGURE 12. Area of the debris flow watershed.
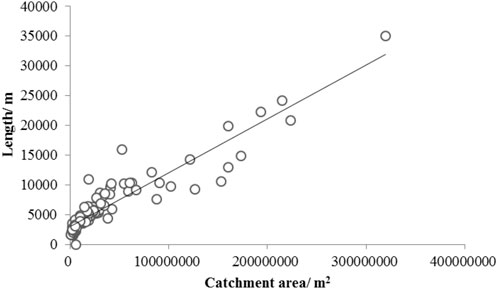
FIGURE 13. Channel length in the debris flow basin.
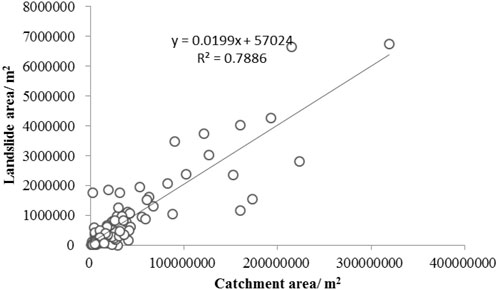
FIGURE 14. Landslides in each basin.
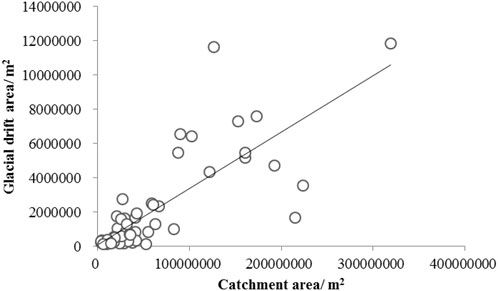
FIGURE 15. Moraines in the debris flow basin.
In addition, the interpretation results of highly accurate remote sensing images show that the development areas of moraine and landslides in the debris flow basin were 117.79 km2 and 84.63 km2, respectively, accounting for 3% and 2% of the debris flow basin area, respectively. This suggests that although the moraine covers a small area, field investigations have found that the moraine is thicker and more developed than the landslide and is the main component of the glacial debris flow provenance. Meanwhile, Figure 11 reveals that the moraine on the left bank of the Palong Zangbo watershed is well developed, indicating that the glacial activity on the left bank is stronger than that on the right bank. In addition, the rock mass in the study area is fragmented under the action of geological structures such as the Jiali fault. More importantly, the joint plane in the rock mass is continuously infiltrated and freeze‒thawed by the combined influence of glacier meltwater and rainfall, resulting in the ice splitting effect and increasing the joint. With the cycle of freezing and thawing, the surface rock mass is completely disintegrated and destroyed, forming fragments and sand grains. These freeze‒thawed and weathered detrital materials roll down the slope to the channel to form accumulation cones or ice-water accumulation fans at the foot of the slope after being washed away and transported by the ice and snow meltwater, which provides an abundant source of loose debris for debris flows and constitutes the source of debris flow activities.
It is concluded that with increasing temperature, the melting of glaciers and snow has accelerated, which has led to the increasing moraine in the debris flow basin in the study area. Then, due to the effects of earthquakes and freeze‒thaw cycles, the amount of landslide material and weathered debris in the study area increased, that is, the more abundant the debris flow source was in the study area, the higher the possibility of debris flow.
Debris flow is one of the important disasters in glacier and seismic disturbance area, but the trend of debris flow activity is not consistent. In earthquake impacted area, sufficient landslide materials with poor consolidation impact the debris flow activity (Tang et al., 2011). Therefore, the richness of materials and rainfall have important impact on debris flow activity in the seismic disturbed area. However, the landslide activity in the seismic impact region gradually decreased over time (Chen et al., 2020), resulting the supply capability of the slope landslide material to the channel weakens (Xiong et al., 2021a). Therefore, the debris flow activity in the earthquake impacted area gradually decayed over time (Xiong et al., 2021b). In consistent with seismic impact area, the average temperature in the study area generally increased from 5.5°C to 7.5°C over the past 40 years (Figure 4). This leads to an overall intensification of the glacier melting process, and the glacier area shows a linear decay trend (Figure 7). Importantly, as the glacier melts, moraines are exposed from the glacier and transferred from the slope to the gully (Figure 16A), which supply sufficient materials for debris flow occurrence, i.e., the melting of glaciers will lead to the increase of moraines, thus providing sufficient material sources for debris flows, which causes the richness of materials for debris flow in our study area is gradually enhanced, this is inconsistent with earthquake impact regions. Subsequently, the strong rainfall induced flash floods to erosion the channel deposits and form debris flow (Figure 16B).
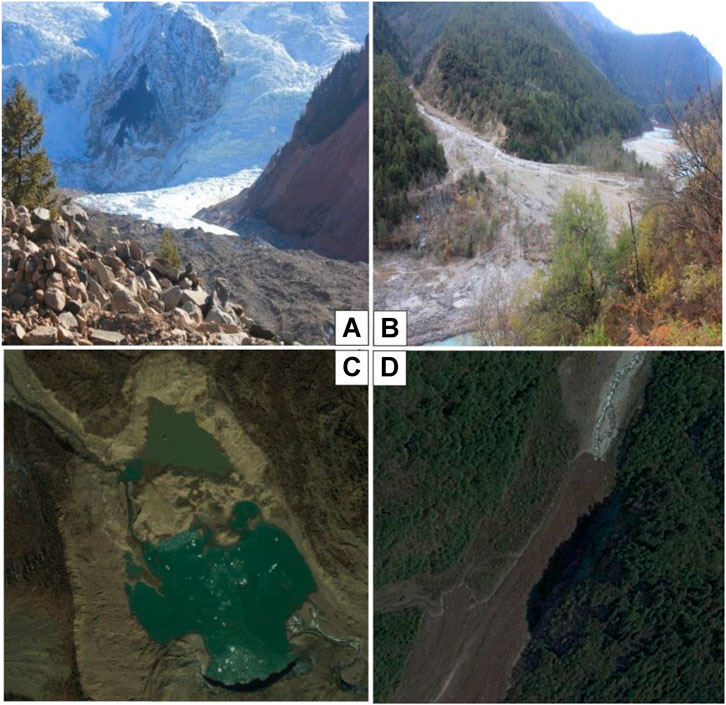
FIGURE 16. Active characteristics of glacier debris flow in the study area. (A) Moraines are exposed and transformed to channel, (B) Debris flow induced by flash floods, (C) Breaked glacial lake of Midui, (D) Large amounts of channel material carried by debris flow.
Additionally, as the ample amount of glacial snow melts, the number and area of glacial lakes gradually increased followed a power law in the study area (Figure 9). The melting of glaciers may cause the water level of glacial lakes to increase, enhancing the risk of glacial lake outburst, this can be supported by field investigation and previous studies (Chen et al., 2017; Liu et al., 2014). For example, a glacier lake in Midui basin break in 1988 (Figure 16C), and the water level of the glacial lake dropped rapidly by 25 m. Indeed, the flood induced by glacial lake break will carry large amounts of channel material to forms debris flows (Figure 16D). Importantly, the intensification of glacier melting process will lead to the increase of river flow and erosion capacity, and the coupled glacial lake outburst will lead to the increase of hydrodynamic conditions of debris flow. That is, the activity of glacier debris flow is affected by multiple factors and is more complicated than that in earthquake area.
Thus, the activity of glacial debris flow in our study area will increase in the later period, this is not consistent with earthquake impact area. The above conclusion could be verified from field investigations, such as the debris flow first recorded in 1953 in the Guxiang gully, which has been extremely active for the past 20 years and has evolved frequent debris flows since then (Hu et al., 2011). In addition, field surveys have verified that the moraine, weathered sediment, ice water sediment, and channel sediment in the Midui gully (Figure 17A), Peilong gully (Figure 17B) and Tianmo gully (Figure 17C) are well developed. Therefore, the debris flow occurred in these basins in recent years.
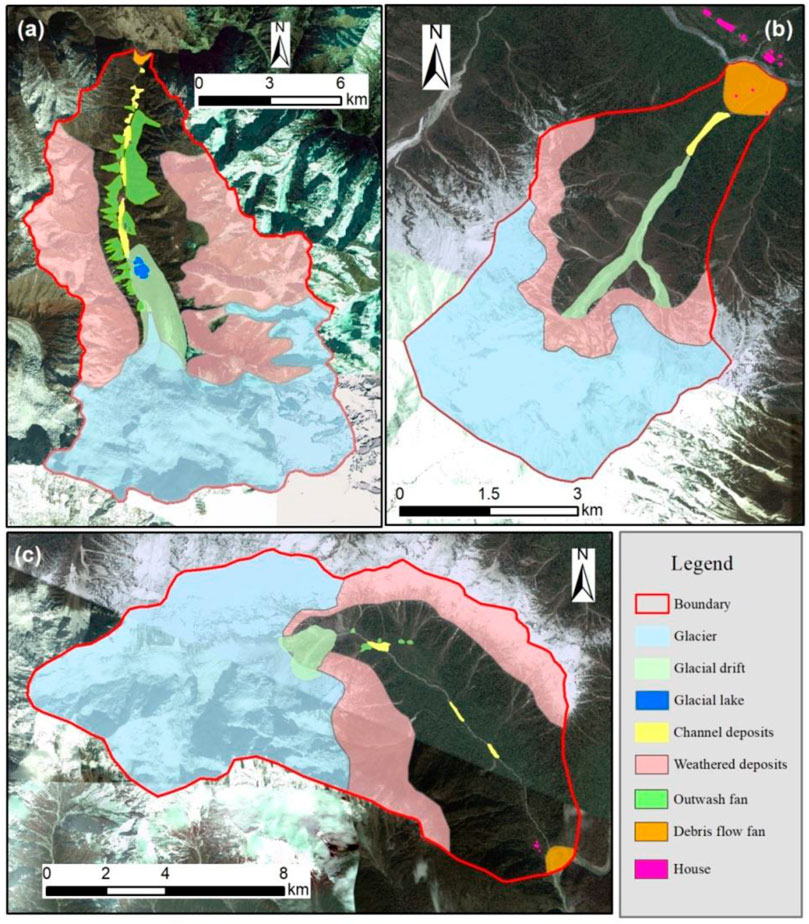
FIGURE 17. Sediment surveys in the (A) Midui gully, (B) Peilong gully and (C) Tianmo gully.
Glaciers, which are extremely sensitive to climate change, could reflect climate change and play an important role in predicting debris flows in alpine and high-altitude mountains. The Palong Zangbo Valley region in southeastern Qinghai-Tibet is a typical marine glacial area in China in which mountain disasters such as flooding induced by glacial lake outbursts and debris flows occur frequently. Through the collection of temperature and rainfall data in the Bomi area over the past 40 years, it was shown that the annual rainfall in the region did not differ greatly, but the temperature has shown a fluctuating trend with a slow growth, especially in recent years. Additionally, the results of geothermal inversion in the study area revealed that the geothermal temperature varies greatly in different regions. These changes have further accelerated the melting of glacial snow in the southern and southeastern parts of the study area. The glacial area has shown a linear decay trend over time. With the melting of glacial snow, the number and area of glacial lakes in the study area as a whole increased significantly with the power-law trend, the water level of some glacial lakes rapidly rose, and the risk of glacial avalanche increased, as did the possibility of glacial lake collapse. With the melting of glaciers and the collapse of glacial lakes, the debris flow in the area became more active, and glacial debris flows have occurred in channels of varying lengths, basin areas and sources, indicating that the debris flow activity was quite different in the region. More importantly, in recent years, with the combined effects of glacier melting, earthquakes and ice avalanches, the risk of debris flow in the study area has increased. Therefore, to effectively reduce the losses and risk caused by debris flow disasters, it is necessary to strengthen monitoring efforts and early warnings of glacial debris flow in the region.
The original contributions presented in the study are included in the article/Supplementary material, further inquiries can be directed to the corresponding author.
LY: Conceptualization, Methodology, Writing–original draft. TC: Conceptualization, Data curation, Writing–review and editing. GL: Resources, Writing–review and editing. XJ: Validation, Writing–review and editing.
The author(s) declare that no financial support was received for the research, authorship, and/or publication of this article.
The authors declare that the research was conducted in the absence of any commercial or financial relationships that could be construed as a potential conflict of interest.
All claims expressed in this article are solely those of the authors and do not necessarily represent those of their affiliated organizations, or those of the publisher, the editors and the reviewers. Any product that may be evaluated in this article, or claim that may be made by its manufacturer, is not guaranteed or endorsed by the publisher.
Abburu, S., and Golla, S. B. (2015). Satellite image classification methods and techniques: a review. Int. J. Comput. Appl. 119, 20–25. doi:10.5120/21088-3779
Bajracharya, S. R., Maharjan, S. B., and Shrestha, F. (2014). The status and decadal change of glaciers in Bhutan from the 1980s to 2010 based on satellite data. Ann. Glaciol. 55 (66), 159–166. doi:10.3189/2014AoG66A125
Chen, H., Cui, P., Chen, X., and Tang, J. (2017). Study on the surge wave induced by glacier avalanches and its effects on dam failure process. Int. J. Eros. Control Eng. 10 (1), 9–15. doi:10.13101/ijece.10.9
Chen, M., Tang, C., Xiong, J., Qin, Y. S., Li, N., Gong, L. F., et al. (2020). The long-term evolution of landslide activity near the epicentral area of the 2008 Wenchuan earthquake in China. Geomorphology 367, 107317. doi:10.1016/j.geomorph.2020.107317
Chen, N. S., Zhou, H., and Hu, G. (2011). Development rules of debris flow under the influence of climate change in Nyingchi. Clim. Change Res. 7 (06), 412–417. (In Chinese). doi:10.1016/B978-0-444-53599-3.10005-8
Chen, X. Q., Cui, P., Li, Y., Yang, Z., and Qi, Y. Q. (2007). Changes in glacial lakes and glaciers of post-1986 in the poiqu River Basin, nyalam, xizang (Tibet). Geomorphology 88, 298–311. doi:10.1016/j.geomorph.2006.11.012
Chigira, M., Wu, X., Inokuchi, T., and Wang, G. (2010). Landslides induced by the 2008 wenchuan earthquake, sichuan, China. Geomorphology 118, 225–238. doi:10.1016/j.geomorph.2010.01.003
Cook, K. L., Andermann, C., Gimbert, F., Adhikari, B. R., and Hovius, N. (2018). Glacial lake outburst floods as drivers of fluvial erosion in the Himalaya. Science 362, 53–57. doi:10.1126/science.aat4981
Cui, P., Chen, R., Xiang, L., and Su, F. (2014). Risk analysis of mountain hazards in Tibetan plateau under global warming. Clim. Change Res. 10 (2), 103–109. (In Chinese).
Dash, P., Göttsche, F. M., Olesen, F. S., and Fischer, H. (2002). Land surface temperature and emissivity estimation from passive sensor data: theory and practice-current trends. Int. J. Remote Sens. 23 (13), 2563–2594. doi:10.1080/01431160110115041
Fu, Y., Jiang, Y., and Wang, J. (2021). Experimental study on the undrained shear behavior of glacial till in larger-scale triaxial testing. J. Lanzhou Univ. Nat. Sci. 57 (2), 200–2006. (In Chinese).
He, Y., Cao, Z., Chen, L., and Chen, Y. (2005). Investigation on site of the2003Southern Bomi MS 5∙7 earthquake Tibet. Earthq. Res. China 21 (4), 469–474. (In Chinese).
Hu, K. H., Cui, P., You, Y., and Chen, X. Q. (2011). Influence of debris supply on the activity of post-quake debris flows. Chin. J. Geol. Hazard Control 22 (1), 1–6. (In Chinese). doi:10.3969/j.issn.1003-8035.2011.01.001
Huang, Y., Meng, X. L., Hu, X., Zhang, L., Wang, Z., Du, S., et al. (2021). Major engineering geological problems and countermeasures along traffic corridor from Ya'an to Nyingchi. J. Eng. Geol. 29 (2), 307–325. (In Chinese). doi:10.13544/j.cnki.jeg.2021-0128
Li, D., Shangguan, D. H., Wang, X. Y., Ding, Y. J., Su, P. C., Liu, R. L., et al. (2021). Expansion and hazard risk assessment of glacial lake Jialong Co in the central Himalayas by using an unmanned surface vessel and remote sensing. Sci. Total Environ. 784, 147249. doi:10.1016/j.scitotenv.2021.147249
Li, Y., Su, L., Zou, Q., and Wei, X. (2021). Risk assessment of glacial debris flow on alpine highway under climate change: a case study of Aierkuran Gully along Karakoram Highway. J. Mt. Sci-Engl. 18 (6), 1458–1475. doi:10.1007/s11629-021-6689-3
Liu, J., Cheng, Z., and Su, P. (2014). The relationship between air temperature fluctuation and glacial lake outburst floods in Tibet, China. Quatern. Int. 321, 78–87. doi:10.1016/j.quaint.2013.11.023
Liu, J., Tang, C., Cheng, Z., and Liu, Y. (2011). Impact of temperature on glacier-lake outbursts in Tibet. J. Jilin Univ. (Earth Sci. Ed. 41 (4), 1121–1129. (In Chinese). doi:10.3969/j.issn.1671-5888.2011.04.023
Medeu, A. R., Popov, N. V., Blagovechshenskiy, V. P., Askarova, M. A., Medeu, A. A., Ranova, S. U., et al. (2022). Moraine-dammed glacial lakes and threat of glacial debris flows in South-East Kazakhstan. Earth-Sci. Rev. 229, 103999. doi:10.1016/j.earscirev.2022.103999
Merry, K., Bettinger, P., Crosby, M., and Boston, K. (2023). Geographic information system skills for foresters and natural resource managers. Elsevier, 231–267. doi:10.1016/C2020-0-03530-9
Nie, Y., Sheng, Y., Liu, Q., Liu, L., Liu, S., Zhang, Y., et al. (2017). A regional-scale assessment of Himalayan glacial lake changes using satellite observations from 1990 to 2015. Remote Sens. Environ. 189, 1–13. doi:10.1016/j.rse.2016.11.008
Qin, Z., and Karnieli, A. (1999). Progress in the remote sensing of land surface temperature and ground emissivity using NOAA-AVHRR data. Int. J. Remote Sens. 20 (12), 2367–2393. doi:10.1080/014311699212074
Racoviteanu, A. E., Nicholsonm, L., Glasserm, N. F., Miles, E., Harrison, S., and Reynolds, J. M. (2022). Debris-covered glacier systems and associated glacial lake outburst flood hazards: challenges and prospects. J. Geol. Soc. Lond. 179. doi:10.1144/JGS2021-084
Riaz, S., Ali, A., and Baig, M. N. (2014). Increasing risk of glacial lake outburst floods as a consequence of climate change in the Himalayan region. Jàmbá J. Disaster Risk Stud. 6 (1), 1–6. doi:10.4102/jamba.v6i1.110
Shangguan, D., Li, D., Ding, Y., Liu, J., Anjum, M. N., Li, Y., et al. (2021). Determining the events in a glacial disaster chain at Badswat Glacier in the Karakoram Range using remote sensing. Remote Sens. 13 (6), 1165. doi:10.3390/RS13061165
Shrestha, F., Uddin, K., Maharjan, S. B., and Bajracharya, S. R. (2016). Application of remote sensing and GIS in environmental monitoring in the Hindu Kush Himalayan region. Aims Environ. Sci. 3 (4), 646–662. doi:10.3934/environsci.2016.4.646
Su, P., Liu, J., Li, Y., Liu, W., Wang, Y., Ma, C., et al. (2021). Changes in glacial lakes in the poiqu River Basin in the central Himalayas. Hydrol. Earth Syst. Sc. 25, 5879–5903. doi:10.5194/HESS-25-5879-2021
Tang, C., Zhu, J., Qi, X., and Ding, J. (2011). Landslides induced by the Wenchuan earthquake and the subsequent strong rainfall event: a case study in the Beichuan area of China. Eng. Geol. 122 (1-2), 22–33. doi:10.1016/j.enggeo.2011.03.013
Wang, W., Xiang, Y., Gao, Y., Lu, A., and Yao, T. (2014). Rapid expansion of glacial lakes caused by climate and glacier retreat in the Central Himalayas. Hydrol. Process 29 (6), 859–874. doi:10.1002/hyp.10199
Wei, X., Chen, R., Chen, B., Li, B., and Yang, X. (2018). Control effect of new shallow sill structure on gully erosion of glacial debris flow and its application. J. Catastrophology 33 (S1), 40–46. (In Chinese). doi:10.3969/j.issn.1000-811X.2018.Z1.008
Wu, G., Yao, T., Wang, W., Zhao, H., Yang, W., Zhang, G., et al. (2019). Glacial hazards on Tibetan plateau and SurroundingAlpines. Bull. ChineseAcademy Sci. 34 (11), 1285–1292. (In Chinese).
Xie, T., Yin, Q., Gao, H., Chen, F., Shen, N., and Lin, D. (2019). Study on early warning model of glacial⁃rainfall debris flow based on excitation condition and stability of accumulation body. J. Glaciol. Geocryol. 41 (4), 884–891. (In Chinese). doi:10.7522/j.issn.1000-0240.2019.0403
Xiong, J., Tang, C., Chen, M., Gong, L., Li, N., Zhang, X., et al. (2021a). Long-term changes in the landslide sediment supply capacity for debris flow occurrence in Wenchuan County, China. Catena 203, 105340. doi:10.1016/j.catena.2021.105340
Xiong, J., Tang, C., Chen, M., Zhang, X. Z., Shi, Q. Y., and Gong, L. F. (2021b). Activity characteristics and enlightenment of the debris flow triggered by the rainstorm on 20 August 2019 in Wenchuan County. China. Bull. Eng. Geol. Environ. 80 (2), 873–888. doi:10.1007/s10064-020-01981-x
Yan, S. Y. (2020). Hazard assessment of glacier lake outbursts in the ParlungZangbo basin based on catastrophe progression method. Beijing: China University of Geosciences. (In Chinese).
Yang, Z., Zhu, Y., and Zou, D. H. (2011a). “Formation conditions and risk evaluation of glacial debris flow disasters along International Karakorum Highway (KKH),” in 5th international conference on debris-flow Hazards mitigation: mechanics, prediction and assessment (Padua, Italy: Università La Sapienza), 1031–1037.
Yang, Z., Zhu, Y., Zou, D. H., and Liao, L. (2011b). Activity degree evaluation of glacial debris flow along international KARAKORUM Highway (KKH) Based on Fuzzy Theory. Adv. Mater. Res. 261, 1167–1171. doi:10.4028/www.scientific.net/AMR.261-263.1167
Zhang, T., Wang, W., Gao, T., and Baosheng, A. (2021). Simulation and assessment of future glacial lake outburst floods in the Poiqu River basin, Central Himalayas. Water 13 (10), 1376. doi:10.3390/w13101376
Keywords: glacial debris flow, glacial lake burst, climate change, debris flow activity, remote sensing
Citation: Yang L, Chuan T, Lingfeng G and Jiang X (2023) The evolution of glacial lake and glaciers and their potential impact on glacial debris flow activity in the Palong Zangbu catchment in Southeastern Tibet. Front. Earth Sci. 11:1265852. doi: 10.3389/feart.2023.1265852
Received: 24 July 2023; Accepted: 08 November 2023;
Published: 28 December 2023.
Edited by:
Yunhui Zhang, Southwest Jiaotong University, ChinaReviewed by:
Xun Huang, Chongqing Normal University, ChinaCopyright © 2023 Yang, Chuan, Lingfeng and Jiang. This is an open-access article distributed under the terms of the Creative Commons Attribution License (CC BY). The use, distribution or reproduction in other forums is permitted, provided the original author(s) and the copyright owner(s) are credited and that the original publication in this journal is cited, in accordance with accepted academic practice. No use, distribution or reproduction is permitted which does not comply with these terms.
*Correspondence: Liu Yang, WWFuZ2xpdTAwMDAyMDIzQDE2My5jb20=
Disclaimer: All claims expressed in this article are solely those of the authors and do not necessarily represent those of their affiliated organizations, or those of the publisher, the editors and the reviewers. Any product that may be evaluated in this article or claim that may be made by its manufacturer is not guaranteed or endorsed by the publisher.
Research integrity at Frontiers
Learn more about the work of our research integrity team to safeguard the quality of each article we publish.