 Andrew Hazelton1,2*
 Ghassan J. Alaka Jr.2
 Lew Gramer1,2William Ramstrom1,2Sarah Ditchek1,2
 Xiaomin Chen3
 Bin Liu4,5
 Zhan Zhang4Lin Zhu4,6
 Weiguo Wang4,6Biju Thomas4,5JungHoon Shin4,5Chuan-Kai Wang4,7
 Hyun-Sook Kim2
 Xuejin Zhang2
 Avichal Mehra4Frank Marks2Sundararaman Gopalakrishnan2
- 1University of Miami CIMAS, Miami, FL, United States
- 2NOAA AOML, Miami, FL, United States
- 3Department of Atmospheric and Earth Science, University of Alabama in Huntsville, Huntsville, AL, United States
- 4NCEP Environmental Modeling Center (EMC), College Park, MD, United States
- 5Lynker Technologies LLC, Rockville, MD, United States
- 6Science Applications International Corporation, Lanham, MD, United States
- 7Redline Performance Solutions LLC, Rockville, MD, United States
During the 2022 hurricane season, real-time forecasts were conducted using an experimental version of the Hurricane Analysis and Forecast System (HAFS). The version of HAFS detailed in this paper (HAFSV0.3S, hereafter HAFS-S) featured the moving nest recently developed at NOAA AOML, and also model physics upgrades: TC-specific modifications to the planetary boundary layer (PBL) scheme and introduction of the Thompson microphysics scheme. The real-time forecasts covered a large dataset of cases across the North Atlantic and eastern North Pacific 2022 hurricane seasons, providing an opportunity to evaluate this version of HAFS ahead of planned operational implementation of a similar version in 2023. The track forecast results show that HAFS-S outperformed the 2022 version of the operational HWRF model in the Atlantic, and was the best of several regional hurricane models in the eastern North Pacific for track. The intensity results were more mixed, with a dropoff in skill at Days 4–5 in the Atlantic but increased skill in the eastern North Pacific. HAFS-S also showed some larger errors than the long-time operational Hurricane Weather Research and Forecasting (HWRF) model in the radius of 34-knot wind, but other radii metrics are improved. Detailed analysis of Hurricane Ian in the Atlantic highlights both the strengths of HAFS and opportunities for further development and improvement.
1 Introduction
Over the last decade, notable improvements have been made to operational tropical cyclone (TC) forecasting, thanks in large part to coordinated efforts such as the Hurricane Forecast Improvement Project (HFIP; Gopalakrishnan et al., 2021). For example, track forecasts have continued a decades-long improvement trend, including lower errors for 4-day and 5-day forecasts (e.g., Landsea and Cangialosi, 2018). In addition, after a long period of little improvement in intensity forecasts, the efforts of HFIP and other research and development programs have recently resulted in notable intensity-forecast improvements (Cangialosi et al., 2020). Recently, more attention has been given to other metrics such as wind radii (e.g., Cangialosi and Landsea, 2016) to evaluate the structure, including the horizontal extent, of TC hazards. Yet, traditional TC forecast verification has long focused on track and intensity, leaving plenty of room for improvement in the evaluation of non-traditional forecast metrics, especially wind radii. There are still many challenges in operational hurricane forecasting, including getting the details of TC track right in certain high-impact cases, prediction of rapid intensification (RI, Kaplan et al., 2015), and prediction of TC structure and the associated hazards and impacts. NOAA’s hurricane model development efforts are focused on filling these gaps.
The Hurricane Analysis and Forecast System (HAFS) is part of NOAA’s Unified Forecast System (UFS), a collection of forecast models based on the finite-volume cubed sphere (FV3) dynamical core (Lin and Rood, 1996; Lin, 2004). HAFS specifically takes advantage of the 2-way nesting capabilities of FV3 (Harris and Lin, 2013). Over the last few years, several studies have examined various configurations of HAFS and evaluated them in real-time and/or experimental settings. For example, the global-nested version of HAFS (HAFS-globalnest) was run in real-time during the 2019, 2020, and 2021 hurricane seasons. It produced promising forecasts of TC track, intensity, and structure (Hazelton et al., 2021; Hazelton et al., 2022), with upgrades such as ocean coupling and modified planetary boundary layer (PBL) physics added over time. A similar nested-FV3 configuration known as the Tropical Atlantic version of GFDL’s System for High-resolution prediction on Earth-to-Local Domains (T-SHiELD, Harris et al., 2020) has also been tested in real-time over the last several seasons, building on earlier promising results of a prototype version (then known as hfvGFS) during the 2017 Atlantic hurricane season (Hazelton et al., 2018). Another version of HAFS that was run during the 2019–2021 was the stand-alone-regional (SAR) configuration (HAFS-SAR or HAFS-A; Dong et al., 2020; Chen et al., 2023). These various experimental configurations have provided an opportunity to test various model physics and dynamics upgrades, and other configuration changes, all with the goal of building a version of HAFS that can eventually be implemented in operations.
The 2022 hurricane season provided an opportunity for a final real-time evaluation of HAFS ahead of a planned operational implementation in 2023. This real-time experiment was supported by the Hurricane Forecast Improvement Project (HFIP), which supports real-time experiments every hurricane season, often for model designs that are being explored for operational implementation. This set of experiments was the first one to use the moving nest capability (Ramstrom et al., 2023). In addition, this was the first time that a real-time experiment using HAFS focused on the eastern North Pacific basin in addition to the North Atlantic, allowing for a large sample to evaluate the model in both of the basins of responsibility for the National Hurricane Center (NHC). Although this version was a precursor to the version of HAFS that is being tested for operational implementation, the evaluation of these results will be critical for assessing the performance and ongoing development. Analysis of this configuration will provide further guidance on the performance of experimental model physics upgrades and will also motivate ongoing and future improvements to the model. Some of these improvements will be included in the initial operational version and others may be included in future operational versions.
2 Model configuration and cases used
2.1 Grid configuration
1. For the first time during the 2022 season, a real-time experiment was conducted using the storm-centric moving nest version of HAFS (Ramstrom et al., 2023; HAFSV0.3). The configuration is similar to that used in the operational Hurricane Weather Research and Forecasting (HWRF) model. Each HAFSV0.3 forecast is centered on one TC, with an outer domain of approximately 79° x 79° centered on the TC, with 6-km grid spacing. The inner moving nest follows the TC with a nested domain of approximately 12° x 12°, with 2-km grid spacing. The moving nest concept allows the tropical cyclone to be simulated at high resolution while still maintaining computational efficiency, without losing significant forecast accuracy (based on testing of hindcast cases). HAFSV0.3 is coupled to the Hybrid Coordinate Ocean Model (HYCOM, e.g., Bleck, 2002; Kim et al., 2014; Kim et al., 2022), which runs concurrently with the atmospheric model. Including ocean coupling helps eliminate a positive intensity bias that was found in earlier versions of HAFS (e.g., Hazelton et al., 2022) and produce more realistic TCs. The HYCOM domain is fixed (not storm-centric) and covers the Atlantic and eastern North Pacific oceans (NHC areas of responsibility) with 9-km grid spacing. Figure 1 illustrates the model grid configuration for an example case: a TC centered over the NW Caribbean Sea. Note that the atmosphere and ocean domains differ in size. To address this mismatch, ocean grid points that lie outside the atmosphere domain are forced by atmospheric fields from the Global Forecast System (GFS), and atmosphere grid points that lie outside the ocean domain are forced by a constant ocean. The GFS is also used as the initial and lateral boundary conditions for the atmospheric domain. HAFSV0.3 uses 81 vertical levels. For 2022, there were two versions of HAFSV0.3 tested in real-time: HAFS-A (also referred to as HAFSV0.3A or HF3A1) and HAFS-S (also referred to as HAFSV0.3S or HF3S). The main difference between them was model physics and some initialization options, and this paper will focus on HAFS-S.

FIGURE 1. Example of the HAFSV0.3 grid configuration used in real-time in 2022. The black box shows the outer domain (storm centric with 6-km grid spacing). The red box shows the storm-centered moving nest with 2-km grid spacing. The HYCOM ocean domain (with 9-km grid spacing) is shown in blue.
2.2 Model physics configuration
Some of the model physics options used in HAFS-S were similar to those used in prior years. For example, the model used the scale-aware SAS convective scheme (Han et al., 2017) on both the outer domain and moving nest. Similar to the 2020 version of HAFS-globalnest, 2022 versions of HAFS also used the turbulent-kinetic-energy (TKE)-based Eddy Diffusivity Mass Flux (EDMF-TKE) PBL scheme (Han and Bretherton, 2019). This scheme was recently improved to address the overestimation of TKE values in the lower TC boundary layer based on large-eddy simulation (LES) results (see details in Chen et al., 2022). These changes include upgrades to how the mass fluxes and mixing lengths are calculated in tropical cyclone environments. Evaluation of this improved EDMF-TKE scheme from HAFS forecasts during the 2021 North Atlantic hurricane season was presented in Chen et al. (2023), and demonstrated better prediction of TC structure and reduction of negative intensity bias. Another major physics change in 2022 HAFS-S was the use of the Thompson double-moment microphysics (Thompson et al., 2004) instead of the single-moment 6-class GFDL microphysics scheme (Zhou et al., 2022) that was used in previous real-time HAFS experiments (and HAFS-A in 2022). The Thompson microphysics is being used in other UFS applications, and we hope to increase diversity between the two versions of HAFS by using a different microphysics scheme in one of them. The relative impacts of the PBL and microphysics changes in HAFS are being evaluated in a separate study.
2.3 Model initialization configuration
While prior versions of HAFS were cold-started off of the GFS analysis, the 2022 versions, including HAFS-S analyzed here, included several vortex initialization and data assimilation options. Specifically, observations were assimilated on the inner nest including, when applicable, Tail Doppler Radar (TDR) and other airborne reconnaissance observations. Vortex initialization (e.g., Lin, 2004) options were applied, including vortex relocation (VR) for all cases. Vortex modification (VM) was only applied to cases where the initial intensity was at least 30 m/s. As mentioned above, the outer domain initial and lateral boundary conditions were supplied by operational GFS forecasts.
3 Results
3.1 Overall verification
TCs were tracked using the latest version of the GFDL vortex tracker (Marchok, 2021). For the verification results, we employed NHC rules for verification: forecasts were verified if the system was classified as a tropical or subtropical cyclone at both the initialization time and the forecast verifying time (Cangialosi 2022), and results shown are for homogeneous samples of all analyzed models. We performed the verification on the “late” model forecasts (i.e., the raw model forecasts without NHC post-processing) and verified the data every 6 h. To provide additional information beyond just the commonly calculated mean absolute error (MAE) and bias statistics, for many of the forecast metrics we also include the consistency metric as described in Ditchek et al. (2023). For more quantitative information on the consistency metric, refer to their Figure 2. This metric, along with the standard forecast metrics, were calculated using the GRaphics for OS(s) Es and Other modeling applications on TCs (GROOT) verification package. The consistency metric applies thresholds to three separate metrics (MAE skill, median absolute error skill, and frequency of superior performance (FSP); Goldenberg et al., 2015) to objectively identify lead times with improvement or degradation that was either fully or marginally consistent. Thus, using this verification technique allows us to assess the robustness of differences in forecast skill. For the consistency metric and MAE skill for all metrics, the 2022 operational HWRF forecasts were used as the baseline, as HAFS is slated to eventually replace HWRF in operations (so these comparisons will help see how HAFS performs relative to the currently-operational state-of-the-art hurricane model). For comparison purposes, forecasts from HAFS-A and the Hurricanes in a Multi-scale Ocean-coupled Non-hydrostatic Model (HMON) are also included. Both also use HWRF forecasts as the baseline, as well.
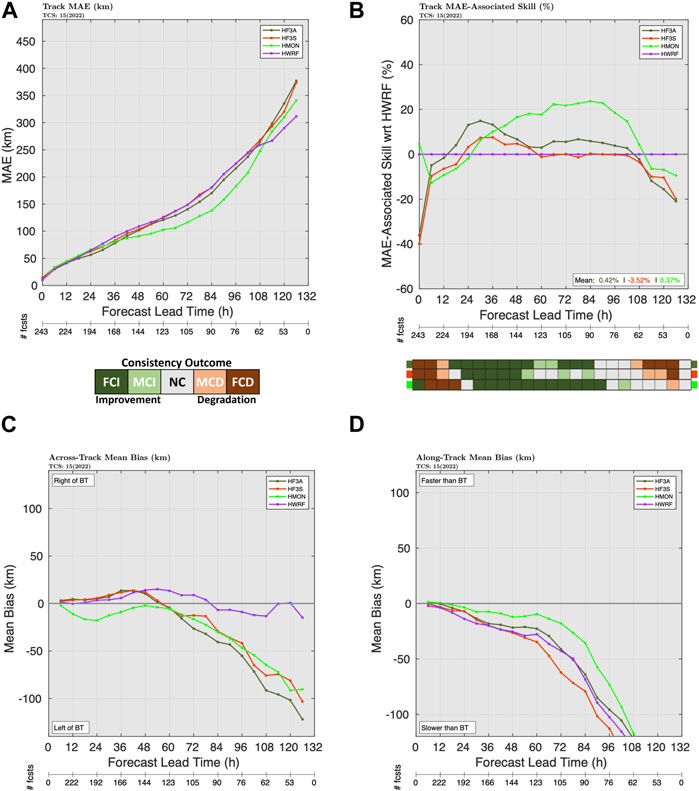
FIGURE 2. Atlantic Basin (A) mean absolute error (MAE, km) for TC track for HAFS-S (red), HAFS-A (dark green), HMON (light green), and HWRF (purple), (B) track skill relative to HWRF with the consistency metric for the track forecast, ranging from dark green (fully-consistent improvement) to dark brown (fully-consistent degradation), (C) as in (A), but for across-track bias, and (D) as in (A), but for along-track bias.
3.1.1 Track verification
In the Atlantic Basin, the overall track-forecast results from HAFS-S were generally slightly positive to neutral compared to the HWRF baseline (Figure 2). HAFS-S had predominantly fully-consistent improvement over HWRF during the first 2–3 days of the forecast period, with skill improvement of up to 5%–10%. On the other hand, the track skill was generally neutral to slightly negative at Days 4–5. HAFS-S performed slightly worse for track than the other HAFSV0.3 configuration, HAFS-A. The along-track and across-track errors (Figures 2C, D) show that HAFS-S (as well as HAFS-A) had a tendency to be too far left and too slow. The left bias was unusual given the tendency for right bias seen in past HAFS real-time runs (e.g., Hazelton et al., 2021) due to biases in the subtropical ridge. Some of this left bias in 2022 may have been due to how HAFS-S handled the interaction of several recurving TCs with the mid-latitude troughs that dipped down to pick up the TC. An example of this left bias due to an incorrect depiction of the trough will be examined for Hurricane Ian in a later section.
For the eastern North Pacific Basin (Figure 3), both versions of HAFS performed quite well for track. HAFS-S was the best of the four regional hurricane models examined, particularly at Days 4–5. In the first 24 h of the forecast, HAFS-S had some fully-consistent degradation, indicating a need to continue developing and refining the initialization and data assimilation techniques for HAFS. However, from ∼36 h onward, HAFS-S had fully-consistent improvement and large MAE skill over HWRF. The MAE-skill improvement grew with lead time, as well—by 120 h the HAFS-S track skill was over 30% better than that of HWRF in the eastern North Pacific. Examination of the along-track and across-track errors (Figures 3C, D) shows that HAFS-S had relatively little track bias overall, which was an encouraging result for this configuration of HAFS. In particular, a notable left-of-track bias in HWRF and HMON was not present for HAFS-S, and the fast bias that was present in all of the regional hurricane models (including both HAFS versions) was notably reduced in HAFS-S.
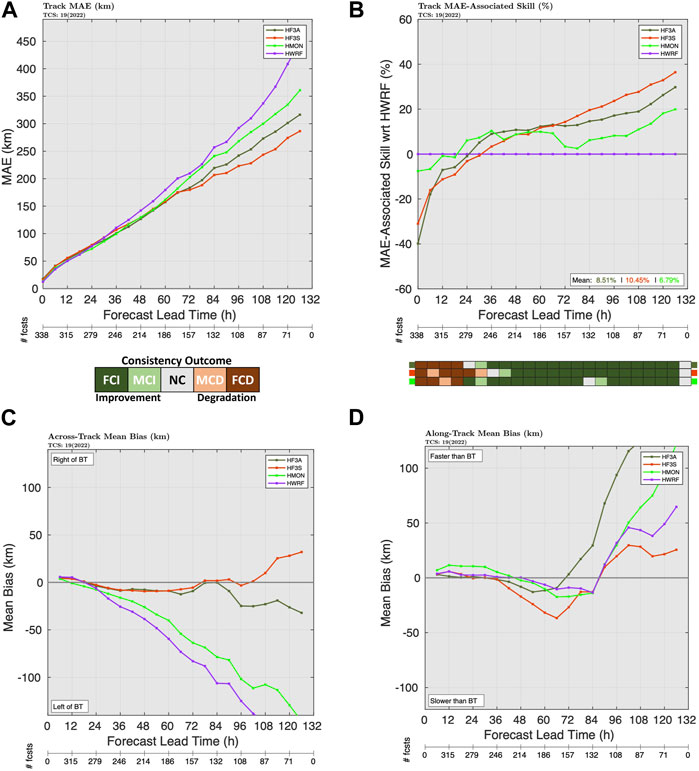
FIGURE 3. As in Figure 2 but for the eastern North Pacific Basin.
The verification package used in this study calculates the percentage-point-contribution (PPC) of each TC at each lead time to the overall MAE skill (in this case, relative to HWRF). This result is shown for HAFS-S in the Atlantic and eastern North Pacific in Figure 4. For the Atlantic basin, most of the skill came from Hurricanes Earl, Fiona, and Ian, although Ian had some degradation at Day 5 (which will be discussed in more detail later). Hurricanes Danielle and Lisa also contributed to some degradation at Days 4–5. For the eastern North Pacific, much of the notable increase in track skill over HWRF came from early-season Tropical Storm Celia. There were not many long-track storms in either the eastern North Pacific or Atlantic this year, so the sample size at Day 5 was fairly limited (71 and 53, respectively). Nevertheless, the overall improvement relative to HWRF over many forecast lead times in both basins is encouraging for HAFS-S.
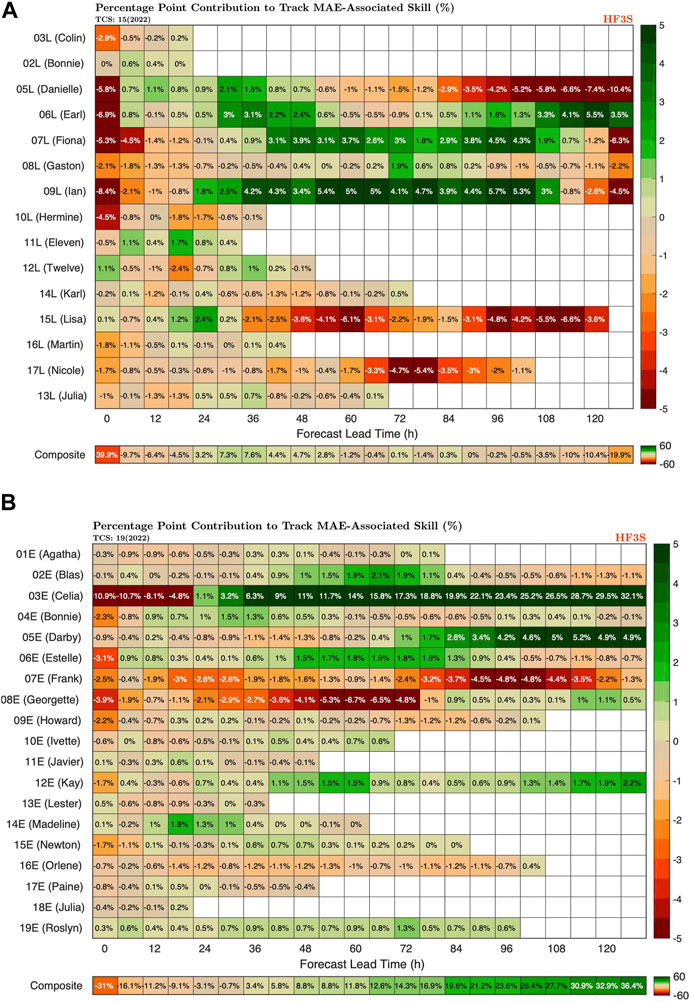
FIGURE 4. (A) Atlantic basin percentage-point-contribution (PPC) graphics for HAFS-S for track skill (relative to HWRF) for each forecast TC during the 2022 season. Green indicates improvement relative to the HWRF baseline, brown indicates degradation. (B) As in (A), but for the eastern North Pacific basin.
3.1.2 Intensity verification
As discussed in Cangialosi et al., 2020, intensity forecasts have shown improvement over the last decade, thanks to improved understanding of the processes driving intensity change and also significant upgrades to model forecast skill. As HAFS is implemented and developed going forward, the aim is to continue this improvement.
In the Atlantic Basin, HAFS-S was comparable to (or slightly worse than) HWRF for the first 2–3 days of the forecast, with marginally-consistent degradation at 24 h and marginally-consistent improvement at 60 h. At Days 4–5, there was notable, fully-consistent degradation of the HAFS-S intensity skill relative to HWRF. Both versions of HAFSV0.3, and HAFS-S in particular, suffered from a negative intensity bias at Days 3–5 (Figure 5C). However, the pressure bias (Figure 5D) was fairly small in HAFS-S, while HWRF had a larger negative pressure bias despite a wind bias closer to 0. This indicates that the pressure/wind relationship is not optimal in either model, and TC structure needs to be a focus of ongoing improvement in HAFS. The PPC graphics, which will be examined later, will provide some insight into the cases that were most responsible for this long-term skill decrease, although it should be noted that the sample size was fairly small by Day 5 (53 cases) since there were not a lot of long-track cases during the 2022 Atlantic Hurricane season.
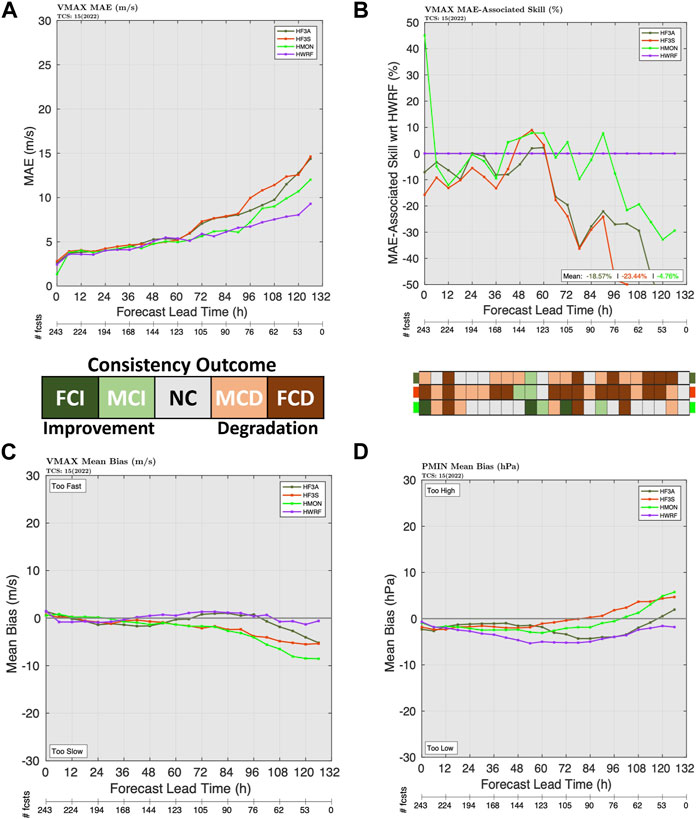
FIGURE 5. Atlantic Basin (A) mean absolute error (MAE, ms-1) for TC intensity for HAFS-S (red), HAFS-A (dark green), HMON (light green), and HWRF (purple), (B) intensity skill relative to HWRF with the consistency metric for the intensity forecast, ranging from dark green (fully-consistent improvement) to dark brown (fully-consistent degradation), and (C) as in (A), but for intensity bias. (D) As in (C), but for pressure bias instead of Vmax bias.
For the eastern North Pacific basin, HAFS-S was generally worse than HWRF for intensity out to about 90 h (Figure 6). In particular, the lower skill at early lead times indicates the need for continued refinement of the DA and initialization in HAFS. However, at longer lead times (96–120 h), HAFS-S had notably better intensity skill than HWRF, with a skill increase of 30% at Day 5 and at least marginally-consistent improvement. These findings are consistent with Emanuel and Zhang (2016), which showed that intensity errors in the first few days of a forecast are dominated by initial condition errors, but intensity skill at longer lead times (beyond Day 3 or so) is more dependent on track skill. Given the notably superior track forecasts from HAFS-S, it is therefore not surprising that the long-term intensity skill is also superior.
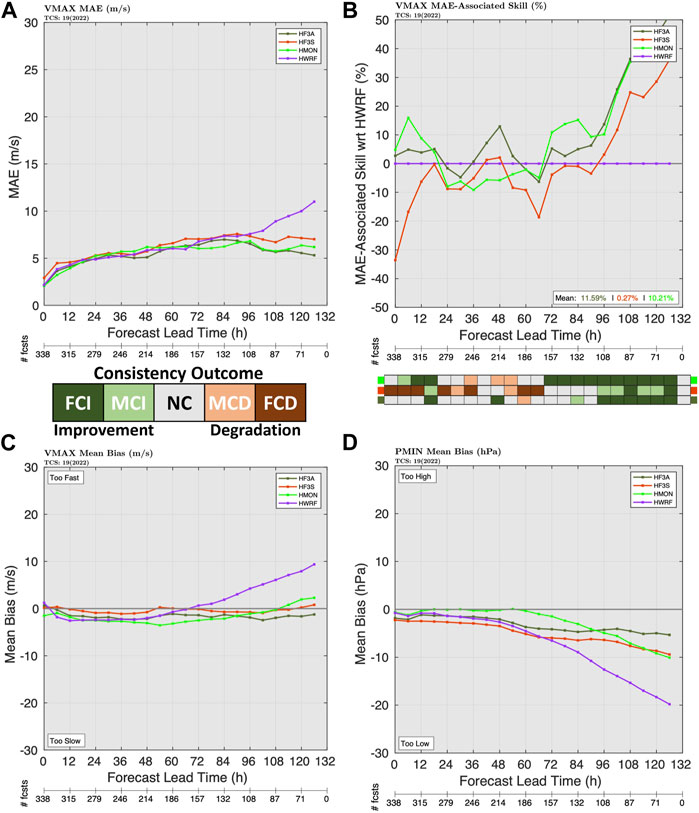
FIGURE 6. As in Figure 5 but for the eastern North Pacific Basin.
The PPC graphics for intensity (Figure 7) are enlightening in regards to the intensity skill in both basins. In the Atlantic basin, most of the intensity degradation at longer lead times was caused by poor 4–5 day forecasts in Hurricane Fiona. This TC was difficult to predict accurately due to interactions with the terrain of Hispaniola and Puerto Rico as well as being embedded in a moderate shear environment. Ongoing work is exploring whether some of the intensity errors in this case were due to track forecasts that had too much interaction with the mountainous terrain. Hurricanes Danielle and Earl also contributed to intensity forecast degradation. Overall, HAFS-S had the best intensity forecasts for Hurricanes Ian, Lisa, and Nicole. In the eastern North Pacific basin, as with track, Celia (03E) again provided much of the Day 4–5 skill. TCs Blas, Bonnie, and Estelle also contributed positively to the Day 4–5 intensity skill in the eastern North Pacific. Interestingly, Hurricane Bonnie, which crossed over from the Caribbean into the eastern North Pacific, was also one of the few TCs that contributed negatively to the skill at earlier lead times. The TC that contributed most positively to the intensity skill at early lead times (where processes other than just track differences due to synoptic variability were important) was Hurricane Roslyn late in the season. HAFS-S also struggled with intensity forecasts for Frank and Georgette, an unsurprising result given these two TCs engaged in a binary interaction.
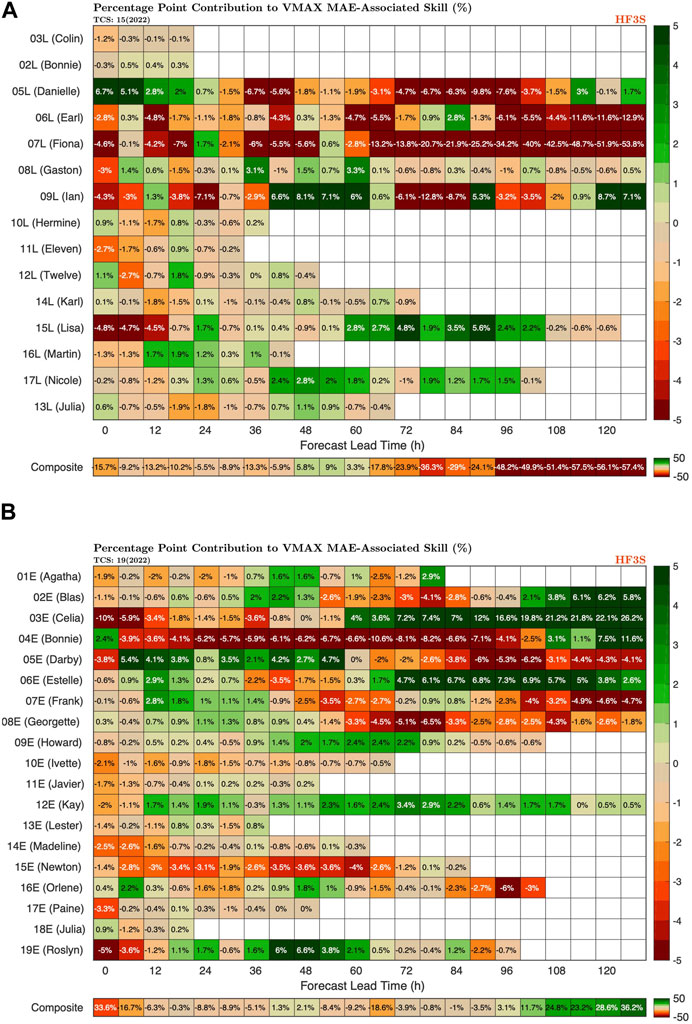
FIGURE 7. As in Figure 4 but for intensity.
3.1.2.1 Rapid intensification evaluation
One of the key goals of the Hurricane Forecast Improvement Project (HFIP, Gopalakrishnan et al., 2021) is to improve the forecasts of rapid intensification (RI). RI cases tend to be a key contributor to overall intensity error statistics for the basin (e.g., Trabing and Bell, 2020), and so continuing to refine forecasts of intensity skill during RI will be critical for reaching the overall intensity forecast goals outlined by HFIP.
The RI threshold used in this study is the threshold of 30 kt (15.4 ms-1)/24 h first defined in Kaplan and DeMaria, (2003). The RI forecast results for 2022 HAFS-S (Figure 8) are examined with two different methods. First, performance diagrams (Roebber, 2009) are created to highlight the probability of detection (POD), false alarm ratio (FAR), and critical success index (CSI) for each model for RI cases in each basin (Figures 8A, B). POD is the number of successful RI forecasts divided by the total number of RI cases observed, while FAR is defined as the number of times when RI is forecast but does not occur divided by the total number of times RI is forecast (e.g., Kaplan et al., 2010). For these diagrams, all RI forecasts were included in the sample (to increase the sample size), regardless of at what forecast hour they occurred. For the Atlantic, the overall performance of HAFS-S was comparable to that of HWRF and HMON in 2022, although both the POD and FAR were slightly lower. Notably, HAFS-S had much higher overall RI skill in the North Atlantic in 2022 than HAFS-A, with both a higher POD and a lower FAR. For the eastern North Pacific basin, both HAFSV0.3 versions performed solidly for RI. HAFS-S had a similar POD to HAFS-A, although the overall skill was slightly lower due to more false alarms in HAFS-S. HAFS-S solidly outperformed both HWRF and HMON in the eastern North Pacific for RI detection, consistent with the better overall intensity skill there. In general, all models had a negative intensity bias on average for RI cases (not shown).
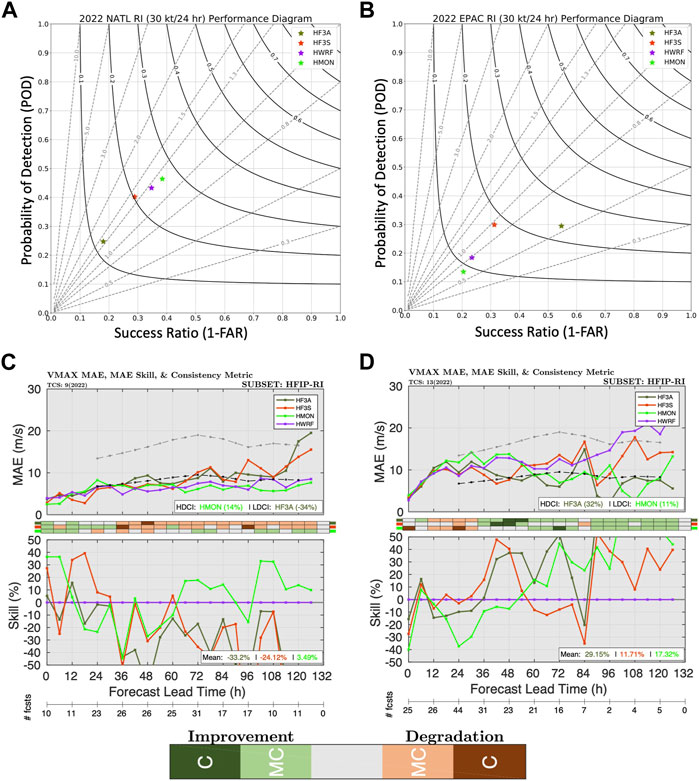
FIGURE 8. (A) Performance diagram for Atlantic Basin RI skill for HAFS-S (red), HAFS-A (dark green), HWRF (purple), and HMON (light green). The diagram shows 1-FAR on the x-axis, the POD on the y-axis, the bias in the diagonal lines, and the CSI in the curved lines. (B) As in (A), but for the eastern North Pacific Basin. (C) MAE (m/s) for intensity (top) and intensity skill relative to HWRF (bottom) for the 2022 Atlantic Basin for cases meeting the HFIP RI definition (DeMaria et al., 2021). The HFIP RI MAE baseline and goals are shown in the dashed lines. The consistency metric is shown in the colorbar. (D) As in (C), but for the eastern North Pacific Basin.
In addition to the skill diagrams, we examined RI skill by performing an intensity verification for all cases in the 2022 dataset that fit the HFIP definition of RI (DeMaria et al., 2021). For this definition, verification times are included if any one of the models included in the sample (in this case, HWRF, HMON, HAFS-S, and HAFS-A) were undergoing RI, or if the observed TC was undergoing RI at the verification time. This definition allows for a larger sample size for evaluation. Figures 8C, D show the intensity verifications for the Atlantic and eastern North Pacific for the HFIP-RI subsets, including the consistency metric. The results are somewhat noisy at longer lead times (Days 4–5) due to a small sample size. In general, however, the results are consistent with the overall intensity results. For the Atlantic, HAFS-S shows marginally-consistent improvement at early lead times (Days 1–2) and marginally-consistent degradation at longer lead times (Days 4–5). The errors for the first 3 days were below the HFIP goals, but above after. For the eastern North Pacific, the RI verification was mixed (some degradation and some improvement at different times) early, but Days 4–5 showed marginally-consistent improvement over HWRF. In general, however, the intensity errors for the eastern North Pacific were higher and further from the HFIP goals than in the North Atlantic (although the small sample size makes interpretation somewhat difficult). These results show promise but also indicate that ongoing improvement to HAFS is needed to continue to improve the skill of these critical RI cases.
3.1.3 Radii verification
An additional metric that has started to be analyzed more in recent years is the wind radii. Cangialosi and Landsea, (2016) provided one of the first verifications of official forecasts of wind radii, and previous examinations of HAFS (e.g., Hazelton et al., 2022; Chen et al., 2023) have also examined this metric for previous experimental versions of HAFS. TC size is an important metric for understanding how a model is handling storm structure, and size is also critical for impacts, including storm surge (e.g., Irish et al., 2008). The wind radii that are specifically examined are the 4 thresholds that are reported operationally by the National Hurricane Center: 34-kt, 50-kt, 64-kt, and radius of maximum winds (RMW). The model is verified using the Best Track radii estimates from NHC, which represent the maximum radii at which a given wind threshold is observed in a given quadrant of the TC (and then averaged together to get a value for the whole TC).
Figure 9 shows the wind radii verification bias results for the North Atlantic basin during the 2022 Atlantic hurricane season. HAFS-S generally had too small of an outer wind radius (34-kt, Figure 9A), but the 50-kt and 64-kt wind radii were generally well-calibrated, and perform better than HWRF, with fairly small bias (Figures 9B, C). The RMW bias for HAFS-S was generally a bit large, similar overall to HMON in real-time (Figure 9D). It should be noted that some recent changes in how the wind radii are calculated in the GFDL vortex tracker may slightly muddle some interpretation of these results, and the tracker code is in the process of being optimized for real-time HAFS runs. However, work is also ongoing to optimize the model physics for structure prediction, which we believe will also lead to improvement of rapid intensification, as TC size has been shown to be closely linked to rapid intensification (Carrasco et al., 2014).
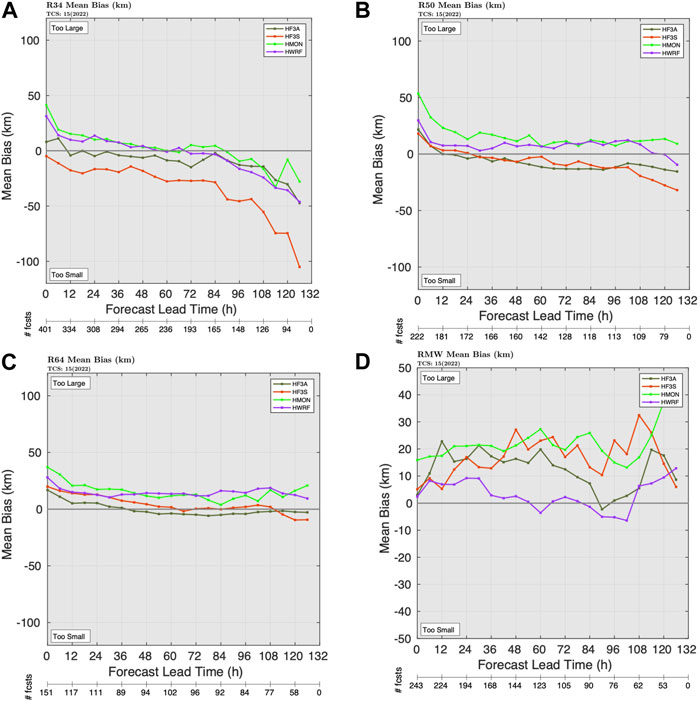
FIGURE 9. (A) Mean bias for 34-kt wind radii for the 2022 Atlantic Basin for HAFS-S (red), HAFS-A (dark green), HWRF (purple), and HMON (light green). (B) As in (A), but for 50-kt wind radii. (C) As in (A), but for 64-kt wind radii. (D) As in (A), but for RMW.
Figure 10 shows the radii results for the eastern North Pacific Basin from 2022. It should be noted that the eastern North Pacific results may be slightly less reliable due to fewer aircraft observations in that basin (Cangialosi and Landsea, 2016). The results are somewhat different than those in the North Atlantic. HAFS-S is generally well-calibrated with fairly small bias for 34-kt, 50-kt, and 64-kt wind radii. In particular, the 34-kt wind radii is notably better than HWRF, which has a positive size bias (too large) at all lead times in the eastern North Pacific basin. The RMW bias is positive at early leads in the eastern North Pacific (similar to that in the North Atlantic) but changes to a negative bias at Days 4–5. Continued work on PBL physics and other aspects of the model (including optimization of the tracker) should lead to reliable structure forecasts in all basins, and this metric will be an important one to continue to track in future versions of HAFS.
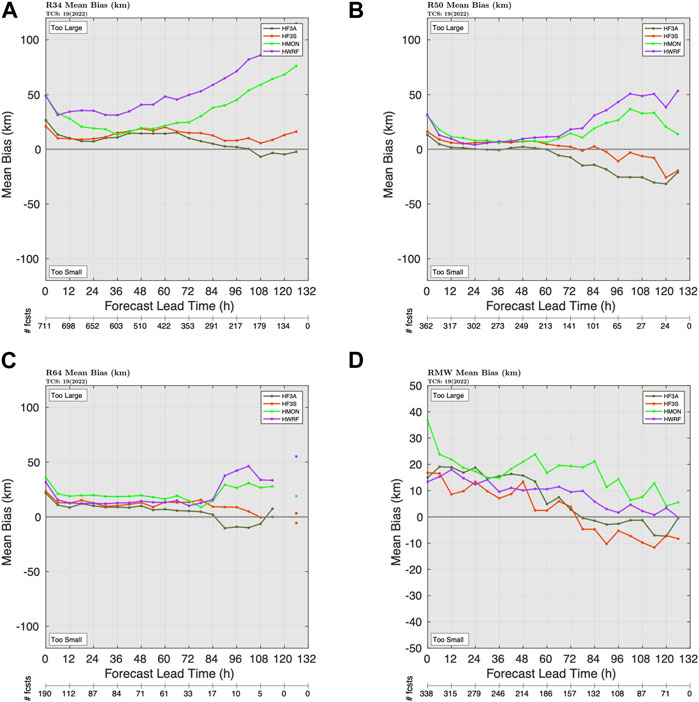
FIGURE 10. As in Figure 9, but for the eastern North Pacific Basin.
3.2 Case study of Hurricane Ian
The composite results discussed above illustrated how HAFS-S showed promising results in forecasts of TC track, intensity, and storm structure during the 2022 Atlantic and eastern North Pacific hurricane seasons. In this subsection, we will examine one of the most impactful hurricanes from 2022. Hurricane Ian formed over the Caribbean Sea in late September and rapidly intensified before moving into Cuba. It then further intensified into a Category 5 hurricane in the Gulf of Mexico before impacting southwest Florida as a Category 4 hurricane with strong winds, heavy rain, and devastating storm surge. Figure 11 shows the HAFS-S track and intensity forecasts for Ian that were produced in real-time.
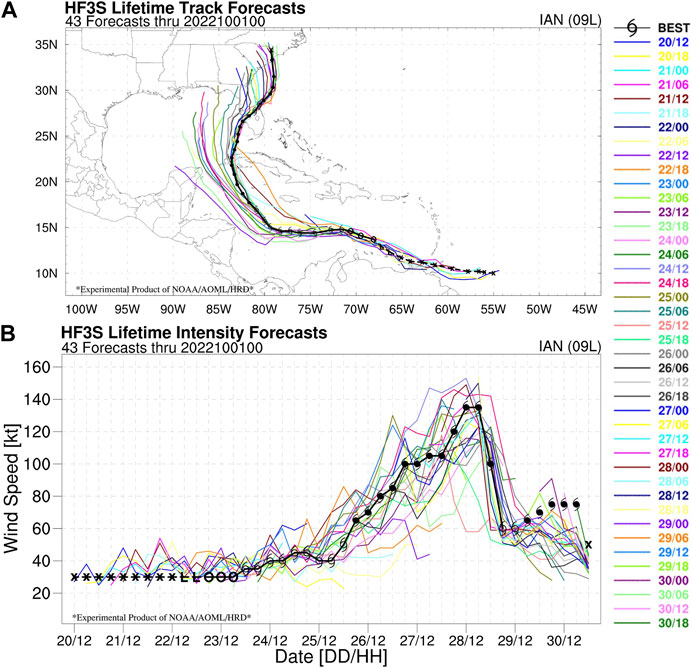
FIGURE 11. (A) All 42 HAFS-S track forecasts for Hurricane Ian, colored by initial time. The “Best Track” is in black. (B) As in (A), but for intensity forecasts.
A few details stand out in this plot. For one, forecasts early in Ian’s lifetime were biased too far left. Left-of-track bias was a common problem for GFS-based guidance that presented some challenges for operational track forecasts, especially with a track paralleling the Florida Peninsula. Forecasts starting around the morning of September 25 were able to correctly lock on to the rightward turn across Southwest Florida. In addition, some of the early forecasts showed the system weakening a little bit more than occurred in reality, due to encountering higher shear over the northern Gulf of Mexico on the track that was further left than reality. However, once the track forecast was corrected southward where the environment was more favorable, many forecasts were able to capture the intensification into a strong major hurricane, including several that explicitly captured RI.
Just as the PPC graphics for the composite verification highlight which TCs contributed positively or negatively to the overall performance of the model, we can use PPC graphics for an individual case to examine which forecasts contributed positively or negatively to the overall skill of the model for a single TC. Figure 12 shows the PPC graphics for track and intensity skill (relative to HWRF) for HAFS-S for the Ian Case. For intensity (Figure 12B), there was no clear pattern, although many forecasts at Days 4–5 had positive skill. On the other hand, track forecasts showed a clear trend. Early forecasts contributed mostly negatively to track skill, while forecasts after 0000 UTC 25 September mostly contributed positively to track skill. This shift was notable, although it is not readily apparent why it occurred. One hypothesis is that it was due to “jumps” in the TC center in the model as the TC became vertically aligned during the early stages of its lifecycle (Alvey et al., 2022). Another key factor around this time was the introduction of airborne radar data for assimilation into HAFS-S and HWRF, which has been shown to increase forecast skill (Zhang et al., 2011). However, HWRF did not show the same increase in forecast skill around this time (not shown). Another possibility is that synoptic features became better represented in later HAFS-S forecasts, as illustrated in Figure 13, which shows the potential vorticity for several different initial times to highlight differences in the trough that was steering Ian. It is apparent that the earlier forecasts (1200 UTC 24 September and 0000 UTC 25 September) had a trough extension that was too far west over the Gulf of Mexico, allowing Ian to move further west before turning. In contrast, the 1200 UTC 25 September forecast (when the skill increased markedly) had a trough that was further east over the Gulf of Mexico and much closer to the observed trough, turning the storm northeast into southwest Florida. However, it is still unclear whether these large-scale differences were driven by upstream influences from the large-scale pattern, or storm-scale differences and how they may have affected the large-scale heating and diabatic PV erosion over the Gulf of Mexico (Figure 13). A separate study is ongoing to address these questions and explore the Hurricane Ian case in more detail.
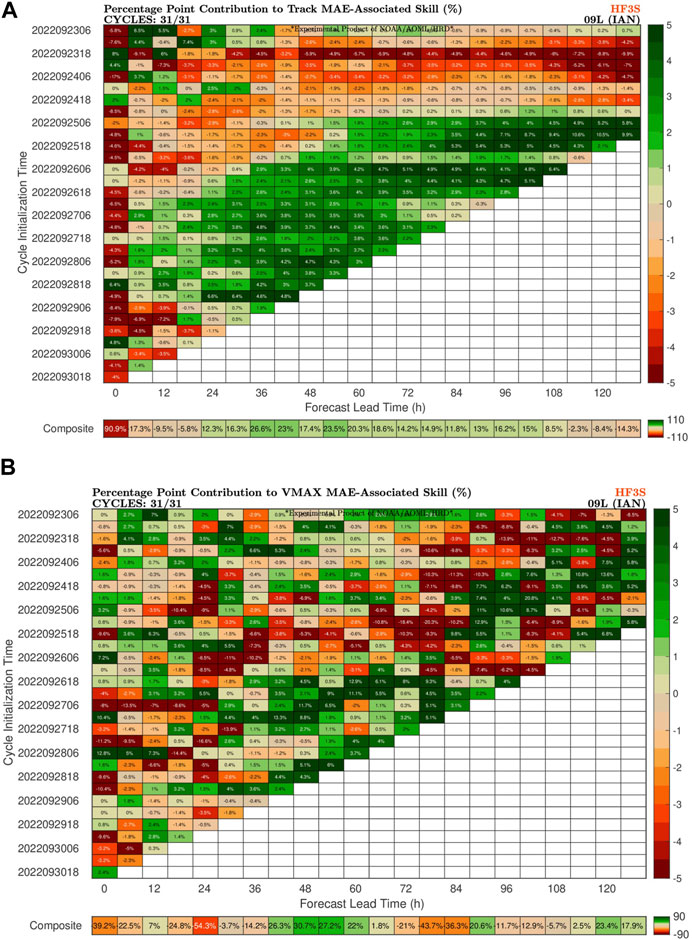
FIGURE 12. (A) Percentage-point-contribution (PPC) graphics for HAFS-S for track skill (relative to HWRF) for each cycle of Hurricane Ian. (B) As in (A), but for intensity skill.
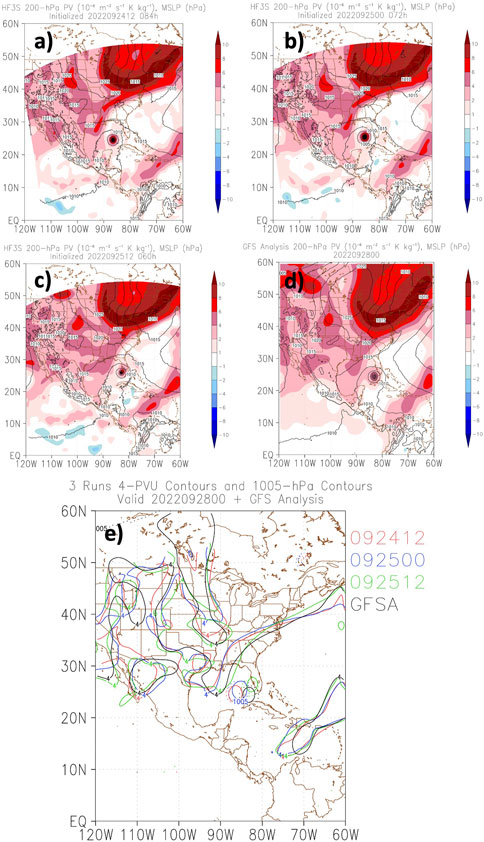
FIGURE 13. (A) Potential vorticity (shaded) and MSLP (contoured) from the HAFS-S forecast initialized at 1200 UTC 24 September 2022, valid at 0000 UTC 28 September 2022. (B) As in (A), but from the forecast initialized at 0000 UTC 25 September 2022. (C) As in (A), but from the forecast initialized at 1200 UTC 25 September 2022. (D) GFS analyzed potential vorticity (shaded) and MSLP (contoured). (E) 4-PVU contours (solid) and 1005-hPa contours (dashed) for each run and the GFS analysis, showing the locations of both the trough over the United States. (extending into the Gulf of Mexico) as well as the location of Hurricane Ian.
As shown above, many of the forecasts had positive intensity skill as Ian rapidly intensified in the Gulf of Mexico and approached the southwest coast of Florida. To examine the TC structure during this process with how it was represented in HAFS-S, we compared TDR composites from two different flights into Ian to a representative HAFS-S run (initialized on 1800 UTC 26 September). These comparisons are given in Figures 14, 15 and includes a comparison of 2-km wind and reflectivity as well as azimuthal mean tangential wind and reflectivity.
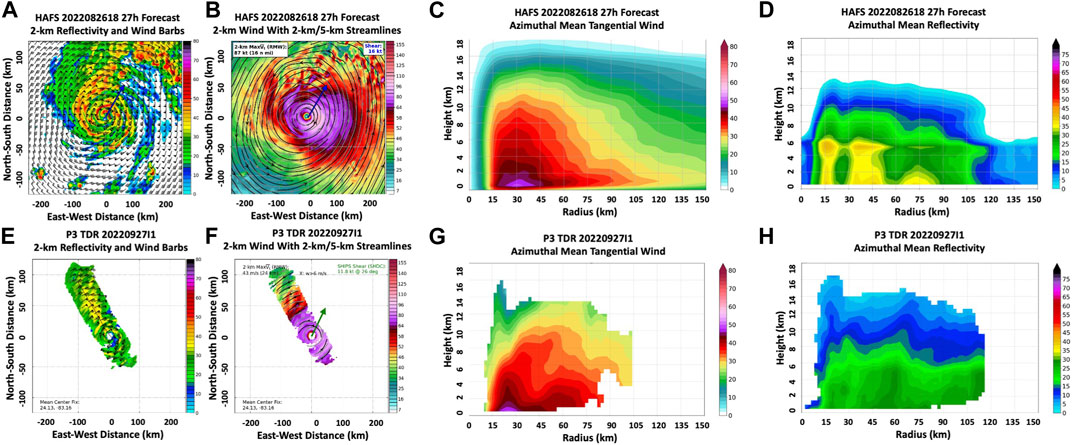
FIGURE 14. (A) 2-km reflectivity (dBZ) and wind barbs (kt, 1 kt = 0.51 ms-1) for the HAFS-S forecast initialized at 1800 UTC 26 September 2022, valid 27 h later. (B) 2-km wind speed (kt, 1 kt = 0.51 ms-1, shaded) and 2-km (black) and 5-km (gray) streamlines for the same HAFS-S forecast. In both (A) and (B) the blue arrow is the 850–200 hPa shear vector calculated in the 200–600 km annulus from the TC center. (C) Azimuthal mean tangential wind (ms-1) from the same HAFS-S forecast. (D) Azimuthal mean reflectivity (dBZ) from the same HAFS-S forecast. (E) 2-km reflectivity (dBZ) and wind barbs (kt, 1 kt = 0.51 ms-1) from the Hurricane Ian flight on the evening of 27 September 2022. (F) 2-km wind speed (kt, 1 kt = 0.51 ms-1, shaded) and 2-km (black) and 5-km (gray) streamlines from the same flight. (G) Azimuthal mean tangential wind (ms-1) from the same flight. (H) Azimuthal mean reflectivity (dBZ) from the same flight.
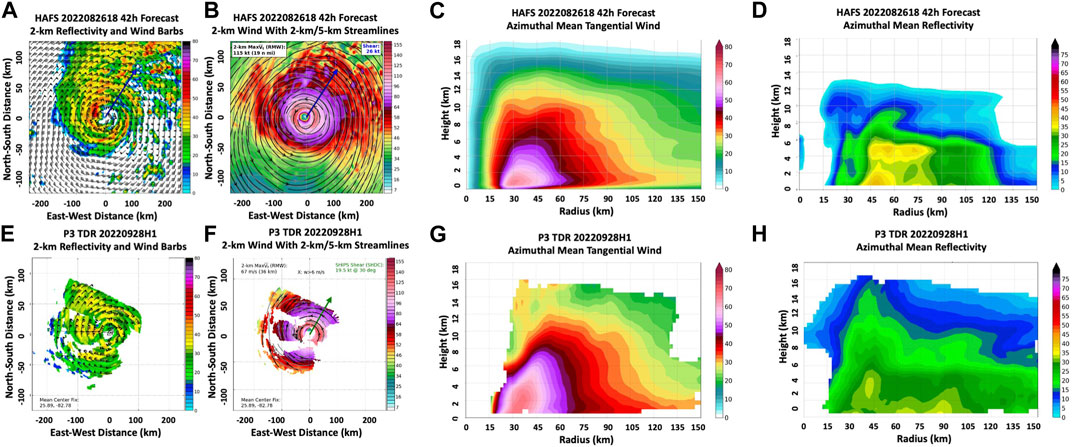
FIGURE 15. As in Figure 14 but for the HAFS-S forecast initialized at 1800 UTC 26 September 2022, valid 42 h later.
The first flight (Figure 14) was on the evening of 27 September, and took place as Ian was undergoing an eyewall replacement cycle (ERC) after moving off of Cuba. The multiple-peak structure associated with ERCs was apparent in the HAFS-S simulated reflectivity, with hints of multiple peaks in the low-level wind field as well. It should be noted that this flight only performed one pass across the TC, so data was somewhat limited.
The second flight (Figure 15) took place on the morning of 28 September as Ian was rapidly intensifying and approaching landfall in Florida. By this flight, Ian had completed the ERC and entered another period of RI. Note that the 42 h forecast from HAFS-S was successful in predicting the strong and robust inner core wind field. The RMW was also well predicted at around 30 km at low levels. It is difficult to directly, quantitatively compare the model and radar reflectivity values, due to attenuation and other possible biases in the observational data, as well as differences in how reflectivity is calculated in the model data. Nevertheless, the observations do suggest a bias in the vertical distribution of reflectivity in HAFS-S. In particular, the echo tops in HAFS-S only extended to ∼10 km altitude, compared to the ∼15 km echo tops in the radar data. This may be due to a known bias in the Thompson microphysics scheme to have too much snow in the 8–12 km layer, and not enough small ice particles (Wu et al., 2021).
4 Summary, discussion, and future work
The 2022 real-time results from HAFS-S, a candidate for operational implementation at NOAA in 2023, provided an encouraging demonstration of the progress made in HAFS development over the last several years and also helped provide a course for ongoing and future development to optimize later versions of HAFS for research and operational TC forecasting. The 2022 real-time forecasts represented the first time that the moving nest configuration of HAFS was run in real-time. This marks a notably different configuration from the large static nests used in real-time runs in 2019–2021 (e.g., Dong et al., 2020; Hazelton et al., 2021; Hazelton et al., 2022; Chen et al., 2023) and provides a demonstration of a key capability needed for successful operational forecasts within current computer resource constraints.
The track forecasts showed generally positive results in both the North Atlantic and eastern North Pacific basins, with forecasts showing skill relative to the operational HWRF (used as the “baseline” for skill) at most forecast hours in the North Atlantic and large skill (as much as 30%–40% at Days 4–5) in the eastern North Pacific. In the North Atlantic, Ian contributed notably to the track skill in the Days 2–4 window, while Celia (03E) and Darby (05E) were key positive contributors in the eastern North Pacific. Examination of Celia (not shown) illustrated that HAFS-S (and HAFS-A) had a more accurate depiction of the subtropical ridge than HWRF, leading to the better track forecast. The PPC graphics illustrated how, in some cases, a few key storms can make a big impact on the overall performance of a model in a given season, which is consistent with the finding in Chen et al. (2023). The differences in track skill between the two basins was notable, and may have been due to the fact that the Atlantic featured multiple recurving storms, while the East Pacific systems mainly moved westward. A more detailed examination of the track skill in both basins will be shown in a separate study examining the HAFS retrospective forecasts.
The intensity results were a bit mixed. At short lead times in the North Atlantic basin, HAFS-S had results that were generally comparable to that of HWRF. However, the forecasts in 2022 were less skillful at longer ranges, and reasons for this (including terrain issues, ocean coupling, and others) were examined and improved before the testing of the final pre-operational version of HAFS, in order to improve the Day 4–5 intensity forecasts for the operational version. In the eastern North Pacific, HAFS-S showed significant skill, with consistent improvement over HWRF at longer lead times (Days 4–5) and skill improvement of 30%–40%. This is likely due, at least in part, to the connection between track and intensity errors in this basin. For rapid intensification (RI) skill, HAFS-S outperformed HAFS-A in the Atlantic, and both versions of HAFS were comparable to or better than HWRF and HMON in the eastern North Pacific. PPC graphics showed that Celia (03E) was a case with a large contribution to the intensity skill in the eastern North Pacific.
The radii results were also somewhat mixed: HAFS-S had a negative (too small) bias for 34-kt winds in the Atlantic, but relatively little bias for the other wind radii metrics. In addition, HAFS-S (and HAFS-A) performed better than HWRF and HMON in wind radii prediction in the eastern North Pacific. Work is ongoing to configure the GFDL vortex tracker to accurately capture outer wind radii by removing spurious points while retaining wind from key vortex-scale structures like rain bands (Marchok, personal communication). Once this is completed, it will allow for better evaluation and optimization of wind radii forecasts (especially 34-kt radii) in HAFS. In addition, work is ongoing to better configure the TC-specific PBL physics changes (which were one of the key differences between HAFS-A and HAFS-S) for better prediction of 34-kt wind radii, as HAFS-S had a notable low bias compared to HAFS-A and HWRF.
The case study of Hurricane Ian highlighted some of the details of HAFS-S performance during the 2022 season. HAFS-S demonstrated skillful RI forecasts, correctly predicting the intensification in the southern Gulf of Mexico and, in some forecasts, even hinting at the eyewall replacement cycle that would occur prior to this RI episode. However, some of the earlier forecasts for Ian were biased too far left (a problem for all GFS-based guidance), seemingly due to an incorrect depiction of the trough moving down across the United States. Whether this difference was synoptically-driven or forced by the location of the TC earlier (in the Caribbean) is a subject of ongoing study.
The overall results from HAFS-S were promising as a baseline for one of the two versions that will operationally implemented in 2023. However, there are some ongoing avenues of research that should prove fruitful for continuing to refine and improve the model for future implementations. For example, we are conducting sensitivity tests to examine how the PBL and microphysics changes individually impact track, intensity, and structure forecast skill, which will help us understand areas where the model is more skillful relative to HWRF and areas where it needs further improvement. The data assimilation and initialization techniques are being continuously refined, and optimizing the covariances and other aspects of the DA system will be critical for improving the short-term intensity skill. In the model physics realm, work is underway to evaluate the details of the Thompson microphysics scheme, which has not been extensively used in previous TC modeling. The results from this season (and hindcasts of prior seasons) are generally encouraging, but the tendency to produce too much snowfall (noted in prior work) is something that may produce large-scale or vortex-scale biases, and this is being evaluated. As discussed above, notable work has been done to optimize the EDMF-TKE PBL scheme based on both observations and LES data (Chen et al., 2022). However, there are still gaps in our understanding of TC PBL and surface layer structure, especially in the lowest levels where observations are scarce (Chen et al., 2021). As state-of-the-art observations and LES techniques are developed, we will seek to further implement this information into the PBL and surface schemes. For ocean coupling, a fix for a possible bug in calculation of surface wind stress is being tested, which may reduce positive intensity bias in some cases. Finally, work is ongoing to develop new and cutting-edge nesting techniques for HAFS, including a Basin-Scale version of HAFS configured with high-resolution moving nests for several TCs. This approach will build upon the Basin-Scale HWRF that was run experimentally at AOML for multiple seasons and showed great promise for improving TC track and intensity predictions (Alaka et al., 2020; 2022). This will allow HAFS to have state-of-the-art capabilities for forecast multi-storm interactions and help build towards a goal of eventually including moving nests within the global forecast model. Portions of these upgrades (such as some of the ocean coupling fixes) have been included in upgrades to HAFS that occurred after the real-time experiment in time for the planned operational implementation in 2023. This final version of HAFS will be tested in full 3-year retrospective experiments for the Atlantic and East Pacific.
Data availability statement
The datasets presented in this study can be found in online repositories. The names of the repository/repositories and accession number(s) can be found below: https://storm.aoml.noaa.gov/viewer/.
Author contributions
AH: Conceptualization, Data curation, Formal Analysis, Investigation, Methodology, Visualization, Writing–original draft. GA: Conceptualization, Investigation, Methodology, Software, Visualization, Writing–review and editing. LG: Data curation, Investigation, Software, Validation, Visualization, Writing–review and editing. WR: Conceptualization, Software, Writing–review and editing. SD: Formal Analysis, Software, Validation, Visualization, Writing–review and editing. XC: Conceptualization, Methodology, Software, Writing–review and editing. BL: Conceptualization, Methodology, Project administration, Resources, Writing–review and editing. ZZ: Conceptualization, Methodology, Project administration, Resources, Writing–review and editing. LZ: Data curation, Investigation, Writing–review and editing. WW: Conceptualization, Methodology, Writing–review and editing. BT: Data curation, Investigation, Methodology, Writing–review and editing. JS: Methodology, Writing–review and editing. C-KW: Conceptualization, Data curation, Writing–review and editing. H-SK: Conceptualization, Methodology, Writing–review and editing. XZ: Conceptualization, Funding acquisition, Methodology, Project administration, Resources, Supervision, Writing–review and editing. AM: Funding acquisition, Project administration, Resources, Supervision, Writing–review and editing. FM: Funding acquisition, Project administration, Resources, Supervision, Writing–review and editing. SG: Funding acquisition, Methodology, Project administration, Resources, Supervision, Writing–review and editing.
Funding
The authors declare financial support was received for the research, authorship, and/or publication of this article. Lead author AH was supported by NOAA grants NA19OAR0220187 and NA22OAR4050668D. The GRaphics for OS(s) Es and Other modeling applications on TCs (GROOT) verification package developed by SD and funded by the Quantitative Observing System Assessment Program (QOSAP) and the FY18 Hurricane Supplemental (NOAA Award ID #NA19OAR0220188) was used to generate graphics for this publication. This research was carried out in part under the auspices of the Cooperative Institute for Marine and Atmospheric Studies, a cooperative institute of the University of Miami and the National Oceanic and Atmospheric Administration (NOAA), cooperative agreement NA20OAR4320472.
Acknowledgments
The authors thank the staff of the NOAA RDHPCS computing resources (including those who manage the Jet, Hera, Orion, and WCOSS2 supercomputers), whose technical support and guidance made the design and implementation of these real-time runs possible. The authors also thank Jun Zhang and John Kaplan who provided helpful comments that improved the manuscript.
Conflict of interest
Authors BL, BT, and JS were employed by Lynker. Authors LZ and WW were employed by SAIC. C-KW was employed by Redline Performance Solutions LLC.
The remaining authors declare that the research was conducted in the absence of any commercial or financial relationships that could be construed as a potential conflict of interest.
Publisher’s note
All claims expressed in this article are solely those of the authors and do not necessarily represent those of their affiliated organizations, or those of the publisher, the editors and the reviewers. Any product that may be evaluated in this article, or claim that may be made by its manufacturer, is not guaranteed or endorsed by the publisher.
Footnotes
1Four-letter identifiers are issued for each model in compliance with the Automated Tropical Cyclone Forecasting (ATCF) System, used by NOAA’s National Hurricane Center.
References
Alaka, G. J., Sheinin, D., Thomas, B., Gramer, L., Zhang, Z., Liu, B., et al. (2020). A hydrodynamical atmosphere/ocean coupled modeling system for multiple tropical cyclones. Atmosphere 11, 869. doi:10.3390/atmos11080869
Alaka, G. J., Zhang, X., and Gopalakrishnan, S. G. (2022). High-definition hurricanes: improving forecasts with storm-following nests. Bull. Am. Meteorol. Soc. 103, E680–E703. doi:10.1175/BAMS-D-20-0134.1
Alvey, G. R., Fischer, M., Reasor, P., Zawislak, J., and Rogers, R. (2022). Observed processes underlying the favorable vortex repositioning early in the development of hurricane dorian (2019). Mon. Weather Rev. 150, 193–213. doi:10.1175/MWR-D-21-0069.1
Bleck, R. (2002). An oceanic general circulation model framed in hybrid isopycnic-Cartesian coordinates. Ocean. Model 4, 55–88. doi:10.1016/S1463-5003(01)00012-9
Cangialosi, J. P., Blake, E., DeMaria, M., Penny, A., Latto, A., Rappaport, E., et al. (2020). Recent progress in tropical cyclone intensity forecasting at the national hurricane center. Weather Forecast 35, 1913–1922. doi:10.1175/WAF-D-20-0059.1
Cangialosi, J. P., and Landsea, C. W. (2016). An examination of model and official national hurricane center tropical cyclone size forecasts. Weather Forecast 31, 1293–1300. doi:10.1175/WAF-D-15-0158.1
Carrasco, C. A., Landsea, C. W., and Lin, Y.-L. (2014). The influence of tropical cyclone size on its intensification. Weather Forecast 29, 582–590. doi:10.1175/WAF-D-13-00092.1
Chen, X., Bryan, G. H., Hazelton, A., Marks, F. D., and Fitzpatrick, P. (2022). Evaluation and improvement of a TKE-based eddy-diffusivity mass-flux (EDMF) planetary boundary layer scheme in hurricane conditions. Weather Forecast 37, 935–951. doi:10.1175/WAF-D-21-0168.1
Chen, X., Bryan, G. H., Zhang, J. A., Cione, J. J., and Marks, F. D. (2021). A framework for simulating the tropical-cyclone boundary layer using large-eddy simulation and its use in evaluating PBL parameterizations. J. Atmos. Sci. 78, 3593–3611. doi:10.1175/jas-d-20-0227.1
Chen, X., Hazelton, A., Marks, F. D., Alaka, G. J., and Zhang, C. (2023). Performance of an improved TKE-based eddy-diffusivity mass-flux (EDMF) PBL scheme in 2021 hurricane forecasts from the Hurricane Analysis and Forecast System. Wea. Forecast. 38, 321–336. doi:10.1175/waf-d-22-0140.1
DeMaria, M., Franklin, J. L., Onderlinde, M. J., and Kaplan, J. (2021). Operational forecasting of tropical cyclone rapid intensification at the national hurricane center. Atmosphere 12, 683. doi:10.3390/atmos12060683
Ditchek, S. D., Sippel, J., Marinescu, P., and Alaka, G. (2023). Improving best-track verification of tropical cyclones: A new metric to identify forecast consistency. Weather Forecast 38 (6), 817–831. doi:10.1175/WAF-D-22-0168.1
Dong, J., Liu, B., Zhang, Z., Wang, W., Mehra, A., Hazelton, A. T., et al. (2020). The evaluation of real-time hurricane analysis and forecast system (HAFS) stand-alone regional (SAR) model performance for the 2019 atlantic hurricane season. Atmosphere 11, 617. doi:10.3390/atmos11060617
Emanuel, K., and Zhang, F. (2016). On the predictability and error sources of tropical cyclone intensity forecasts. J. Atmos. Sci. 73, 3739–3747. doi:10.1175/JAS-D-16-0100.1
Goldenberg, S. B., Gopalakrishnan, S. G., Tallapragada, V., Quirino, T., Marks, F., Trahan, S., et al. (2015). The 2012 triply nested, high-resolution operational version of the hurricane weather research and forecasting model (HWRF): track and intensity forecast verifications. Weather Forecast 30, 710–729. doi:10.1175/WAF-D-14-00098.1
Gopalakrishnan, S. G., Upadhayay, S., Jung, Y., Marks, F., and Tallapragada, V. (2021). 2020 HFIP R&D activities summary: recent results and operational implementation. Available at: https://repository.library.noaa.gov/view/noaa/31443/noaa_31443_DS1.pdf.
Han, J., and Bretherton, C. S. (2019). TKE-based moist eddy-diffusivity mass-flux (EDMF) parameterization for vertical turbulent mixing. Weather Forecast 34, 869–886. doi:10.1175/WAF-D-18-0146.1
Han, J., Wang, W., Kwon, Y. C., Hong, S.-Y., Tallapragada, V., and Yang, F. (2017). Updates in the NCEP GFS cumulus convection schemes with scale and aerosol awareness. Weather Forecast 32, 2005–2017. doi:10.1175/WAF-D-17-0046.1
Harris, L. M., and Lin, S.-J. (2013). A two-way nested global-regional dynamical core on the cubed-sphere grid. Mon. Weather Rev. 141, 283–306. doi:10.1175/MWR-D-11-00201.1
Harris, L., Zhou, L., Lin, S.-J., Chen, J.-H., Chen, X., Gao, K., et al. (2020). Gfdl SHiELD: A unified system for weather-to-seasonal prediction. J. Adv. Model. Earth Syst. 12, e2020MS002223. doi:10.1029/2020MS002223
Hazelton, A., Gao, K., Bender, M., Cowan, L., Alaka, G. J., Kaltenbaugh, A., et al. (2022). Performance of 2020 real-time atlantic hurricane forecasts from high-resolution global-nested hurricane models: HAFS-globalnest and GFDL T-SHiELD. Weather Forecast 37, 143–161. doi:10.1175/WAF-D-21-0102.1
Hazelton, A. T., Bender, M., Morin, M., Harris, L., and Lin, S.-J. (2018). 2017 Atlantic hurricane forecasts from a high-resolution version of the GFDL fvGFS model: evaluation of track, intensity, and structure. Weather Forecast 33, 1317–1337. doi:10.1175/WAF-D-18-0056.1
Hazelton, A., Zhang, Z., Liu, B., Dong, J., Alaka, G., Wang, W., et al. (2021). 2019 atlantic hurricane forecasts from the global-nested hurricane analysis and forecast system: composite statistics and key events. Weather Forecast 1, 519–538. doi:10.1175/WAF-D-20-0044.1
Irish, J. L., Resio, D. T., and Ratcliff, J. J. (2008). The influence of storm size on hurricane surge. J. Phys. Oceanogr. 38, 2003–2013. doi:10.1175/2008JPO3727.1
Kaplan, J., DeMaria, M., and Knaff, J. A. (2010). A revised tropical cyclone rapid intensification index for the atlantic and eastern North Pacific basins. Weather Forecast 25, 220–241. doi:10.1175/2009WAF2222280.1
Kaplan, J., and DeMaria, M. (2003). Large-scale characteristics of rapidly intensifying tropical cyclones in the North Atlantic basin. Weather Forecast 18, 1093–1108. doi:10.1175/1520-0434(2003)018<1093:LCORIT>2.0.CO;2
Kaplan, J., Rozoff, C. M., DeMaria, M., Sampson, C. R., Kossin, J. P., Velden, C. S., et al. (2015). Evaluating environmental impacts on tropical cyclone rapid intensification predictability utilizing statistical models. Weather Forecast 30, 1374–1396. doi:10.1175/WAF-D-15-0032.1
Kim, H. S., Lozano, C., Tallapragada, V., Iredell, D., Sheinin, D., Tolman, H. L., et al. (2014). Performance of ocean simulations in the coupled HWRF–HYCOM model. J. Atmos. Ocean. Technol. 31 (2), 545–559. doi:10.1175/jtech-d-13-00013.1
Kim, H. S., Meixner, J., Thomas, B., Reichl, G., Liu, B., Mehra, A., et al. (2022). Skill assessment of NCEP three-way coupled HWRF–HYCOM–WW3 modeling system: hurricane laura case study. Weather Forecast. 37 (8), 1309–1331. doi:10.1175/waf-d-21-0191.1
Landsea, C. W., and Cangialosi, J. P. (2018). Have we reached the limits of predictability for tropical cyclone track forecasting? Bull. Am. Meteorol. Soc. 99, 2237–2243. doi:10.1175/BAMS-D-17-0136.1
Lin, S.-J. (2004). A “vertically Lagrangian” finite-volume dynamical core for global models. Mon. Weather Rev. 132, 2293–2307. doi:10.1175/1520-0493(2004)132<2293:AVLFDC>2.0.CO;2
Lin, S.-J., and Rood, R. B. (1996). Multidimensional flux-form semi-Lagrangian transport schemes. Mon. Weather Rev. 124, 2046–2070. doi:10.1175/1520-0493(1996)124<2046:MFFSLT>2.0.CO;2
Marchok, T. (2021). Important factors in the tracking of tropical cyclones in operational models. J. Appl. Meteorol. Climatol. 60, 1265–1284. doi:10.1175/JAMC-D-20-0175.1
Ramstrom, W., Ahern, K., Zhang, X., and Gopalakrishnan, S. (2023). Implementation of storm-following moving nest for the hurricane analysis and forecast system. Front. Earth Sci. 2023. in review.
Reynolds, R. W., Smith, T. M., Liu, C., Chelton, D. B., Casey, K. S., and Schlax, M. G. (2007). Daily high-resolution-blended analyses for Sea surface temperature. J. Clim. 20, 5473–5496. doi:10.1175/2007JCLI1824.1
Roebber, P. J. (2009). Visualizing multiple measures of forecast quality. Weather Forecast 24, 601–608. doi:10.1175/2008WAF2222159.1
Thompson, G., Rasmussen, R. M., and Manning, K. (2004). Explicit forecasts of winter precipitation using an improved bulk microphysics scheme. Part I: description and sensitivity analysis. Mon. Weather Rev. 132, 519–542. doi:10.1175/1520-0493(2004)132<0519:EFOWPU>2.0.CO;2
Trabing, B. C., and Bell, M. M. (2020). Understanding error distributions of hurricane intensity forecasts during rapid intensity changes. Weather Forecast 35, 2219–2234. doi:10.1175/WAF-D-19-0253.1
Wu, D., Zhang, F., Chen, X., Ryzhkov, A., Zhao, K., Kumjian, M. R., et al. (2021). Evaluation of microphysics schemes in tropical cyclones using polarimetric radar observations: convective precipitation in an outer rainband. Mon. Weather Rev. 149, 1055–1068. doi:10.1175/MWR-D-19-0378.1
Zhang, F., Weng, Y., Gamache, J. F., and Marks, F. D. (2011). Performance of convection-permitting hurricane initialization and prediction during 2008–2010 with ensemble data assimilation of inner-core airborne Doppler radar observations. Geophys. Res. Lett. 38. doi:10.1029/2011GL048469
Keywords: HAFS, tropical cyclones, numerical modeling, verification, real-time prediction
Citation: Hazelton A, Alaka GJ Jr., Gramer L, Ramstrom W, Ditchek S, Chen X, Liu B, Zhang Z, Zhu L, Wang W, Thomas B, Shin J, Wang C-K, Kim H-S, Zhang X, Mehra A, Marks F and Gopalakrishnan S (2023) 2022 real-time Hurricane forecasts from an experimental version of the Hurricane analysis and forecast system (HAFSV0.3S). Front. Earth Sci. 11:1264969. doi: 10.3389/feart.2023.1264969
Received: 21 July 2023; Accepted: 18 September 2023;
Published: 04 October 2023.
Edited by:
Jing-Jia Luo, Nanjing University of Information Science and Technology, ChinaReviewed by:
Dong-Hyun Cha, Ulsan National Institute of Science and Technology, Republic of KoreaYubin Li, Nanjing University of Information Science and Technology, China
Wei-Bo Chen, National Science and Technology Center for Disaster Reduction(NCDR), Taiwan
Copyright © 2023 Hazelton, Alaka, Gramer, Ramstrom, Ditchek, Chen, Liu, Zhang, Zhu, Wang, Thomas, Shin, Wang, Kim, Zhang, Mehra, Marks and Gopalakrishnan. This is an open-access article distributed under the terms of the Creative Commons Attribution License (CC BY). The use, distribution or reproduction in other forums is permitted, provided the original author(s) and the copyright owner(s) are credited and that the original publication in this journal is cited, in accordance with accepted academic practice. No use, distribution or reproduction is permitted which does not comply with these terms.
*Correspondence: Andrew Hazelton, YW5kcmV3LmhhemVsdG9uQG5vYWEuZ292