
95% of researchers rate our articles as excellent or good
Learn more about the work of our research integrity team to safeguard the quality of each article we publish.
Find out more
ORIGINAL RESEARCH article
Front. Earth Sci. , 02 November 2023
Sec. Volcanology
Volume 11 - 2023 | https://doi.org/10.3389/feart.2023.1264701
This article is part of the Research Topic Applications of Machine Learning in Volcanology View all 9 articles
 Rina Noguchi1*
 Daigo Shoji2
As volcanic stratigraphy provides important information about volcanic activities, such as the eruption style, duration, magnitude, and their time sequences, its observation and description are fundamental tasks for volcanologists. Since outcrops are often obscured in nature, the first task would be identifying stratigraphic exposures in many cases. This identification/selection process has depended on humans and has difficulties in terms of time and effort consumption and in biases resulting from expertise levels. To address this issue, we present an approach that utilizes supervised machine learning with fine-tuning and forms the backbone to automatically extract the areas of stratigraphic exposures in visible images of volcanic outcrops. This study aimed to develop an automated method for identifying exposed stratigraphy. This method will aid in planning subsequent field investigations and quickly outputting results. We used U-Net and LinkNet, convolutional neural network architectures developed for image segmentation. Our dataset comprised 75 terrestrial outcrop images and their corresponding images with manually masked stratigraphic exposure areas. Aiming to recognize stratigraphic exposures in various situations, the original images include unnecessary objects such as sky and vegetation. Then, we compared 27 models with varying network architectures, hyperparameters, and training techniques. The highest validation accuracy was obtained by the model trained using the U-Net, fine-tuning, and ResNet50 backbone. Some of our trained U-Net and LinkNet models successfully excluded the sky and had difficulties in excluding vegetation, artifacts, and talus. Further surveys of reasonable training settings and network structures for obtaining higher prediction fidelities in lower time and effort costs are necessary. In this study, we demonstrated the usability of image segmentation algorithms in the observation and description of geological outcrops, which are often challenging for non-experts. Such approaches can contribute to passing accumulated knowledge on to future generations. The autonomous detection of stratigraphic exposures could enhance the output from the vast collection of remote sensing images obtained not only on Earth but also on other planetary bodies, such as Mars.
Volcanic stratigraphy provides important information about volcanic activities. For example, from the thickness of the tephra, we can obtain information about the duration and magnitude of the eruption. Its spatial distribution/variation has been used to estimate the wind direction at the time of eruption and the erupted volume, and to evaluate the eruption magnitude (e.g., Bonadonna et al., 2016 and references therein). The analyses of the grain size contributed to evaluating explosivity during an eruption (e.g., Kueppers et al., 2006a). Applying fractal theory, we can quantify and compare explosivity among several eruptions (e.g., Kueppers et al., 2006b; Perugini et al., 2011). The grain shape and texture analyses of tephra contributed to inferring with the eruption style such as external water participation (e.g., Wohletz and Heiken, 1992; Miwa et al., 2015; Dürig et al., 2021). Statistical analysis and machine learning techniques provide new insights into the characterizations and classifications of the eruption (Leibrandt and Le Pennec, 2015; Liu et al., 2015; Shoji et al., 2018). Thus, the observation and description of volcanic stratigraphy are fundamental tasks for volcanologists to obtain details and histories of eruptions. Such approaches are common to other geological surveys on different targets, fields, and other solid bodies.
Depending on each research subject, the essential requirement in selecting which areas/parts of the outcrop are worth examining and describing is the clear appearance of the layering structure. Since talus and vegetation often obscure outcrops in nature, identifying the areas/parts of stratigraphic exposures is the first task in the field survey. Modifications of outcrops to expose clear stratigraphy are performed occasionally, although those contributions are limited and prohibited in protected areas. Therefore, we often must find naturally clear stratigraphic exposures on outcrops without any modifications. The identification process of stratigraphic exposures has traditionally been dependent on visual observation by humans. Human observation contains difficulties in terms of time and effort consumption, as well as biases resulting from the expertise levels of each person. In the field, time is often limited due to weather, imminent danger, and accessibility. Huge outcrops and large research areas make this problem more serious.
As a solution, recently the unmanned aerial vehicle (UAV) has been actively used for geological surveys. The programmed flights of UAVs can search vast and challenging areas compared with humans’ survey (Smith and Maxwell, 2021). Combining the technologies of image analysis, UAVs also show potential to select appropriate locations automatically. On the other hand, UAVs have several difficulties compared with humans. One of these difficulties is to identify stratigraphic exposures. The identification and discrimination of stratigraphic exposures can be challenging for non-experts. Automating the identification of stratigraphic exposures on outcrops significantly contributes to solving issues related to time, effort, and expertise levels.
Difficulties setting the threshold for unparameterizable issues in landforms have been solved by applying machine learning techniques and could also be applied for scouting exposed stratigraphies. One of the typical target landforms for the application of machine learning is impact craters on terrestrial bodies. Using the Mars Orbiter Laser Altimeter digital elevation model, Stepinski et al. (2009) presented the automated cataloging of impact craters and found a regional decrease in the crater depth/diameter ratio, which may relate to subsurface ice. For finding new impact craters which previously depended on manual detection strongly biased by thermal inertia, Wagstaff et al. (2022) trained and evaluated the classifier with visible images obtained using the Context Camera onboard the Mars Reconnaissance Orbiter. Another application example is the detection of volcanic rootless cones (Palafox et al., 2017). Compared with support vector machine approaches, Shozaki et al. (2022) demonstrated the recognition and classification of Martian chaotic terrains using convolutional neural network models. Their models showed over 90% accuracy for the classification and contributed to revealing the global distribution of chaos features on Mars. Thus, automation using machine learning techniques can contribute to identification and discrimination of landforms, which depends on geological expertise so far and could be suitable for finding stratigraphic exposures.
In this study, we present an approach that utilizes supervised machine learning to automatically extract areas of stratigraphic exposures in any type (e.g., ground view, from UAVs) of visible images of volcanic outcrops. Semantic segmentation, a deep learning algorithm, used for the extraction of obstacles and anomalies is adapted for the extraction of stratigraphic exposures among outcrop images in a short time. For example, Silburt et al., 2019 built a convolutional neural network (CNN) architecture to extract lunar impact craters from the Moon digital elevation model. Their trained CNN showed a high precision for crater detection as human-generated. Inspired by Silburt et al., 2019, Latorre et al., 2023 implemented several transfer learning approaches including fine-tuning and presented its capability for the autonomous detection of impact craters across the Moon and Ceres, which have different geological features. Thus, semantic segmentation shows potential to extract specific geological features autonomously. Furthermore, implementing transfer learning approaches for CNN contributes to wider use across target bodies. Here, we demonstrate semantic segmentation for the autonomous extraction of stratigraphic exposures from outcrop images, implementing fine-tuning and pre-trained weights. The main purpose of this study is to provide an automatic identification method of exposed stratigraphy which will be helpful in the planning/preparation of subsequent investigations and in the prompt outputting of investigated results.
In this work, we demonstrated the automated identification of stratigraphic exposure on outcrop images using a machine learning algorithm. The procedure of this study involves the 1) preparation of original images, 2) generation of masked images, 3) augmentation of original and masked images, and 4) training and evaluation of the U-Net and LinkNet networks to detect stratigraphic exposures (Figure 1).
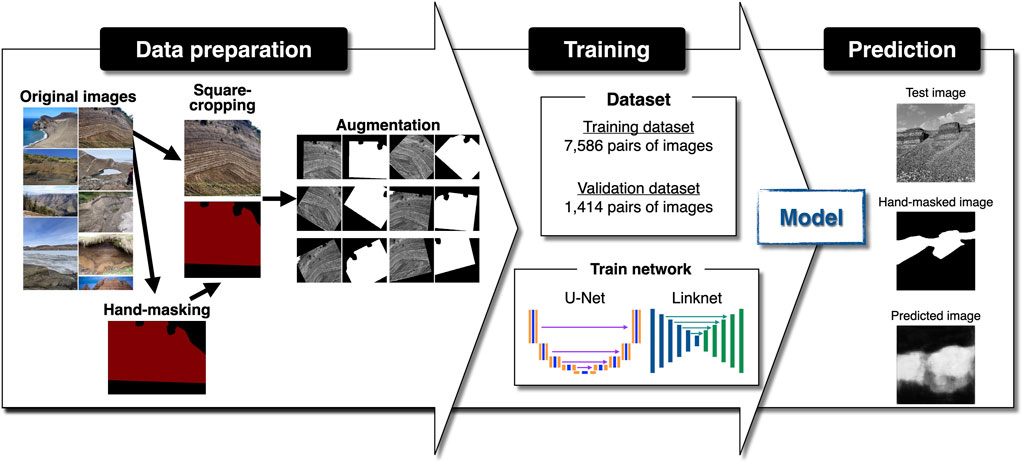
FIGURE 1. Procedure of dataset preparation, training, and evaluation in this study.
We prepared outcrop images that contained stratigraphic exposures, sky, vegetation, artifacts, and talus to train the network (Figure 1). The total number of prepared images (hereafter, original images) is 75, of which 30 images were our holdings and 45 images were obtained using google-image-download, a Python script published on GitHub (https://github.com/Joeclinton1/google-images-download/tree/patch-1, Copyright © 2015–2019 Hardik Vasa). This script was developed for searching Google Images on keywords/key phrases and downloading images to locals. Using this script, we obtained outcrop images with “geologic layer,” “tephra layer,” “volcanic tephra layer,” and “volcano geologic layer” as keywords/key phrases. Therefore, our dataset includes both volcanic and non-volcanic stratigraphies. This is acceptable because we focus on the extraction of stratigraphic structures itself in this study. The whole images we obtained by google-image-download were labeled as non-commercial reuse with modification. The original images were taken from various distances (meters to kilometers), which correspond to a scale ranging from in situ observations to aerial surveys. Aiming to recognize stratigraphic exposures in various situations, the original images include talus, gullies, vegetation, snowy regions, artifacts, and other unnecessary objects (Figure 1). A total of 60, 10, and 5 of those images were used as training, validation, and testing images, respectively (i.e., 80%, 13.3%, and 6.6% splitting). The original images are available in a public repository at https://doi.org/10.5281/zenodo.8396332.
The masking of stratigraphic exposure areas was carefully performed manually, and unnecessary objects were excluded (Figure 1). Images that are masked at the stratigraphic exposure’s region for each original image were generated using labelme (https://github.com/wkentaro/labelme, Copyright © 2016–2018 Kentaro Wada), a tool that allows graphical annotation on images. We annotated the region of stratigraphic exposures as polygons and then saved it as a binarized image (hereafter, hand-masked images). Those hand-masked images are available in a public repository at https://doi.org/10.5281/zenodo.8396332.
To increase the generalization ability of the network, we augmented the original and the hand-masked training/validation images by rotation, horizontal and vertical shifts, and horizontal flip, and converted them into 256 x 256 grayscale images (Figure 1). Data augmentation is a common technique in the training of neural networks to overcome the small amount of data. Before augmentation, we cropped each image as a square because the original images were not square and its aspect ratio will be modified by resizing in augmentation. To augment both original and hand-masked images, Keras ImageDataGenerator (Chollet, 2015) was used. The rotation range was 45°. The maximum width and height shifts were 20% against the width and height. In the ImageDataGenerator, we did not use zoom and shear functions during augmentation because the unfixable aspect ratio could generate pseudo-layering structures in zoom and shear. The fill mode was “constant” because the default “nearest” generates pseudo-layering structures. The angle and width of the rotation and shift were randomly determined within the range, and horizontal flipping occurred randomly. The size of augmented images was adjusted to 256 x 256 pixels to input the following algorithm. Due to the limitation to our computing system, we augmented images to be less than 10,000 in total. As a result, we obtained 7,586 and 1,414 pairs of augmented original/hand-masked images for training and validation datasets, respectively.
To extract certain areas from images by our system, we applied image segmentation algorithms. In this study, we compared two architectures: U-Net (Ronneberger et al., 2015) and LinkNet (Chaurasia and Culurciello, 2017). U-Net is a fully convolutional network originally developed for biomedical image segmentation. It is designed to work with a small number of training images and produce precise segmentation results. This network classifies each pixel and then outputs segmentation maps, and has been applied to segmentation in terrestrial and planetary remote sensing images (e.g., Silburt et al., 2019; Wieland et al., 2019; Zhu et al., 2021; Latorre et al., 2023). LinkNet is a fully convolutional neural network for fast image semantic segmentation and has been developed to recover the spatial information on images more efficiently through the decoder which was diminished during the encoding procedure [employs ResNet18 (He et al., 2016) as a backbone in the original].
Training, validation, and testing were performed using the Keras package (https://keras.io), which is free and written in Python (Chollet, 2015). We used the original U-Net architecture (Ronneberger et al., 2015) as “simple U-Net” using the unet script (https://github.com/zhixuhao/unet, Copyright © 2019 xhizuhao), which does not implement fine-tuning. The segmentation model package (Iakubovskii, 2019), a Python library with neural networks for image segmentation based on Keras and TensorFlow (Abadi et al., 2016), was used for U-Net and LinkNet model buildings with backbones and with/without encoder weights. The path of U-Net comprises unpadded 2 x 2 convolutions [followed by rectified linear units (ReLUs)], 2 x 2 max pooling operations with stride 2 for downsampling, and 2 x 2 upconvolutions. The lowest resolution of images in training in our network is 16 x 16 pixels. The total number of convolutional layers in this network is 23. The LinkNet used comprises three decoder blocks that use the UpSampling Keras layer. Supplementary Figure S1,S2 shows the model architectures trained in this study. The training was executed in Mac Studio, Apple M1 Max, 64 GB memory. In Keras, an epoch is an arbitrary cutoff, generally defined as “one pass over the entire dataset,” used to separate training into distinct phases, which is useful for logging and periodic evaluation, and “steps per epoch” is a total number of steps (batches of samples) before declaring one epoch finished and starting the next epoch (Chollet, 2015). In our training, the “steps per epoch” ranged from 50 to 150. Epochs for training were fixed to 300, considering an accuracy/time-cost trade. To avoid overfit and further efficient training, we adopt an early stopping callback, which stops training when a monitoring metric has stopped improving (Chollet, 2015). In this study, the monitored metric was validation loss during training. Training was stopped when it had not been improved within the last 20 epochs and the weight from the best epoch was restored. We used the Adam optimization algorithm (Kingma and Ba, 2014) for the training of our network with the learning rate of 1e–6.
We evaluated two training techniques: fine-tuning and the use of a backbone network in the encoder (Table 1). Fine-tuning is an approach that trains with a pre-trained model’s weights on new data (Hinton and Salakhutdinov, 2006). The backbone is the recognized architecture or network used for feature extraction (Elharrouss et al., 2022). Both techniques have been used to obtain higher classification accuracy. In this study, we verified two backbones: ResNet18 and ResNet50 (He et al., 2016). As a result, we compared 27 models with varying training steps, model architectures, and training techniques (Table 1).
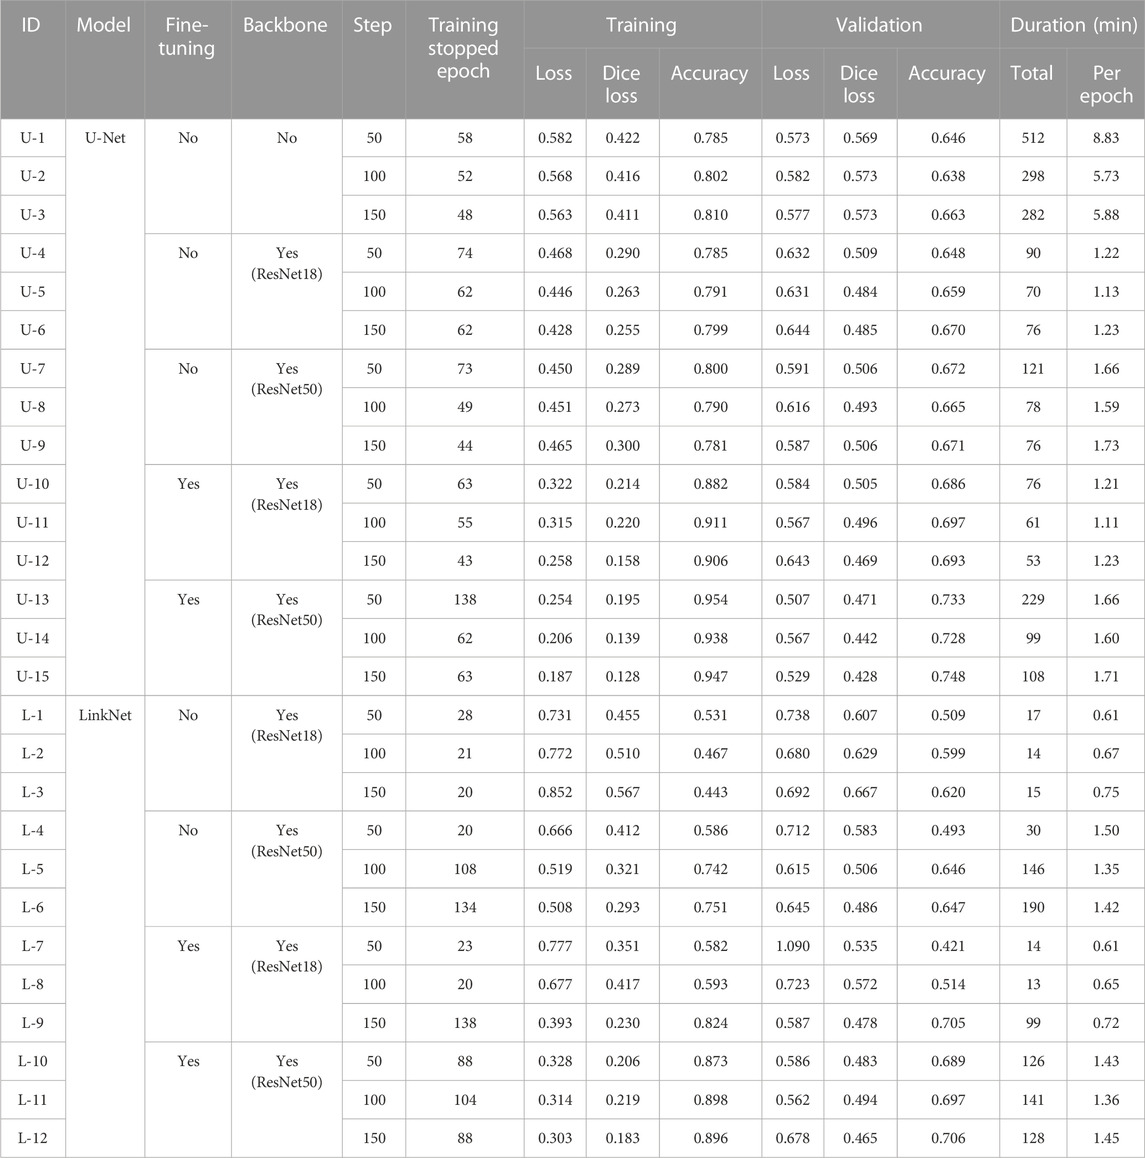
TABLE 1. Loss, dice, and binary accuracy at the end of training in each model.
The performance of the trained network was evaluated by the loss function and two metric functions: the dice loss (Milletari et al., 2016) and binary accuracy. The loss function is a function that calculates gaps between facts and predictions. In this study, we use binary cross entropy in the Keras library for the loss function. This loss function was used in training. The dice loss is a common metric that optimizes networks based on the dice overlap coefficient between the predicted segmentation result (i.e., predicted regions) and the ground truth annotation (i.e., hand-masked), which can solve the data imbalance problem (Milletari et al., 2016). The binary accuracy is the fraction of correctly classified pixels in the image.
The quantitative and qualitative evaluation of our models was performed using the validation data and five test images. The validation data were used to evaluate the network after each epoch of the training. Test images were our holdings which were not included in the image dataset used for training (i.e., not used for training and validation datasets). The evaluation of test image predictions was made from the four points of view: exclusions of sky, vegetation, artifacts, and talus.
The loss function, dice loss, and accuracy of the epoch in our training are shown in Figures 2–7. The steps, the training stopped epoch, losses, dice losses, and accuracies of training and validation at the end of the training, as well as the duration, are shown in Table 1. We trained networks several times and confirmed that the corresponding changes in binary accuracy were negligible. In all training processes, the early stopping function interrupted the training before the 300th epoch due to a lack of improvement for the validation loss within the last 20 epochs. Training of some LinkNet models (IDs: L-1, L-2, L-3, L-4, L-7, and L-8) failed to minimize the validation loss and stopped before the 30th epoch. These indicate training failures. The largest epoch was 138 in the 50-step U-Net training with fine-tuning and a ResNet50 backbone (ID: U-13) and in the 150-step LinkNet training with fine-tuning and a ResNet18 backbone (ID: L-9).
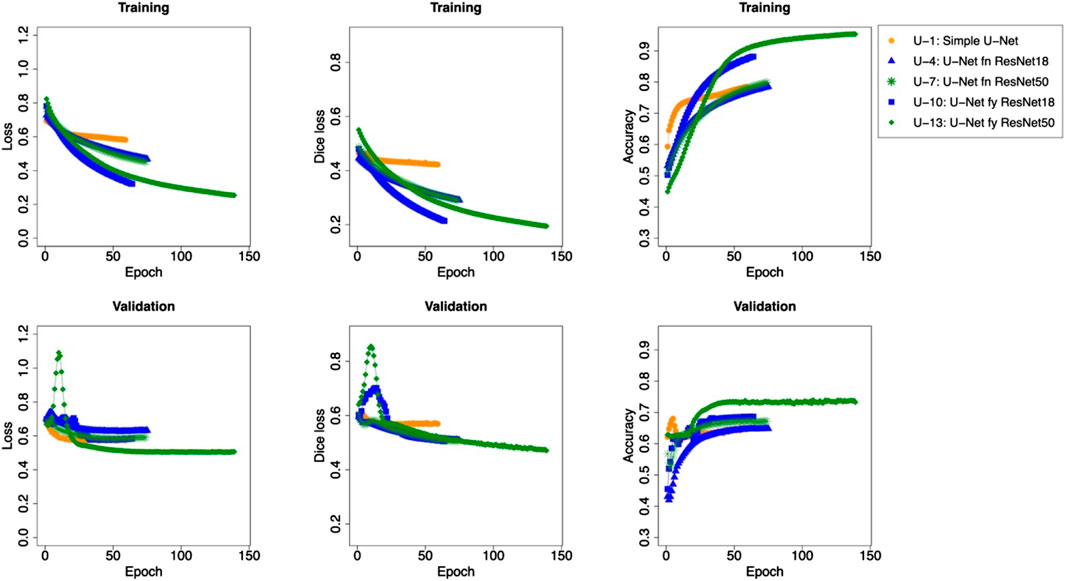
FIGURE 2. Loss, dice loss, and accuracy plots and curves during training for U-Net models with a setting of 50 steps per epoch.
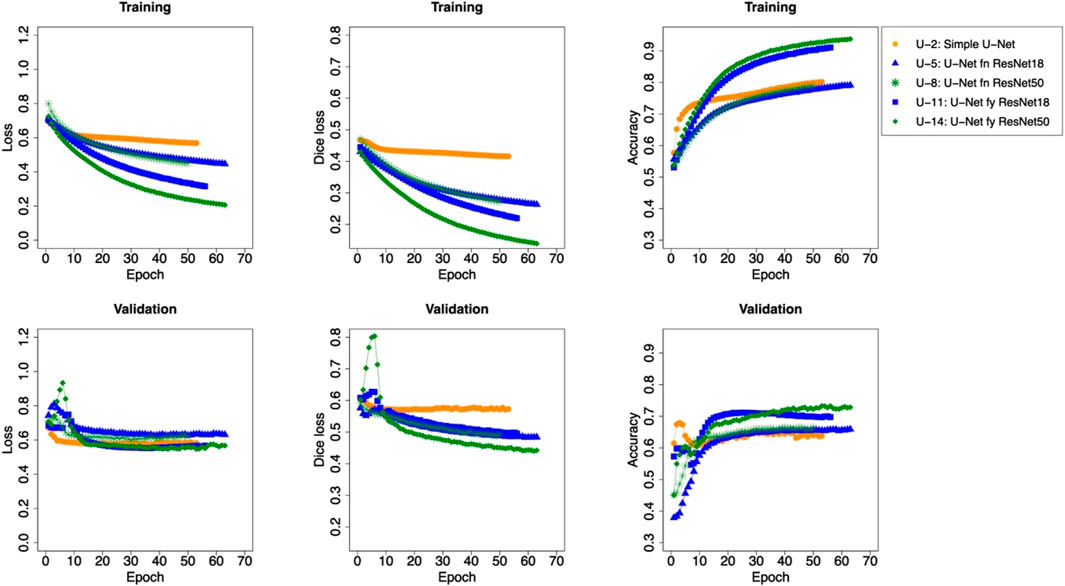
FIGURE 3. Loss, dice loss, and accuracy plots and curves during training for U-Net models with a setting of 100 steps per epoch.
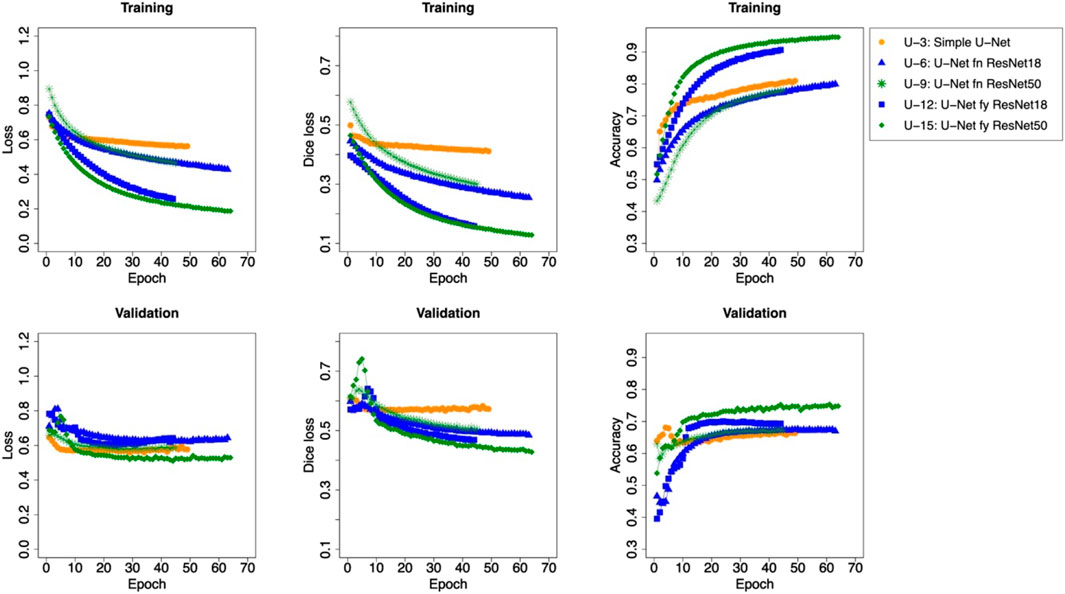
FIGURE 4. Loss, dice loss, and accuracy plots and curves during training for U-Net models with a setting of 150 steps per epoch.
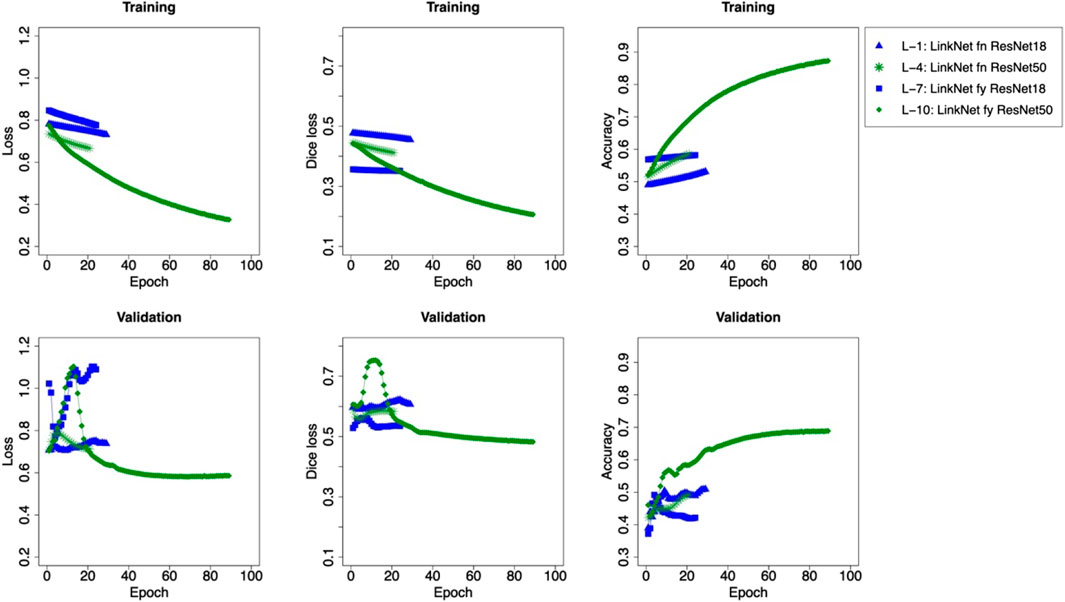
FIGURE 5. Loss, dice loss, and accuracy plots and curves during training for LinkNet models with a setting of 50 steps per epoch.
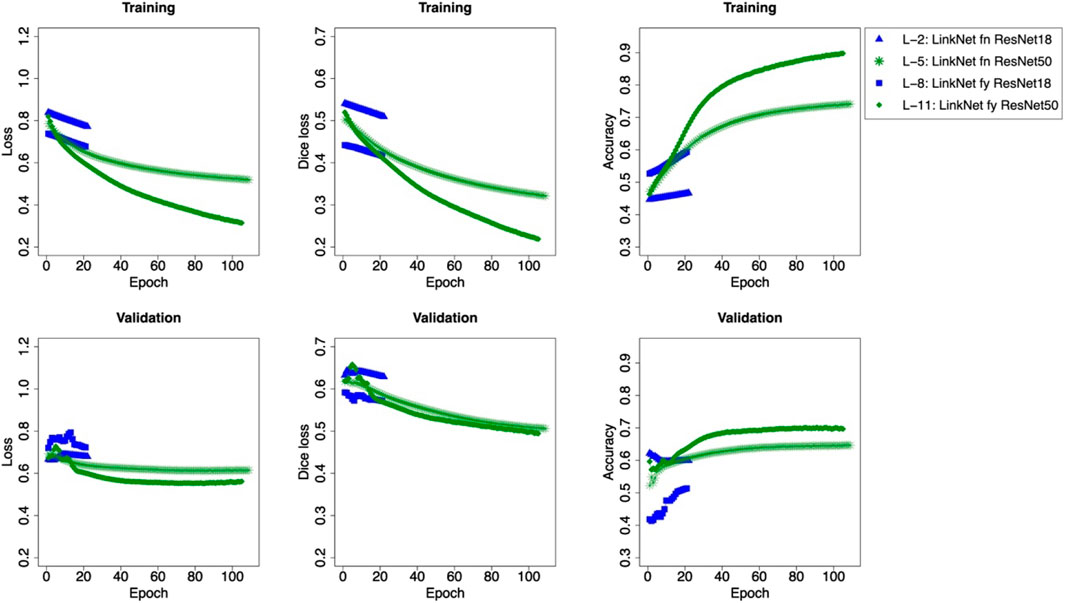
FIGURE 6. Loss, dice loss, and accuracy plots and curves during training for LinkNet models with a setting of 100 steps per epoch.
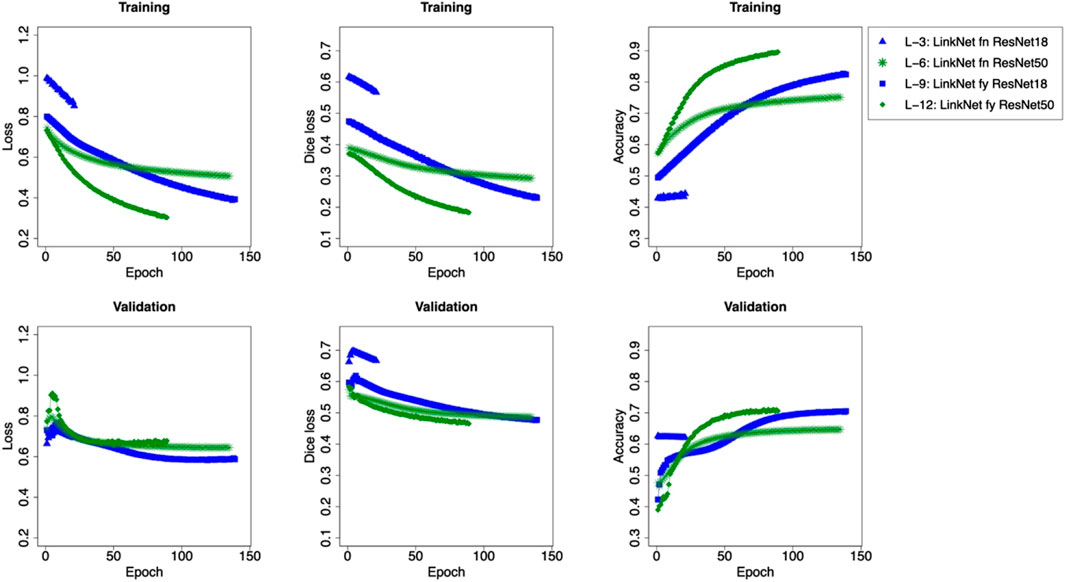
FIGURE 7. Loss, dice loss, and accuracy plots and curves during training for LinkNet models with a setting of 150 steps per epoch.
In our computer system, the duration per epoch in the case of the simple U-Net training took ∼6 times longer than that of U-Net and LinkNet training with fine-tuning and/or backbones (8.83 min per epoch, Table 1).
The three best validation accuracies were obtained in U-Net training with fine-tuning and a ResNet50 backbone (0.748, 0.733, and 0.728 for model ID U-15, U-13, and U-14, respectively, Table 1). Training failed models (IDs: L-1, L-2, L-3, L-4, L-7, and L-8) showed low validation accuracies (<0.62). For the successfully trained models, the validation accuracy has a 10%–20% gap to the training validation. In many cases, the models with higher “steps per epoch” show higher validation accuracies. Models ResNet50 backbone implemented have higher validation accuracies relative to those ResNet18 backbone implemented. Fine-tuned models show higher validation accuracies than those of non-fine-tuned models.
We verified the fidelity of prediction (masking regions of stratigraphic exposures) using test images that were not used in both training and validation (Figures 8, 9). Training-failed models (IDs: L-1, L-2, L-3, L-4, L-7, and L-8) showed poor predictions. The models U-Net trained show higher fidelities of prediction, especially the exclusion of the sky than those that are LinkNet-trained. This fidelity is higher in models trained with higher steps. For vegetation, artifacts, and talus, those exclusions by our model were incomplete; predicted regions as stratigraphic exposures include them. For vegetation, incomplete extraction often occurred in denser regions. It is common to both U-Net- and LinkNet-trained models than models trained with fine-tuning, and a ResNet50 backbone showed better fidelities of the prediction.
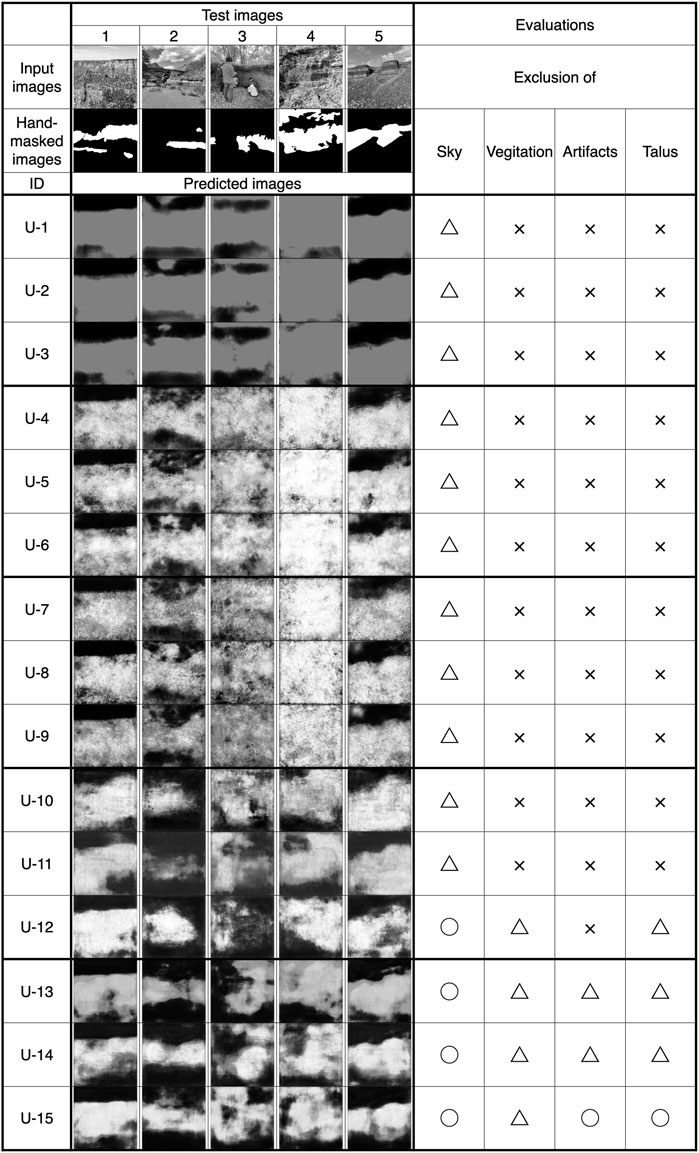
FIGURE 8. Predicted results for test images using U-Net trained models.
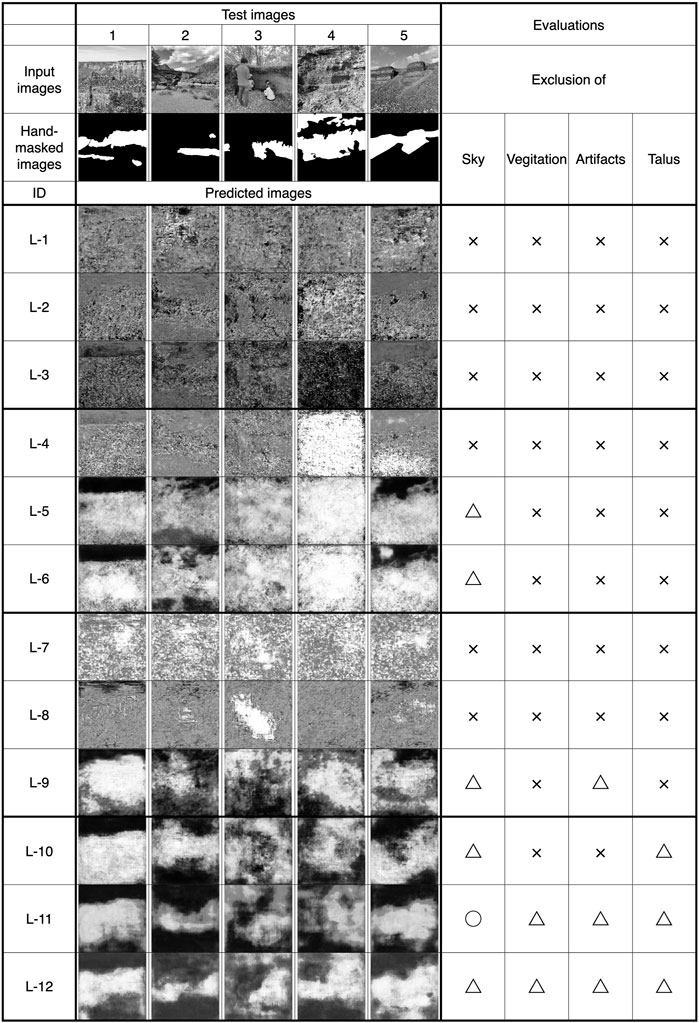
FIGURE 9. Predicted results for test images using LinkNet trained models.
Since our trained network extracts stratigraphic exposures incompletely, the training procedure should be reconsidered. Considering the stability of validation accuracy and the fidelity of predicted images, approximately 100-step training is appropriate for the dataset and the training networks used in this study. The higher fidelities of exclusions of the sky relative to vegetation, artifacts, and talus are probably due to their significantly different textures. Our success implies that color is not necessary for those exclusions because the training dataset was prepared as grayscale images. However, to increase the exclusion fidelity of vegetation, artifacts, and talus, the training procedure should be reconsidered and improved.
The distinguishing of vegetation from stratigraphic exposures is not a difficult task for humans. In general, humans identify vegetation as the accumulation of elongated/oval greenish/brownish objects like leaves, stems, branches, trunks, and roots. Our training dataset was prepared as grayscale images, and the network should learn the exclusion of vegetation by the difference of texture, not by the color difference. The 256 x 256 pixels of augmented images were considered to have a poor resolution for this texture-only-guided distinguishment, although satisfying in the exclusion of the sky. Training with higher resolution and color images will contribute to identifying vegetation that has several types of texture and color (Sodjinou et al., 2022), although time and computing costs are concerned. Since denser vegetation has higher exclusion difficulty (Figures 8, 9), another idea to increase the prediction fidelity is to include images with dense vegetation in the training.
The distinguishing of talus regions with stratigraphic exposures is often difficult for non-experts. This is because its constituent materials are supplied from upper stratigraphies and are indistinguishable from stratigraphic exposure at the same height/elevation occasionally. It means color/texture analyses will have less contribution to those discriminations, and our strategies for talus exclusion using U-Net and LinkNet architectures, identifying materials as a region, could be reasonable. To increase the talus exclusion fidelity, training with higher-resolution augmented images in which stratigraphic layering can be identified could help contribute toward fidelity.
A stricter masking of stratigraphic exposures will contribute to increasing prediction fidelity, although its time and effort consumptions also increase. Further investigation and verification of reasonable training settings and network structures for obtaining higher prediction fidelities in lower time and effort costs are required.
After the suggestion of stratigraphic exposure regions, the further contribution of computing will be the identification/discrimination of each layer. The interface of each layer is a drastic change in constituent materials. Those changes appear as differences in texture and color in visible images. Since color contains unexpected changes such as wetness and shadow, layer discrimination should also use texture information. Evidently, deep convolutional neural networks are one of the most powerful solutions, as displayed in control and trajectory planning for automated vehicles (e.g., Notle et al., 2018; Dewangan and Sahu, 2021). As a non-deep learning approach, the gray-level co-occurrence matrix (Haralick et al., 1973) and other methods/combinations (e.g., Armi and Fekri-Ershad, 2019) will contribute to texture-based layer discrimination. Using layer-discriminated (i.e., boundary-drawn) images, we can calculate the thickness of each layer, although the actual scale input (and strictly, strike and dip) is necessary. Furthermore, this kind of texture analysis will provide brief information for constituent material (e.g., lava or pyroclast, lapilli, or ash).
The autonomous measurement of each layer thickness greatly contributes toward decreasing time and effort costs. Although strike and dip should be considered especially on deformed outcrops, the shortest distance between two layer boundaries on scaled front-side images corresponds to layer thickness. The autonomous calculation of those distances can be used for the automatic drawing of stratigraphic columns generally produced in geological surveys. Since the measurement of each layer by hand takes time and has difficulty in unreachable heights, automation helps the researcher in both saving time and effort.
The automatic identification of stratigraphic exposures would have proven its worth in satellite and aerial images since they often comprise huge datasets. Combination with geological information system tools will contribute to suggesting the locations of outcrops with coordinate values. However, the network of stratigraphic exposure identification should be trained with images that have the same scaling (resolution) as that of target datasets. In this study, our network was trained by outcrop images taken from the ground view; its use may not work for satellite images and aerial photographs. For the use of satellite/aerial images, the training dataset should also have consisted of those images.
The difficulty of the autonomous identification of stratigraphic exposure on extraterrestrial outcrops will be lower than that on terrestrial outcrops because of the lack of vegetation on those bodies. Similar to the terrestrial case, tuned training using images taken on each target body is necessary. Since the data volume obtained on extraterrestrials reaches challenging amounts for remote sensing analysis as mentioned for Mars by Palafox et al. (2017), our improved scheme will be a powerful tool for geological surveys on other bodies.
The automatic extraction of stratigraphic exposure in visible images using a trained network will play an important role in the lower time/effort costs during geological surveys. In this work, we trained U-Net and LinkNet, with fine-tuning and backbones, and demonstrated the successful exclusion of the sky and clouds and the difficulties for those of vegetation, artifacts, and talus. Considering the stability of validation accuracy, the fidelity of predicted images, and time/computing costs, approximately 100-step training is appropriate for the dataset and architectures used in this study. Further surveys of reasonable training settings, network architectures, and techniques for obtaining higher prediction fidelities in lower time and effort costs are necessary. In this study, we presented the usability of image segmentation algorithms in the observation and description of geological outcrops. Such approaches could contribute to passing accumulated knowledge on to further generations. Our improved model will enhance the output from the vast collection of remote sensing images obtained not only on Earth but also on other planetary bodies, such as Mars.
The datasets presented in this study can be found in online repositories at: https://doi.org/10.5281/zenodo.8396332.
RN: conceptualization, data curation, formal analysis, funding acquisition, investigation, methodology, project administration, resources, software, supervision, validation, visualization, writing–original draft, and writing–review and editing. DS: methodology, software, validation, writing–original draft, and writing–review and editing.
The author(s) declare that the financial support was received for the research, authorship, and/or publication of this article. RN was supported by Kakenhi grant no. 22K14082.
The authors would like to thank the developers of google-image-download and labelme. Discussions with Nobuo Geshi, Motomaro Shirao, Keiichiro Fujimoto, and Junichi Haruyama were greatly helpful.
The authors declare that the research was conducted in the absence of any commercial or financial relationships that could be construed as a potential conflict of interest.
All claims expressed in this article are solely those of the authors and do not necessarily represent those of their affiliated organizations, or those of the publisher, the editors, and the reviewers. Any product that may be evaluated in this article, or claim that may be made by its manufacturer, is not guaranteed or endorsed by the publisher.
The Supplementary Material for this article can be found online at: https://www.frontiersin.org/articles/10.3389/feart.2023.1264701/full#supplementary-material
Abadi, M., Agarwal, A., Barham, P., Brevdo, E., Chen, Z., Citro, C., et al. (2016). Tensorflow: large-scale machine learning on heterogeneous distributed systems. arXiv preprint arXiv:1603.04467.
Armi, L., and Fekri-Ershad, S. (2019). Texture image analysis and texture classification methods-A review. arXiv preprint arXiv:1904.06554.
Bonadonna, C., Cioni, R., Costa, A., Druitt, T., Phillips, J., Pioli, L., et al. (2016). MeMoVolc report on classification and dynamics of volcanic explosive eruptions. Bull. Volcanol. 78, 84. doi:10.1007/s00445-016-1071-y
Chaurasia, A., and Culurciello, E. (2017). “Linknet: exploiting encoder representations for efficient semantic segmentation,” in 2017 IEEE visual communications and image processing (VCIP) (IEEE), 1–4.
Chollet, F. (2015). Keras. Available at: https://keras.io.
Dewangan, D. K., and Sahu, S. P. (2021). RCNet: road classification convolutional neural networks for intelligent vehicle system. Intell. Serv. Robot. 14 (2), 199–214. doi:10.1007/s11370-020-00343-6
Durig, T., Ross, P. S., Dellino, P., White, J. D. L., Mele, D., and Comida, P. P. (2021). A review of statistical tools for morphometric analysis of juvenile pyroclasts. Bull. Volcanol. 83, 79. doi:10.1007/s00445-021-01500-0
Elharrouss, O., Akbari, Y., Almaadeed, N., and Al-Maadeed, S. (2022). Backbones-review: feature extraction networks for deep learning and deep reinforcement learning approaches. arXiv preprint arXiv:2206.08016.
Haralick, R. M., Shanmugam, K., and Dinstein, I. H. (1973). Textural features for image classification. IEEE Trans. Syst. man, Cybern. (6), 610–621. doi:10.1109/tsmc.1973.4309314
He, K., Zhang, X., Ren, S., and Sun, J. (2016). “Deep residual learning for image recognition,” in Proceedings of the IEEE conference on computer vision and pattern recognition, 770–778.
Hinton, G. E., and Salakhutdinov, R. R. (2006). Reducing the dimensionality of data with neural networks. science 313 (5786), 504–507. doi:10.1126/science.1127647
Iakubovskii, P. (2019). Segmentation models GitHub repository. Available at: https://github.com/qubvel/segmentation_models.
Kingma, D. P., and Ba, J. (2014). Adam: a method for stochastic optimization. arXiv preprint arXiv:1412.6980.
Kueppers, U., Perugini, D., and Dingwell, D. B. (2006a). Explosive energy during volcanic eruptions from fractal analysis of pyroclasts. Earth Planet. Sci. Lett. 248 (3-4), 800–807. doi:10.1016/j.epsl.2006.06.033
Kueppers, U., Scheu, B., Spieler, O., and Dingwell, D. B. (2006b). Fragmentation efficiency of explosive volcanic eruptions: A study of experimentally generated pyroclasts. J. Volcanol. Geotherm. Res. 153 (1-2), 125–135. doi:10.1016/j.jvolgeores.2005.08.006
Latorre, F., Spiller, D., Sasidharan, S. T., Basheer, S., and Curti, F. (2023). Transfer learning for real-time crater detection on asteroids using a Fully Convolutional Neural Network. Icarus 394, 115434. doi:10.1016/j.icarus.2023.115434
Leibrandt, S., and Le Pennec, J. L. (2015). Towards fast and routine analyses of volcanic ash morphometry for eruption surveillance applications. J. Volcanol. Geotherm. Res. 297, 11–27. doi:10.1016/j.jvolgeores.2015.03.014
Liu, E. J., Cashman, K. V., and Rust, A. C. (2015). Optimising shape analysis to quantify volcanic ash morphology. GeoResJ 8, 14–30. doi:10.1016/j.grj.2015.09.001
Miwa, T., Shimano, T., and Nishimura, T. (2015). Characterization of the luminance and shape of ash particles at Sakurajima volcano, Japan, using CCD camera images. Bull. Volcanol. 77, 5–13. doi:10.1007/s00445-014-0886-7
Nolte, M., Kister, N., and Maurer, M. (2018). “Assessment of deep convolutional neural networks for road surface classification,” in 2018 21st International Conference on Intelligent Transportation Systems (ITSC) (IEEE), 381–386.
Palafox, L. F., Hamilton, C. W., Scheidt, S. P., and Alvarez, A. M. (2017). Automated detection of geological landforms on Mars using convolutional neural networks. Comput. geosciences 101, 48–56. doi:10.1016/j.cageo.2016.12.015
Perugini, D., Speziali, A., Caricchi, L., and Kueppers, U. (2011). Application of fractal fragmentation theory to natural pyroclastic deposits: insights into volcanic explosivity of the Valentano scoria cone (Italy). J. Volcanol. Geotherm. Res. 202 (3-4), 200–210. doi:10.1016/j.jvolgeores.2011.02.008
Ronneberger, O., Fischer, P., and Brox, T. (2015). “U-net: convolutional networks for biomedical image segmentation,” in International Conference on Medical image computing and computer-assisted intervention, Cham (Springer), 234–241.
Shoji, D., Noguchi, R., Otsuki, S., and Hino, H. (2018). Classification of volcanic ash particles using a convolutional neural network and probability. Sci. Rep. 8 (1), 8111. doi:10.1038/s41598-018-26200-2
Shozaki, H., Sekine, Y., Guttenberg, N., and Komatsu, G. (2022). Recognition and classification of Martian chaos terrains using imagery machine learning: A global distribution of chaos linked to groundwater circulation, catastrophic flooding, and magmatism on Mars. Remote Sens. 14 (16), 3883. doi:10.3390/rs14163883
Silburt, A., Ali-Dib, M., Zhu, C., Jackson, A., Valencia, D., Kissin, Y., et al. (2019). Lunar crater identification via deep learning. Icarus 317, 27–38. doi:10.1016/j.icarus.2018.06.022
Smith, Z. D., and Maxwell, D. J. (2021). Constructing vertical measurement logs using UAV-based photogrammetry: applications for multiscale high-resolution analysis of coarse-grained volcaniclastic stratigraphy. J. Volcanol. Geotherm. Res. 409, 107122. doi:10.1016/j.jvolgeores.2020.107122
Sodjinou, S. G., Mohammadi, V., Mahama, A. T. S., and Gouton, P. (2022). A deep semantic segmentation-based algorithm to segment crops and weeds in agronomic color images. Inf. Process. Agric. 9 (3), 355–364. doi:10.1016/j.inpa.2021.08.003
Stepinski, T. F., Mendenhall, M. P., and Bue, B. D. (2009). Machine cataloging of impact craters on Mars. Icarus 203 (1), 77–87. doi:10.1016/j.icarus.2009.04.026
Wagstaff, K. L., Daubar, I. J., Doran, G., Munje, M. J., Bickel, V., Gao, A., et al. (2022). Using machine learning to reduce observational biases when detecting new impacts on Mars. Icarus 386, 115146. doi:10.1016/j.icarus.2022.115146
Wieland, M., Li, Y., and Martinis, S. (2019). Multi-sensor cloud and cloud shadow segmentation with a convolutional neural network. Remote Sens. Environ. 230, 111203. doi:10.1016/j.rse.2019.05.022
Wohletz, K., and Heiken, G. (1992). Volcanology and geothermal energy, 432. Berkeley: University of California Press.
Keywords: machine learning, stratigraphic exposures, volcanic stratigraphies, autonomous extraction, U-Net, LinkNet
Citation: Noguchi R and Shoji D (2023) Extraction of stratigraphic exposures on visible images using a supervised machine learning technique. Front. Earth Sci. 11:1264701. doi: 10.3389/feart.2023.1264701
Received: 21 July 2023; Accepted: 12 October 2023;
Published: 02 November 2023.
Edited by:
Carmen Benítez, Universidad de Granada, SpainReviewed by:
Manuel Titos, Icelandic Meteorological Office, IcelandCopyright © 2023 Noguchi and Shoji. This is an open-access article distributed under the terms of the Creative Commons Attribution License (CC BY). The use, distribution or reproduction in other forums is permitted, provided the original author(s) and the copyright owner(s) are credited and that the original publication in this journal is cited, in accordance with accepted academic practice. No use, distribution or reproduction is permitted which does not comply with these terms.
*Correspondence: Rina Noguchi, ci1ub2d1Y2hpQGVudi5zYy5uaWlnYXRhLXUuYWMuanA=
Disclaimer: All claims expressed in this article are solely those of the authors and do not necessarily represent those of their affiliated organizations, or those of the publisher, the editors and the reviewers. Any product that may be evaluated in this article or claim that may be made by its manufacturer is not guaranteed or endorsed by the publisher.
Research integrity at Frontiers
Learn more about the work of our research integrity team to safeguard the quality of each article we publish.