 Tracy Rankin
 Nigel Roulet
 Elyn Humphreys2
 Matthias Peichl
 Jӓrvi Jӓrveoja
94% of researchers rate our articles as excellent or good
Learn more about the work of our research integrity team to safeguard the quality of each article we publish.
Find out more
ORIGINAL RESEARCH article
Front. Earth Sci. , 06 November 2023
Sec. Biogeoscience
Volume 11 - 2023 | https://doi.org/10.3389/feart.2023.1263418
This article is part of the Research Topic Wetland Ecology and Biogeochemistry Under Natural and Human Disturbance- Volume II View all 8 articles
Northern peatlands are globally significant carbon stores, but the sink strength varies from year to year due to changes in environmental conditions. Ecosystem respiration (ER) is composed of both autotrophic respiration (AR) that consists of respiration by plant parts, and heterotrophic respiration (HR) that consists of respiration by microbial bacteria in the soil, fungi, etc. Manual measurements only crudely partition AR and HR, which may lead to erroneous estimates if a change favours one form of respiration over another and may influence our interpretation in the magnitude of respiration. HR has also been thought to be more linked to vegetation dynamics, particularly in wetter, sedge-dominated ecosystems like fens. It is unknown whether such plant-soil-root interactions influence HR in peatlands dominated by woody shrubs whose water table is located further below the surface. The objectives of this study were to 1) determine the contributions of AR and HR at Mer Bleue, an ombrotrophic bog, 2) explore how environmental conditions influence ER and its components, 3) determine how different methodological approaches (e.g. directly measured respiration using automatic chambers vs. extrapolated calculations) can influence our interpretation in the magnitude of respiration, and 4) compare the respiration dynamics with those found in the literature for other peatland types. Our results revealed differences in AR and HR contributions to ER compared to other peatland types reported in the literature. The AR/HR ratio was 3.0 and AR contributions to ER were ∼75% at our study bog, which is generally higher than AR contributions from fens, but also decreased substantially during extended drier periods. HR contributions increased with rising temperature and water table depth. Directly measured ER was smaller than when ER was estimated using night-time relationships with temperature. The magnitude of ER changed depending on the plant biomass, which we believe to be a result of vegetation dynamics influencing HR. The results of this study improved our understanding of peatland carbon cycling as well as the conceptualization of HR.
Northern peatlands play a significant role in the global carbon (C) cycle as long-term sinks of C since primary production exceeds decomposition. Peatlands cover 12% of Canada’s terrestrial surface (Tarnocai et al., 2011) yet contain up to 56% of the organic C stored in Canadian soils (Tarnocai, 2006). Following the last glaciation, peatlands have accumulated C at an average rate of 23–26 g m−2 yr−1 (Charman et al., 2013; Loisel et al., 2014). However, on shorter time scales, a peatland may become a source or a sink of C depending on the environmental conditions of a given year (Roulet et al., 2007; Dorrepaal et al., 2009). Ecosystem respiration (ER) has both an autotrophic component that consists of respiration by plant parts, and a heterotrophic component that consists of respiration by microbial bacteria in the soil, fungi, etc. Most peatland C studies only crudely partition respiration into its autotrophic and heterotrophic components, which may influence our interpretation in the magnitude of respiration (Janskaate et al., 1997; Phillips et al., 2017). For example, heterotrophic respiration (HR) of old soil C may control the response to climate change, because the system could lose C from belowground sources to the atmosphere that had been stored for hundreds of years. In contrast, if autotrophic respiration (AR) controls the response to climate change, the system may fix more C (Hicks Pries et al., 2013).
Most of the variability in CO2 exchange comes from changes in gross primary production and AR (Blodau, 2002; Heimann and Reichstein, 2008), variables that respond predictably and which we understand more fully. The dynamics of HR, on the other hand, is more complicated. HR is predominantly defined in the literature as respiration by microbial bacteria communities that is correlated with environmental and substrate variables, such as litter quality and moisture, and is often synonymously referred to as belowground respiration (Chapin et al., 2006; Minkkinen et al., 2007; St-Hilaire et al., 2010). More recently, however, HR has also been linked to vegetation dynamics and aboveground production. Bond-Lamberty et al. (2004) suggest, for example, that there is no standard practice on whether to include rhizosphere respiration (peat respiration in the vicinity of plant roots) with AR or HR, which may be due to the difficulty in separating root functions from total soil CO2 fluxes, which contains all belowground C sources (Chapin et al., 2006). Similarly, Basiliko et al. (2012) highlight the difficulties in separating root respiration from HR. Furthermore, Sphagnum mosses are capable of fixing the respired CO2 from the vegetation that surrounds them rather than only using the CO2 directly from the atmosphere in the process of photosynthesis (Turetsky and Wieder, 1999; Kuiper et al., 2014). Here, the rate of litter supply is related to plant production through root-soil interactions and belowground processes rather than through plant biomass (Shao et al., 2022). As Sphagnum mosses are sensitive to changes in CO2 concentrations (Serk and Schleucher, 2020), vascular plant coverage (i.e., shrub biomass) may also influence ER, and possibly the magnitude of HR, if the presence of shrubs that provide C to be fixed by the mosses is altered (Shao, 2022). Thus, partitioning AR and HR assuming HR only consists of microbial community respiration when there may also be a possible contribution of a plant-associated component to HR would result in a biased interpretation of the C response.
Consequently, belowground processes are more connected to aboveground production than just the slow decomposition of dead organic matter (Ryan and Law, 2005; Van Hees et al., 2005), which has been seen in sedge-dominated (Kurbatova et al., 2013; Wang et al., 2014; Järveoja et al., 2018) and in permafrost ecosystems (Crow and Wieder, 2005; Hicks Pries et al., 2015). It is unknown whether this same level of vegetation influence on HR exists in shrub-dominated bogs. Where fens make up a greater proportion of peatlands in European countries (Janska et al., 2017; Jimenez-Alfaro, 2018), bogs make up about 70% of peatlands in Canada (Tarnocai et al., 2011). This distinction is very important when considering respiration dynamics of peatlands as future changes in climate could have an impact on Canada’s overall greenhouse gas emissions.
The contributions of AR and HR to total respiration can differ among peatland types (Schuur and Trumbore, 2006) as the respiration components depend on environmental and biogeochemical conditions (Griffis et al., 2000; Ojanen et al., 2012). Moore et al. (2002) estimated that HR contributed about 46% to total annual ER at the Mer Bleue bog. Hicks Pries et al. (2013), on the other hand, found that HR contributed only 6%–18% to total ER at a tundra site in Alaska underlain by permafrost using direct methods. Hicks Pries et al. (2013) also state that the C losses were compensated by an increase in net productivity as the permafrost thaw deepened with increased warming, but that HR may increase substantially if the respiration of older soil eventually outpaces productivity. This statement contradicted the authors’ later study, where long-term warming experiments did not lead to an increase in HR, but rather to an increase in both plants’ AR/HR ratios and the contribution of AR to total ER (Hicks Pries et al., 2015). It would be reasonable to assume that sites not underlain with permafrost, and perhaps not as sensitive to changes in temperature, would show greater AR contributions.
A plant’s response to a change in environmental conditions or following a disturbance can also be explained by the various mechanisms by which the plants utilise water resources (Cernusak, 2020; Zia et al., 2021). Malhotra et al. (2020) suggest that environmental changes (e.g., warming) can alter fine root production, affecting water and nutrient uptake and hence ER and C storage. Oke and Hager (2020) suggest that physiological tolerances and ecological strategies influence a plant’s distribution. Where bogs receive their water source from precipitation, fens receive water inputs from precipitation, surface runoff from adjacent land, and from the groundwater below, which causes environmental constraints on the growth of mosses through enhanced free movement of water through a fen leading to increased oxygenation of the organic substrate and enhanced decomposition (Baldwin and Batzer, 2012). A 50/50 split in AR and HR contributions to ER was found at Degerö Stormyr, a fen in northern Sweden (Järveoja et al., 2018). However, fens have a high water table for most of a growing season, whereas in bogs, the water tables are mainly below the surface, leading to more aerobic conditions (Mitsch and Gosselink, 2007; Moore, 2008). Bogs, as a result, may show a greater contribution of HR than fens.
Finally, one’s interpretation of ER measurements may be influenced by the methods used. Typically, respiration during the day is estimated using relationships between respiration measured at night with eddy covariance towers, and temperature (Peichl et al., 2014; Humphreys et al., 2015). But this method can lead to an overestimation of daytime respiration. For example, at a treed fen in Alberta (Cai et al., 2010), they found that direct measurements made with dark chambers during the day resulted in smaller ER fluxes than when the ER during the day was estimated by night-time relationships with temperature. Different diel temperature responses may explain the mismatch between dark daytime and extrapolated nighttime to daytime respiration (Jӓrveoja et al., 2020). Photorespiration though, may also explain part of this discrepancy, as photorespiration tends to be reduced in dark respiration measurements (Pirk et al., 2016). Environmental variables will also play a role since photorespiration has been shown to be stimulated in high temperature and water stress conditions (Lloyd, 2006; Dusenge et al., 2019). Hence, using a standardised definition of HR and measuring dark respiration directly will be key to a better understanding of peatland C cycling.
The objectives of this study are to partition autotrophic and heterotrophic respiration at Mer Bleue, an ombrotrophic bog, using continuous automatic chamber plot measurements. Specifically, this project aims to 1) determine the contributions of autotrophic and heterotrophic respiration, 2) explore the environmental conditions’ influence on respiration and its components, 3) determine how different methodological approaches can influence our interpretation in the magnitude of respiration, and 4) compare the respiration dynamics with those found in the literature for other peatland types.
Mer Bleue is a relatively large (28 km2) ombrotrophic raised bog located near Ottawa, Ontario (45.41°N, 75.52°W). The region has a cool continental climate, with a mean annual temperature of 6.4°C ranging from -10.3°C in January to 21.0°C in July. Mean annual precipitation is 943 mm, 350 mm of which falls from May to August, with a mean annual snowfall of 223 cm (Environment Canada, 2023). Peat depth reaches about 5–6 m near the centre of the bog and is <0.3 m near the edge of the peatland. Bog development began 7100–6800 years ago, and now consists of a hummock-lawn microtopography (Roulet et al., 2007). While the surface of the bog is covered by Sphagnum mosses (Sphagnum angustifolium, Sphagnum capillifolium, Sphagnum fallax, Sphagnum magellanicum), Mer Bleue is primarily dominated by low growing ericaceous evergreen shrubs that make up about 80% of the areal coverage (mainly Chamaedaphne calyculata, with some Ledum groenlandicum, Rhododendron groenlandicum, and Kalmia angustifolia). There is also an occasional mix of sedges (Eriophorum vaginatum) that make up about 3%–5% of the areal coverage (Lai, 2012; Humphreys et al., 2015).
CO2 fluxes were determined using an automatic chamber set up, and separated into two clusters based on the CO2 exchange from baseline measurements conducted in 2017 (not shown), where the plots in a given cluster all responded similarly to one another but the clusters behaved differently with regards to their C response.
In June 2018, we manipulated some of the plots; A breakdown of the manipulations conducted in the two clusters is provided in Table 1. One chamber from each cluster was darkened with aluminum foil to mimic dark respiration. All the aboveground vegetation was removed in the darkened plot from each cluster (i.e., only peat remained), with a layer of green mesh placed on top to account for temperature differences. These plots were also trenched and root exclosures installed. We assumed these plots gave an approximation of HR but realise that the roots may not have been completely decomposed. One chamber in Cluster one was only darkened with no vegetation manipulation, which we assume represents a direct measurement of ER during the day. Finally, one chamber in each cluster was left clear (transparent), which we assume to approximate ER where respiration during the day was derived from a relationship of night-time respiration and temperature. Autotrophic respiration was then derived as the difference between ER and HR in the respective cluster. In Cluster 1, two separate measures of AR were determined: one was the difference between ER in the clear plot and HR from the clipped plot, and the other was the difference between ER from the darkened plot and HR from the clipped plot.
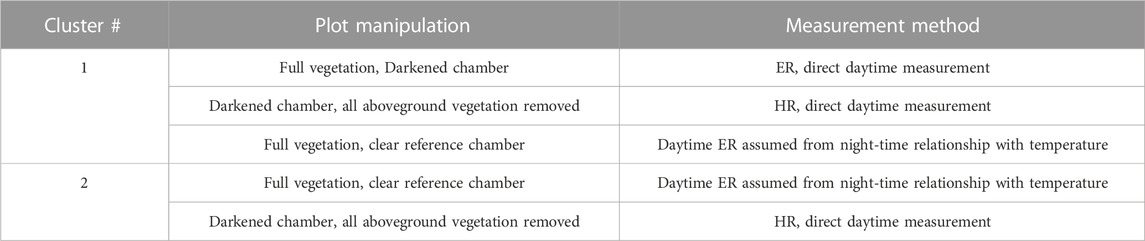
TABLE 1. Automatic chamber set up with descriptions of manipulations and reported measurements.
The calculation of CO2 fluxes from the automatic chambers has been previously described in Lai (2012). The collars were covered at set intervals by plastic domes with a height of 20 cm, a diameter of 52 cm and a thickness of 1 cm. The automatic chambers were programmed to close sequentially by a datalogger (CR23X, Campbell Scientific, UT, USA) to measure gas concentrations for 2 min during the day and 15 min at night. Concentrations of CO2 were measured with a closed-path infrared gas analyser (LI-6262, LI-COR, NE, USA). Using linear regression equations of concentrations over time, one measured flux was obtained for each chamber every 30 min, providing CO2 fluxes on an hourly timescale. Unfortunately, the measurements of 2018 were not usable due to an issue with the pressure in the pumps that circulate the air through the chambers (Model CPFAC2600P, Porter Cable, TN, USA), which resulted in air escaping to the atmosphere. Thus, we only show the 2019 growing season results from the automatic chambers, expressed as hourly averages of CO2 fluxes. Only regressions where the regression coefficients (R2) were greater than 0.95 were kept and all other measurements were discarded, about 5% of the raw data.
Others have performed manipulations to their chamber set ups to determine contributions of AR and HR by trenching the phloem in the aboveground stem, eliminating belowground allocation, a process known as girdling (Hahn et al., 2006; Hardie et al., 2009). However, this was done mainly in forested systems; In a bog, the surrounding vegetation like the mosses surrounding the vascular plants would have been highly disturbed with this approach. Hence, we opted to remove only the aboveground vegetation (leaving the phloem intact), while keeping in mind that residuals of the roots left behind may contribute to the fluxes we measure. Root exclosures (plastic corrugated sheets) were installed though to minimise the need for re-clipping of the plots, as suggested by Marinier et al. (2004).
Water table (WT) depth and soil temperature were continuously monitored throughout the same sampling period as the automatic chambers. Thermocouples were previously installed next to the automatic chambers that were hooked up to a datalogger (CR1000X, Campbell Scientific, UT, United States) which measured continuous soil temperatures at 10 and 40 cm depths. Continuous 30-min records of water table position were also obtained with capacitance water level probes (Odyssey, Dataflow Systems PTY Limited, Christchurch, New Zealand) that were placed inside PVC tubes previously inserted in the peat beside each of the automatic chambers (Lai et al., 2014). Manual measurements of WT depth were taken periodically beside each automatic chamber to match against the values obtained by the capacitance probes and the continuous measurements of WT depth were constructed from these interpolations. Air temperature and photosynthetically active radiation (PAR) were measured at the meteorological station attached to the eddy covariance tower at the site, approximately 30 m away from the automatic chamber set up (Lafleur et al., 2005). Finally, precipitation amounts (reported in mm) were obtained from a weather station nearby (Environment Canada; Historical Weather).
Even though the plots in the autochamber setup all contained a mixture of Sphagnum mosses and the dominant shrub species at the site, Chamaedaphne calyculata, the automatic chambers in Cluster two had a greater contribution of Ledum and roughly 27% lower overall shrub biomass than Cluster 1, partly explaining the difference in C response between the clusters in 2017 (as mentioned above).
The non-destructive point intercept method (Bonham, 2013) was used to estimate biomass in the automatic chamber plots. Square grids were constructed using PVC pipes for the frame and string for the grid. The grid was about 55 cm wide, with grid intersections every 5 cm. The grid was placed above the plots. The placement of the grid was random for each sampling day, but the grid covered the whole collar. A plastic rod with a diameter of about 1 cm was stuck down vertically at a grid intersection point until it touched the peat surface. The number of leaves, shoots and flowers of each plant species touching the rod was recorded, where every other grid point in each column was sampled. Measurements were taken either six or seven times, depending on the plot, between June 27th and 27 August 2018.
Destructive sampling was carried out about 30 m away from the automatic chamber set up. A 25 cm diameter collar was randomly placed on a hummock similarly to the placement of the autochambers. The biomass was sampled non-destructively using the same point intercept method, as outlined above. The above ground vascular biomass in the plot was then clipped and bagged. In the lab, the samples were sorted by organ and species, dried at 70°C for 30 h, and then weighted. Ten measurements were made between July 13th and July 30th in 2018. The number of hits of plant organs was normalised using the number of grid points in that sample. Linear regressions were generated to relate the number of hits per grid point of a plant organ to biomass. R2 values were also generated and were all above 0.97 with a p-value <0.001. These equations were then used to estimate the biomass in each of the four automatic chambers before manipulations to the plots were conducted.
The automatic chambers in Cluster one had an average estimated shrub biomass of 372 ± 10 g m−2 and the automatic chambers in Cluster two had an average estimated shrub biomass of 272 ± 42 g m−2, with ∼13% contribution from Ledum to overall shrub biomass in Cluster 1, and ∼23% contribution from Ledum to overall shrub biomass in Cluster 2. Biomass measurements were similar to those found previously from the site using similar sampling techniques (Humphreys et al., 1997; Moore et al., 2002).
Statistical analyses were performed using the R statistical software (R Core team, 2020). First, simple linear and multiple regressions were conducted among the respiration fluxes (ER, HR, and AR) and the various environmental variables using the “stats” package in R. Second, coefficients of variation (standard deviation/mean of population) were conducted to determine the degree of variability in AR contributions to ER, as described in Abdi (2010). Third, repeated measures Analysis of Variance (ANOVA) tests were conducted using the “car” package in R (a tool for modelling irregularly sampled time series data) to determine if the fluxes from the different treatments were significantly different (Belcher et al., 1994). Finally, two sample t-tests were conducted using the “stats” package to determine whether the fluxes of ER as measured by the darkened chamber were significantly different from the ER estimated by a temperature relationship with night-time respiration in the clear plots. An additional comparison (two sample t-test) was made between ER measured during the day in the darkened plot of cluster one and ER estimated by a temperature relationship with night-time respiration in the same plot. We consider individual p-values less than or equal to 0.10 as significant.
The growing season of 2019 was wetter in May and June compared to the normal averages, then consistently became warmer and drier as the growing season progressed (Figure 1), with WT depth similar to normal averages in July and August (Teklemariam et al., 2010), albeit a bit drier than those measured in previous years (He et al., 2023). Mean daily air temperatures from the eddy covariance tower nearby ranged between 23°C and 31°C (May - August), soil temperatures at 10 cm depth ranged between 12°C and 22°C, and precipitation amounts ranged from 0 mm to a few rain events that reached between 15 and 20 mm. The average WT depth ranged between 10 cm and 53 cm (May–August mean WT = 36.5 cm depth), although, the local WT depth varied slightly depending on the location of the automatic chamber (Figure 2).
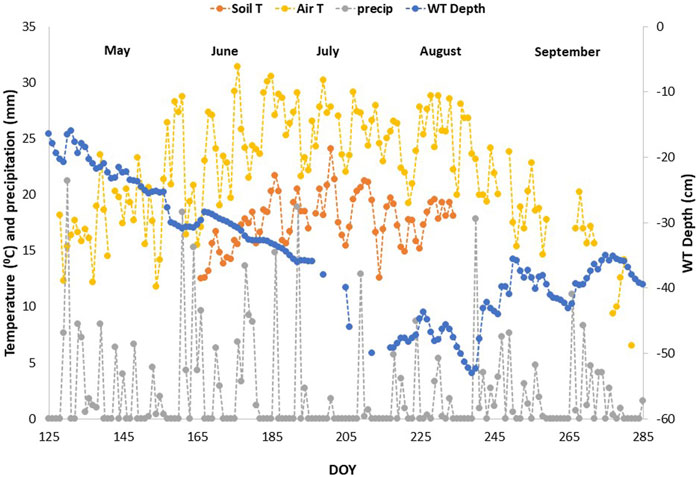
FIGURE 1. Environmental Variables across the growing season of 2019, derived from the eddy covariance tower near the automatic chamber set up. Soil T is soil temperature at 10 cm depth, WT is water table, T is temperature, and precip is the precipitation amounts obtained from Environment Canada’s weather station nearby.
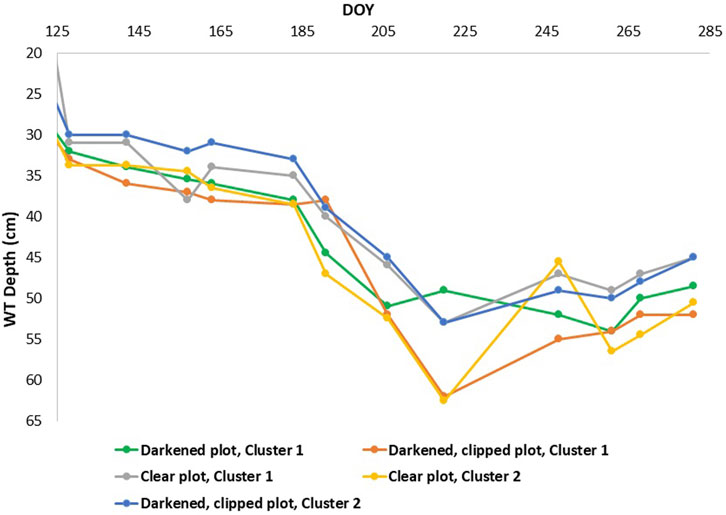
FIGURE 2. Water table (WT) depth taken from manual measurements in 2019.
Estimated ER based on the temperature relationship with night-time respiration from the clear chamber in cluster one ranged between 100 and 1220 mg CO2 m−2 hr−1, and HR in Cluster one ranged between 0 and 390 mg CO2 m−2 hr−1 (Figure 3A). In contrast, ER estimated from the clear chamber in Cluster 2, based on the temperature relationship with night-time respiration, ranged between 100 and 475 mg CO2 m−2 hr−1, and HR ranged between 0 and 250 mg CO2 m−2 hr−1 (Figure 3B). ER measured during the day from the darkened chamber in Cluster one ranged between 50 and 1250 mg CO2 m−2 hr−1, and between 250 and 1000 mg CO2 m−2 hr−1 when daytime ER was estimated from night-time measurements (Figure 4).
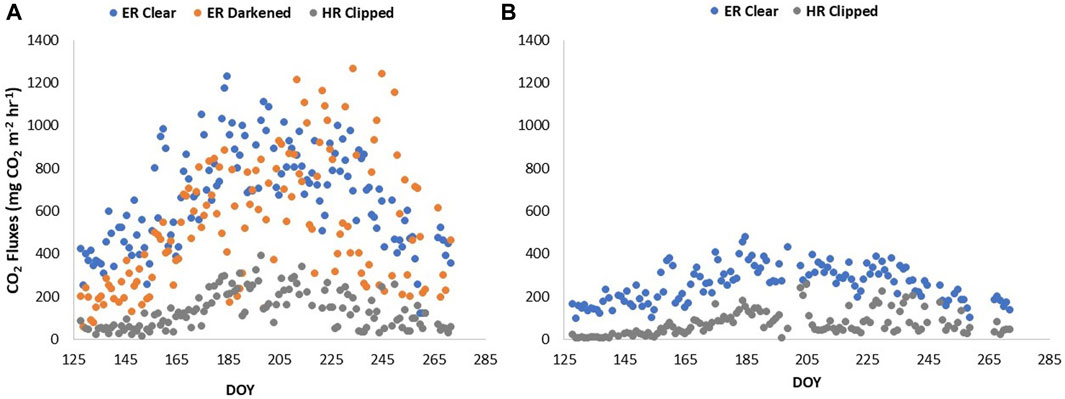
FIGURE 3. ER fluxes estimated in the clear plot based on temperature relationship with night-time respiration values, ER fluxes measured in the darkened plot, and HR fluxes measured in the clipped plot, across the growing season of 2019 in (A) cluster 1, and (B) cluster 2. ER is ecosystem respiration, and HR is heterotrophic respiration.
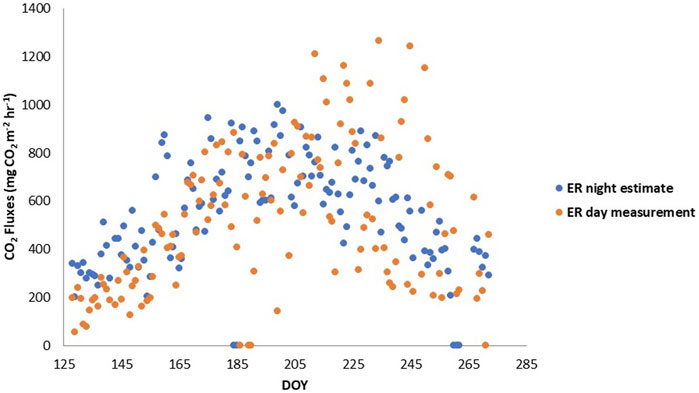
FIGURE 4. Ecosystem respiration (ER) flux comparison between daytime measurements and estimates conducted with nighttime measurements in the darkened plot of cluster 1.
Derived AR fluxes ranged from 200 to 1000 mg CO2 m−2 hr−1, 300–1100 mg CO2 m−2 hr−1, and 100–400 mg CO2 m−2 hr−1 for the darkened and reference plot in Cluster one and reference plot in Cluster 2, respectively (Figure A1). Consequently, the AR contributions to ER were 76.5 ± 11.2%, 79.0 ± 11.4% and 75.1 ± 21.4%. The coefficients of variation in AR contributions were 15%, 14% and 22% for the darkened and clear plot in Cluster one and clear plot in Cluster 2, respectively (Figure 5).
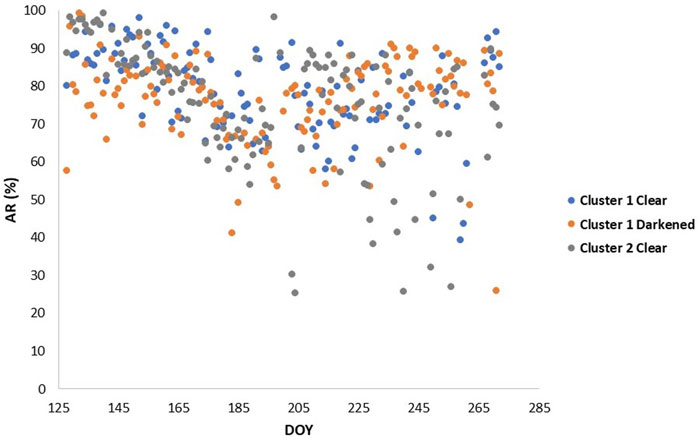
FIGURE 5. Autrotrophic respiration (AR) contributions (%) derived for the darkened plot and clear plot in cluster 1, and clear plot in cluster 2.
Repeated measures ANOVA show that the fluxes from the different manipulation treatments (ER vs. HR) were significantly different between the reference and clipped plots in Cluster 1 (F = 245.4, p < 0.00001) and cluster 2 (F = 451.3, p < 0.00001). ER measured from the darkened plot during the day was significantly different than ER estimated using night-time relationships with temperature in the clear plot from Cluster 1 (T = -3.7, p = 0.0001), but not significantly different when compared with the estimated ER from night-time measurements in the darkened plot (T = -1.3, p > 0.2). Additionally, the difference in ER fluxes between the two clusters was significant (T = -18.0, p < 0.00001), as well as the difference in HR fluxes between the two clusters (T = -6.7, p < 0.00001).
Linear regression analyses support these findings. ER, AR and HR all generally increased as WT depths increased (became drier) and soil and air temperature increased. Although, there were instances where we saw the opposite effect, which caused a difference in the amount of variance explained by the environmental variables. In the reference plot of Cluster 1, when environmental variables were considered individually, ER and AR correlated with air temperature and somewhat with WT depth above 35 cm and soil temperature, whereas HR correlated with WT depth and somewhat with air temperature. More variance was explained by the interaction of environmental variables for AR only when multiple regression was used. It was a similar case in Cluster 2, where ER and AR were associated more with air temperature and somewhat with WT depth above 35 cm and soil temperature, whereas HR was correlated more with WT depth and somewhat with air temperature. However, the interaction of multiple variables increased the variance explained for all three fluxes (Table 2).

TABLE 2. Coefficient of determination (R2) for linear and multiple regressions between the respiration fluxes (ER, AR, and HR) in the automatic chamber plots and the environmental variables in 2019. ER is ecosystem respiration, AR is autotrophic respiration and HR is heterotrophic respiration. WT is water table depth above 35 cm depth, Soil T is soil temperature at 10 cm depth, and Air T is air temperature measured at the flux tower. All relationships are significant at p < 0.001; All blank entries are not significant.
In contrast, for the darkened plot in Cluster 1, ER, AR and HR were all mostly correlated with WT depth above 35 cm, where more than 50% of the variance was explained, and air temperature explained less than 15% of the variance for all three fluxes when linear regression was used. There were no significant relationships with soil temperature for the darkened plot, and the interaction of multiple variables did not increase the variance explained for any of the fluxes when multiple regression was used (Table 2). There were no significant relationships found with WT depth when the WT dropped below 35 cm depth for any of the automatic chambers.
Although ER fluxes were lower in the plots with less vascular biomass (Figure 3), the magnitude of the ER fluxes was consistent with those found in other studies (Bubier et al., 2007; Sulman et al., 2010; Flanagan and Syed, 2011; Lai et al., 2014). One would assume HR from the clipped plots to be the same between the two clusters though, which was not the case in our study (Figure 3). With a greater abundance of vascular plants, a greater contribution of residual decomposing roots would have been expected (Zeh et al., 2020). However, the difference in HR could also be due to the species composition of the plots prior to clipping, where the automatic chambers that had a slightly greater contribution of Ledum would have led to a difference in decomposition rates (Murphy et al., 2009b; Murphy and Moore, 2010). Thus, this may be explained by inherent spatial variability.
An additional explanation is that the vascular plants were inhibiting the respiration of the microbes below, with the mosses providing a priming effect to heterotrophic respiration. Gavazov et al. (2018) found enhanced heterotrophic decomposition of peat C due to rhizosphere priming. At the Mer Bleue bog, the mosses assimilate C released from the roots of the shrubs back to the atmosphere as an additional source of respiration to be used in the process of photosynthesis. Turetsky and Wieder (1999) saw this similar phenomenon in their study. Considering that mosses are sensitive to changes in CO2 concentration (Serk and Schleucher, 2020), it is possible that where there were less shrubs present, there was a lower contribution of plant-associated HR, and more peat decomposition. For example, Shao (2022) showed in his modelling study that when the ericoid mycorrhiza fungi around the shrub roots were removed from the model, the autotrophic respiration of the mosses increased from ∼75 gCm−2yr−1 to ∼125 gCm−2yr−1, highlighting the importance of shrub-moss-mycorrhizae associations to C cycling in peatlands. In contrast, the results of the study by Defrenne et al. (2023) suggest that host plant abundance might not be tightly associated with a change in the dominant type of mycorrhizal association. They do note though, that experimental manipulations of plant community composition along with water table variability would be necessary to directly establish causality.
AR fluxes were inherently low when ER fluxes were low (Figure A1). Although overall AR contributions (%) were slightly lower in the automatic chambers with less biomass, the AR contributions to ER at Mer Bleue was around 75%, which is considerably higher than the contribution of AR reported in other studies of bogs. Moore et al. (2002) for example, estimated that AR contributed about 54% to total ER at Mer Bleue by using a peatland decomposition model, and Hardie et al. (2009) report AR contributions from a blanket bog in the United Kingdom uplands to range between 41% and 54% of the total ecosystem CO2 flux using direct static chamber measurements. It is possible that the greater AR contributions we found at Mer Bleue are due to the specific environmental conditions the plants were subjected to in 2019, and it would have been interesting to see the comparison with results from 2018 to confirm this. McPartland et al. (2019) for example, found a change in vascular plant community with warming. It may also be that the plant biomass was lower though at the blanket bog than at the Mer Bleue bog, but the authors don’t provide biomass estimates to confirm.
While its seems that vegetation dynamics may have explained the magnitude of the respiration fluxes, environmental variables seemed to have influenced the short-term variations in respiration and its components. Temporal and spatial variability in ER arose because AR and HR differ in their response and sensitivity to changes in temperature and/or water table position. For example, Asemaninejad et al. (2018) found that warming induced a change in the mycorrhizal root-associated fungi which would alter HR. Similarly, Tian et al. (2020) found a shift in aboveground to belowground allocation of C with increasing temperatures, altering both AR and HR so that the C sink in their study was maintained, but they note that this is assuming the hydrological conditions are not altered. Wang et al. (2014) found that both HR and AR are affected by changes in air temperature, but HR more slowly than AR. Similarly, Grogan and Jonasson (2005) found that newly photosynthesized C by plants was more sensitive to changes in temperature than the C derived from older stores of soil organic matter deeper in the peat, so we often see a shift towards lower AR contributions in warming experiments. Since in our study AR was derived from the difference between ER and HR, and ER was estimated using nighttime relationships with temperature in the clear plots, AR fluxes may have been skewed towards a temperature influence on the response. This would explain why ER measured during the day in the darkened plot of cluster two was more related to WT depth.
Cai et al. (2010) discovered, though, that both photosynthesis and respiration rates were higher in drier and warmer conditions in a treed fen. Indeed, AR contributions to ER were highest in cooler and wetter conditions and lowest in hotter and drier conditions in our study (Figure 5). 2019 had less variable weather conditions than normal, with much wetter conditions in May and June, and we saw higher AR towards the start of the growing season that slowly decreased into the hotter and drier parts of the summer. DOY 191–217 in 2019 was one of the hotter and drier parts of the growing season with less sporadic rain events, and is consequently where we see the lowest AR. Similarly, Mäkiranta et al. (2018) determined that warming on its own was not enough and found that only when a drawdown of water was included in their experiment did they notice a decrease in aboveground production and an increase in belowground biomass. While AR was related mostly to air temperature, HR was related mostly to WT depth in our study (Table 2). Bubier et al. (1998) also found that lower water tables corresponded with higher CO2 emissions. This could be due to local WT changes between the automatic chambers influencing the HR dynamics. For example, in Cluster 1, when the WT started to drop and air temperatures were still rising, we saw a decrease in HR until a certain threshold was met (∼40 cm), and when the WT continually dropped below 55 cm, we saw HR start to jump up. However, in Cluster 2, where the WT never dropped below 55 cm depth (Figure 2), we did not see this same rise in HR.
It is also likely that the inherent nature of the vegetation present influenced the respiration dynamics at Mer Bleue as a species’ ability to sequester C is largely based on how they respond to water stress and changes in hydrology (Zhong et al., 2020). The Chamaedaphne shrubs in this study allocate most of their biomass to belowground roots that spread out laterally and remain relatively close to the surface. Thus, if the WT drops below a certain threshold, the hydrological dynamics may become disconnected from surface processes, and the shrubs rely more on the water retained in the mosses (Murphy et al., 2009a; Murphy et al., 2009b). Even with a slight decrease in temperature and a small jump in rain events towards the beginning of August, the WT at Mer Bleue did not rebound quickly; it wasn’t until the end of August that the WT crept back up toward the surface (Figure 1). In our study, warmer temperatures led to drier conditions, which allowed for more aeration of the peat with a drop in WT depth, and hence a greater HR contribution with more decomposition. In contrast, In the Degerö wet fen in northern Sweden, soil temperature was the main influencing factor to respiration than WT depth (Järveoja et al., 2018), highlighting the need to distinguish between short term physiological responses and a slower response to a change in soil conditions when exploring respiration responses in peatlands.
ER was lower in magnitude for most of the growing season when measured with a darkened chamber during the day versus when ER was interpolated from night-time relationships with temperature (Figures 3, 4). The noticeable differences in the magnitudes of, and short-term variations in, ER may partially be due to different diel temperature responses of AR and HR (He et al., 2023). Similarly, a discrepancy between the same two measurement methods was found at the Degerö Stormyr fen near Umeå, northern Sweden, where the darkened chambers revealed a bimodal diel pattern that contrasted the unimodal pattern implied by extrapolation of the nighttime temperature response for estimating daytime ER fluxes. They attribute this to divergent temperature dependencies of daytime and night-time ER by varying contributions from HR and AR (Jӓrveoja et al., 2020). In our study, the darkened plot revealed a similar overestimation of ER when estimated with night-time measurements, but only for the wetter months of May and June (Figure 4). The latter part of the growing season (DOY >215) showed estimated ER from night-time measurements to be in the middle of the measured ER during the day with considerably more variability. This would explain why the two-sample t-test resulted in a non-significant difference between the two measurements (i.e., the means were in the end, similar despite the bigger range in the daytime measured fluxes of ER). When we separate the time series to ranges before and after DOY 215, the latter part of the season’s two sample t-test resulted in a p-value of 0.405, whereas when the statistical t-test was performed on the time series before DOY 215, the two responses in ER fluxes were statistically different (p = 0.018). The period after DOY 215 also coincides with where AR contributions drastically dropped and is the part of the season where the plants have just passed peak biomass. Consequently, the difference in ER fluxes may be because the relationship with temperature is not capturing all that determines ER. We found that WT depth (when the WT was above 35 cm depth) seemed to explain most of the variability in ER and its components rather than temperature when ER was measured directly during the day. In contrast, where ER fluxes were estimated by night-time relationships with temperature, air and soil temperature explained most of the variability in ER. This may be due to an assumed temperature response where it was not the most important factor related to ER fluxes.
The discrepancy in ER fluxes is more likely to have been influenced by photorespiratory effects, whereby plants take up oxygen in the light and release carbon dioxide, contrary to the general pattern of photosynthesis (Wingler et al., 2000). Consequently, photorespiration is reduced in dark measurements during the day (Pirk et al., 2016). Similarly, Cai et al. (2010) found that ER measured during the day with darkened chambers was lower than ER determined by night-time relationships with temperature in a treed fen in Alberta, which they also associated with photorespiratory effects. However, it has been shown that photorespiration is stimulated in high temperature and water stress conditions (Lloyd, 2006; Dusenge et al., 2019). According to Voss et al. (2013), the photorespiration pathway protects plants from stress-induced damage. Similarly, Poczta et al. (2012) suggest that high temperatures and high vapour pressure deficit (due to the closure of stomata by the plants in drier conditions) leads to enhanced photorespiration. This would explain why the difference in ER fluxes between the measurement methods was more pronounced when conditions became drier and warmer later in the growing season. The greater short-term variability in measured ER at Mer Bleue during the hotter and drier part of the season may be due to the added water stress the plants are subjected to, which is supported by the statistically significant variance explained by WT depth. In contrast, Serk et al. (2021) found that photorespiration was suppressed under low WT conditions, which they attribute to the Sphagnum mosses’ photosynthetic capacity. However, this was found where WT depths ranged between 10 and 40 cm; when the WT was below 40 cm, they did not see the same photorespiration suppression. This is reminiscent of the trend we saw at Mer Bleue; where WT depths were greater than 40 cm for the majority of August is where we suspect to have had a greater photorespiratory effect. It is likely a combination of the method used and environmental conditions then, that explains the variability in ER fluxes throughout the growing season.
The diel pattern found at Degerö Stormyr by Jӓrveoja et al. (2020) was most pronounced during the middle of the growing season as compared to the green up and senescence periods. We did not observe the same double peak in ER fluxes at Mer Bleue though (Figure A2). This could be because AR dominates ER at the Mer Bleue bog, at least for most of the season, hence the diel pattern follows mostly that of AR, whereas at the Degerö fen, there is a 50/50 contribution of AR and HR, so the contrasting diel dynamics might be more pronounced. However, this phenomenon may also have to do with differences in environmental conditions and in geographical location. The Degerö fen is wetter and cooler than the Mer Bleue bog (Peichl et al., 2014). Annual average air temperatures are around 1.2°C, with July and January average temperatures of 14.7°C, and -12.4°C, respectively, and WT depths are much closer to the surface (never dropping below 25 cm) despite a lower average annual rainfall than Mer Bleue of 523 mm (Nilsson et al., 2008). Due to its higher latitude, the amount of solar radiation also allows for longer days and evening periods at Degerö Stormyr.
One of the keys to understanding how the vegetation adapts to their surrounding environment is to determine how they deal with water stress (Belyea and Malmer, 2004). Sedges have root structures that extend vertically downwards, sometimes up to 50 cm depth, and can consequently tap into the water table at deeper depths even during the drier parts of the season as well as support a greater aboveground biomass than shrubs, especially when WT depths fluctuate a lot (Buttler et al., 2015; Pouliot et al., 2023). In contrast, the shrubs allocate more of their biomass to belowground roots, which tend to spread out laterally rather than vertically with root lengths limited to within the first 20–30 cm of the surface (Murphy et al., 2009a; Iversen et al., 2018), hence supporting a greater belowground/aboveground biomass than sedges. Shrubs also allocate energy to needle-like stems (small in diameter but great in height) so they can make use of whatever water is available to the plants in the soil, while minimising the loss of water through transpiration (Bonan, 2008). These shrub stems are also buried annually by the mosses, contributing significantly to the greater belowground biomass (Murphy et al., 2009b). Considering that shrubs are more disconnected from the water table for large parts of the growing season, they tend to rely on the water retained by the mosses closer to the surface, and hence show a greater magnitude in AR as compared to other peatland types like fens, which are comprised of more sedge-like plants (Mccarter and Price, 2014). The Degerö fen, for example, has only dwarf shrub species which are probably even more shallow rooted than the shrub species at the Mer Bleue bog (Wu et al., 2013).
There could also be a vegetation effect and more plant stress with a greater abundance of sedges at Degerö Stormyr. The average AR/HR ratio at Mer Bleue was ∼3.0, but varied considerably, decreasing in drier and warmer conditions. In comparison, the average AR/HR ratio at the Degerö fen was ∼1.5 (Järveoja et al., 2018). Manual chamber methods measuring CO2 fluxes were conducted at Mer Bleue on both the dominant shrub species and on the less abundant sedge species, Eriophorum (Rankin et al., 2022). Average AR/HR ratios for the shrubs was also ∼3.0 as was found with the automatic chambers, but the average AR/HR ratio for the sedges was ∼1.2, closer to that found in the sedge-dominated fen. Based on our results though, the lower temperatures and wetter conditions at the Degerö fen should have led to a greater AR. Also, the total absolute amount of biomass is higher at the Mer Bleue bog (Laine et al., 2012), so there is more potential for AR overall. It is more likely then, that the lower contribution of AR to HR at Degerö is due to the interactive effect of different environmental conditions and Mer Bleue having a greater biomass of shrubs than Degerö has of sedges.
The partitioning of AR and HR has not, to the best of our knowledge, been studied often in other bogs. However, dynamics of AR and HR have been studied more extensively in permafrost sites, and the higher contributions of AR at Mer Bleue seem more similar to those found in cooler regions. For example, Hicks Pries et al. (2015) found AR/HR ratios to average about 1.0 at a subarctic bog in Sweden that is underlain with permafrost, but this ratio substantially increased to almost 2.0 after subjected to warming experiments, which translates to an AR contribution of about 60%. And, in a tundra site in Alaska, Hicks Pries et al. (2013) found AR contributions to be closer to 70% at the peak of the growing season. Perhaps the wetter conditions at Mer Bleue mimic the moisture conditions in a site with thawing permafrost, which is generally associated with greater production and respiration by plant parts.
ER fluxes were lower when measured directly with a darkened chamber than when interpolated from night-time relationships with temperature, which we attributed to photorespiratory effects. The magnitude of ER, AR and HR fluxes changed drastically depending on the plant biomass present in the plots, whereas the differing short-term variations in respiration fluxes were related more to environmental conditions than vegetation dynamics. AR contributions to ER were generally high at Mer Bleue, with an average of 75%, but decreased substantially in extended periods of drought, mainly due to a shift in plant functioning with warmer and drier conditions. The resulting average AR/HR ratio of 3.0 at the Mer Bleue bog is consequently higher than the average AR/HR ratio found at the Degerö fen (∼1.5), where temperatures are lower, water tables are much less variable, and plant biomass is lower.
Future studies should obtain an inter-annual comparison of respiration and its components across the various plant types found in peatlands to get a better grasp on the complex dynamics of HR. A closer look at changes in microbial community response to environmental changes and their link with aboveground production and the plants that surround them would be beneficial to our understanding of peatland C exchange as well.
The raw data supporting the conclusion of this article will be made available by the authors, without undue reservation.
TR: Conceptualization, Data curation, Formal Analysis, Investigation, Methodology, Writing–original draft, Writing–review and editing. NR: Conceptualization, Funding acquisition, Project administration, Resources, Supervision, Writing–review and editing. EH: Software, Supervision, Writing–review and editing, Conceptualization, Methodology, Resources. MP: Conceptualization, Methodology, Writing–review and editing. JJ: Conceptualization, Methodology, Writing–review and editing.
The author(s) declare financial support was received for the research, authorship, and/or publication of this article. This research has been supported by the Natural Sciences and Engineering Research Council of Canada (grant no. NSERC RGPIN 2017-04059). TR was supported by a Garnier Fellowship, and the McGill Department of Geography graduate funds.
We thank the National Capital Commission for permission to work at Mer Bleue. The authors gratefully acknowledge the support from Moshe Dalva, Maya Hassa, Kevin Hutchins, and Zoe Humeåu (McGill).
The authors declare that the research was conducted in the absence of any commercial or financial relationships that could be construed as a potential conflict of interest.
The author(s) declared that they were an editorial board member of Frontiers, at the time of submission. This had no impact on the peer review process and the final decision.
All claims expressed in this article are solely those of the authors and do not necessarily represent those of their affiliated organizations, or those of the publisher, the editors and the reviewers. Any product that may be evaluated in this article, or claim that may be made by its manufacturer, is not guaranteed or endorsed by the publisher.
Abdi, H. (2010). Coefficient of variation. Encycl. Res. Des. (Thousand Oaks, Colorado: Sage) 1, 169–171.
Asemaninejad, A., Thorn, R. G., Branfireun, B. A., and Lindo, Z. (2018). Climate change favours specific fungal communities in boreal peatlands. Soil Biol. Biochem. 120, 28–36. doi:10.1016/j.soilbio.2018.01.029
Baldwin, A. H., and Batzer, D. P. (2012). “Northern peatlands,” in Wetland habitats of north America: ecology and conservation concerns (California: University of California Press).
Basiliko, N., Stewart, H., Roulet, N. T., and Moore, T. R. (2012). Do root exudates enhance peat decomposition? Geomicrobiol. J. 29 (4), 374–378. doi:10.1080/01490451.2011.568272
Belcher, J., Hampton, J. S., and Tunnicliffe Wilson, G. (1994). Parameterization of continuous time autoregressive models for irregularly sampled time series data. J. R. Stat. Soc. Ser. B Methodol. 56 (1), 141–155. doi:10.1111/j.2517-6161.1994.tb01966.x
Belyea, L. R., and Malmer, N. (2004). Carbon sequestration in peatland: patterns and mechanisms of response to climate change. Glob. Chang. Biol. 10, 1043–1052. doi:10.1111/j.1529-8817.2003.00783.x
Blodau, C. (2002). Carbon cycling in peatlands - a review of processes and controls. Environ. Rev. 10 (2), 111–134. doi:10.1139/a02-004
Bonan, G. (2008). Ecological climatology: concepts and applications. Bolder, Colorado: Cambridge University Press.
Bond-Lamberty, B., Wang, C., and Gower, S. T. (2004). A global relationship between the heterotrophic and autotrophic components of soil respiration? Glob. Chang. Biol. 10 (10), 1756–1766. doi:10.1111/j.1365-2486.2004.00816.x
Bonham, C. D. (2013). Measurements for terrestrial vegetation. Fort Collins, Colorado: John Wiley & Sons.
Bubier, J. L., Crill, P. M., Moore, T. R., Savage, K., and Varner, R. K. (1998). Seasonal patterns and controls on net ecosystem CO2 exchange in a boreal peatland complex. Glob. Biogeochem. Cycles 12 (4), 703–714. doi:10.1029/98gb02426
Bubier, J. L., Moore, T. R., and Bledzki, L. A. (2007). Effects of nutrient addition on vegetation and carbon cycling in an ombrotrophic bog. Glob. Chang. Biol. 13 (6), 1168–1186. doi:10.1111/j.1365-2486.2007.01346.x
Buttler, A., Robroek, B. J. M., Laggoun-Défarge, F., Jassey, V. E. J., Pochelon, C., Bernard, G., et al. (2015). Experimental warming interacts with soil moisture to discriminate plant responses in an ombrotrophic peatland. J. Veg. Sci. 26 (5), 964–974. doi:10.1111/jvs.12296
Cai, T., Flanagan, L. B., and Syed, K. H. (2010). Warmer and drier conditions stimulate respiration more than photosynthesis in a boreal peatland ecosystem: analysis of automatic chambers and eddy covariance measurements. Plant, Cell. Environ. 33 (3), 394–407. doi:10.1111/j.1365-3040.2009.02089.x
Cernusak, L. A. (2020). Gas exchange and water-use efficiency in plant canopies. Plant Biol. 22, 52–67. doi:10.1111/plb.12939
Chapin, F. S., Woodwell, G. M., Randerson, J. T., Rastetter, E. B., Lovett, G. M., Baldocchi, D. D., et al. (2006). Reconciling carbon-cycle concepts, terminology, and methods. Ecosystems 9 (7), 1041–1050. doi:10.1007/s10021-005-0105-7
Charman, D. J., Beilman, D. W., Blaauw, M., Booth, R. K., Brewer, S., Chambers, F. M., et al. (2013). Climate-related changes in peatland carbon accumulation during the last millennium. Biogeosciences 10 (2), 929–944. doi:10.5194/bg-10-929-2013
Crow, S. E., and Wieder, R. K. (2005). Sources of CO2 emission from a northern peatland: root respiration, exudation, and decomposition. Ecology 86 (7), 1825–1834. doi:10.1890/04-1575
Defrenne, C. E., Moore, J. A., Tucker, C. L., Lamit, L. J., Kane, E. S., Kolka, R. K., et al. (2023). Peat loss collocates with a threshold in plant–mycorrhizal associations in drained peatlands encroached by trees. New Phytol. 240, 412–425. doi:10.1111/nph.18954
Dorrepaal, E., Toet, S., van Logtestijn, R. S. P., Swart, E., van de Weg, M. J., Callaghan, T. V., et al. (2009). Carbon respiration from subsurface peat accelerated by climate warming in the subarctic. Nature 460, 616–619. doi:10.1038/nature08216
Dusenge, M. E., Duarte, A. G., and Way, D. A. (2019). Plant carbon metabolism and climate change: elevated CO2 and temperature impacts on photosynthesis, photorespiration and respiration. New Phytol. 221, 32–49. doi:10.1111/nph.15283
Environment Canada (2023). Canadian climate normals or averages: 1971–2000. Available at: http://climate.weatheroffice.ec.gc.ca/climatenormals/index_e.html (Accessed September 4, 2023).
Flanagan, L. B., and Syed, K. H. (2011). Stimulation of both photosynthesis and respiration in response to warmer and drier conditions in a boreal peatland ecosystem. Glob. Chang. Biol. 17 (7), 2271–2287. doi:10.1111/j.1365-2486.2010.02378.x
Gavazov, K., Albrecht, R., Buttler, A., Dorrepaal, E., Garnett, M. H., Gogo, S., et al. (2018). Vascular plant-mediated controls on atmospheric carbon assimilation and peat carbon decomposition under climate change. Glob. Chang. Biol. 24 (9), 3911–3921. doi:10.1111/gcb.14140
Griffis, T. J., Rouse, W. R., and Waddington, J. M. (2000). Interannual variability of net ecosystem CO2 exchange at a subarctic fen. Geography 14 (4), 1109–1121. doi:10.1029/1999gb001243
Grogan, P., and Jonasson, S. (2005). Temperature and substrate controls on intra-annual variation in ecosystem respiration in two subarctic vegetation types. Glob. Chang. Biol. 11 (3), 465–475. doi:10.1111/j.1365-2486.2005.00912.x
Hahn, V., Högberg, P., and Buchmann, N. (2006). 14C - a tool for separation of autotrophic and heterotrophic soil respiration. Glob. Chang. Biol. 12 (6), 972–982. doi:10.1111/j.1365-2486.2006.001143.x
Hardie, S. M. L., Garnett, M. H., Fallick, A. E., Ostle, N. J., and Rowland, A. P. (2009). Bomb-14C analysis of ecosystem respiration reveals that peatland vegetation facilitates release of old carbon. Geoderma 153 (3–4), 393–401. doi:10.1016/j.geoderma.2009.09.002
He, H., Moore, T., Humphreys, E. R., Lafleur, P. M., and Roulet, N. T. (2023). Water level variation at a beaver pond significantly impacts net CO2 uptake of a continental bog. Hydrology Earth Syst. Sci. 27 (1), 213–227. doi:10.5194/hess-27-213-2023
Heimann, M., and Reichstein, M. (2008). Terrestrial ecosystem carbon dynamics and climate feedbacks. Nature 451 (7176), 289–292. doi:10.1038/nature06591
Hicks Pries, C. E., Schuur, E. A. G., and Crummer, K. G. (2013). Thawing permafrost increases old soil and autotrophic respiration in tundra: partitioning ecosystem respiration using δ13C and 14C. Glob. Chang. Biol. 19 (2), 649–661. doi:10.1111/gcb.12058
Hicks Pries, C. E., Van Logtestijn, R. S. P., Schuur, E. A. G., Natali, S. M., Cornelissen, J. H. C., Aerts, R., et al. (2015). Decadal warming causes a consistent and persistent shift from heterotrophic to autotrophic respiration in contrasting permafrost ecosystems. Glob. Chang. Biol. 21 (12), 4508–4519. doi:10.1111/gcb.13032
Humphreys, E. R., Charron, C., Brown, M., and Jones, R. (1997). Two bogs in the Canadian hudson bay lowlands and a temperate bog reveal similar annual net ecosystem exchange of CO2. Arct. Antarct. Alp. Res. 46 (1), 103–113. doi:10.1657/1938-4246.46.1.103
Iversen, C. M., Childs, J., Norby, R. J., Ontl, T. A., Kolka, R. K., Brice, D. J., et al. (2018). Fine-root growth in a forested bog is seasonally dynamic, but shallowly distributed in nutrient-poor peat. Plant Soil 424 (1–2), 123–143. doi:10.1007/s11104-017-3231-z
Janska, V., Jimenez-Alfaro, B., Chytrý, M., Divísek, J., Anenkhonov, O., Korolyuk, A., et al. (2017). Palaeodistribution modelling of European vegetation types at the Last Glacial Maximum using modern analogues from Siberia: prospects and limitations. Quarternary Sci. Rev. 159, 103–115. doi:10.1016/j.quascirev.2017.01.011
Janskaate, B. A., Holland, E. A., and Jackson, R. B. (1997). The fate of carbon in grasslands under carbon dioxide enrichment. Nature 388 (6642), 576–579. doi:10.1038/41550
Jӓrveoja, J., Nilsson, M. B., Crill, P. M., and Peichl, M. (2020). Bimodal diel pattern in peatland ecosystem respiration rebuts uniform temperature response. Nat. Commun. 11 (4255), 4255–4259. doi:10.1038/s41467-020-18027-1
Järveoja, J., Nilsson, M. B., Gažovič, M., Crill, P. M., and Peichl, M. (2018). Partitioning of the net CO2 exchange using an automated chamber system reveals plant phenology as key control of production and respiration fluxes in a boreal peatland. Glob. Chang. Biol. 24 (8), 3436–3451. doi:10.1111/gcb.14292
Jimenez-Alfaro, B. (2018). “Inventory, values and restoration of peatlands and mires”, in Vegetation diversity and conservation of European mires. Halle, Germany: Provincial Council of Bizkaia.
Kuiper, J. J., Mooij, W. M., Bragazza, L., and Robroek, B. J. M. (2014). Plant functional types define magnitude of drought response in peatland CO2 exchange. Ecology 95 (1), 123–131. doi:10.1890/13-0270.1
Kurbatova, J., Tatarinov, F., Molchanov, A., Varlagin, A., Avilov, V., Kozlov, D., et al. (2013). Partitioning of ecosystem respiration in a paludified shallow-peat spruce forest in the southern taiga of European Russia. Environ. Res. Lett. 8 (4), 045028. doi:10.1088/1748-9326/8/4/045028
Lafleur, P. M., Moore, T. R., Roulet, N. T., and Frolking, S. (2005). Ecosystem respiration in a cool temperate bog depends on peat temperature but not water table. Ecosystems 8 (6), 619–629. doi:10.1007/s10021-003-0131-2
Lai, D. Y. F., Roulet, N. T., and Moore, T. R. (2014). The spatial and temporal relationships between CO2 and CH4 exchange in a temperate ombrotrophic bog. Atmos. Environ. 89, 249–259. doi:10.1016/j.atmosenv.2014.02.034
Lai, Y. F. (2012). Spatial and temporal variations of carbon dioxide and methane fluxes measured by autochambers at the mer Bleue bog. PhD Thesis. Montreal, Quebec: McGill University.
Laine, A. M., Bubier, J., Riutta, T., Nilsson, M. B., Moore, T. R., Vasander, H., et al. (2012). Abundance and composition of plant biomass as potential controls for mire net ecosystem CO2 exchange. Botany 90 (1), 63–74. doi:10.1139/B11-068
Lloyd, C. R. (2006). Annual carbon balance of a managed wetland meadow in the Somerset Levels, UK. Agric. For. Meteorology 138, 168–179. doi:10.1016/j.agrformet.2006.04.005
Loisel, J., Yu, Z., Beilman, D. W., Camill, P., Alm, J., Amesbury, M. J., et al. (2014). A database and synthesis of northern peatland soil properties and Holocene carbon and nitrogen accumulation. Holocene Spec. Issue 24 (9), 1028–1042. doi:10.1177/0959683614538073
Mäkiranta, P., Laiho, R., Mehtätalo, L., Straková, P., Sormunen, J., Minkkinen, K., et al. (2018). Responses of phenology and biomass production of boreal fens to climate warming under different water-table level regimes. Glob. Change Biol. 24 (3), 944–956. doi:10.1111/gcb.13934
Malhotra, A., Brice, D. J., Childs, J., Graham, J. D., Hobbie, E. A., Vander Stel, H., et al. (2020). Peatland warming strongly increases fine-root growth. Proc. Natl. Acad. Sci. U. S. A. 117 (30), 17627–17634. doi:10.1073/pnas.2003361117
Marinier, M., Glatzel, S., and Moore, T. (2004). The role of cotton-grass (Eriophorum vaginatum) in the exchange of CO2 and CH4 at two restored peatlands, eastern Canada. Ecoscience 11 (2), 141–149. doi:10.1080/11956860.2004.11682818
Mccarter, C. P. R., and Price, J. S. (2014). Ecohydrology of Sphagnum moss hummocks: mechanisms of capitula water supply and simulated effects of evaporation. Ecohydrology 7 (1), 33–44. doi:10.1002/eco.1313
McPartland, M. Y., Montgomery, R. A., Palik, B., Phillips, J. R., and Kolka, R. (2019). Vascular plant species response to warming and elevated carbon dioxide in a boreal peatland. Environ. Res. Lett. 15, 124066. doi:10.1088/1748-9326/abc4fb
Minkkinen, K., Laine, J., Shurpali, N. J., Makiranta, P., Alm, J., and Penttilä, T. (2007). Heterotrophic soil respiration in forestry-drained peatlands. Boreal Environ. Res. 12, 115–126.
Mitsch, W. J., and Gosselink, J. G. (2007). Wetlands. 4th ed. Hoboken, New Jersey: John Wiley & Sons.
Moore, T. R., Bubier, J. L., Frolking, S. E., Lafleur, P. M., and Roulet, N. T. (2002). Plant biomass and production and CO2 exchange in an ombrotrophic bog. J. Ecol. 90 (1), 25–36. doi:10.1046/j.0022-0477.2001.00633.x
Murphy, M., Laiho, R., and Moore, T. R. (2009a). Effects of water table drawdown on root production and aboveground biomass in a boreal Bog. Ecosystems 12 (8), 1268–1282. doi:10.1007/s10021-009-9283-z
Murphy, M. T., McKinley, A., and Moore, T. R. (2009b). Variations in above-and below-ground vascular plant biomass and water table on a temperate ombrotrophic peatland. Botany 87 (9), 845–853. doi:10.1139/B09-052
Murphy, M. T., and Moore, T. R. (2010). Linking root production to aboveground plant characteristics and water table in a temperate bog. Plant Soil 336 (1), 219–231. doi:10.1007/s11104-010-0468-1
Nilsson, M., Sagerfors, J., Buffam, I., Laudon, H., Eriksson, T., Grelle, A., et al. (2008). Contemporary carbon accumulation in a boreal oligotrophic minerogenic mire - a significant sink after accounting for all C-fluxes. Glob. Chang. Biol. 14 (10), 2317–2332. doi:10.1111/j.1365-2486.2008.01654.x
Ojanen, P., Minkkinen, K., Lohila, A., Badorek, T., and Penttilä, T. (2012). Chamber measured soil respiration: a useful tool for estimating the carbon balance of peatland forest soils? For. Ecol. Manage. 277, 132–140. doi:10.1016/j.foreco.2012.04.027
Oke, T. A., and Hager, H. A. (2020). Plant community dynamics and carbon sequestration in Sphagnum-dominated peatlands in the era of global change. Glob. Ecol. Biogeogr. 29 (10), 1610–1620. doi:10.1111/geb.13152
Peichl, M., Öquist, M., Ottosson Löfvenius, M., Ilstedt, U., Sagerfors, J., Grelle, A., et al. (2014). A 12-year record reveals pre-growing season temperature and water table level threshold effects on the net carbon dioxide exchange in a boreal fen. Environ. Res. Lett. 9 (5), 055006. doi:10.1088/1748-9326/9/5/055006
Phillips, C. L., Bond-Lamberty, B., Desai, A. R., Lavoie, M., Risk, D., Tang, J., et al. (2017). The value of soil respiration measurements for interpreting and modeling terrestrial carbon cycling. Plant Soil 413, 1–25. doi:10.1007/s11104-016-3084-x
Pirk, N., Mastepanov, M., Parmentier, F. W., Lund, M., Crill, P., and Christensen, T. R. (2016). Calculations of automatic chamber flux measurements of methane and carbon dioxide using short time series of concentrations. Biogeosciences 13, 903–912. doi:10.5194/bg-13-903-2016
Poczta, P., Urbaniak, M., Sachs, T., Harenda, K. M., Klarzyńska, A., Juszczak, R., et al. (2012). Initiation of microtopography in re-vegetated cutover peatlands: evolution of plant species composition. Agric. For. Meteorology 338, 109529. doi:10.1016/j.agrformet.2023.109529
Pouliot, R., Rochefort, L., and Karofeld, E. (2023). Initiation of microtopography in re-vegetated cutover peatlands: evolution of plant species composition. Appl. Veg. Sci. 15 (3), 369–382. doi:10.1111/j.1654-109X.2011.01164.x
Rankin, T. E., Roulet, N. T., and Moore, T. R. (2022). Controls on autotrophic and heterotrophic respiration in an ombrotrophic bog. Biogeosciences 19, 3285–3303. doi:10.5194/bg-19-3285-2022
R Core Team (2020). A language and environment for statistical computing, version 4.0.2. Vienna, Austria: R Foundation for Statistical Computing. Avaliable at: https://www.R-project.org/.
Roulet, N. T., Lafleur, P. M., Richard, P. J. H., Moore, T. R., Humphreys, E. R., and Bubier, J. (2007). Contemporary carbon balance and late Holocene carbon accumulation in a northern peatland. Glob. Chang. Biol. 13 (2), 397–411. doi:10.1111/j.1365-2486.2006.01292.x
Ryan, M. G., and Law, B. E. (2005). Interpreting, measuring, and modeling soil respiration. Biogeochemistry 73 (1), 3–27. doi:10.1007/s10533-004-5167-7
Schuur, E. A. G., and Trumbore, S. E. (2006). Partitioning sources of soil respiration in boreal black spruce forest using radiocarbon. Glob. Chang. Biol. 12, 165–176. doi:10.1111/j.1365-2486.2005.01066.x
Serk, H., Mats, B. N., and Bohlin, E. (2021). Global CO2 fertilization of Sphagnum peat mosses via suppression of photorespiration during the twentieth century. Sci. Rep. 11–1. doi:10.1038/s41598-021-02953-1
Serk, H., Schleucher, J., Figueira, J., and Wieloch, T. (2020). CO2 fertilization of Sphagnum peat mosses is modulated by water table level and other environmental factors. Plant Cell. Environ. 44, 1756–1768. doi:10.1111/pce.14043
Shao, S. (2022). Modeling microbial dynamics and nutrient cycles in ombrotrophic peatlands. PhD thesis. Montreal, Quebec: McGill University.
Shao, S., Wu, J., He, H., and Roulet, N. (2022). Integrating McGill Wetland Model (MWM) with peat cohort tracking and microbial controls. Sci. Total Environ. 806, 151223. doi:10.1016/j.scitotenv.2021.151223
St-Hilaire, F., Wu, J., Roulet, N. T., Frolking, S., Lafleur, P. M., Humphreys, E. R., et al. (2010). McGill wetland model: evaluation of a peatland carbon simulator developed for global assessments. Biogeosciences Discuss. 7 (11), 3517–3530. doi:10.5194/bg-7-3517-2010
Sulman, B. N., Desai, A. R., Saliendra, N. Z., Lafleur, P. M., Flanagan, L. B., Sonnentag, O., et al. (2010). CO2 fluxes at northern fens and bogs have opposite responses to inter-annual fluctuations in water table. Geophys. Res. Lett. 37 (19), 3–7. doi:10.1029/2010GL044018
Tarnocai, C. (2006). The effect of climate change on carbon in Canadian peatlands. Glob. Planet. Change 53 (4), 222–232. doi:10.1016/j.gloplacha.2006.03.012
Tarnocai, C., Kettles, I., and Ballard, M. (2011). Peatlands of Canada. Geol. Surv. Can. open file 6561, 786. doi:10.4095/288786
Teklemariam, T. A., Lafleur, P. M., Moore, T. R., Roulet, N. T., and Humphreys, E. R. (2010). The direct and indirect effects of inter-annual meteorological variability on ecosystem carbon dioxide exchange at a temperate ombrotrophic bog. Agric. For. Meteorol. 150 (11), 1402–1411. doi:10.1016/j.agrformet.2010.07.002
Tian, J., Branfireun, B. A., and Lindo, Z. (2020). Global change alters peatland carbon cycling through plant biomass allocation. Plant Soil 455, 53–64. doi:10.1007/s11104-020-04664-4
Turetsky, M. R., and Wieder, R. K. (1999). Boreal bog Sphagnum refixes soil-produced and respired 14CO2. Ecoscience 6 (4), 587–591. doi:10.1080/11956860.1999.11682559
Van Hees, P. A. W., Jones, D. L., Finlay, R., Godbold, D. L., and Lundström, U. S. (2005). The carbon we do not see - the impact of low molecular weight compounds on carbon dynamics and respiration in forest soils: a review. Soil Biol. biochem. 37 (1), 1–13. doi:10.1016/j.soilbio.2004.06.010
Voss, I., Sunil, B., Scheibe, R., and Raghavendra, A. S. (2013). Emerging concept for the role of photorespiration as an important part of abiotic stress response. Plant Biol. 15 (4), 713–722. doi:10.1111/j.1438-8677.2012.00710.x
Wang, X., Liu, L., Piao, S., Janssens, I. A., Tang, J., Liu, W., et al. (2014). Soil respiration under climate warming: differential response of heterotrophic and autotrophic respiration. Glob. Chang. Biol. 20 (10), 3229–3237. doi:10.1111/gcb.12620
Wingler, A., Lea, P. J., Quick, W. P., and Leegood, R. C. (2000). Photorespiration: metabolic pathways and their role in stress protection. Phil.Trans. R. Soc. Lond. B 355, 1517–1529. doi:10.1098/rstb.2000.0712
Wu, J., Roulet, N. T., Sagerfors, J., and Nilsson, M. B. (2013). Simulation of six years of carbon fluxes for a sedge-dominated oligotrophic minerogenic peatland in Northern Sweden using the McGill Wetland Model (MWM). J. Geophys. Res. Biogeosciences 118 (2), 795–807. doi:10.1002/jgrg.20045
Zeh, L., Theresa Igel, M., Schellekens, J., Limpens, J., Bragazza, L., and Kalbitz, K. (2020). Vascular plants affect properties and decomposition of moss-dominated peat, particularly at elevated temperatures. Biogeosciences 17 (19), 4797–4813. doi:10.5194/bg-17-4797-2020
Zhong, Y., Jiang, M., and Middleton, B. A. (2020). Effects of water level alteration on carbon cycling in peatlands. Ecosyst. Health Sustain. 6, 1806113. doi:10.1080/20964129.2020.1806113
Zia, R., Hakim, S., and Imran, A. (2021). Plant survival under drought stress: implications, adaptive responses, and integrated rhizosphere management strategy for stress mitigation. Microbiol. Res. 242, 126626. doi:10.1016/j.micres.2020.126626
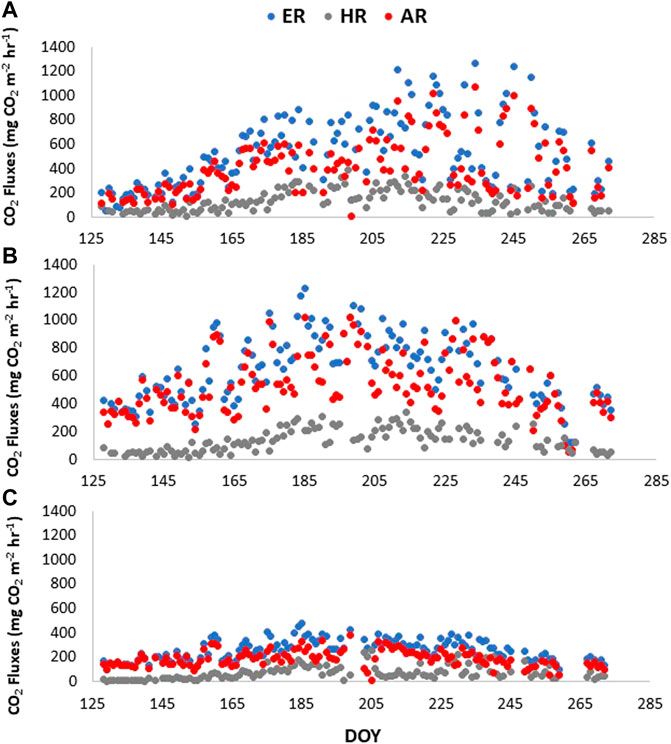
FIGURE A1. ER, HR, and AR fluxes in 2019 for the a) darkened plot, where ER was measured during the day and HR was pulled from the clipped plot in cluster 1, for the b) clear plot in cluster 1, where ER was estimated from nighttime and HR was pulled from the clipped plot in cluster 1, and for the c) clear plot in cluster 2, where ER was estimated from nighttime and HR was pulled from the clipped plot in cluster 2. ER is ecosystem respiration, AR is autotrophic respiration and HR is heterotrophic respiration.
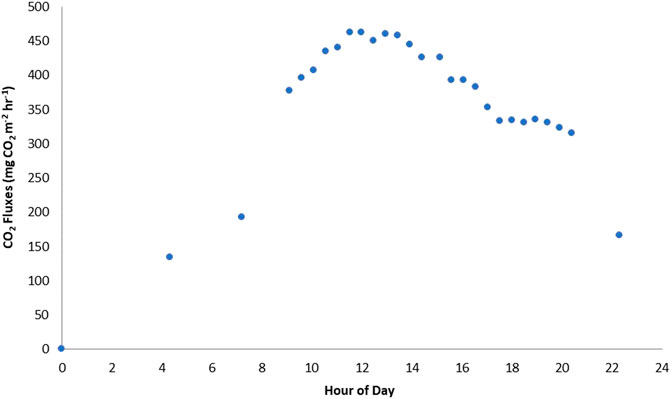
FIGURE A2. Average Ecosystem respiration (ER) fluxes across a 24-h period in the darkened plot of cluster 1.
Keywords: peatlands, carbon exchange, autotrophic respiration, heterotrophic respiration, plant-root-peat interactions
Citation: Rankin T, Roulet N, Humphreys E, Peichl M and Jӓrveoja J (2023) Partitioning autotrophic and heterotrophic respiration in an ombrotrophic bog. Front. Earth Sci. 11:1263418. doi: 10.3389/feart.2023.1263418
Received: 19 July 2023; Accepted: 17 October 2023;
Published: 06 November 2023.
Edited by:
Evan S Kane, Michigan Technological University, United StatesReviewed by:
Antti Juhani Rissanen, Tampere University, FinlandCopyright © 2023 Rankin, Roulet, Humphreys, Peichl and Jӓrveoja. This is an open-access article distributed under the terms of the Creative Commons Attribution License (CC BY). The use, distribution or reproduction in other forums is permitted, provided the original author(s) and the copyright owner(s) are credited and that the original publication in this journal is cited, in accordance with accepted academic practice. No use, distribution or reproduction is permitted which does not comply with these terms.
*Correspondence: Tracy Rankin, dHJhY3kucmFua2luQG1haWwubWNnaWxsLmNh
Disclaimer: All claims expressed in this article are solely those of the authors and do not necessarily represent those of their affiliated organizations, or those of the publisher, the editors and the reviewers. Any product that may be evaluated in this article or claim that may be made by its manufacturer is not guaranteed or endorsed by the publisher.
Research integrity at Frontiers
Learn more about the work of our research integrity team to safeguard the quality of each article we publish.