 Hongsha Xiao1
 Keren Wang
94% of researchers rate our articles as excellent or good
Learn more about the work of our research integrity team to safeguard the quality of each article we publish.
Find out more
ORIGINAL RESEARCH article
Front. Earth Sci., 01 September 2023
Sec. Economic Geology
Volume 11 - 2023 | https://doi.org/10.3389/feart.2023.1257219
This article is part of the Research TopicDifferences in Shale Oil and Gas Reservoirs across Various Sedimentary Environments: Theories and ApplicationsView all 12 articles
In order to accurately simulate the productivity variation characteristics of fractured wells with complex fracture network in shale gas reservoir, based on the multiple migration mechanism of shale gas, the micro-seismic data and discrete fracture model were used to characterize the fracture geometry and complex boundary characteristics, and the comprehensive seepage mathematical model of fractured wells with complex fracture network was established based on the dual porosity-discrete fracture model, and the numerical solution was carried out by combining the unstructured grid and the control volume finite element method. The sensitivity analysis of the influence of key parameters such as fracture conductivity, physical property difference in composite area and Langmuir volume on the production performance of fractured horizontal wells is carried out. This study provides theoretical methods and calculation tools for accurate prediction of productivity change and optimization of production system of fractured horizontal wells with complex fracture network in shale gas reservoirs.
Shale gas reservoir is an important exploration field proposed in China’s energy development plan to vigorously enhance exploration and development, and continuously and efficiently promote the development and utilization of shale gas resources, which has important strategic significance for optimizing China’s clean energy production capacity layout and reducing natural gas dependence on foreign countries (Zou et al., 2020). China is generally rich in shale gas resources. It is estimated that the technically recoverable reserves of shale gas in China are 21.8 trillion cubic meters, and the proven reserves exceed 1 trillion cubic meters (Li, 2023). At present, three national shale gas demonstration zones have been built in Fuling, Changning-Weiyuan and Zhaotong, and China’s shale gas production is planned to reach 80 to 100 billion cubic meters by 2030 (Yang et al., 2020).
By referring to the key technologies of the shale gas revolution in North America, the multi-cluster fracturing technology of horizontal wells has become a key method to efficiently develop and utilize shale gas resources (Wu et al., 2022; Sun, 2023). Through the implementation of the “close cutting and large displacement and temporary plugging and diversion” technology, the tight reservoir is “broken” to form the SRV (stimulated reservoir volume) region, the natural fracture groups around the near well are opened and communicated, the seepage field around the horizontal wellbore is improved, and the final recoverable reserves of a single well are increased (Xie, 2018; Liu et al., 2019). However, the characterization of complex fracture network geometry and mathematical expression of flow exchange between different systems have been the key problems, affecting prediction accuracy of production after fracturing. Brown et al. (2011), Yuan et al. (2015) divided the fractured horizontal well and shale gas reservoir into stimulated and initial regions, adopting multi-linear and dual porosity models to obtain the solution. Xu et al. (2015), Fan et al. (2015), Zhang et al. (2015) respectively used the circular or rectangular composite region model to simplify the complex fracture geometry, and the flow characterization was carried out by combining the continuum model. In order to more accurately predict the effect of fracture properties on flow mechanism and production, Karimi-Fard et al. (2004), Altwaijri et al. (2018) established the discrete fracture model to display and characterize the length, angle and width of each fracture, and then carried out the production impact analysis. Jiang and Rami (2015) further combined the respective advantages of continuous medium model and discrete fracture model, the discrete fracture model is adopted for large-scale hydraulic fracturing fractures, and continuous medium model is used for small-scale natural fracture system, which ensures the efficiency and accuracy of production prediction of fractured horizontal wells with complex fractures. However, the above models did not take into account the gas-water two-phase flow in the SRV region and gas-water co production characteristics caused by fracturing fluid retention.
In addition, researchers (Ozkan et al., 2011; Stalgorova and Mattar, 2013; Wang, 2014; Li et al., 2015; Zhao et al., 2018) established analytical and semi-analytical models respectively to predict the production of horizontal wells after fracturing in shale gas reservoirs. However, the analytical and semi-analytical model mainly uses the symmetric main fracture model, the whole or local regular rectangular or circular SRV region to simplify the hydraulic fracture network, and for gas-water two-phase flow, an approximate solution is obtained by defining a pseudo pressure function to transform it into single-phase seepage. The above processing will significantly affect the accuracy of production performance and productivity prediction for fractured horizontal wells. The numerical model is more suitable to deal with the geometry characteristics of the complex fracture network, and can accurately characterize the complex boundary characteristics of the fracture network through the spatial mesh dispersion, and is convenient for coupling the multi-scale and multi-phase seepage mechanism of shale gas reservoirs (Wu and Pruess, 1988; Geiger et al., 2004; Lv et al., 2012; Moinfar et al., 2013; Wu, 2014; Zhang et al., 2017; Wang et al., 2020; Zhang et al., 2023).
To sum up, this study combined with micro-seismic data and discrete fracture model to characterize fracture geometry and complex boundary characteristics on the basis of comprehensive consideration of multiple flow mechanisms in shale gas reservoir, and established a dual continuum-discrete fracture coupling seepage model. A fully implicit numerical solution model is established by using unstructured triangular mesh and controlled volume finite element method. Combined with the field data, the productivity change characteristics of horizontal wells after fracturing were simulated and predicted, and the key factors affecting the production and EUR of single well were analyzed.
Natural fractures and bedding are developed in shale reservoirs, the brittle mineral content of favorable development series of strata is high (Cai, 2020; Zhu et al., 2022; Li et al., 2023), and the fracture network stimulation area is formed near the well after fracturing (Zhao et al., 2018). The field monitoring of micro-seismic results of shale fractured horizontal wells shows (as shown in Figure 1) that there are dense signal response points around the wellbore during the fracturing process, and complex reformations are formed during the fracturing process. Therefore, micro-seismic monitoring data and discrete fracture model were applied to characterize the fracture geometry and complex boundary characteristics of the reconstruction area, and the flow characteristics of the composite area of the original reservoir and the stimulation area were described based on the dual medium model (Moinfar et al., 2013; Cheng et al., 2020).
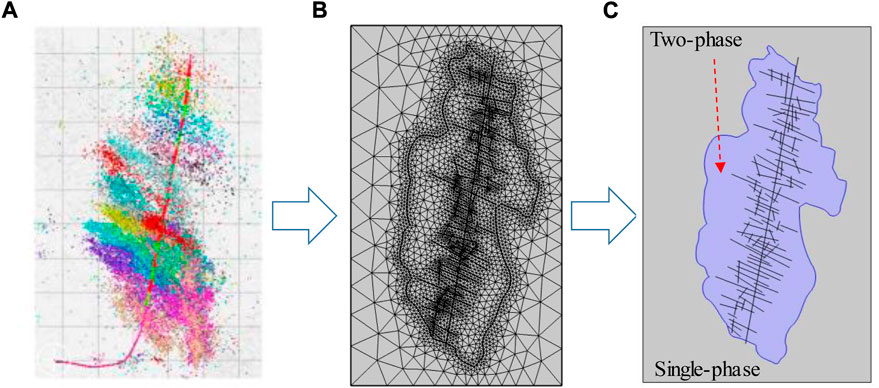
FIGURE 1. Diagram of physical model. (A) Model of fractured horizontal well with complex fracture network in shale gas reservoir based on micro-seismic data (Cheng et al., 2020). (B) Schematic diagram of grid division (6,857 triangles). (C) Assumptions of seepage models in different regions.
The assumptions of the physical model are as follows: 1) Considering the retention of fracturing fluid in the formation, gas-water two-phase flow occurs in hydraulic fracturing fractures and fractures in the reconstruction area, while single-phase gas isothermal seepage occurs in the shale matrix and the original reservoir area. 2) Ignoring the vertical heterogeneity of physical properties of shale reservoirs, two-dimensional grid is used to describe them approximately; 3) There is a quasi steady state channeling between the matrix system and the fracture system, and the fluid enters the fracture system from the matrix system under the action of pressure difference, and flows into the horizontal wellbore through the fracture and produces.
Shale reservoir has a complex pore structure, and gas seepage in the reservoir has multiple flow mechanisms such as Knudsen diffusion, surface adsorption diffusion, slip flow and viscous flow (Geng et al., 2016; Wu et al., 2016; Zhang et al., 2018) (as shown in Figure 2).
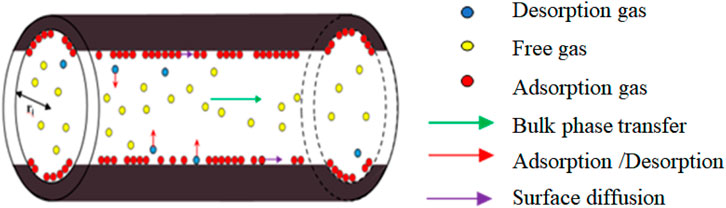
FIGURE 2. Gas transport mechanism in micro and nano pores of shale matrix (Javadpour, 2009; Guo et al., 2022).
In the process of shale gas development, the thickness of adsorption layer decreases, and the effective flow pore size increases further. The effective pore radius of removing the adsorption layer can be expressed as:
Where, dM is the molecular diameter of the gas, m; r is the actual radius of the matrix pores, m; θ is the true gas coverage, dimensionless; p is the current pore pressure, Pa; pL is Langmuir pressure, Pa; Z is the true gas compression factor, dimensionless.
Considering the stress-sensitive effect, the porosity and permeability of shale matrix related to pore pressure can be expressed as:
Where, φ(p) is the porosity of the matrix considering stress sensitivity; φi is the initial porosity, dimensionless; φr is the porosity under maximum stress, dimensionless. k(p) is the matrix permeability after considering stress sensitivity, nD; ki is the original permeability of matrix, nD; η is the stress sensitivity coefficient of porosity, Pa−1; ψ is the stress-sensitive coefficient of permeability, Pa−1; pi is the original gas reservoir pressure, Pa.
The effective pore radius of the matrix considering the thickness of the adsorption layer and the stress-sensitive effect is as follows:
Where, τ is the tortuosity, which is the ratio of the actual length of the flow path to the represented length.
In the circular organic nanopores, the apparent permeability contributed by the bulk phase gas based on the Beskok model can be expressed as:
Where, Kn is Knudsen diffusion constant, dimensionless; α is the rarefied gas effect coefficient, dimensionless, which can be calculated by the following equation:
Where, α0 is the rarefied gas coefficient under Kn→∞ condition; α1 and β are fitting constants.
The apparent permeability considering the real gas effect can be expressed as:
Where, Ds is the surface diffusion coefficient, m2/s; μgr is the gas viscosity after considering the real gas effect, mPa·s; R is the universal gas constant, Pa/(mol•K); T is the absolute temperature, K; Mg is the molecular weight of gas, g/mol; Csc is the concentration of adsorbed gas in Langmuir monolayer on the pore surface, kg/m3. The calculation equation is as follows:
Where, NA is Avogadro’s constant, 6.022×10²³mol-1.
The surface diffusion coefficient can be calculated as follows:
Where, H(1-κ) is Heaviside function; κb is the plugging rate, m/s; κm is migration rate, m/s;
Where, ΔH is the isothermal adsorption heat of gas, J/mol.
The total gas transport flux includes free gas phase transport and surface diffusion of adsorbed gas in circular tube pores. After taking into account the cross-sectional area of the circular tube, the apparent permeability of the matrix pore is as follows:
Where ςbulk is body phase gas weight coefficient, its value is equal to the ratio of the cross-sectional area occupied by the body phase gas and the total cross-sectional area, dimensionless; ςsurface is surface diffusion weight coefficient, its value is equal to the ratio of the cross-sectional area occupied by the surface diffusion gas to the total cross-sectional area, dimensionless.
Further, based on the dual media-discrete fracture model, the comprehensive seepage model of fractured horizontal well is established as follows:
①Seepage control equations of matrix system:
Where,
Where, Bg is the volume coefficient of gas, dimensionless; pgm is the matrix system gas pressure, MPa; pgf is the fracture system gas pressure, MPa; qdes is the desorption production of matrix, m3/s; φm is the matrix system porosity, dimensionless; φf is the porosity of fracture system, dimensionless; α is the shape factor, dimensionless; ρs is the density of shale rock, g/cm3; The subscripts l=1, 2, 1 denotes the inner zone, 2 denotes the outer zone.
②Seepage control equations of fracture system:
For inner zone:
For outer zone:
Where, pf is the pressure of the natural fracture system, MPa; kf is the permeability of natural fractures in shale reservoirs, mD; kr is the relative permeability, dimensionless; Subscript u=g, w, where g represents the gas phase and w represents the water phase.
③Control equations of hydraulic fracture seepage:
Where, kF is hydraulic fracture permeability, mD; φF is the hydraulic fracture porosity, dimensionless; qgsct is horizontal well production, m3/s; pF is the hydraulic fracture pressure, MPa.
First, the element characteristic matrix of Eq. (12) is constructed based on triangular mesh and control volume finite element method (as shown in Figure 3), and the average mesh pressure pgm and average saturation Sfu of the matrix system are approximated by triangle vertex interpolation:
Where Nv is the interpolation function.
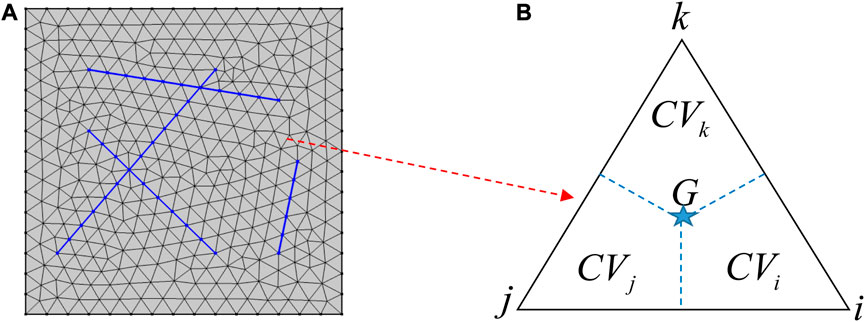
FIGURE 3. Schematic diagram of unstructured mesh generation. (A) Triangular mesh generation for large-scale discrete fractures. (B) Virtual finite control volume mesh in triangular mesh, which is formed by connecting the center of gravity of a triangle to the midpoint of each side.
For the convection term in the matrix system seepage equations, Galerkin’s weighted margin method and Gauss’s law are used to obtain:
Where Tiv represents the conductivity matrix given by the following equation:
The above equations establish the net flow of the control volume of the inflow node i of triangle ijk. Similarly, the net inflow flow equation of nodes j and k can be established. Then the flow matrix of the virtual finite control volume unit can be obtained as:
Eq. (20) is the processing format of the convection term of the controlled volume finite element method based on triangular mesh. In Eq. (12), the cross-flow term between matrix system and fracture system, as well as the adsorption and desorption term and the time derivative term of matrix system are numerically calculated using the traditional finite element method.
Taking gas phase as an example, the finite element integral numerical calculation format for constructing the cross-flow term is as follows:
For the adsorption and desorption term and the time derivative term, the finite element integral numerical calculation format is constructed by combining Euler backward difference as follows:
Eqs 17–22 construct the element characteristic matrix of shale matrix gas phase seepage equation based on triangular mesh and controlled volume finite element method. Similarly, the element characteristic matrix of shale fracture system seepage equation can be constructed.
For hydraulic fracturing fractures, the discrete fracture model is used to reduce their dimensionality to a one-dimensional line segment with a certain width. The interpolation function of the gas phase equation can be expressed as:
Combined with the interpolation function, Eq. (16) of the hydraulic fracture seepage control equation is constructed in the following numerical calculation format:
For the time term:
Similarly, the characteristic matrix of water phase unit in fracturing fracture system can be further constructed.
The pressure value of each system in the next time step is characterized by the fully implicit calculation format. The “dimensionality reduction” treatment of fractured fractures is carried out and embedded into the reservoir flow model. By assembling the characteristic matrix of each unit, the fully implicit iterative solution matrix for the whole region is constructed as follows:
Finally, the numerical well model of fractured horizontal well is established and put into Eq. (26):
Where, qusct is the daily gas and water production ground conditions, m3/d; pbh is bottom-hole flow pressure, MPa; pavei is the average pressure of the grid block where the well source and junction are located, MPa; NF is the total number of intersection points between fractured fractures and horizontal wellbore. PIui is the production index, m3/d/MPa. Through iterative computations, when the accuracy requirements of δP and δSw are met, the stable value under current time step is obtained and the calculation of the next time step is started.
For a fractured horizontal well with a complex fracture network (Figure 1) in the south Sichuan shale gas reservoir block, the triangular grid was used to discrete the spatial grid of the whole area, and a fully implicit numerical simulation program was developed to simulate and predict the production dynamic characteristics of fractured horizontal wells. The basic parameters of the model are shown in Table 1. The calculation equation of the fracture relative permeability curve is: krgf=1-Swf, krwf=Swf.
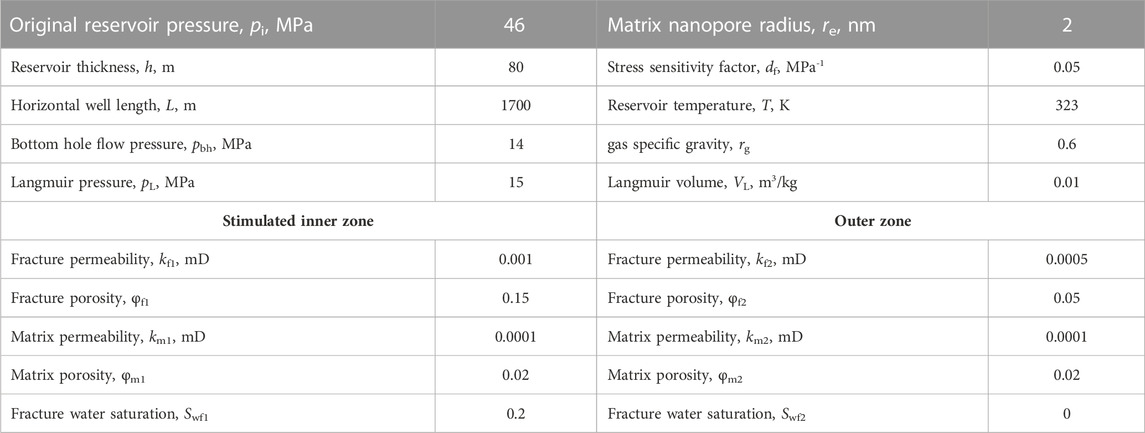
TABLE 1. Basic parameters of the model.
Figure 4 shows the change of gas well pressure of fractured horizontal wells with complex fracture networks of shale gas for 100 days, 1 year and 10 years, respectively. As can be seen from the figure, the pressure propagation presents the characteristics of non-uniform distribution in the complex fracture network area, and the pressure propagation is faster in the well section with high reconstruction degree. At the same time, the gas well pressure propagation gradually expands outward with time, and the pressure at the boundary of the inner and outer regions is also non-uniform due to the influence of the complex fracture network boundary shape. When the pressure propagates to the original reservoir area, its pressure propagation speed is significantly slower than that of the reconstruction area, indicating that the reconstruction area of complex fracture network is the main contribution area to the pressure drop and production of shale gas wells.
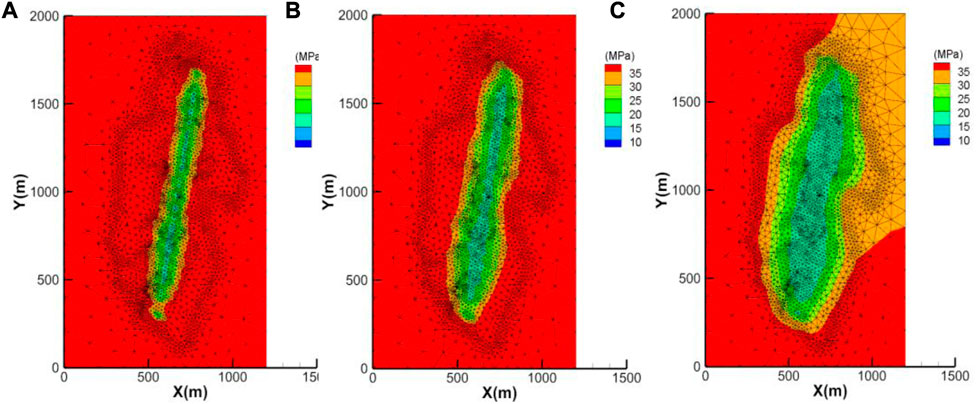
FIGURE 4. Pressure distribution of fractured wells with complex fracture network under different production time. (A) After 100 days’ production. (B) After 1 year’ production. (C) After 10 years’ production.
In addition, Figure 5 shows the production decline curves of fractured horizontal wells with and without SRV region. By comparison, it can be seen that the SRV region formed by complex fracture networks will significantly increase the daily and cumulative gas production of fractured wells, indicating that compared to traditional double wing hydraulic fracturing method, fracture network fracturing is more conducive to achieving higher single well EUR and production efficiency for horizontal wells in shale gas reservoirs.
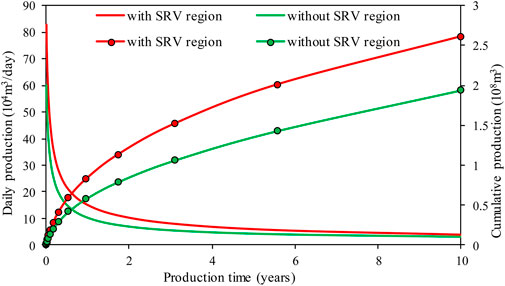
FIGURE 5. Production of fractured horizontal well with and without SRV region.
Figure 6 shows the influence of different fracture water saturation on gas well productivity. Due to the low flowback rate of fracturing fluid in shale reservoirs, a large amount of fracturing fluid remains in the reservoir, resulting in gas-water two-phase flow characteristics in fractured wells and near wellbores. The simulation results show that the higher the fracture water saturation, the lower the daily gas production. When the fracture water saturation is 0.2, 0.3, and 0.4, the cumulative gas production after 10 years of depletion production is 194 million m3, 170 million m3and 145 million m3, respectively. Therefore, the retained fracturing fluid has a significant impact on gas well productivity.
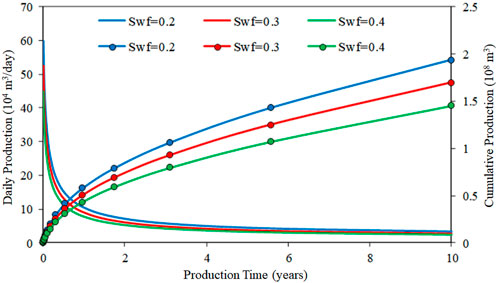
FIGURE 6. Effect of different fracture water saturation on gas well production.
Figure 7 shows the influence of different hydraulic fracture conductivity on gas well productivity. As can be seen from the figure, the higher the diversion capacity, the higher the early daily gas output, but the difference degree gradually decreases with the increase of production time. When the diversion capacity CFD is 0.25D cm, 0.5D cm and 1.0D cm, the cumulative gas production after 10 years of depletion is 133 million m3, 180 million m3 and 194 million m3, respectively. Therefore, in the hydraulic fracturing process of shale gas reservoir, it is necessary to improve the conductivity of fracturing fractures as much as possible to increase the production.
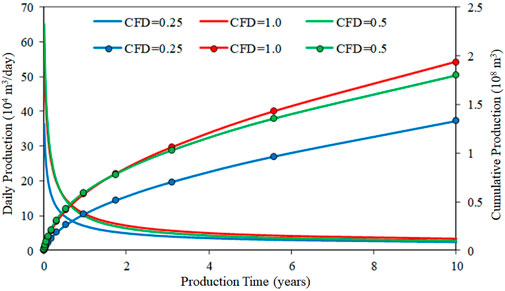
FIGURE 7. Effect of different fracture conductivity on gas well production.
Figure 8 shows the influence of permeability in the stimulation area on gas well productivity. It can be seen that the higher the permeability of the stimulation area, the larger the daily gas production of the gas well in the early stage, and the larger the cumulative production of the gas well, indicating that the fracturing stimulation area around the horizontal well is more fully stimulated. When the fracture permeability in the stimulation area is 0.001mD, 0.005mD and 0.01mD, the cumulative gas production after 10 years of depletion production is 194 million m3, 261 million m3 and 308 million m3, respectively. It is the key to improve the production of shale gas wells by optimizing the construction parameters, increasing the stimulation degree of the stimulation area and improving the seepage capacity of shale reservoir.
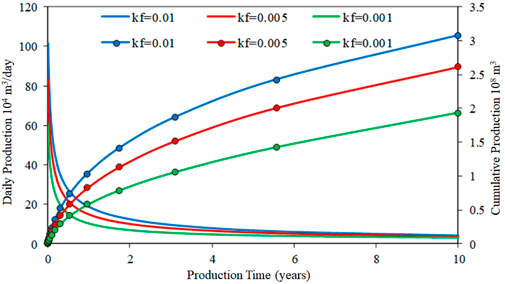
FIGURE 8. Effect of different permeability in SRV region on gas well production.
Figure 9 shows the influence of different Langmuir volume VL on gas well production curves. As can be seen from the figure, the larger the VL value, the larger the daily gas production and cumulative gas production of the gas well, and the slower the decline rate of gas well production. With the progress of gas well production, the free gas in fracture and matrix system is preferentially produced. The continuous reduction of reservoir pressure makes the gas adsorbed on the surface of organic matter begin to desorption, and enter the fracture system as a reservoir supplementary gas source, delaying the decline of gas well production. When Langmuir volume VL is 0.01 m3/kg, 0.02 m3/kg and 0.03 m3/kg, the cumulative gas production after 10 years of depletion production is 193 million m3, 260 million m3 and 313 million m3, respectively. Adsorption and desorption is a unique seepage mechanism of shale gas reservoir, which is different from conventional gas reservoir. With the progress of production, the reservoir pressure decreases and the adsorption gas is desorbed in large quantities, which will contribute to the production replenishment and stable production of fractured horizontal wells in shale gas reservoir in the middle and later stages.
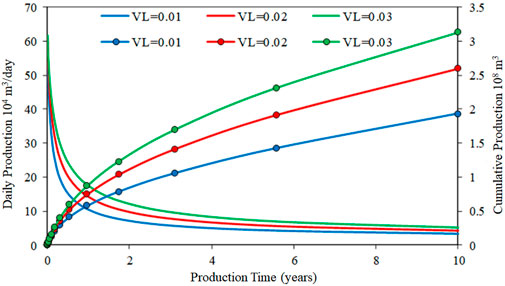
FIGURE 9. Effect of different Langmuir volume on gas well production.
(1) Simulation studies show that the micro-seismic data and discrete fracture model can be used to reasonably characterize fracture geometry and complex boundary characteristics, and the influence of fracture network on production dynamics can be accurately simulated.
(2) Parameter sensitivity analysis shows that the higher the fracture water saturation, the lower the gas well production; The hydraulic fracture conductivity has obvious influence on the early production of shale gas fractured horizontal wells. Complex fracture network stimulation area is the main contribution area of shale gas well output, the better the stimulation effect, the higher the permeability of the stimulation area, the higher the output of shale gas well. Therefore, the fracturing reconstruction of shale gas wells is mainly to improve the reconstruction degree and increase the reconstruction volume.
(3) For fractured horizontal wells in shale gas reservoirs, with a large amount of free gas produced in fractures and matrix systems, the early high production stage ends, and the adsorbed gas adsorbed on the surface of shale matrix is desorbed due to the reduction of reservoir pressure, which becomes the key to the production replenishment and stable production in the middle and late period. The more desorption gas, the greater the cumulative gas production.
The raw data supporting the conclusion of this article will be made available by the authors, without undue reservation.
HX: Methodology, Software, Writing–original draft, Investigation. MC: Data curation, Investigation, Resources, Writing–review and editing. CJ: Formal Analysis, Investigation, Writing–review and editing. HZ: Investigation, Resources, Writing–original draft. KW: Conceptualization, Supervision, Validation, Writing–review and editing.
The authors declare financial support was received for the research, authorship, and/or publication of this article. This study was financially supported by the China Postdoctoral Science Foundation (Grant No. 2022M722638), and the Science and Technology Cooperation Project of the CNPC-SWPU Innovation Alliance (Grant No. 2020CX020202).
HX, MC, CJ, and HZ were employed by the company Sichuan Changning Natural Gas Development Co., Ltd. KW was employed by the Development Division of Southwest Oil & Gas Field Company.
All claims expressed in this article are solely those of the authors and do not necessarily represent those of their affiliated organizations, or those of the publisher, the editors and the reviewers. Any product that may be evaluated in this article, or claim that may be made by its manufacturer, is not guaranteed or endorsed by the publisher.
Altwaijri, M., Xia, Z. H., Yu, W., Qu, L. C., Hu, Y. P., Xu, Y. F., et al. (2018). Numerical study of complex fracture geometry effect on two-phase performance of shale-gas wells using the fast EDFM method. J. Petroleum Sci. Eng. 164, 603–622. doi:10.1016/j.petrol.2017.12.086
Brown, M., Ozkan, E., Ragahavan, R., and Kazemi, H. (2011). Practical solutions for pressure-transient responses of fractured horizontal wells in unconventional shale reservoirs. SPE Reserv. Eval. Eng. 14 (6), 663–676. doi:10.2118/125043-PA
Cai, M. F. (2020). Key theories and technologies for surrounding rock stability and ground control in deep mining. J. Min. Strata Control Eng. 2 (3), 033037. doi:10.13532/j.jmsce.cn10-1638/td.20200506.001
Cheng, L. S., Wu, Y. H., Huang, S. J., Fang, S. D., Ma, M., Xue, Y. C., et al. (2020). A comprehensive model for simulating gas flow in shale formation with complex fracture networks and multiple nonlinearities. J. Petroleum Sci. Eng. 187, 106817. doi:10.1016/j.petrol.2019.106817
Fan, D., Yao, J., Sun, H., Zeng, H., and Wang, W. (2015). A composite model of hydraulic fractured horizontal well with stimulated reservoir volume in tight oil & gas reservoir. J. Nat. Gas Sci. Eng. 24, 115–123. doi:10.1016/j.jngse.2015.03.002
Geiger, S., Roberts, S., Matthai, S. K., Zoppou, C., and Burri, A. (2004). Combining finite element and finite volume methods for efficient multiphase flow simulations in highly heterogeneous and structurally complex geologic media. Geofluids 4, 284–299. doi:10.1111/j.1468-8123.2004.00093.x
Geng, L. D., Li, G. S., Tian, S. C., Sheng, M., Ren, W. X., and Zitha, P. (2016). A fractal model for real gas transport in porous shale. AIChE J. 63, 1430–1440. doi:10.1002/aic.15516
Guo, W., Zhang, X. W., Yu, R. Z., Kang, L. X., Gao, J. L., and Liu, Y. Y. (2022). A model for the apparent gas permeability of shale matrix organic nanopore considering multiple physical phenomena. Front. Earth Sci. 9, 2296–6463. doi:10.3389/feart.2021.813585
Javadpour, F. (2009). Nanopores and apparent permeability of gas flow in mudrocks (shales and siltstone). J. gas Can. Petroleum Technol. 48, 16–21. doi:10.2118/09-08-16-DA
Jiang, J. M., and Rami, M. Y. (2015). A multimechanistic multicontinuum model for simulating shale gas reservoir with complex fractured system. Fuel 161, 333–344. doi:10.1016/j.fuel.2015.08.069
Karimi-Fard, M., Durlofsky, L. J., and Aziz, K. (2004). An efficient discrete-fracture model applicable for general-purpose reservoir simulators. SPE J. 9, 227–236. doi:10.2118/88812-PA
Li, H. (2023). Coordinated development of shale gas benefit exploitation and ecological environmental conservation in China: A mini review. Front. Ecol. Evol. 11, 1232395. doi:10.3389/fevo.2023.1232395
Li, H. T., Wang, J. C., Li, Y., and Luo, W. (2015). Deliverability evaluation method based on volume source for horizontal wells by staged fracturing. Nat. Gas. Ind. 35, 55–63. doi:10.3787/j.issn.1000-0976.2015.09.008
Li, J., Li, H., Yang, C., Ren, X. H., and Li, Y. D. (2023). Geological characteristics of deep shale gas and their effects on shale fracability in the Wufeng–Longmaxi Formations of the southern Sichuan Basin, China. Lithosphere 2023 (1), 4936993. doi:10.2113/2023/4936993
Liu, Y. W., Gao, D. P., Li, Q., Wan, Y. Z., Duan, W. J., Zeng, X. G., et al. (2019). Mechanical frontiers in shale-gas development. Adv. Mech. 49 (1), 201901. doi:10.6052/1000-0992-17-020
Lv, X. R., Yao, J., Huang, Z. Q., and Zhao, J. (2012). Study on discrete fracture model two-phase flow simulation based on finite volume method. J. Southwest Petroleum University:Science Technol. Ed. 34, 123–130. doi:10.3863/j.issn.1674-5086.2012.06.018
Moinfar, A., Varavei, A., Sepehrnoori, K., and Johns, R. T. (2013). Development of a coupled dual continuum and discrete fracture model for the simulation of unconventional reservoirs. The Woodlands, TX, USA: Study SPE 163647 presented at the SPE Reservoir Simulation Symposium.
Ozkan, E., Brown, M., Raghavan, R., and Kazemi, H. (2011). Comparison of fractured-horizontal-well performance in tight sand and shale reservoirs. SPE Reserv. Eval. &Engineering 14 (02), 248–259. doi:10.2118/121290-PA
Stalgorova, E., and Mattar, L. (2013). Analytical model for unconventional multifractured composite systems. SPE Reserv. Eval. Eng. 16, 246–256. doi:10.2118/162516-PA
Sun, Z. M. (2023). Superimposed hydrocarbon accumulation through multi-source and multi-stage evolution in the cambrian xixiangchi group of eastern sichuan basin: A case study of the pingqiao gas-bearing anticline. Energy Geosci. 4 (1), 131–142. doi:10.1016/j.engeos.2022.09.001
Wang, H. T. (2014). Performance of multiple fractured horizontal wells in shale gas reservoirs with consideration of multiple mechanisms. J. Hydrology 510, 299–312. doi:10.1016/j.jhydrol.2013.12.019
Wang, X. C., Rasouli, V., Damjanac, B., Yu, W., Xie, H. B., Li, N., et al. (2020). Coupling of fracture model with reservoir simulation to simulate shale gas production with complex fractures and nanopores. J. Petroleum Sci. Eng. 193, 107422. doi:10.1016/j.petrol.2020.107422doi:107422
Wu, K. L., Li, X. F., and Chen, Z. X. (2016). Micro-scale effects of gas transport in organic nanopores of shale gas reservoirs. Nat. Gas. Ind. 36, 51–64. doi:10.3787/j.issn.1000-0976.2016.11.007
Wu, K. (2014). Numerical modeling of complex hydraulic fracture development in unconventional reservoirs. Austin, TX, USA: The University of Texas at Austin.
Wu, Y. S., and Pruess, K. A. (1988). A multiple-porosity method for simulation of naturally fractured Petroleum reservoirs. SPE Reserv. Eval. Eng. 3, 327–336. doi:10.2118/15129-PA
Wu, Z. W., Cui, C. Z., Jia, P. F., Wang, Z., and Sui, Y. F. (2022). Advances and challenges in hydraulic fracturing of tight reservoirs: A critical review. Energy Geosci. 3 (4), 427–435. doi:10.1016/j.engeos.2021.08.002
Xie, J. (2018). Practices and achievements of the Changning-Weiyuan shale gas national demonstration project construction. Nat. Gas. Ind. 38, 1–7. doi:10.3787/j.issn.1000-0976.2018.02.001
Xu, J. C., Guo, C. H., Wei, M. Z., and Jiang, R. Z. (2015). Production performance analysis for composite shale gas reservoir considering multiple transport mechanisms. J. Nat. Gas Sci. Eng. 26, 382–395. doi:10.1016/j.jngse.2015.05.033
Yang, Z. H., Hu, Z. Q., Xiong, L., Ding, J. H., Shen, B. J., Shi, H. L., et al. (2020). Gas storage characteristics and coupling characteristics of deep shale gas: A case study of well-X in southern sichuan basin, China. Reserv. Eval. Dev. 10, 20–27. doi:10.13809/j.cnki.cn32-1825/te.2020.05.003
Yuan, B., Su, Y. L., Moghanloo, R. G., Rui, Z. H., Wang, W. D., and Shang, Y. Y. (2015). A new analytical multi-linear solution for gas flow toward fractured horizontal wells with different fracture intensity. J. Nat. Gas Sci. Eng. 23, 227–238. doi:10.1016/j.jngse.2015.01.045
Zhu, Q. Y., Dai, J., Yun, F. F., Zhai, H. H., Zhang, M., and Feng, L. R. (2022). Dynamic response and fracture characteristics of granite under microwave irradiation. J. Min. Strata Control. Eng. 4 (1). doi:10.13532/j.jmsce.cn10-1638/td.20210926.001doi:019921
Zhang, D. L., Zhang, L. H., Zhao, Y. L., and Guo, J. J. (2015). A composite model to analyze the decline performance of a multiple fractured horizontal well in shale reservoirs. J. Nat. Gas Sci. Eng. 26, 999–1010. doi:10.1016/j.jngse.2015.07.034
Zhang, L. H., Jia, M., Zhang, R. H., and Guo, J. J. (2017). Discrete fracture network modeling and numerical simulation of fractured reservoirs. J. Southwest Petroleum University:Science Technol. Ed. 39, 121–127. doi:10.11885/j.issn.1674-5086.2016.03.31.03
Zhang, R. H., Chen, M., Tang, H. Y., Xiao, H. S., and Zhang, D. L. (2023). Production performance simulation of a horizontal well in a shale gas reservoir considering the propagation of hydraulic fractures. Geoenergy Sci. Eng. 221, doi:111272doi:10.1016/j.petrol.2022.111272
Zhang, T., Li, X. F., Wang, X. Z., Li, J., Sun, Z., Feng, D., et al. (2018). A discrete model for apparent gas permeability in nanoporous shale coupling initial water distribution. J. Nat. Gas Sci. Eng. 59, 80–96. doi:10.1016/j.jngse.2018.08.024
Zhao, J. Z., Ren, L., Shen, C., and Li, Y. M. (2018a). Latest research progresses in network fracturing theories and technologies for shale gas reservoirs. Nat. Gas. Ind. 38, 533–546. doi:10.1016/j.ngib.2018.03.007
Zhao, Y. L., Zhang, L. H., and Shan, B. C. (2018b). Mathematical model of fractured horizontal well in shale gas reservoir with rectangular stimulated reservoir volume. J. Nat. Gas Sci. Eng. 59, 67–79. doi:10.1016/j.jngse.2018.08.018
Keywords: shale gas reservoir, complex fracture network, fractured horizontal well, production prediction, numerical simulation
Citation: Xiao H, Chen M, Jing C, Zhao H and Wang K (2023) Production simulation and prediction of fractured horizontal well with complex fracture network in shale gas reservoir based on unstructured grid. Front. Earth Sci. 11:1257219. doi: 10.3389/feart.2023.1257219
Received: 12 July 2023; Accepted: 21 August 2023;
Published: 01 September 2023.
Edited by:
Hu Li, Southwest Petroleum University, ChinaReviewed by:
Hong-Bin Liang, Chongqing University of Science and Technology, ChinaCopyright © 2023 Xiao, Chen, Jing, Zhao and Wang. This is an open-access article distributed under the terms of the Creative Commons Attribution License (CC BY). The use, distribution or reproduction in other forums is permitted, provided the original author(s) and the copyright owner(s) are credited and that the original publication in this journal is cited, in accordance with accepted academic practice. No use, distribution or reproduction is permitted which does not comply with these terms.
*Correspondence: Keren Wang, d2FuZ2tlcmVuQHBldHJvY2hpbmEuY29tLmNu
Disclaimer: All claims expressed in this article are solely those of the authors and do not necessarily represent those of their affiliated organizations, or those of the publisher, the editors and the reviewers. Any product that may be evaluated in this article or claim that may be made by its manufacturer is not guaranteed or endorsed by the publisher.
Research integrity at Frontiers
Learn more about the work of our research integrity team to safeguard the quality of each article we publish.