 Qiaozhen Lai
 Wei Zhang
 Jinqing Feng1,2,3
- 1Fujian Key Laboratory of Severe Weather, Fuzhou, China
- 2Key Laboratory of Straits Severe Weather China Meteorological Administration, Fuzhou, China
- 3Longyan Meteorological Bureau, Longyan, China
- 4Fujian Climate Center, Fuzhou, China
An extremely heavy rainfall with dual rainbands occurred in the Fujian province on 22 May 2014, causing severe disasters in Fujian. In order to investigate the key forecasting factors and the predictability of this case, the evaluation and sensitivity analysis of precipitation forecasts by the ensemble prediction system which is based on the European Centre for Medium-Range Weather Forecasts (ECMWF) global Model are carried out. The result show that the ECMWF-EPS have better ability to capture the intensity and spatial distribution of the northern rainband, but significantly underestimated the precipitation in the warm area. Through ensemble forecast sensitivity analysis and comparison between good and poor members, the main factors causing forecast deviations in the two rainbands and affecting the predictability of heavy rainfall were revealed. The forecast of rainfall distribution and intensity in the northern rainband was highly sensitive to the predictability of the weather-scale shear line. The westward bias in the forecasted position and the weakened intensity of the shear line were the main causes of the westward and weaker forecast of heavy precipitation in the northern region. Additionally, the forecast of 850 hPa low-level jets, especially the forecasted intensity of zonal winds, which were closely related to the shear line, significantly influenced the intensity forecast of precipitation in the northern region. The forecast of precipitation in the southern warm area, which was far from the shear line, was more sensitive to the wind speed and thermodynamic conditions of the southwestern airflow in the boundary layer of the upstream inflow region. Most ensemble forecast members underestimated the intensity of the southwestern airflow in the coastal boundary layer of South China, which was the main reason for the near omission of heavy rainfall in the southern warm area. This study provides a quantitative correlation between low-level southwest jets along the coast of Guangdong and Fujian and non-typhoon heavy rainfall in Fujian, and explores their impact on heavy precipitation forecasts.
1 Introduction
In recent years, ensemble forecasting has rapidly developed and is internationally recognized as an effective method to address the issue of “uncertainty” in single deterministic model forecasts (Chen et al., 2002; Du and Li, 2014). Compared to deterministic forecasts, ensemble forecasts provide more forecast information about the atmospheric and precipitation. Since ensemble forecasts implicitly incorporate forecast errors that vary with weather situations (i.e., flow-dependent characteristics), ensemble sensitivity analysis can be used to study the sensitivity of forecast variables to meteorological elements using forecast variable errors and initial errors from ensemble forecasts (Torn and Hakim, 2008). Ensemble sensitivity analysis can be employed to investigate the relationship between forecast variables, initial perturbations, and pre-forecast conditions, explore the dynamic processes behind forecast uncertainty, and identify sensitive areas for target observations (Ma et al., 2015; Majumdar, 2016). In the past decade, ensemble sensitivity analysis has been applied to study forecast errors and predictability of weather systems at different scales and high-impact weather events (Torn, 2010; Chang et al., 2013; Xie et al., 2013; Zheng et al., 2013; Lynch and Schumacher, 2014; Brown and Hakim, 2015; Hill et al., 2016; Greybush et al., 2017; Keller, 2017; Limpert and Houston, 2018; Quandt et al., 2019; Xiao et al., 2021), including key influential systems and their evolution characteristics in heavy rainfall events which deterministic numerical model forecasts perform poorly, thereby deepening the understanding of the physical mechanisms and predictability of heavy rainfall occurrence and development.
Regarding heavy rainfall events in South China, Huang and Luo (2017) evaluated the forecast performance of five global ensemble prediction models for four typical pre-flood season heavy rainfall events in South China based on TIGGE data. Through ensemble sensitivity analysis, they pointed out that the low-level southwest airflow along the South China coast is a key factor in precipitation forecasting in South China. Du and Chen (2018) analyzed a heavy rainfall event in South China and found that frontal rainfall (warm sector rainfall) forecasts have low (high) dispersion and small (large) ensemble mean forecast errors, indicating differences in predictability between the two types of rainfall. Through ensemble sensitivity analysis, they identified the southwest low-level jet (850–700 hPa) and the southward boundary layer jet (925 hPa) as key systems that influence frontal rainfall and warm sector rainfall, respectively, with differences in the sensitive areas of the jets affecting the two types of rainfall. Liu et al. (2020) further discovered, using sensitivity analysis, that the stronger the geostrophic wind component of the southerly wind, the stronger the rainfall in both the inland and coastal areas of South China, while the ageostrophic wind has a smaller impact on rainfall in the inland region but plays an important role in coastal rainfall. Chen et al. (2020) analyzed a heavy rainfall event from southern Guangdong to Fujian and found that frontal rainfall exhibits high sensitivity to weather systems such as pre-frontal troughs and low-level jets, while coastal warm sector rainfall forecasts are sensitive to the distribution of unstable energy in the upstream inflow area.
There have also been studies focusing on ensemble sensitivity analysis of heavy rainfall processes in southwestern and northern China, exploring the key factors influencing the forecast of heavy rainfall in these regions. For example, Wang et al. (2017) used ECMWF ensemble forecasts to study a heavy rainfall process in the Sichuan Basin under the influence of a plateau vortex and a southwestern vortex. The results indicated that when the ensemble forecast had less uncertainty in predicting the southwestern vortex, the ensemble members’ forecast of the plateau vortex became a key factor affecting precipitation intensity and the forecast of the rainfall area. Yu and Meng (2016) used TIGGE data with a total of 84 ensemble members from multiple models to analyze the sensitivity of the 24-h accumulated precipitation in Beijing and its surrounding areas on 21 July 2012, to different levels of geopotential height fields and wind fields. They found that the forecast of this heavy precipitation was more sensitive to the 850 hPa low vortex compared to the upper-level (500 hPa) trough.
However, there have been very few similar studies focusing on the impact of heavy rainfall on Fujian. Fujian is located between the regions of Jiangnan and South China, on the western coast of the Taiwan Strait. Starting from March each year, it is influenced by the convergence of cold and warm air masses, leading to an increase in precipitation. From April to June, it is influenced by the westerly belt system and the southwest warm and moist airflow, resulting in frontal precipitation and warm sector precipitation, often manifested as the coexistence of north and southern rain belt. The rain belt in the northern part of Fujian generally corresponds to frontal or shear systems, while the rain belt in the southern part often forms under the influence of the southwestern jet on the south side of the system, which belongs to warm sector rainfall and is often missed by deterministic models. Strong precipitation in Fujian is also closely related to the complex mountain-sea terrain of the Taiwan Strait. The influence of the Taiwan Strait can cause changes in the wind direction and speed at the lower levels of the strait and along the coastal areas (Wu, 1982), which may affect the distribution of precipitation (Du et al., 2015). These factors increase the difficulty of accurate rainfall prediction for Fujian using numerical models. Previous studies on the influence of coastal topography and wind fields on Fujian’s precipitation mainly focused on typhoon rainfall or sea-frontal rainfall (Lin et al., 2015; Zhang et al., 2015; Chen et al., 2018), and the impact of non-typhoon heavy rainfall in Fujian on predictability has not been thoroughly investigated.
On 22 May 2014, Fujian was affected by a heavy rainfall event with dual rain belts under a non-typhoon background, resulting in urban waterlogging and geological hazards such as flash floods. Multiple numerical models showed significant deviations in forecasting this process, especially almost missing the rainfall in the southern part, resulting in unsatisfactory precipitation forecast services. In this study, based on the global ensemble prediction system at the European Centre for Medium-Range Weather Forecasts (ECMWF-EPS), the forecast verification was conducted for this heavy rainfall event. Ensemble sensitivity analysis was also performed to explore the influence of weather systems on the forecast of rainfall in the southern and northern parts and to analyze the relationship between the dynamic and thermal fields along the coast of Guangdong and northern Fujian and the predictability of heavy rainfall in Fujian.
2 Data and method
2.1 Data
In this study, ground-based precipitation data from 15,514 observation stations within the region of 20–35°N and 110–125°E were interpolated into a 0.5°*0.5° grid using a two-dimensional Cressman interpolation method. The hourly rainfall data was converted to cumulative total rainfall for the previous hour. ERA5 high-resolution (0.25°*0.25°, 1 h) reanalysis data was used to analyze the weather situation during the heavy rainfall event.
The precipitation forecast from the ensemble prediction system at the European Centre for Medium-Range Weather Forecasts (ECMWF-EPS) was verified, and sensitivity analysis of meteorological variables was conducted to explore the forecast ability of the ECMWF-EPS for heavy rainfall in Fujian province. The resolution of the surface dataset was 0.5° * 0.5°, the resolution of the pressure layer data was 1° * 1°, and there were 11 vertical layers with a time interval of 3 h. The forecast was issued twice a day at 08:00 LST and 20:008 LST, with a forecast duration of 360 h. The ensemble members included one control member and 50 perturbed members.
2.2 The probability matching method
To understand the precipitation forecasting capabilities of the ensemble forecasting, the ensemble postprocessing probability matching (PM) method (Ebert, 2001) is compared with the arithmetic ensemble mean (EM) and the single control run (CTL) in this study. The precipitation forecast of EM was computed from arithmetic mean of all members in ensemble forecasting. The precipitation forecast of CTL is the first member of the ensemble forecasting model. For the PM forecast, it is hypothesized that the most likely spatial distribution of precipitation is given by the ensemble average, and the best frequency distribution of precipitation rates is given by the ensemble probability distribution function (PDF). PM works by setting the PDF of the ensemble mean equal to the PDF of the whole ensemble. The heaviest rainfall amount was obtained through the probability matching curve of all members. PM works by setting the PDF of the ensemble mean equal to the PDF of the whole ensemble. The way to perform probability matching is as follows:
In the above equations,
2.3 The sensitivity analysis of the ensemble forecast
The sensitivity analysis of the ensemble forecast was based on Tron and Hakim’s (2008) definition.
The ensemble sensitivity for a certain state variable
The overbar in the formula means the average value of the parameter of all the forecast members. In order to understand the ensemble sensitivity for key systems in different area to the cumulative precipitation forecast in the interest region,
2.4 The quantitatively evaluation of precipitation forecast
This article employs the probability of detection (POD), the success ratio (SR), the frequency bias score (FBIAS), and the TS score to quantitatively evaluate the forecast of precipitation from models. The POD and SR scores can intuitively reflect the differences between forecast values and observed values, and examine the accuracy of the forecast itself。 These statistics are merely reflective problems with some aspect of event forecasting, such as whether there is more or less precipitation forecasting. But there are not possible to make an overall assessment of the level of forecasting. The FBIAS and TS scores are two technical scoring methods that compared to reference forecasts (random forecasts), they reflect the skill score of forecasting (Ding, 1995; Luo et al., 2009). Therefore, using these four types of verification methods to evaluate the forecast of precipitation from models can comprehensively reflect the quality of the forecast.
3 Precipitation and circulation field
3.1 Precipitation
On 21 May 2014, from 20:00 LST to 22 May 2014 20:00 LST, influenced by a warm shear, widespread heavy rain occurred in Fujian, Jiangxi, and the northern part of Guangdong. The main area of intense precipitation was located in the central and northern parts of Fujian and the southwestern part of Fujian to the northern part of Guangdong (Figure 1A). During this process, the maximum daily rainfall occurred in Shanghang County, Longyan City, Fujian Province (green solid circle in Figure 1A), with an accumulated rainfall of 177.4mm, breaking the historical record for daily rainfall in May since 1961 at that station. In addition, the daily rainfall at several other stations, including Jian’ou (blue solid circle in Figure 1A), Shaowu, Jianyang, Zhouning, and Pingnan (black solid dots in Figure 1A), also broke the historical record for daily rainfall in May in their respective locations. These stations are mostly located in valleys with lower elevations (Jian’ou, Shaowu, Jianyang), at the trumpet topography (Shanghang station), or on the windward slopes towards the shore (Zhouning, Pingnan) (Figure 1B).
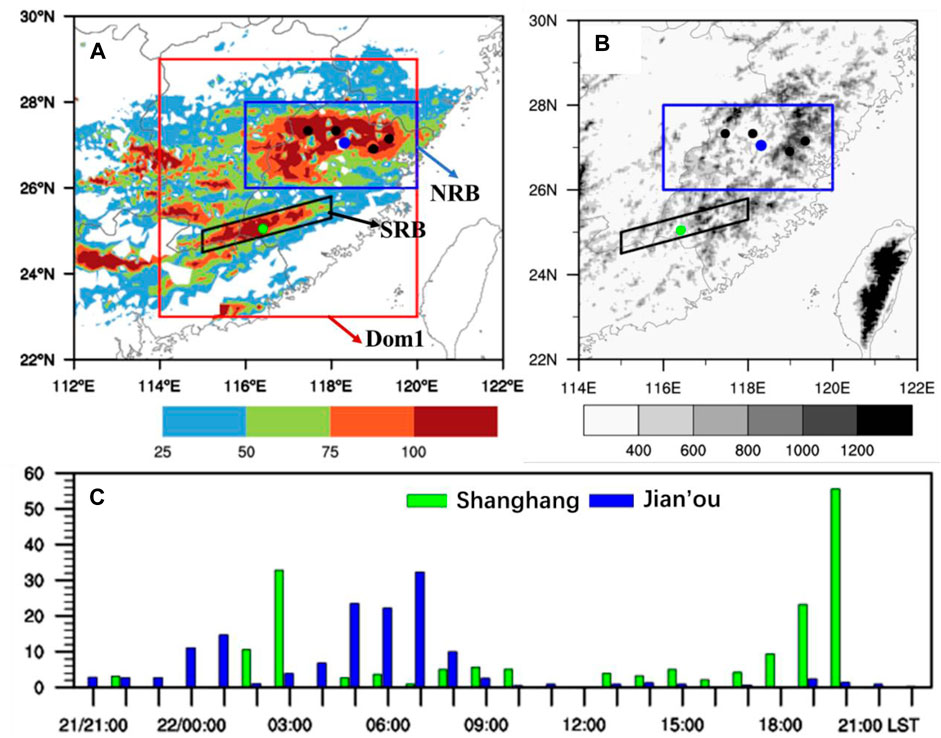
FIGURE 1. The 24-h accumulated rainfall from 20:00LST on May 21 to 20:00LST on May 22 (A), the topography of Fujian (B), and the hourly rainfall at Shanghang and Jian’ou (c, mm). The solid circles in (A) indicate the locations where the daily rainfall exceeded the historical record. The horizontal axis in (C) represents the precipitation time, where 21/21:00 indicates 21:00LST on May 21, and so on.
From the distribution of accumulated precipitation over 6 h (Figure 2), both the southern and northern rain belts (SRB and NRB, blue and black boxes in Figure 1A) existed simultaneously in different precipitation stages, and the two rain belts were always separated by a certain distance, reflecting the “double rain belt” feature. The northern rain belt showed a north-south banded distribution in the first 12 h of precipitation, with a wide range of heavy rainfall. The strongest precipitation occurred from the late night on the May 21 to the early morning on the May 22 (Figure 2B, 02:00LST to 08:00LST on the May 22), and there was a large area of heavy rain in the central and northern parts of Fujian Province. On the May 22, the precipitation in the northern rain belt significantly weakened. The southern rain belt showed a narrow belt-shaped distribution from southeast to northwest, with a small range of heavy rainfall and obvious local features. The precipitation in Fujian Province during the daytime on the May 22 was weaker than that during the night of the May 21.
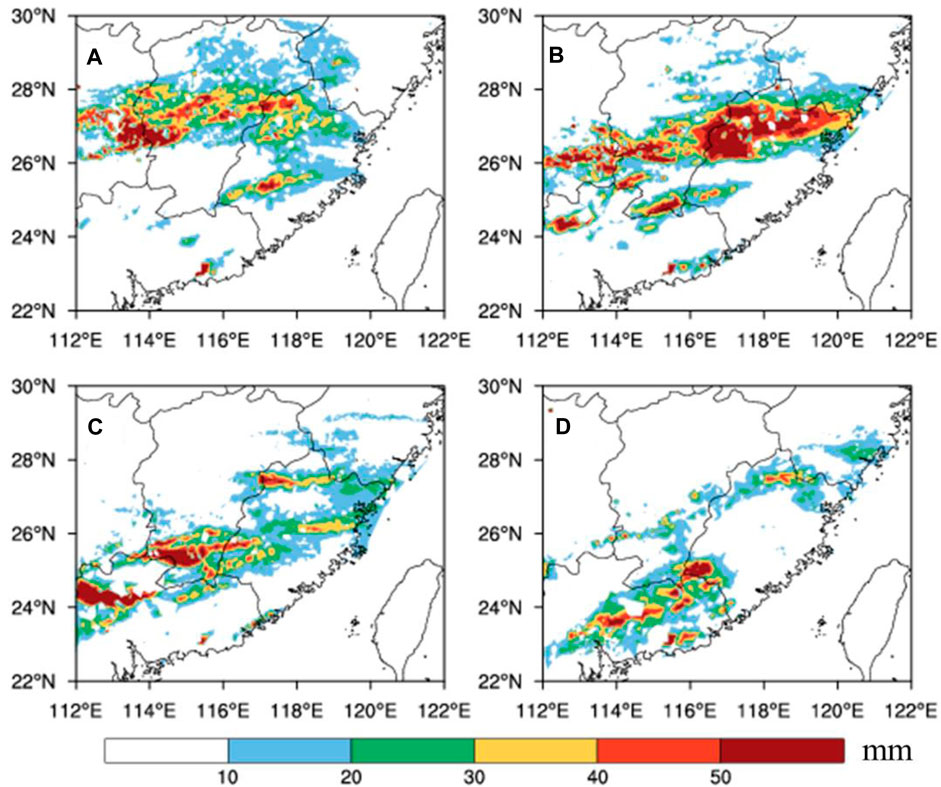
FIGURE 2. The distribution of 6-h accumulated precipitation from 20:00LST on May 21 to 20:00LST on May 22. (A) is 20:00LST on May 21 to 02:00LST on May 22, (B–D) are delayed by 6 h, respectively.
From the hourly precipitation trend at Jianou station (blue bars in Figure 1C) and the 6-hourly precipitation trend of the northern rain belt, it can be seen that the main precipitation period was concentrated during the night of the May 21 to the morning of the May 22, especially from 05:00LST to 08:00LST on the May 22, and precipitation significantly decreased during the daytime on the May 22. The hourly rainfall at Shanghang station (green bars in Figure 1C) in the southern rain belt showed a periodic strong precipitation trend, with precipitation at Shanghang station only tending to stop on the night of the May 22. Strong precipitation was mainly concentrated in two periods, from 02:00LST to 03:00LST on the night of the May 21 and from 18:00LST to 20:00LST on the May 22, with the maximum cumulative precipitation exceeding that of Jianou station. In addition, the maximum hourly rainfall intensity at Shanghang station was 55.6 mm/h, which exceeded that of Jianou station in the northern rain belt (maximum of 32.3 mm/h), but the hourly precipitation at Jianou station exceeded 20 mm/h for three consecutive hours.
3.2 Synoptic scale environment analysis
This section describes the synoptic scale circulation of the severe precipitation event that occurred in southern China on May 21–22, 2014. On May 21 night (Figures 3A, D), the 500 hPa trough was located in the eastern part of the central plains, and warm shear at 850 hPa and 925 hPa was located in the southwestern region to the north of Jiangxi Province, with boundary layer shear being more southward than 850 hPa shear. The regions south of the Yangtze River were under southwestern or southward airflows, with southwestern winds at 850 hPa and 925 hPa greater than 10 m/s in Guangdong and Guangxi. The specific humidity at 925 hPa in the southwestern airflow region was greater than 12 g/kg (Figure 3D shading). There were two cold air masses at 850 hPa (Figure 3A shading), with the westward one located north of the 850 hPa shear and the eastward one located at the junction of Fujian and Zhejiang, and the warm area greater than 18°C was mainly located in Guangdong and Guangxi.
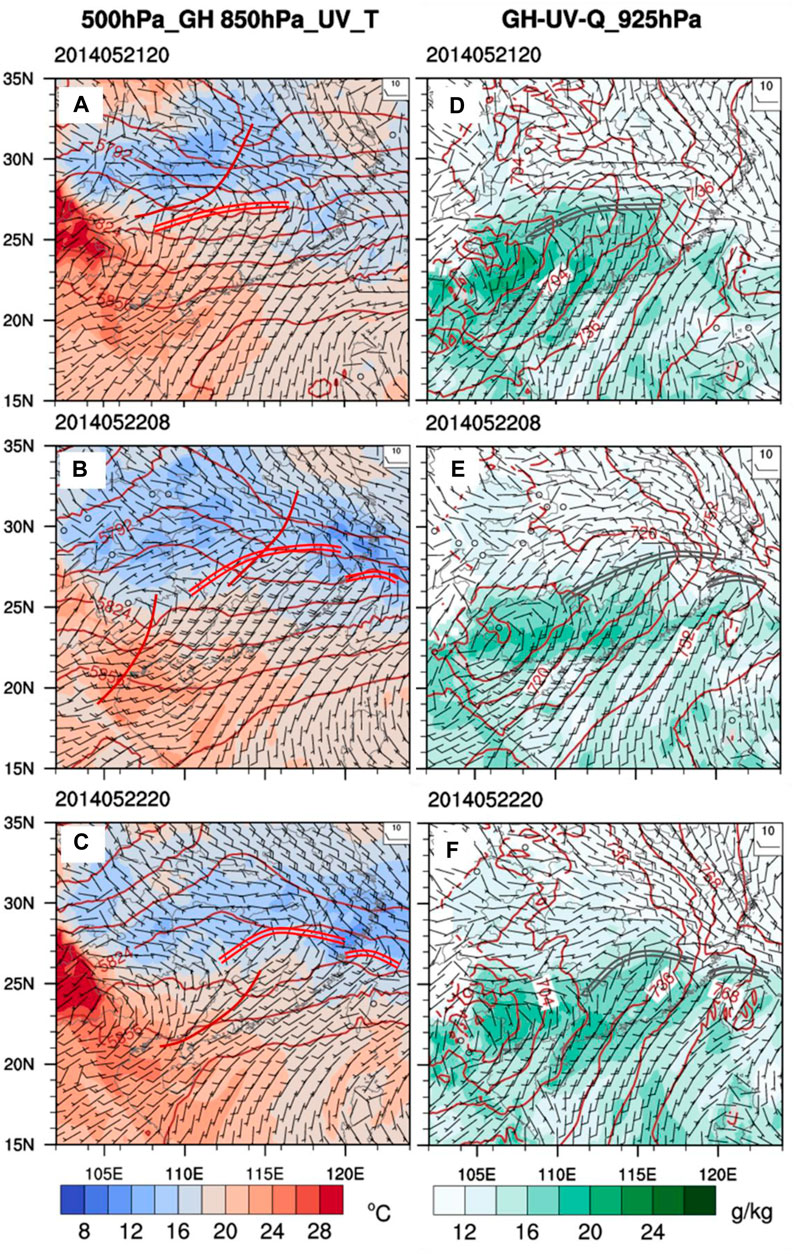
FIGURE 3. Synoptic background on May 21 at 20:00LST, May 22 at 08:00LST, 20:00LST (A–C), Contour lines represent the 500 hPa geopotential height, vectors depict the 850 hPa wind, and color shading represents the temperature. (D–F), Contour lines represent the 925 hPa geopotential height, vectors depict the wind, and color shading represents the specific humidity.
By 08:00LST on May 22 (Figures 3B, E), the 500 hPa westerly trough moved eastward and northward, and the south trough located in the southwestern region, with the lower-level shear moving eastward and northward to the junction of Fujian and Zhejiang at 850 hPa and 925 hPa. The low-level and boundary layer southwestern airflow significantly strengthened, with the jet axis wind speed exceeding 12 m/s. With the strengthening of the southwestern airflow, the high-temperature and high-humidity area moved northward, and the 850 hPa temperature in the shear south region was greater than 18°C, with the specific humidity at 925 hPa reaching above 14 g/kg, providing favorable warm and humid conditions for this precipitation event. Due to the strengthening of the eastward lower-level shear and the southwestern airflow, the precipitation in the northern Fujian rain area intensified from 20:00LST on May 21 to 08:00LST on May 22 (Figures 2A, B), with the heavy rain area located at the intersection of the southwestern airflow, southeastern airflow, and eastward airflow on the east side of the 850 hPa and 925 hPa shear line. While the southern rain area remained in the southwestern airflow on the shear south side, with a small heavy rain area.
During the daytime of the May 22 (from 08:00LST to 20:00LST), the 500 hPa south trough moved significantly eastward and approached Fujian. The southwest airflow on the southern side of the 850 hPa warm shear gradually weakened, and the warm shear at 850 hPa and 925 hPa gradually moved southward. The majority of southern and eastern China turned into a uniform southwest wind (Figures 3B, C, E, F). In addition, two cold air masses approached and converged near the northern coast of Fujian on the north side of the 850 hPa shear, occupying the central and northern parts of Fujian (Figures 3B, C). Due to the weakened convergence of wind speed and cold air, the rainfall on the northern belt decreased. However, the southern part of Fujian was still in the influence zone of the southwest jet stream (Figures 3E, F), and the wind speed of the south wind increased compared to the night. The southeast wind or the east wind in the central and southern parts of Fujian turned into southwest wind. The maximum humidity zone in Guangdong and Guangxi continued to move northward with the strengthening of the south wind, approaching the southern part of Fujian, resulting in good temperature and humidity conditions lasting for a long time in the southern part of Fujian, and heavy rainfall continued on the night of the May 22 with a large accumulated rainfall of 24 h.
The deep red solid line indicates the position of the upper-level trough, while the red double solid line represents the location of 850 hPa shear. The deep gray double solid line represents the location of 925 hPa shear.
3.3 Evolution of the convection system in southern rain belt
The analysis of the synoptic scale systems indicates that the precipitation of the rain belt in the northern part of Fujian Province is mainly concentrated during the initial 12 h of the shear impact period. In contrast, the southern rain belt which is far away from the weather scale system remains in a southwest airflow environment, resulting in heavy rainfall in the warm sector. Therefore, the convective evolution characteristics of the precipitation in the southern region are analyzed using weather radar data from Longyan City in southwestern Fujian and surface observation data from meteorological stations in the Fujian region. This aims to further reveal the triggering and development mechanisms of heavy precipitation in the southern part.
From the hourly precipitation evolution at Shanghang Station (solid green bars in Figure 1F), it can be observed that the main heavy precipitation is concentrated in two time periods: 01:00LST-03:00LST and 17:00LST-20:00LST, corresponding to different characteristics of convective cells (radar composite reflectivity factor greater than 35 dBZ, Figure 4). During the nighttime of the May 22 (01:00LST-03:00LST, Figures 4A–C), the radar echo shows a strong convective cell A moving from the southern part of Wuping County to the northeast direction. It strengthens and then weakens, with a fast movement speed. The strong echo passes through Shanghang Station, resulting in 34 mm of precipitation in 1 hour. In the second phase of strong precipitation from 19the late evening of the May 22 (17:00LST-20:00LST, Figures 4D–F), it is not influenced by a single convective cell but rather by multiple cells moving from the west to the east. They merge and intensify into a mesoscale belt-shaped echo. The echoes within Fujian (northern segment of the belt-shaped echo, Figure 4F) are blocked by terrain and move slowly, maintaining for nearly 3 h near the border area of Wuping County and Shanghang County. After 19:30LST, the echoes rapidly weaken, causing a maximum hourly rainfall of 57 mm during this period. The southern segment of the mesoscale belt-shaped echo is not blocked by terrain and rapidly moves southward, separating from the northern segment (Figures 4D–F, echo belt within Meixian County to Dapu County in Guangdong).
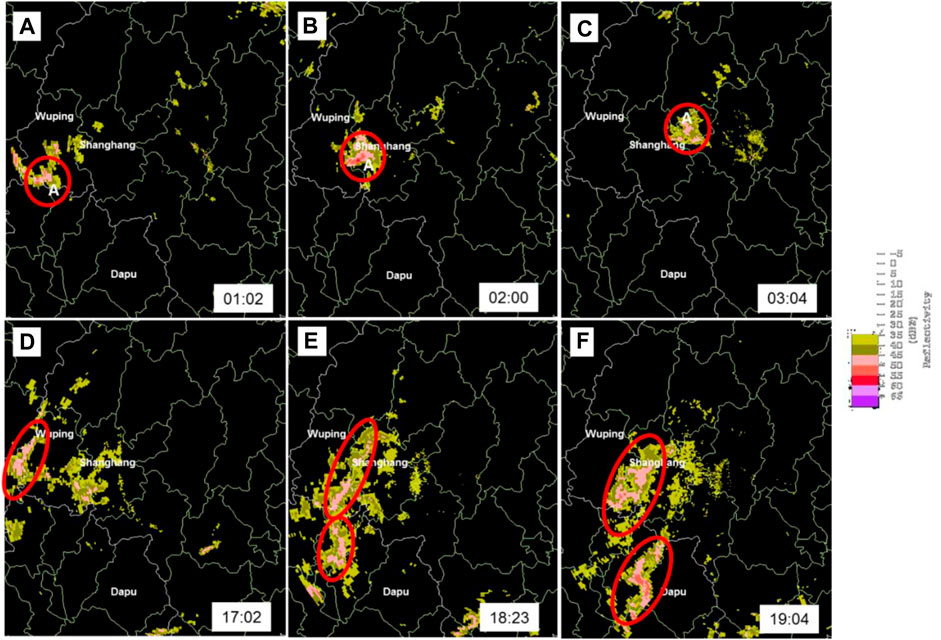
FIGURE 4. Radar composite reflectivity factor at an altitude of 3 km (≥35 dBz) within a 150 km range. The red solid line in the figure highlights areas where the radar composite reflectivity exceeds 35 dBz. The letter “A” in panels (A–C) indicates isolated convective cells. The time is shown in the lower right corner in panels (A–F).
In addition to differences in organizational shape, the vertical structures of the echoes in the two phases also differ. A comparison of the vertical profiles of the echoes from the two phases (diagram omitted) reveals that during the nighttime precipitation phase influenced by strong convective cells, the high-intensity echoes reach higher altitudes, with echoes of 55 dBZ still extending up to 7 km and echoes of 35 dBZ extending to a height of 10 km. The strong centers of the cells tilt with height, exhibiting characteristics of continental precipitation echoes. In contrast, the strongest center of the belt-shaped echo during the daytime, although also reaching 55 dBZ, is at an altitude lower than 5 km, and multiple relatively strong centers are distributed side by side. The strong centers do not show significant tilting with height, indicating features of oceanic precipitation echoes. The precipitation efficiency is high, with a maximum hourly rainfall intensity of 57 mm, surpassing that caused by the strong single cell during the night.
Comparing the synoptic scale system of southern Fujian on the night of the May 21 and the daytime of the May 22, during both periods, the region was influenced by southwest airflow in both the upper and lower levels, creating a warm and moist environment conducive to the occurrence and development of strong convection. During the daytime of the 22, the 500 hPa trough moved eastward from Sichuan Province to the Fujian-Jiangxi border, with significant strengthening of the southwest airflow in the lower levels and boundary layer. The strengthening of the pre-trough convergence lifting mechanism favored the development of multiple convective cells. Whether during the nighttime or daytime phase, the enhanced southwest airflow pushed northward, leading to wind speed and wind direction convergence along the front or left side of the southwest airflow maximum, providing conditions for convective initiation and development. Furthermore, the differences in environmental conditions between the nighttime and daytime phases are also manifested. During the nighttime phase, the lower-level temperature and humidity conditions are better than during the daytime, favoring the development of convective cells to higher altitudes, indicating characteristics of continental-type precipitation echoes. During the daytime phase, as precipitation continues, the temperature is relatively lower than at nighttime, and the development height of convective cells remains in the mid-low levels, resulting in high precipitation efficiency of marine-type precipitation with a lower centroid.
In addition, local wind fields and complex topography also have certain influences on the movement, evolution, and precipitation intensity of convective cells.
The southern mountainous terrain in southwestern Fujian (indicated by the black solid line in Figure 5) obstructs the southward wind, causing it to turn into southeasterly wind (represented by the red arrows in Figure 5), resulting in wind convergence in the area known as the “trumpet topography” formed by the two small mountain ranges (highlighted by the red solid line box in Figure 5). During the two main precipitation periods, convective cells or systems that moved into this region from Jiangxi or Guangdong intensified (as indicated by the enhanced radar echo intensity in Figures 4A, B and 4f-h), leading to increased precipitation (Figures 5B, D). Subsequently, the convection gradually moved eastward over the mountains, and the intensity of the radar echo weakened.
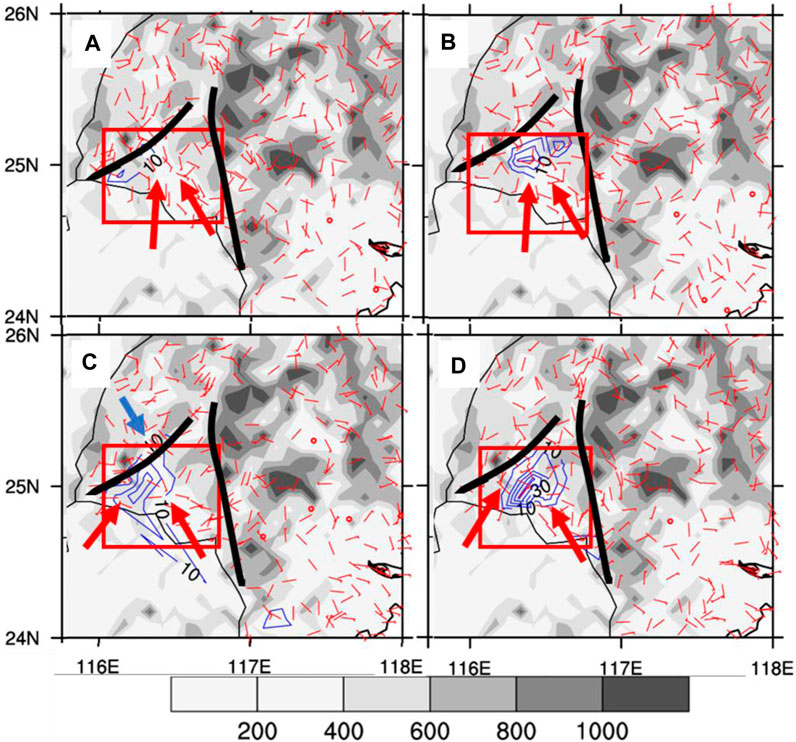
FIGURE 5. Topography (shaded) in the southwestern part of Fujian province, hourly surface wind (vectors), and hourly accumulated rainfall (contour lines). (A–B) depict the wind vectors at 01:00LST and 02:00LST on the May 22, along with the subsequent 1-h accumulated rainfall. (C–D) represent the same for 18:00LST and 19:00LST on the May 22. The black solid line represents the location of mountain ranges, while the red solid line box indicates the “trumpet-shaped” valley area. The arrows indicate the wind direction.
The slight difference between the two periods of precipitation is that during the daytime phase (18:00LST on the May 22), weak northward airflow infiltrated the northwest side of the “trumpet topography” area behind the convective system (represented by the blue arrows in Figure 5), resulting in wind convergence from the northwest, southwest, and southeast directions in the “trumpet topography” area. In contrast, during the nighttime precipitation (02:00LST on the May 21), only wind convergence from the south and southeast was observed in this area. Therefore, the wind convergence at the surface during the daytime phase was stronger and lasted longer than during the nighttime phase, resulting in the sustained development of the convective system and nearly 3 hours of heavy precipitation in that area. It can be observed that the small mountain range in southwestern Fujian forms a “trumpet topography”, which hinders the movement of convective cells or systems and affects the lower-level flow field, thereby enhancing low-level convergence and precipitation. Subsequently, as convection moved out of the “trumpet topography” area with the environmental flow, the convective system weakened as it climbed the mountain slopes, and the precipitation gradually diminished.
This precipitation process was influenced by the interaction of the upper-level trough, low-level shear, and low-level southwest airflow. The heavy precipitation mainly occurred on the south side of the warm-type shear and the warm and moist convective area away from the shear. The warm and moist environment influenced by the southwest airflow in the upper and lower levels is conducive to the occurrence and development of strong convection. During the nighttime of the May 21, the lower-level temperature and humidity conditions were more favorable, but the upper-level forcing was weaker. Due to the northward push of the lower-level southwest jet, resulting in localized convergence, the development height of intense echoes reached 7 km, displaying characteristics of continental-type precipitation echoes. Subsequently, the convective cells slowly moved northeastward along the upper-level southwest airflow and weakened as they reached the Daimao Mountain range. During the daytime of the May 22, the 500 hPa trough approached, resulting in stronger upper-level forcing and enhanced pre-trough convergence lifting mechanism, favorable for the development of multiple convective cells and the formation of organized band-shaped echoes. However, during the daytime phase, as precipitation continued, the temperature was lower than during the nighttime phase, and the intense echoes of the convective system remained below 5 km, exhibiting characteristics of tropical marine-type precipitation echoes with a lower centroid. In addition, the “trumpet topography” in southwestern Fujian obstructs the movement of convective cells or systems and alters the lower-level flow field, contributing to the enhancement of precipitation.
What was the forecast performance of the ECWMF-EPS for this warm sector heavy rain event? What were the main causes of forecast deviation in the model? How predictable was this heavy rain event? The third part will analyze the above questions in detail.
4 The score of model precipitation forecast and the predictability of heavy rain
4.1 Comparison of precipitation forecasts from EM, CTL, and PM
Figure 6 shows the precipitation distribution for 24-h period (from 20:00LST on the May 21 to 20:00LST on the May 22) from three different models: control (CTL), ensemble mean (EM), and probability matching (PM). The forecasts were initialized at 08:00LST on the May 21 (with a forecast lead time of 12 h). The evaluation regions are selected as three areas indicated in Figure 1A, namely, the main precipitation area outlined by the red solid line (Dom1), as well as the NRB and SRB.
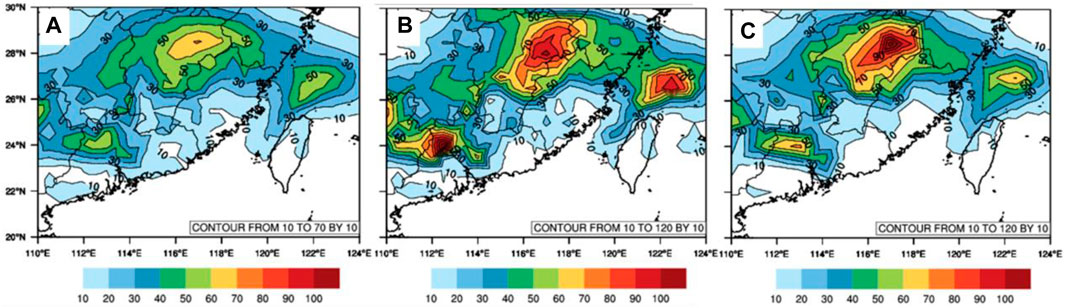
FIGURE 6. Precipitation distribution predicted by EM (A), CTL (B) and PM (C).
For three models, there are two centers of heavy precipitation, located in northern Jiangxi and northwestern Guangdong. Compared to the observed precipitation, the forecasting heavy rainfall locate more westerly for the northern rain belt (NRB) within blue box in Figure 1, while all forecast miss southern rain belt (SRB) within black box in Figure 1. Form Table 1, it is found that all the forecasts engage an negative bias, especially for the southern rain belt (SRB).

TABLE 1. The precipitation bias ratio between EM/CTL/PM forecasts and observation.
To further understand the precipitation forecast capabilities of the models, we compare the precipitation forecast scores of three models (Table 2). For the low threshold of 10mm/24h, the precipitation forecasts from EM have better scores in all three regions compared to CTL and PM. This is mainly due to the larger rain area generated by the arithmetic mean. Since the ensemble members rarely predict rainfall over 20mm/24 h for the southern rain belt, only the results for Dom1 and the northern rain belt are provided for the 50mm/24 h threshold. The EM for Dom1 shows significantly lower scores in POD and FBIAS compared to CTL and PM. In the comparison between CTL and PM, CTL has slightly higher scores than PM. However, for the northern heavy rain belt, PM performs well in accuracy and TS scores but has a lower FBIAS score compared to CTL. This is because PM extracts the most intense precipitation from the ensemble members, but its spatial distribution is referenced to the arithmetic mean, which may deviate from the actual precipitation distribution.
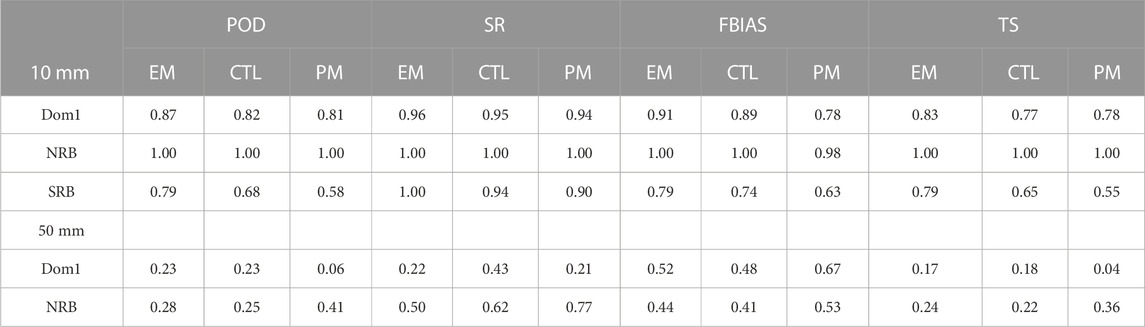
TABLE 2. The precipitation forecast scores of EM\CTL\PM.
Based on the above analysis, it can be concluded that the ECWMF-EPS a certain forecasting capability for precipitation in the northern rain belt, while its forecasting ability for convective precipitation in the warm sector far from the shear is relatively low. Are the reasons for the precipitation forecast deviations in the two rain belts the same? The following sections will further explore the main factors affecting the predictability of heavy rainfall in the southern and northern regions through ensemble forecast sensitivity analysis and comparisons between good and poor member groups.
To increase the number of ensemble members, the ensemble members for three forecast lead times (36 h, 24 h, and 12 h) are combined for sensitivity analysis. In total, 150 members (50 members for each initialization time) are used as the analysis objects to identify the main influencing factors of this heavy precipitation forecast. The ensemble forecast sensitivities of meteorological factors such as geopotential height, wind field, specific humidity, and temperature are calculated, representing the correlation between regional precipitation and previous atmospheric dynamic factors, thermodynamic factors, humidity, and other features. The sensitivities of precipitation in the northern and southern regions are compared to assess the differences.
4.2 Predictability of the northern rainfall
The average precipitation in the northern rain belt is more sensitive to changes in the synoptic-scale system at 20:00LST on the May 21. There are highly sensitive areas in the upstream 500 hPa trough, near the 850 hPa warm shear (Figures 7A, B), and on the southern side of the rain belt with southwest stream (Figures 7C–F). Comparing the levels of the sensitivity regions of wind field, the 850 hPa wind field has a greater impact than the 925 hPa wind field, which is consistent with the findings of Du and Chen (2018) and Liu et al. (2020), indicating that precipitation near the system is more influenced by the low-level jet (850 hPa-700 hPa) associated with the weather system.
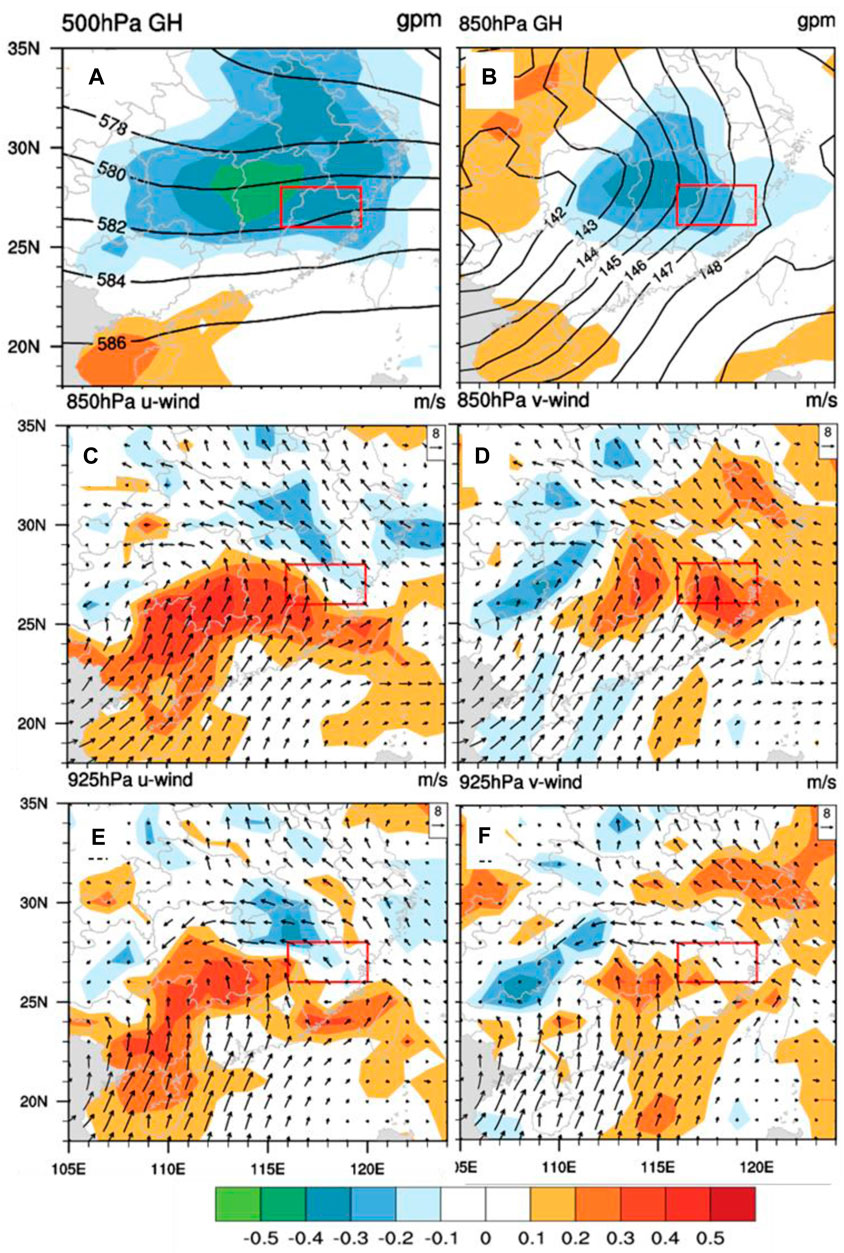
FIGURE 7. Ensemble averages of different meteorological variables at 20:00LST on May 21 (A), 500 hPa geopotential height; (B), 850 hPa geopotential height; (C, D), 850 hPa wind field; (E, F), 925 hPa wind field) and the sensitivity of northern precipitation to the meteorological variables (color shading: (A), 500 hPa geopotential height; (B), 850 hPa geopotential height; (C), 850 hPa zonal wind; (D), 850 hPa meridional wind; (E), 925 hPa zonal wind; (F), 925 hPa meridional wind.
By further comparing the sensitivity of the zonal wind (Figures 7C, E) and zonal wind (Figures 7D, F), it can be observed that for the northern precipitation, the variation of the zonal wind has a greater impact than the variation of the meridional wind. This is different from the conclusions of Du and Chen (2018) and Liu et al. (2020) regarding the heavy rainfall in Guangdong during the pre-flood season in South China. It indicates that the different influence of wind fields on the forecast of heavy rainfall processes in different regions of South China.
In addition to the influence of upper-level troughs, low-level shear systems, and low-level wind fields, the precipitation in the northern region is also associated with the boundary layer humidity and temperature fields in the coastal areas from northern Guangdong to Fujian. This indicates that besides being influenced by synoptic-scale system changes, the boundary layer humidity and temperature in the upstream of the rain area also have a certain impact on precipitation.
To further understand the contribution of various factors to precipitation forecast deviations, a comparative analysis is conducted between the good and poor members. The average precipitation over northern rain belt of every member is used as the selection criterion. Twenty-three members with precipitation greater than 50 mm in the northern rain area are considered as successful forecasters (average rainfall of 59.4 mm), while the last twenty-three members with the lowest precipitation are considered as failed forecasters (average rainfall of 23.8 mm).
The large values of the meteorological element differences between the good and poor member groups are concentrated in the highly sensitive areas of the northern rain area. This indicates that strengthening the analysis and correction of the synoptic system on the highly sensitive areas can improve the forecast performance. In terms of the magnitude of differences, the 500 hPa and 850 hPa geopotential heights, 850 hPa specific humidity, and temperature show relatively small differences between the two member groups. However, there are significant differences in the low-level and boundary layer wind fields (Figure 8). This suggests that the differences between the good and poor members are relatively small for the forecast of upper-level troughs but larger for the forecast of low-level wind fields, which have a greater impact on precipitation forecast. The correlation between the 850 hPa wind and the northern rain belt (Figures 7C, D) are larger than those of the 925 hPa wind fields (Figures 7E, F), and as so the differences (Figure 8). The most difference between the two groups is found in the zonal wind component at 850 hPa (Figure 8A). This indicates that the failure of precipitation forecast in the northern rain area by the poor members is mainly due to the weak forecast of the 850 hPa zonal wind, resulting in a westward bias in the forecasted position of the shear line and a westward bias in the location of heavy precipitation near the shear line.
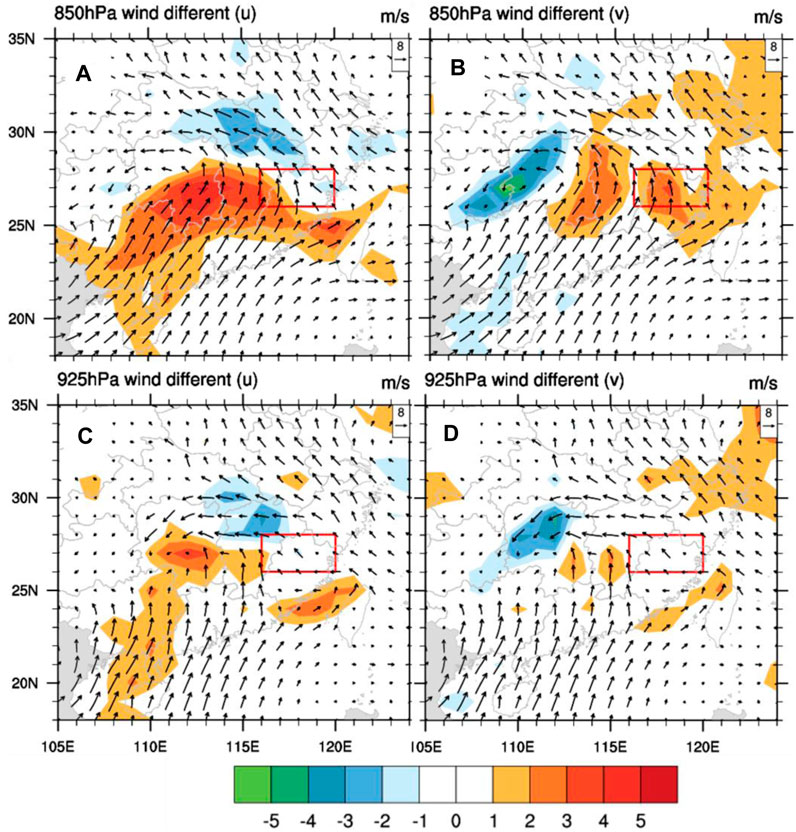
FIGURE 8. Average wind field (vector) of the good members and the forecast differences between good and poor members (color shading) for the northern rain belt. Panels (A, B) depict the average wind and the differences in zonal and meridional winds at 850 hPa. Panels (C, D) display variables mentioned above, but at 925 hPa. The red solid line box indicates the selected area of the northern rain belt.
4.3 Predictability of southern rainfall
The sensitivity analysis of meteorological elements for the precipitation forecast in the southern rain area at 20:00LST on May 21 differs from that of the northern rain area. There are two main characteristics. First, it is more sensitive to the changes in meteorological elements at 925 hPa than at 850 hPa. The key sensitive areas for various meteorological elements have shifted from near the shear line to the coastal areas of Guangdong and Fujian where is on the upstream of the rain area. This indicates that the forecast of rainfall in the warm area far from the shear line should pay more attention to the influence of boundary layer elements in the upstream area of the rain belt. Second, the correlation between the southern rain and the 925 hPa temperature or humidity of the key sensitive areas is higher (Figures 9C, D). This suggests that the influence of boundary layer thermodynamic factors and humidity conditions on the forecast of precipitation in the southern rain area is more significant compared to the northern rain belt.
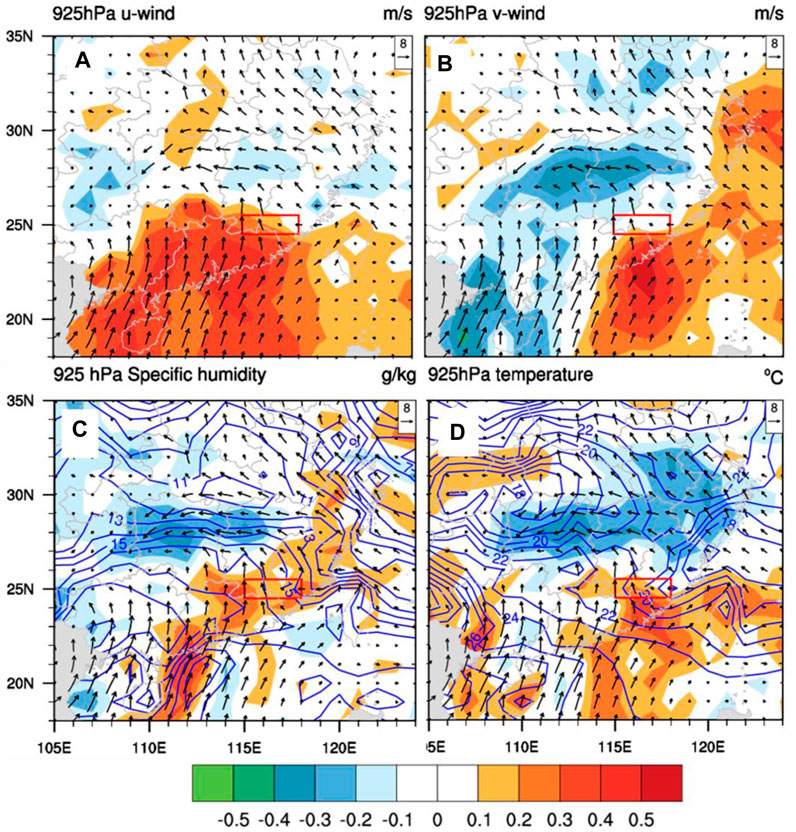
FIGURE 9. Ensemble average of meteorological elements at 20:00LST on May 21 on the 925 hPa (vectors for wind; contour lines for specific humidity and temperature) and sensitivity of southern precipitation to 925 hPa meteorological elements (shading; (A), zonal wind; (B), meridional wind; (C), specific humidity; (D), temperature).
Using the regional average precipitation as the selection criterion while considering the forecast performance of both the northern and southern rain belts, the sorting is based on the average precipitation in the southern rain area. Among the top 20 members ranked by the average precipitation in the southern rain area, members with an average precipitation exceeding 40 mm in the northern rain area (the average precipitation in the northern rain area from 150 members is approximately 39.4 mm) and a similar distribution pattern to the observation are defined as good members. A total of 10 members are selected. From the last 20 members ranked by the average precipitation in the southern rain area, the ensemble members whose average precipitation forecast in the northern rain area ranks among the top 10 are selected as the poor member group. The average precipitation in the northern rain area for the good member group is 51.9mm, and for the southern rain area is 22.8 mm. For the poor member group, the respective average precipitation values are 39.4 mm and 4.9 mm.
The sensitivity of southern rain to the 925 hPa meteorological elements is greater than that of the 850 hPa elements. A comparison of two groups also reveals significant differences in meteorological elements at the 925 hPa level, further indicating that the improvement of precipitation forecast in the southern rain region depends more on the improvement of boundary layer element forecast.
The reason for the forecast deviation in northern rain belt is due to the underestimated zonal wind forecast, which leads to the westward displacement of heavy precipitation areas near the shear line, resulting in significantly reduced precipitation in northern Fujian. In contrast, the differences of the meridional wind, specific humidity, and temperature at the upstream area of the southern rain belt increase compared to the northern rain belt (Figures 10B–D). The analysis in the second part indicates that the convective triggering, development, southwest airflow northward intrusion, water vapor, and thermodynamic conditions are closely related to the two intense precipitation periods in the southern rain region. The changes in differences between the two groups also indicate that the forecast deviation of the position of the shear system is no longer the main reason for the forecast deviation in the southern rain belt. The forecast errors of these meteorological elements on the boundary layer over the upstream area, including the southward wind, temperature, and humidity, are the key factors causing the forecast deviation of the southern rainfall. The southwestern wind, temperature, and humidity on the boundary layer are weaker in the poor member group compared to the good member group, resulting in significantly less precipitation in the southern region of the poor member group. In conclusion, the improvement of the forecast of the northern rain belt considering only this process relies mainly on improving the forecast of the shear system. On the other hand, to improve the forecast skill of the southern rain belt, the focus should be on improving the forecast quality of meteorological elements (especially in the boundary layer) on the south warm side of the shear.
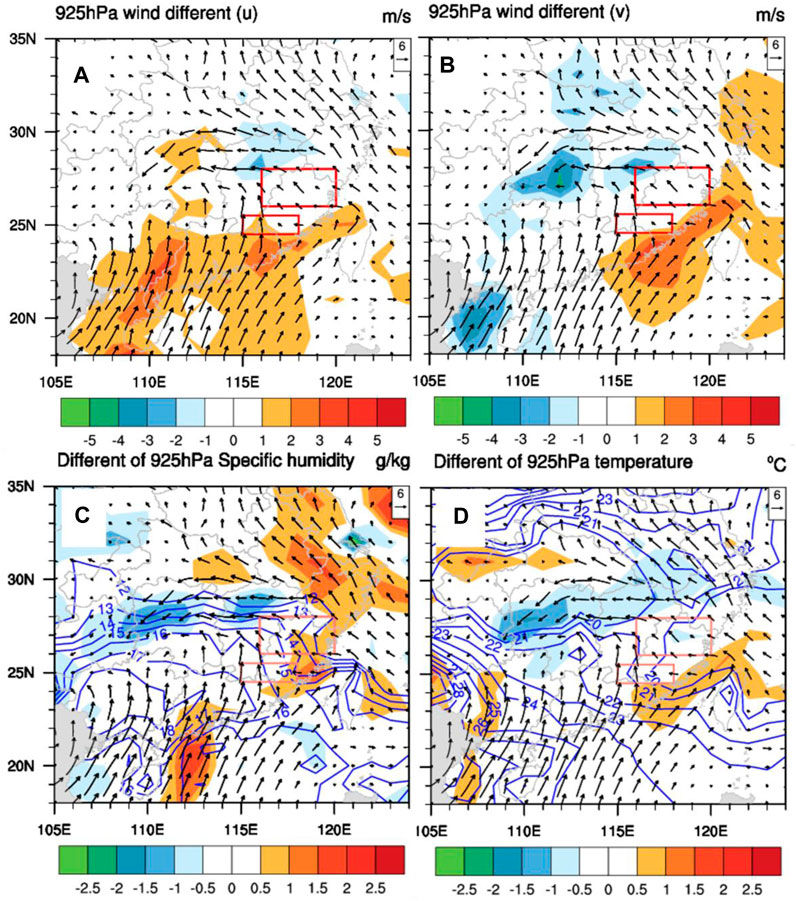
FIGURE 10. Average of meteorological elements at 925 hPa for good ensemble members and forecast differences between good and poor members for the southern rain region. (A) Average wind (vectors) for good members and meridional wind difference between the two groups (shading). (B) Average wind (vectors) for good members and zonal wind difference between the two groups (shading). (C) Average specific humidity (contour lines), wind (vectors) for good members and specific humidity difference between the two groups (shading). (D) Average temperature (contour lines), wind (vectors) for good members and temperature difference between the two groups (shading). Difference value represent the average of good members minus the average of poor members. The red solid line box indicates the selected NRB and SRB areas.
5 Conclusion and discussion
A heavy rainfall event with coexisting rain belts influenced southern China on 22 May 2014, causing severe disasters, and several operational numerical models had significant deviations in the forecast precipitation, almost missing the heavy rain in the southern region of Fujian.
The heavy rainfall mainly occurred near the wind shear-line in the warm air-mass and the warm region on the south side of the shear line. The rain belt near the shear line was extensive, with concentrated rainfall periods but weak rain intensity. The southern rain belt was far from the shear, with a small range, long duration, and large cumulative rainfall. The strengthening and northward intrusion of the southwest airflow in the southern rain region provided conditions for convective triggering and development. Due to differences in humidity and thermodynamic conditions, the nighttime heavy rain in the southern belt was caused by isolated strong convective cells, exhibiting characteristics of continental strong convective precipitation echoes. During the daytime, the upper-level forcing for heavy rain improved, while the lower-level thermodynamic conditions weakened. A band-shaped convective system with multiple convective cells developed below 5km, displaying characteristics of tropical maritime precipitation echoes with high rain efficiency. In addition, the “trumpet-shaped” terrain in southwestern Fujian obstructed the movement of convective cells or convective systems and affected the changes in the lower-level flow field, leading to an increase in precipitation. Using the global ensemble forecast products from the European Centre for Medium-Range Weather Forecasts (ECMWF), a sensitivity analysis was conducted along with a comparison between good and poor ensemble members to investigate the reasons for forecast deviations during the heavy rainfall event. The main conclusions are as follows:
1.Comparison between ensemble precipitation forecast techniques: The EM showed a larger spatial extent, making it the best-performing in terms of low threshold (10mm/24 h) for both widespread precipitation in the northern region and localized precipitation in the southern region. CTL ranked second in performance. However, when evaluating high threshold (50 mm/h) in the northern region, PM had the highest scores for probability of detection (POD), success ratio (SR), and threat score (TS), while the frequency bias (FBIAS) was better for CTL.
2.Sensitivity analysis and comparison between good and poor ensemble members: The northern rainfall was found to be more sensitive to synoptic-scale system variations, with the most sensitive area located near the warm frontal zone. The forecast performance of northern rainfall was highly dependent on the forecast accuracy of the low-level 850 hPa wind, particularly the zonal component. The weak forecasted westward flow at 850 hPa resulted in a westward bias in precipitation, leading to significant underestimation of rainfall intensity in the northern rainfall of Fujian province. Additionally, the westward bias in the forecasted upper-level trough also contributed to the weak precipitation forecast in northern rain belt.
3.The southern rainfall was more sensitive to changes in meteorological variables at 925 hPa on the southern edge of the rainband, with the impact of boundary layer thermodynamic factors and humidity conditions being more pronounced compared to the northern rainband. The main reason for the significant underestimation of precipitation in the southern rainband was the weak forecasted southwesterly flow, lower temperatures, and lower humidity in the inflow region upstream of the rainband (specifically the northeastern part of Guangdong province and the coastal area along the Fujian-Guangdong border).
This study objectively and quantitatively revealed the correlation between the boundary layer and lower-level southwest flow and heavy rainfall in the coastal areas of Guangdong to Fujian. It also highlighted the impact of these factors on the forecast of heavy rainfall. Further research is needed to explore the combined effects of low-level jet streams, coastal terrain, and the Taiwan Strait on heavy rainfall in Fujian. Improving the initial conditions of forecasts, enhancing the performance of numerical models, and developing ensemble forecast perturbation methods for atmospheric boundary layer dynamics and thermodynamics in the central-northern coastal areas of Guangdong to the Taiwan Strait will contribute to improving the probabilistic forecasting of heavy rainfall in Fujian.
Data availability statement
The original contributions presented in the study are included in the article/Supplementary material, further inquiries can be directed to the corresponding author.
Author contributions
QL: Writing–original draft. WZ: Conceptualization, Supervision, Writing–review and editing, Guide the techniques of the whole article. JF: Conceptualization, Writing–review and editing, Help deal with data.
Funding
This work was jointly supported by the Natural Science Foundation of Fujian Province (2020J1099), the Major scientific and technological special project of Fujian Key Laboratory of Severe Weather (2022BY02).
Acknowledgments
We are grateful to the comments from the three reviewers that have greatly improved the quality of the paper.
Conflict of interest
The authors declare that the research was conducted in the absence of any commercial or financial relationships that could be construed as a potential conflict of interest.
Publisher’s note
All claims expressed in this article are solely those of the authors and do not necessarily represent those of their affiliated organizations, or those of the publisher, the editors and the reviewers. Any product that may be evaluated in this article, or claim that may be made by its manufacturer, is not guaranteed or endorsed by the publisher.
References
Brown, B. R., and Hakim, G. J. (2015). Sensitivity of intensifying Atlantic hurricanes to vortex structure. Q. J. R. Meteorological Soc. 141 (692), 2538–2551. doi:10.1002/qj.2540
Chang, E. K., Zheng, M., and Raeder, K. (2013). Medium-range ensemble sensitivity analysis of two extreme Pacific extratropical cyclones. Mon. Weather Rev. 141 (1), 211–231. doi:10.1175/mwr-d-11-00304.1
Chen, J., Chen, D. H., and Yan, H. (2002). A brief review on the development of ensemble prediction system. J. Appl. Meteor Sci. 13 (4), 497–507. (in Chinese). doi:10.3969/j.issn.1001-7313.2002.04.013
Chen, D., Pan, N., Zhang, L., Pu, Y., Yu, Y., Zhao, P., et al. (2018). Evaluation of the Microhaplotypes panel for DNA mixture analyses. Disasters 37 (2), 149–155. (in Chinese). doi:10.1016/j.fsigen.2018.05.003
Chen, T., Chen, B., Yu, C., Zhang, F. H., and Chen, Y. (2020). Analysis of multiscale features and ensemble forecast sensitivity for MCSs in front-zone and warm sector during pre-summer rainy season in SouthSouth China. Meteor Mon. 46 (9), 1129–1142. (in Chinese).
Ding, J. C. (1995). Rcview of weather prediction verifying techniques. Trans. Atmos. Sci. 18 (1), 143–150. (in Chinese).
Du, Y., and Chen, G. (2018). Heavy rainfall associated with double low-level jets over southern China. Part I: ensemble-based analysis. Mon. Weather Rev. 146 (11), 3827–3844. doi:10.1175/mwr-d-18-0101.1
Du, J., and Li, J. (2014). Application of ensemble methodology to heavy-rain prediction and research. Adv. Meteor Sci. Technol. 4 (5), 6–20. (in Chinese). doi:10.3969/j.issn.2095-1973.2014.05.001
Du, Y., Chen, Y. L., and Zhang, Q. H. (2015). Numerical simulations of the boundary layer jet off the southeastern coast of China. Mon. Wea. Rev. 143, 1212–1231. doi:10.1175/mwr-d-14-00348.1
Ebert, E. (2001). Ability of a poor man’s ensemble to predict the probability and distribution of precipitation. Mon. Weather Rev. 129, 2461–2480. doi:10.1175/1520-0493(2001)129<2461:aoapms>2.0.co;2
Greybush, S. J., Saslo, S., and Grumm, R. (2017). Assessing the ensemble predictability of precipitation forecasts for the January 2015 and 2016 east coast winter storms. Weather Forecast. 32, 1057–1078. doi:10.1175/waf-d-16-0153.1
Hill, A. J., Weiss, C. C., and Ancell, B. C. (2016). Ensemble sensitivity analysis for mesoscale forecasts of dryline convection initiation. Mon. Weather Rev. 144 (11), 4161–4182. doi:10.1175/mwr-d-15-0338.1
Huang, L., and Luo, Y. (2017). Evaluation of quantitative precipitation forecasts by TIGGE ensembles for south China during the presummer rainy season. J. Geophys. Res. Atmos. 122, 8494–8516. doi:10.1002/2017jd026512
Keller, J. H. (2017). Amplification of the downstream wave train during extratropical transition: sensitivity studies. Mon. Weather Rev. 145 (4), 1529–1548. doi:10.1175/mwr-d-16-0193.1
Limpert, G. L., and Houston, A. L. (2018). Ensemble sensitivity analysis for targeted observations of supercell thunderstorms. Mon. Weather Rev. 146, 1705–1721. doi:10.1175/mwr-d-17-0029.1
Lin, Y., Lin, Q., and Liu, A. M. (2015). The analysis and study of the influence of the Taiwan Strait terrain on sudden typhoon rainstorm in fujian province. J. FuJian Meteorol. (1), 1–6. (in Chinese).
Liu, X., Luo, Y., Huang, L., Zhang, D-L., and Guan, Z. (2020). Roles of double low-level jets in the generation of coexisting inland and coastal heavy rainfall over south China during the presummer rainy season. J. Geophys. Res. Atmos. 125, e2020JD032890. doi:10.1029/2020jd032890
Luo, Y., Zhao, W., and Zhai, J. Q. (2009). Dichotomous weather forecasts score research and a new measure of score. J. Appl. Meteor Sci. 20 (2), 129–133. (in Chinese). doi:10.11898/1001-7313.20090201
Lynch, S. L., and Schumacher, R. S. (2014). Ensemble-based analysis of the May 2010 extreme rainfall in Tennessee and Kentucky. Mon. Weather Rev. 142 (1), 222–239. doi:10.1175/mwr-d-13-00020.1
Ma, X. L., Yu, Y. M., and Chen, D. H. (2015). The present situation and prospects of the adaptive observation. Acta Meteorol. Sin. 73 (2), 221–235. (in Chinese). doi:10.11676/qxxb2015.022
Majumdar, S. J. (2016). A review of targeted observations. Bull. Am. Meteorological Soc. 97 (12), 2287–2303. doi:10.1175/bams-d-14-00259.1
Quandt, L., Keller, J. H., Martius, O., Pinto, J. G., and Jones, S. C. (2019). Ensemble sensitivity analysis of the blocking system over Russia in summer 2010. Mon. Weather Rev. 147 (2), 657–675. doi:10.1175/mwr-d-18-0252.1
Torn, R. D., and Hakim, G. J. (2008). Ensemble-based sensitivity analysis. Mon. Weather Rev. 136, 663–677. doi:10.1175/2007mwr2132.1
Torn, R. D. (2010). Ensemble-based sensitivity analysis applied to African easterly waves. Weather Forecast. 25 (1), 61–78. doi:10.1175/2009waf2222255.1
Wang, Y., He, L. F., and Dai, K. (2017). An ensemble sensitivity analysis of a heavy rainfall over Sichuan Basin under interaction between plateau vortex and southwest vortex. Plateau Meteorol. 36 (5), 1245–1256. (in Chinese). doi:10.7522/j.issn.1000-0534.2016.00102
Wu, B. Y. (1982). Climatic characteristics of the Taiwan strait. J. Oceanogr. Taiwan Strait 1 (2), 14–18. (in Chinese).
Xiao, L. S., Zhang, H. L., Zhang, X. B., Feng, L., Chen, Z. G., and Dai, G. F. (2021). Predictability analysis of the extremely heavy rainfall in the Pearl River Delta on 22 May 2020 using CMA-TRAMS-based ensemble prediction system. Acta Meteorol. Sin. 79 (6), 956–976. (in Chinese). doi:10.11676/qxxb2021.058
Xie, B., Zhang, F., Zhang, Q., Poterjoy, J., and Weng, Y. (2013). Observing strategy and observation targeting for tropical cyclones using ensemble-based sensitivity analysis and data assimilation. Mon. Weather Rev. 141 (5), 1437–1453. doi:10.1175/mwr-d-12-00188.1
Yu, H., and Meng, Z. (2016). Key synoptic-scale features influencing the highimpact heavy rainfall in Beijing, China, on 21 July 2012. Tellus A Dyn. Meteorol. Oceanogr. 68 (1), 31045. doi:10.3402/tellusa.v68.31045
Zhang, W., Chen, S. X., and Chen, D. H. (2015). Analysis of climatological characteristics of sea land breeze along western coast regions of Taiwan Strait and its large-scale circulation. Mar. Forecasts 32 (6), 58–65. (in Chinese). doi:10.11737/j.issn.1003-0239.2015.06.008
Keywords: torrential rain in warm sector, ensemble forecast, ensemble sensitivity analysis, lowlevel jet, ECMWF-EPS
Citation: Lai Q, Zhang W and Feng J (2023) On the predictability of a heavy rainfall event with dual rainbands. Front. Earth Sci. 11:1253947. doi: 10.3389/feart.2023.1253947
Received: 06 July 2023; Accepted: 31 August 2023;
Published: 08 September 2023.
Edited by:
Youcun Qi, Chinese Academy of Sciences (CAS), ChinaReviewed by:
Stefano Federico, National Research Council (CNR), ItalyHaikun Zhao, Nanjing University of Information Science and Technology, China
Copyright © 2023 Lai, Zhang and Feng. This is an open-access article distributed under the terms of the Creative Commons Attribution License (CC BY). The use, distribution or reproduction in other forums is permitted, provided the original author(s) and the copyright owner(s) are credited and that the original publication in this journal is cited, in accordance with accepted academic practice. No use, distribution or reproduction is permitted which does not comply with these terms.
*Correspondence: Wei Zhang, c2lfc3VAMTYzLmNvbQ==