Abstract
As a cascading disaster, the surge caused by the reservoir bank landslide seriously affects the stability of the reservoir bank and the dam body. In addition, large-scale hydropower projects are usually built in mountain and canyon areas with active geological structure movement, which provides rich material sources for the occurrence of landslides, so it is of great significance to monitor the deformation in the landslide source area of the reservoir. As science and technology have been leaping forward, a wide variety of high and novel technologies have been proposed, which can be adopted to monitor landslide deformation. It is noteworthy that InSAR is capable of monitoring target monitoring areas all time under all weathers without the need to install any equipment. In this study, the time series deformation of the main landslide source area of the Baihetan reservoir after water storage was determined based on the time series InSAR method. The average annual deformation rate of the landslide source area of the Baihetan reservoir from April 2021 to January 2023 was determined by combining the Sentinel-1 SAR data of 55 ascending tracks and 46 descending tracks. Moreover, the vegetation cover variations from April 2021 to January 2023 in the study area were determined by combining the remote sensing data of Landsat8-9. A total of four typical source areas were selected based on the field investigation to analyze the deformation monitoring results and the vegetation cover variations. As indicated by the results: 1) After water storage, the slope deformation in all source areas was larger in the short term, and the deformation rate of the lower part turned out to be more significant, and the deformation rate exceeded 334.583 mm/year. 2) On the steep slope, the effect of different types of vegetation on restraining deformation was different. The optimal effect was reported in shrubs, followed by grasslands, and the worst effect was reported in woodlands. The results of this study can provide scientific support for the prevention and control of regional geological disasters.
1 Introduction
In general, large-scale hydropower projects are built in high mountain canyons with developed water systems, which are affected by significant geological tectonic activities. The topography varies violently, and the damage degree of rock mass turns out to be serious (Guo, 2022; Yang et al., 2023a; Yang et al., 2023b), such that abundant material sources are provided for the occurrence of landslide. Moreover, the deformation of the reservoir bank and slope instability will easily occur under the large rise and fall of water level arising from reservoir water regulation (Jiang et al., 2019), as well as the occasional rainstorm (Liu et al., 2023; Yang et al., 2023c), earthquake (Ahmed et al., 2023), and human engineering activities (Hu, 2017). As a cascading disaster, the impact of landslides may be not limited to the landslide while resulting in more serious secondary disasters and further triggering greater losses (Zhu et al., 2021), especially in the reservoir area. When considerable landslide slides into the reservoir, the surge generated by it seriously affects the stability of the bank slope and the dam (Dong et al., 2021). In 1963, a large landslide on the bank of the Vajont dam in Italy caused a surge that destroyed surrounding buildings, flooded the dam, and killed over 2,000 people downstream (Bosa and Petti, 2011). In 2003, the Qianjiangping landslide on the bank of the Three Gorges Reservoir in China created a huge surge and blocked the river to form a barrier lake, killing 14 people and leaving 10 missing (Wen et al., 2008). Accordingly, researching the deformation monitoring of the reservoir landslide source area takes on critical significance.
Deformation monitoring has been confirmed as the most direct and effective method in the process of identifying and quantitatively monitoring landslide disasters (Qiu et al., 2022). It is capable of evaluating the stability of the slope by monitoring the deformation of the slope and indicating its motion state (Li et al., 2021). As revealed by this method, the monitoring methods primarily cover GPS, distributed optical fiber sensing technology, InSAR, and so forth. The GPS monitoring method is capable of providing high-accuracy 3D deformation data for users, whereas the landslide should be investigated in detail, and the monitoring network should be arranged following its integral or local deformation characteristics. Moreover, the GPS monitoring signal exhibits low anti-interference ability in complex environments with high densities, such that the measuring station should be opened (Ren et al., 2020; Wang et al., 2023). The distributed optical fiber sensing technology is capable of achieving real-time automatic remote monitoring, and it exhibits several advantages (e.g., corrosion resistance, electromagnetic resistance, high sensitivity, and high precision). However, it is difficult to ensure that the optical fiber can run normally in the laying and working processes for a long time since it can be easily damaged by shear (Cheng et al., 2022). Compared with the two previously proposed monitoring methods, the InSAR monitoring method can be adopted to conduct all-weather and all-time monitoring of the surface without the need to install any equipment in the target monitoring area, the monitoring coverage is wide, and the monitoring accuracy is as high as the centimeter level to the millimeter scale (Karaca et al., 2021; Yang et al., 2022a; Wang et al., 2022; Ma et al., 2023).
The multitemporal InSAR technology conforms to the conventional D-InSAR technology. The conventional D-InSAR technique refers to a technique employing two SAR images in an identical area at different times to examine ground deformation. However, due to the effect of atmospheric, topographic, temporal, and spatial decorrelation, deformation monitoring achieves a highly limited accuracy when the conventional D-InSAR technology is adopted for long-term micro-deformation monitoring. Thus, the conventional D-InSAR technology can only achieve the deformation monitoring capability of the centimeter scale (Yun et al., 2020). To monitor the slow deformation landslide for a long time and increase the accuracy of deformation monitoring to the millimeter scale, SBAS-InSAR technology has been developed using multiple SAR images in the identical area to acquire interference image pairs with short space-time baselines and then generate interference maps (Emil et al., 2021; Dong et al., 2022). SBAS-InSAR technology was proposed by Berardino et al. (Berardino et al., 2002) and has been investigated for over two decades. The main application of SBAS-InSAR technology is long-term monitoring of slow surface deformation, but if this technology is applied in alpine and canyon areas, geometric distortion will be caused by terrain (Dai et al., 2020). Therefore, it is often necessary to employ different SAR data or combine other techniques to reduce the impact of geometric distortion on the results. SBAS-InSAR technology has been employed in several studies to monitor landslides in the Baihetan reservoir area. Before the reservoir was impounded, Dai, K.R. et al. (Dai et al., 2022) combined the multitemporal InSAR technology and UAV aerial survey to identify hidden trouble points in the reservoir area. Dun, J.W. et al. (Dun et al., 2023) identified active landslides on both banks of the river from Hulukou to Xiangbi Ling section in the Baihetan reservoir area before water storage using the SBAS-InSAR technology and SAR data. Based on the SBAS-InSAR technology, Yang, Z.R. et al. (Yang et al., 2022b) analyzed the effect of water storage factors on the deformation trend of potential landslide in the Baihetan reservoir area using the field survey of unmanned aerial vehicles and the Sentinel-1 SAR data set of ascending and descending tracks.
As the second largest hydropower station in China (Dai et al., 2023), the Baihetan Hydropower Station is located at the junction of Ningnan County in Sichuan Province and Qiaojia County in Yunnan Province. It is situated in the Hengduan Mountain area on the eastern edge of the Qinghai-Tibet Plateau. Since the Baihetan Hydropower Station exhibits a complex geological structure and strong tectonic movement, the rock mass in this area is fractured, the soil is loose (Yang et al., 2023d; Zhao et al., 2023), and the geological disasters occur frequently in this area (Li et al., 2020). The hydropower station will store water in April 2021, and the water level ranges from 765 to 825 m. The stability of the bank slope is destroyed under the effect of large periodic fluctuations of reservoir water and rainfall, such that the safety of the reservoir can be seriously affected (Yang, 2021). Accordingly, based on the SBAS-InSAR technology, the deformation monitoring was performed in the landslide source area of the Baihetan reservoir using Sentinel-1A SAR data of ascending and descending tracks from April 2021 to January 2023. The temporal information of vegetation coverage analyzed by Landsat8-9 remote sensing data and rainfall in the corresponding period was concluded to analyze the deformation of the research area, and technical support can be provided for the relevant departments for disaster prevention and mitigation work.
2 Overview of the study area
In this study, the Baihetan hydropower station reservoir area is selected as the research area. The entire study area exhibits a length of nearly 89.84 km, a width of about 38.30km, and a total area of approximately 3440.87 km2 (Figure 1). The area is located in the southeast margin of the Qinghai-Tibet Plateau, belonging to the mountain canyon landform. The terrain of the area is high in the northwest and low in the southeast, with the developing geological fault and strong tectonic movement. Due to the effect of climate and topography, this area pertains to a typical dry and hot valley. Furthermore, rainfall is largely concentrated in June-October, which is small in the valley and heavy on both sides of the river, thus triggering considerable hidden hazards (e.g., landslides and other geological hazards in this area) (Zhou, 2018; Dun, 2021).
FIGURE 1

Location of the study area.
3 Technical principles
3.1 SBAS-InSAR technology
The basic principle of the SBAS-InSAR technique refers to the generation of high coherence differential interferogram by the image of short space-time baselines. Following the relation between the phase and observation time of highly coherent pixels, the deformation rate of the ground surface and its time series in the study area were determined through singular value decomposition (SVD) (Guo et al., 2019; Feng et al., 2020). The above-mentioned method is capable of reducing the incoherence phenomenon arising from long spatial and temporal baselines to a certain extent and increasing the time sampling rate of deformation monitoring (Bai, 2020). The basic process is expressed as follows:
It was assumed that SAR images in the study area were acquired in chronological order , one image was selected as the main image, and the other SAR images were registered to this image. The interference pair were combined by an appropriate space-time baseline threshold to generate a amplitude differential interferogram, where satisfies the following conditions:
For the jth differential interferogram generated from the SAR image generated from the time of the image and the main image (), the interference phase of the pixels having the azimuth coordinate x and the distance coordinate r can be written as:
Where ; denotes radar wavelength; and represent the cumulated variables of the radar line-of-sight direction relative to at times and ; expresses the residual terrain phase in the differential interferogram; represents atmospheric delay phase; denotes decoherence noise.
When the residual terrain phase, atmospheric delay phase, and noise phase were ignored, Eq. 2 was simplified as:
To obtain a settlement sequence of physical significance, the phase in Eq. 3 is expressed as the product of the average phase velocity and time between the two acquisition times:
The phase value of the jth interferogram is written as:where the integral of the velocity of the respective period on the time interval of the primary and the slave images, which is written in a matrix form:
Equation 6 is a matrix. When the matrix is a full rank or rank deficit, the minimum norm solution of velocity vector can be determined using the SVD method, and the corresponding cumulative topographic variables can be obtained following the integral of velocity in the respective period (Mehrabi, 2020; Xu et al., 2021; Gong et al., 2022).
3.2 Calculation of vegetation coverage
In general, vegetation coverage is obtained by remote sensing or field investigation. Despite the accuracy of the field survey, it is time-consuming and laborious, and it does not apply to obtaining vegetation coverage on a large scale. In contrast, remote sensing data exhibit high resolution and wide range, applying to the collection of a wide range of vegetation cover information. Besides, it can be employed for large-scale environmental monitoring and assessment. The estimation of vegetation coverage by remote sensing was primarily based on the normalized vegetation index (NDVI) using the pixel binary model. The vegetation index was obtained by processing multi-spectral image data obtained by the remote sensing sensor. Its basic principle is to indicate the growth and coverage of vegetation by the changes in plant chlorophyll absorption and reflectance spectrum. To be specific, NDVI has been confirmed as the most common and classic vegetation index in the remote sensing estimation method of vegetation coverage, which is largely calculated by the ratio of the infrared reflection band to the visible band, as expressed by Equation 12. The basic principles of the pixel binary model are illustrated as follows:
Assuming that all the information of the remote sensing sensor can fall into two parts, i.e., the vegetation information and the vegetation cover information . All information can be expressed as:
It was assumed that the information of vegetation in the pixel (i.e., vegetation coverage) is expressed as , such that the information of no vegetation coverage can be expressed as . If represents the maximum vegetation cover area in the pixel, the information presented by the hybrid pixel vegetation section may be expressed as:
Likewise, if represents the maximum non-vegetated area in the pixel, the remote sensing information determined from the non-vegetated part of the hybrid pixel is expressed as:
Vegetation coverage can be obtained according to the above equation:
Substitute to: Value Calculation:where denotes the reflectance in the near-infrared band; represents the reflectance in the infrared band (Chen and Lin, 2019; Feng et al., 2023).
4 Experimental data and processing
4.1 Data sources
To conduct a more precise analysis of the deformation trends in the study area after impoundment, we gathered Single Look Complex (SLC) images from the European Space Agency (ESA) spanning from April 2021 to January 2023. The data set includes 55 ascending track and 46 descending track data, as indicated in Table 1. The entire data set covers the time period from the onset of water storage at Baihetan Hydropower Station (April 2021) to the beginning of the study (January 2023). It provides us with the most comprehensive deformation data to enhance the accuracy of InSAR results. To further improve the orbit accuracy of the satellite and remove the effect of the topographic phase, the corresponding Copernicus Sentinel Precise Orbit Ephemerides Data (POD) issued by ESA and the Digital Elevation Model (DEM) with the spatial resolution of ALOS World 3D-30 m issued by Japan Aerospace Exploration Agency (JAXA) were introduced.
TABLE 1
| Orbital direction | Imaging mode | Polarization mode | Band | Wavelength/cm | Revisiting Period/d | Time span |
|---|---|---|---|---|---|---|
| ascending | IW | VV | C | 5.6 | 12 | 2021.04.09-2023.01.29 |
| descending | IW | VV | C | 5.6 | 12 | 2021.04.11-2023.01.07 |
Sentinel-1A data parameters.
Optical image data are obtained from the United States Geological Survey (USGS) free download of 54 views of Landsat 8 and 34 views of Landsat 9. To be specific, Landsat 8 and Landsat 9 achieved an 8-day offset. The data parameters are shown in Table 2.
TABLE 2
| Data source | Launch time | Path and row number | Revisiting Period/d | Time span |
|---|---|---|---|---|
| Landsat 8 | 2013.02.11 | 129/40 129/41 | 16 | 2021.04.10-2023.01.26 |
| Landsat 9 | 2021.09.27 | 129/40 129/41 | 16 | 2021.11.18-2023.01.18 |
Landsat8-9 data parameters.
4.2 Data processing under SBAS-InSAR technology
The image data was processed by SBAS-InSAR technology, the data was imported and cut, the maximum percentage of critical baseline was 5%, and the maximum time baseline was 36 days, and the interference image pairs of ascending track 156 pairs and descending track 122 pairs co-existed. To suppress the speckle noise, the interference workflow was processed by the Minimum Cost Flow deconvolution method and the Goldstein filtering method. After adjusting and eliminating the unideal image pair, the interference graph of the research area was generated, and some ideal interference graph is shown in Figure 2.
FIGURE 2

Interferogram of study area. (A), (B), and (C) are interferograms generated using the ascending track data, and their time spans are 2021.04.21-2021.04.09, 2022.02.15-2022.02.03, and 2022.12.24-2022.11.18, respectively. (D), (E), and (F) are interferograms generated using the descending track data, and their time spans are 2021.04.11-2021.04.23, 2022.02.15-2022.02.03, and 2022.12.24-2022.11.18, respectively.
The orbit was refined and re-flattened, and the deformation rate and residual topography were estimated through the first inversion. Based on the second inversion, the atmospheric phase was estimated and removed to obtain the final displacement result in a purer time series. Finally, after the sequence information was geocoded, the result of the deformation of the ascending and descending tracks in the LOS direction from 9 April 2021 to 29 January 2023 in the study area was obtained (Figure 3).
FIGURE 3

Results of LOS direction deformation rate in study area. (A) InSAR deformation rate map with ascending Sentinel-1A images from April 2021 to January 2023. (B) InSAR deformation rate map with descending Sentinel-1A images from April 2021 to January 2023.
Compared with Figures 3A,B, the deformation information detected by the ascending track data was more abundant and largely concentrated on the east bank of Jinsha River. Its whole deformation rate ranged from −176.987 mm/year to 157.173 mm/year. However, the deformation information detected by the descending track data was less, and the whole deformation rate ranged from −141.468 mm/year to 116.424 mm/year. Since the satellite flies from south to north while collecting the ascending track data, and the opposite is true when collecting the descending track data, the radar line of sight of both was located on the right side, and the research area was located in the high mountain gorge. The high mountain position on both sides of the satellite resulted in serious geometric distortion phenomena (e.g., shadow, overlay and perspective contraction) in the deformation monitoring process of the ground surface using InSAR technology. Therefore, it is necessary to combine the ascending and descending data for analysis in a complementary manner.
4.3 Data processing of vegetation coverage
The data downloaded in this study were corrected by the atmosphere and then calibrated through radiation. The image can be directly mosaic and cut, and NDVI and FVC were calculated. Because the study area is often obscured by clouds, some data that are too heavily obscured by clouds to be useable have been eliminated. The vegetation coverage of the study area is shown in Figure 4. Following the actual situation in the study area, the vegetation coverage in the area fell into four grades, i.e., low vegetation coverage (45%), medium vegetation coverage (45%–60%), medium and high vegetation coverage (60%–75%), as well as high vegetation coverage (75%) (Huang et al., 2023).
FIGURE 4

Vegetation coverage map of study area. (A) is the vegetation coverage in 2021.12.14, and the data is from Landsat 9. (B) is the vegetation coverage in 2023.01.10, and the data is from Landsat 8.
5 Results and analysis
5.1 Study object selection
The tunnel slopes located in four typical source areas were selected as the research objects, i.e., Sunjialiang Tunnel Slope, Jiefangcun Tunnel Slope, Yingdiliangzi Tunnel Slope, and Qiluogou Tunnel Slope (Figure 5) through field investigation following the actual situation of the reservoir area of Baihetan Hydropower Station.
FIGURE 5
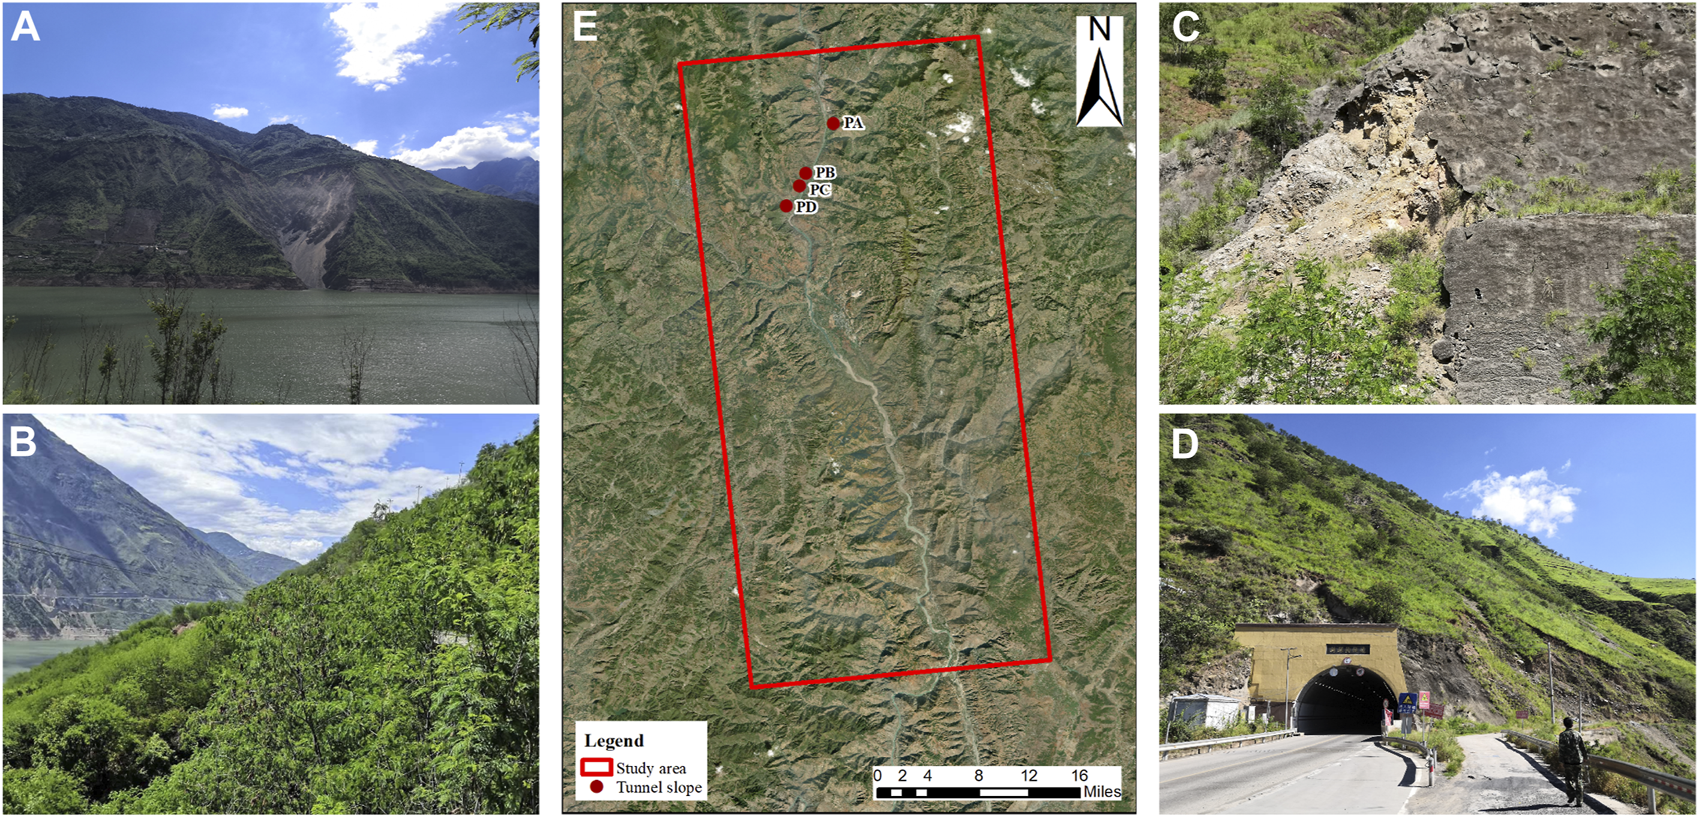
Location of typical source areas and results of field investigation. (A) is the field investigation of Sunjialiang Tunnel slope. (B) is the field investigation of Jiefangcun Tunnel slope. (C) is the field investigation of Yingdiliangzi Tunnel slope. (D) is the field investigation of Qiluogou Tunnel slope. In (E), PA is the location of Sunjialiang tunnel slope; PB is the location of Jiefangcun tunnel slope; PC is the location of Yingdiliangzi tunnel slope; PD is the location of Qiluogou tunnel slope.
Except Qiluogou Tunnel slope is composed of gravel soil landslide, other research objects are soil landslide, and their vegetation conditions are also different. Table 3 lists the basic information of the research objects:
TABLE 3
| Number | Study object | Overview of surface | Substrate vegetation |
|---|---|---|---|
| PA | Sunjialiang Tunnel Slope | soil | sparse grass |
| PB | Jiefangcun Tunnel Slope | soil | wood |
| PC | Yingdiliangzi Tunnel Slope | soil | shrub |
| PD | Qiluogou Tunnel Slope | gravel soil | grass |
Basic information of study objects.
When the satellite was collecting data, if the satellite’s local incident angle was smaller than the residual angle of the slope angle, the resolution was further improved, and deformation monitoring was optimal in this area (Zhu et al., 2022). To reduce the geometrical distortion in the scanning and imaging process of the Sentinel satellite and acquire more accurate deformation information of the radar line of sight, different data were selected to analyze the deformation characteristics of the slope according to the different slope orientations of each side, the relationship between the slope and the local incidence angle of the sentinel satellite, and the difference in the flight direction of the satellites collecting the ascending and descending tracks data. The selection results are shown in Table 4.
TABLE 4
| Number | Study object | Slope orientation | Satellite local incidence Angle/° | Select results |
|---|---|---|---|---|
| PA | Sunjialiang Tunnel Slope | west | 38.466 | descending |
| PB | Jiefangcun Tunnel Slope | east | 38.397 | descending |
| PC | Yingdiliangzi Tunnel Slope | southeast | 43.408 | ascending |
| PD | Qiluogou Tunnel Slope | northeast | 38.377 | descending |
Selection results.
5.2 Sunjialiang Tunnel
Sunjialiang Tunnel is 2096 m long, and the deformation rate of the side slope is presented in Figure 6A, and the whole deformation rate ranged from −96.755 mm/year to 30.471 mm/year. The optical remote sensing image was observed, and three characteristic points (i.e., PA1, PA2, and PA3) in the range of heart-shaped landslides were selected. To be specific, PA1 was located in the upper part of the slope, i.e., the area with the maximum deformation rate of the landslide. Its average deformation rate was −82.622 mm/year. PA2 was positioned in the middle of the slope, and the average deformation rate reached 4.886 mm/year. PA3 was located in the lower part of the slope with an average deformation rate of 16.583 mm/year. When rainfall varied significantly, the vegetation coverage on the landslide fluctuated less, usually between 0.15 and 0.25 (Figure 6C).
FIGURE 6

Deformation result and vegetation coverage of Sunjialiang tunnel slope. (A) is the annual average deformation of Sunjialiang tunnel slope using the descending track data. (B) is the time series deformation of selected feature points on Sunjialiang tunnel slope and rainfall from April 2021 to January 2023. (C) is the variation of vegetation coverage and rainfall in Sunjialiang tunnel slope from April 2021 to January 2023.
Under the effect of the water impoundment, the three characteristic points all declined significantly in the direction of LOS in April 2021, and then stabilized. Subsequently, under the effect of a rainstorm in July of the same year, PA1 displayed a downward trend in the direction of LOS, while PA2 and PA3 tended to be increased. From February to August 2022, the upper part of the landslide slipped and deposited into the soil mass in the middle and lower part of the landslide, which continued to slip under the action of rainfall and its gravity, and points PA2 and PA3 showed a downward trend in this period. However, because the upper part of the slope was in an unstable sliding state, considerable soil accumulated in the middle and lower part of the slope.
5.3 Jiefangcun Tunnel
Jiefangcun Tunnel is 766 m long, the deformation rate of the side slope is presented in Figure 7A, and the whole deformation rate ranges from −1.508 mm/year to 59.830 mm/year. The area was divided into four parts along the topographic direction, and feature point PB1 was selected from the upper part, feature point PB2 was selected from the middle south, feature point PB3 was selected from the middle north and feature point PB4 was selected from the lower part. As depicted in Figure 7B, the trends of PB1, PB2, and PB3 were consistent, and PB4 point shape variable was the most obvious among the four characteristic points, up to 81.142 mm. As depicted in Figure 7C, the change of vegetation cover in this area was positively correlated with rainfall.
FIGURE 7

Deformation result and vegetation coverage of Jiefangcun tunnel slope. (A) is the annual average deformation of Jiefangcun tunnel slope using the descending track data. (B) is the time series deformation of selected feature points on Jiefangcun tunnel slope and rainfall from April 2021 to January 2023. (C) is the variation of vegetation coverage and rainfall in Jiefangcun tunnel slope from April 2021 to January 2023.
Field investigation suggested that the slope of the upper part of the slope was slow, covered with dense woodland, and the vegetation coverage was relatively high, such that it can effectively intercept rainwater and reduce the impact of rainfall on the slope, thus effectively inhibiting the deformation of the slope. In addition, the root system of the woodland was well developed, which can effectively fix soil and further enhance the stability of slope. In contrast, although the woodland has a certain deformation-inhibiting effect, the slope of the lower slope was steep, and the vegetation coverage was high, which resulted in the lower dead weight, and the slope deformation turned out to be more obvious.
5.4 Yingdiliangzi Tunnel
Yingdiliangzi tunnel is 1144 m in length, and the deformation rate of the side slope is shown in Figure 8A, and the whole deformation rate ranges from −41.211 mm/year to 29.227 mm/year. The deformation information of the northeast side slope in this area is too little, and most of the deformation information is mainly concentrated on the south side slope. The southward slope in this area was further subdivided into southwest slope and southeast slope, the characteristic point PC1 was selected from the upper part of the southwest slope, and the characteristic point PC2 was selected from the lower part. The characteristic point PC3 was selected from the upper part of the southeast slope, and the characteristic point PC4 was selected from the lower part. To be specific, the average deformation rates of the characteristic points PC1, PC2, PC3, and PC4 reached −27.881 mm/year, −12.399 mm/year, −18.371 mm/year, and −0.632 mm/year, respectively. There is a positive correlation between vegetation coverage and rainfall in this region (Figure 8C).
FIGURE 8

Deformation result and vegetation coverage of Yingdiliangzi tunnel slope. (A) is the annual average deformation of Yingdiliangzi tunnel slope using the descending track data. (B) is the time series deformation of selected feature points on Yingdiliangzi tunnel slope and rainfall from April 2021 to January 2023. (C) is the variation of vegetation coverage and rainfall in Yingdiliangzi tunnel slope from April 2021 to January 2023.
As indicated by the time series deformation of characteristic points, the variation trend of the above-mentioned four points was nearly identical, and the variation of shape variable showed a correlation with the variation of rainfall. During the rainy season, because of the increase in rainfall, the soil was loosened and flowing due to water infiltration, thus the deformation of the slope displayed a downward trend. On the contrary, during the dry season, the moisture was absent, and the deformation of the slope displayed an upward trend. Moreover, the upper deformation variable of the two-way slope was larger, and the whole slope was in a sliding state. Furthermore, as indicated by the result of the field investigation, PC2 point was in the area of the landslide trace, and the soil body near PC1 point and its upper part was accumulated at the upper edge of the landslide trace.
5.5 Qiluogou Tunnel
The total length of Qiluogou tunnel is 1582m, and the deformation rate of the side slope is shown in Figure 9A, and the whole deformation rate ranges from 2.543 mm/year to 66.273 mm/year. The area is divided into southeast side slope, east side slope and north side slope according to the slope direction. Since the slope of the east side slope is steep, the deformation information on the east side slope was less, while the north side slope is far from the Jinsha River. Therefore, the characteristic point PD1 was selected on the ridge of this area, the characteristic point is PD2 in the middle of the southeast slope and PD3 in the lower part of the southeast slope. The average deformation rates of PD1 and PD2 approximately reached 32.859 mm/year and 34.634 mm/year, respectively. Figure 9C shows that there was a positive correlation between vegetation coverage and rainfall.
FIGURE 9

Deformation result and vegetation coverage of Qiluogou tunnel slope. (A) is the annual average deformation of Qiluogou tunnel slope using the descending track data. (B) is the time series deformation of selected feature points on Qiluogou tunnel slope and rainfall from April 2021 to January 2023. (C) is the variation of vegetation coverage and rainfall in Qiluogou tunnel slope from April 2021 to January 2023.
As indicated by the time series deformation of characteristic points, the deformation trend of PD1, PD2 and PD3 points was consistent, and the whole trend of uplift arose after settling due to water storage. However, the deformation of the respective point is different. The closer it is to the lower characteristic point, the more susceptible the deformation will be to the rainy season. When rainfall was increased, the lower part displayed a downward trend compared with the middle and upper parts. When rainfall declined, the lower part showed a rising trend compared with the middle and upper parts. In addition, the area was covered by grassland. Although the vegetation coverage was high, slope deformation cannot be effectively restrained due to steep slope and underdeveloped root system, such that the slope deformation turned out to be more significant.
6 Discussion
SBAS-InSAR technology has been proved to be a valuable method for monitoring landslide deformation (Yang et al., 2022a; Dai et al., 2022; Dun et al., 2023; Guo et al., 2023), which can effectively monitor surface deformation and reveal the spatial distribution of landslide source area. The comparison with several papers (Yang et al., 2022b; Guo et al., 2023) shows that the deformation trend in the reservoir area of Baihetan Hydropower Station is consistent in the same time period and within the same research scope, which effectively supplements the deformation monitoring in the reservoir area of Baihetan Hydropower Station. In addition, the influence of rainfall and vegetation on slope stability is discussed by combining the rainfall and vegetation coverage and the deformation trend of four typical landslide source areas.
Rainfall is one of the important factors affecting the stability of bank slope. When the rainy season comes, considerable rain will penetrate the soil, increasing the saturation degree of the soil, such that the internal pressure of the soil is increased. If the saturation degree of the soil exceeds a certain degree, it will cause the liquefaction or flow of the soil, which will lead to the destruction of the bank slope. In addition, rainfall may also cause surface erosion and erosion of the bank slope of the reservoir, and aggravate the stability of the slope.
The effect of different vegetation on restraining slope deformation is different. To explore this difference, we selected the time series deformation data of B4 points at the lower part of the Jiefangcun tunnel slope, C4 points at the lower part of the Yingdiliangzi tunnel slope, and D4 points at the lower part of the Qiluogou tunnel slope for comparative analysis (Figure 10). It can be seen from Figure 10 that C4 has the smallest deformation and B4 has the largest deformation. This indicates that shrub vegetation has the best effect on restraining slope deformation, followed by grassland, while woodland has the worst effect and may even promote slope deformation. The root system of the shrub is more developed than that of grassland, which can effectively restrain the deformation of slope. Although the root system of forest land is developed, its own weight is larger, which increases the own weight of slope, but promotes the occurrence of slope deformation.
FIGURE 10

Time series deformation of lower slope under different vegetation coverage from April 2021 to January 2023. PB4 is located in the lower part of the Jiefangcun tunnel slope, which is covered by woodland. PC4 is located in the lower part of the Yingdiliangzi tunnel slope, which is covered by shrubs. PD4 is located in the lower part of the Qiluogou tunnel slope, which is covered by grassland.
7 Conclusion
In this study, the deformation results of the study area from 9 April 2021 to 29 January 2023 were obtained using SBAS-InSAR technology and Sentinel-1 SAR data of the ascending and descending tracks. The vegetation coverage in the study area was extracted using Landsat8-9 remote sensing data. The deformation characteristics of four typical source areas were analyzed by combining rainfall data. The following conclusions were obtained.
(1) The deformation rate of four typical source areas in the LOS direction ranged from −96.755 mm/year to 66.273 mm/year. Since the reservoir began to fill in April 2021, the slope of the respective source area had a large deformation in a short period, especially the lower part of the slope turned out to be more significant, and the deformation rate exceeded 334.583 mm/year.
(2) Except for the slope of the Sunjialiang tunnel, the change trend of vegetation coverage in the other three typical source areas was similar, and all showed a positive correlation with rainfall. The lower slope of these three typical source areas was steep. As indicated by the result of the comparative analysis, the restraining effect of different types of vegetation on slope deformation was different. Compared with grassland, the root system of shrubs was developed, such that the inhibition effect on the slope deformation was optimal. Although the woodland has a developed root system and good rainfall interception effect, it exerts the worst inhibition effect on slope deformation for its relatively large dead weight.
Statements
Data availability statement
The raw data supporting the conclusion of this article will be made available by the authors, without undue reservation.
Author contributions
ZY and WX developed the idea for the manuscript. HY processed optical remote sensing data. ML processed the SBASInSAR data and wrote the manuscript. WX, JG, and ML surveyed the area. All authors contributed to the article and approved the submitted version.
Funding
This research was funded by the National Natural Science Foundation of China (Grant No. 41861134008), Muhammad Asif Khan academician workstation of Yunnan Province (Grant No. 202105AF150076), Key R&D Program of Yunnan Province (Grant No. 202003APC100002), General Program of basic research plan of Yunnan Province (Grant No. 202001AT070059), Major scientific and technological projects of Yunnan Province:Research on Key Technologies of ecological environment monitoring and intelligent management of natural resources in Yunnan (No:202202AD080010), and “Study on High-Level Hidden Landslide Identification Based on Multi-Source Data” of Key Laboratory of Early Rapid Identification, Prevention and Control of Geological Diseases in Traffic Corridor of High Intensity Earthquake Mountainous Area of Yunnan Province (KLGDTC-2021-02).
Acknowledgments
We would like to thank Japan Aerospace Exploration Agency (JAXA), European Space Agency (ESA) and United States Geological Survey (USGS) for providing the ALOS World 3D-30m DEM, Sentinel-1A datasets, orbit ephemerides data and optical image data, respectively.
Conflict of interest
The authors declare that the research was conducted in the absence of any commercial or financial relationships that could be construed as a potential conflict of interest.
Publisher’s note
All claims expressed in this article are solely those of the authors and do not necessarily represent those of their affiliated organizations, or those of the publisher, the editors and the reviewers. Any product that may be evaluated in this article, or claim that may be made by its manufacturer, is not guaranteed or endorsed by the publisher.
References
1
AhmedM. F.SherF.MehmoodE. (2023). Evaluation of landslide hazards potential at Dasu dam site and its reservoir area. Environ. Earth Sci.82 (7), 183. 10.1007/s12665-023-10789-3
2
BaiY. P. (2020).Analysis of surface deformation feature and early identification of potential landslides in the middle reaches of Bailong River based on SBAS-InSAR technologyM. D. thesis. Lanzhou, China: Lanzhou University. 10.27204/d.cnki.glzhu.2020.000212
3
BerardinoP.FornaroG.LanariR.SansostiE. (2002). A new algorithm for surface deformation monitoring based on small baseline differential SAR interferograms. IEEE Trans. Geoscience Remote Sens.40 (11), 2375–2383. 10.1109/TGRS.2002.803792
4
BosaS.PettiM. (2011). Shallow water numerical model of the wave generated by the Vajont landslide. Environ. Model. Softw.26 (4), 406–418. 10.1016/j.envsoft.2010.10.001
5
ChenC. Y.LinC. L. (2019). Applications of UAS-obtained thermal images for vegetation coverage ratio monitoring of mudstone areas. IOP Conf. Ser. Mater. Sci. Eng.652, 012062. 10.1088/1757-899X/652/1/012062
6
ChengG.WangZ. X.ZhuH. H.LiD. Y.MaQ. (2022). Research review of rock and soil deformation monitoring based on distributed fiber optic sensing. Laser & Optoelectron. Prog.59 (19), 51–70. 10.3788/LOP202259.1900004
7
DaiK. R.TieY. B.XuQ.FengY.ZhuoG. C.ShiX. L.et al (2020). Early identification of potential landslide Geohazards in alpine-canyon terrain based on SAR interferometry-a case study of the middle section of yalong river. J. Radars9 (3), 554–568. 10.12000/JR20012
8
DaiK. R.ShenY.WuM. T.FengW. K.DongX. J.ZhuoG. C.et al (2022). Identification of potential landslides in Baihetan Dam area before the impoundment by combining InSAR and UAV survey. Acta Geodetica Cartogr. Sinica51 (10), 2069–2082. 10.11947/j.AGCS.2022.20220305
9
DaiK. R.WuM. T.ZhuoG. C.JuA. H.WenN. L.FengW. K.et al (2023). Review on InSAR early ldentification and monitoring of reservoirandslides for large hydropower engineering projects in southwest mountainous area of China. J. Earth Sci. Environ.45 (3), 559–577. 10.19814/j.jese.2022.12080
10
DongJ. J.MeiY.LiX.LiuS. Y.YanB. (2022). SBAS-InSAR monitoring of slope safety and stability of high altitude dumps. China Saf. Sci. J.32 (1), 92–101. 10.16265/j.cnki.issn1003-3033.2022.01.013
11
DongK.LiZ. F.LuX.ChenC.ShengJ. B.ChenJ. K.et al (2021). Analysis of dam overtopping failure risks caused by landslide-induced surges considering spatial variability of material parameters. Front. Earth Sci.9. 10.3389/FEART.2021.675900
12
DunJ. W. (2021).Early identification and deformation monitoring of active landslides before water storage in Baihetan reservoir area by InSARM. D. thesis. Chengdu, China: Chengdu University of Technology. 10.26986/d.cnki.gcdlc.2021.000718
13
DunJ. W.FengW. K.YiX. Y.ZhangG. Q.WuM. T. (2023). Early InSAR identification of active landslide before impoundment in baihetan reservoir area—A case study of Hulukou town xiangbiling section. J. Eng. Geol.31 (2), 479–492. 10.13544/j.cnki.jeg.2022-0016
14
EmilM. K.SultanM.AlakhrasK.SataerG.GoziS.AlMarriM.et al (2021). Countrywide monitoring of ground deformation using InSAR time series: a case study from Qatar. Remote Sens.13 (4), 702. 10.3390/rs13040702
15
FengP. F.JiaF. X.ChenM. (2023). Analysis of correlation between vegetation coverage and topographic factors based on Landsat remote sensing image in Weichang county. Water Resour. Plan. Des.233 (3), 111–116. 10.3969/j.issn.1672-2469.2023.03.023
16
FengW. K.DunJ. W.YiX. Y.ZhangG. Q. (2020). Deformation analysis of Woda village old landslide in Jinsha river basin using SBAS-InSAR technology. J. Eng. Geol.28 (2), 384–393. 10.13544/j.cnki.jeg.2019-411
17
GongY. F.WangH.WuX. H.ZhangJ.LiuJ. (2022). Identification of potential landslide hazards using time-series InSAR in xiji county of ningxia. Saf. Environ. Eng.29 (6), 114–121. 10.13578/j.cnki.issn.1671-1556.20211490
18
GuoJ. Q.XiW. F.ShiZ. T.YangZ. Q.YangZ. R. (2023). Study on deformation monitoring of typical tunnel slope in baihetan reservoir area under SBAS-InSAR technology. J. Guizhou Univ.40 (4), 48–55. 10.15958/j.cnki.gdxbzrb.2023.04.07
19
GuoJ. (2022).Research on formation and transformation mechanism of landslide-induced debris flow disaster chainPh. D. thesis. Xian, China: Chang’an University. 10.26976/d.cnki.gchau.2022.000934
20
GuoR.LiS. M.ChenY. N.YuanL. W. (2019). A method based on SBASInSAR for comprehensive identification of potential goaf landslide. J. Geo-Information Sci.21 (7), 1109–1120. 10.12082/dqxxkx.2019.180630
21
HuY. P. (2017).Study on the influence of bank collapse on qiaomeng highway in the area of baihetan reservoirM. D. thesis. Chengdu University of Technology. Chengdu, China.
22
HuangL. Y.YangY. L.GaoP.YanX. R.YouJ. Y.ZhangH.et al (2023). Temporal and spatial variation of vegetation coverage and its topographical differentiation in the upstream of minjiang river with Landsat remote sensing image. J. North-East For. Univ.51 (1), 54–60. 10.13759/j.cnki.dlxb.2023.01.005
23
JiangQ. Q.JiaoY. Y.SongL.WangH.XieB. T. (2019). Experimental study on reservoir landslide under rainfall and water-level fluctuation. Rock Soil Mech.40 (11), 4361–4370. 10.16285/j.rsm.2018.1617
24
KaracaS. O.AbirI. A.KhanS. D.OzsayınE.QureshiK. A. (2021). Neotectonics of the western suleiman fold belt, Pakistan: evidence for bookshelf faulting. Remote Sens.13 (18), 3593. 10.3390/rs13183593
25
LiB.ZhangQ.WangW. P.ZhaoQ. S.WangC. H.HeK.et al (2020). Geohazard monitoring and risk management of high-steep slope in the Wudongde dam area. J. Geomechanics26 (4), 556–564. 10.12090/j.issn.1006-6616.2020.26.04.048
26
LiX. A.ZhouL.SuF. Z.WuW. Z.et al (2021). Application of InSAR technology in landslide hazard:Progress and prospects. J. Remote Sens.25 (2), 614–629. 10.11834/jrs.20209297
27
LiuZ. Q.YangZ. Q.ChenM.XuH. H.YangY.ZhangJ.et al (2023). Research hotspots and Frontiers of mountain flood disaster: bibliometric and visual analysis. Water15 (4), 673. 10.3390/w15040673
28
MaS. Y.QiuH. J.ZhuY. R.YangD. D.TangB. Z.WangD. Z.et al (2023). Topographic changes, surface deformation and movement process before, during and after a rotational landslide. Remote Sens.15 (3), 662. 10.3390/rs15030662
29
MehrabiA. (2020). Monitoring the Iran Pol-e-Dokhtar flood extent and detecting its induced ground displacement using sentinel 1 imagery techniques. Nat. Hazards105 (3), 2603–2617. 10.1007/s11069-020-04414-w
30
QiuH. J.ZhuY. R.ZhouW. Q.SunH. S.HeJ. Y.LiuZ. J. (2022). Influence of DEM resolution on landslide simulation performance based on the Scoops3D model. Nat. Hazards Risk13 (1), 1663–1681. 10.1080/19475705.2022.2097451
31
RenK. Y.YaoX.ZhaoX. M.LiL. J. (2020). Study of landslide failure prediction based on TS-InSAR, GPS and image offset monitoring. Chin. J. Rock Mech. Eng.39 (S2), 3421–3431. 10.13722/j.cnki.jrme.2019.1095
32
WangL.XuH.ShuB.LiX. R.TianY. Q.YouJ.et al (2023). The pattern of alternative splicing and DNA methylation alteration and their interaction in linseed (Linum usitatissimum L) response to repeated drought stresses. Navigation Position. Timing10 (1), 12–26. 10.1186/s40659-023-00424-7
33
WangL. Y.QiuH. J.ZhouW. Q.ZhuY. R.LiuZ. J.MaS. Y.et al (2022). The post-failure spatiotemporal deformation of certain translational landslides may follow the pre-failure pattern. Remote Sens.14 (10), 2333. 10.3390/rs14102333
34
WenB. P.ShenJ.TanJ. M. (2008). The influence of water on the occurrence of Qianjiangping landslide. Hydrogeology Eng. Geol.35 (3), 12–18. 10.16030/j.cnki.issn.1000-3665.2008.03.016
35
XuQ.PuC. H.ZhaoK. Y.HeP.ZhangH. Y.LiuJ. L. (2021). Time series InSAR monitoring and analysis of spatiotemporal evolution characteristics of land subsidence in yanan new district. Geomatics Inf. Sci. Wuhan Univ.46 (07), 957–969. 10.13203/j.whugis20200146
36
YangJ. (2021).Study on the stability of gravel-soil bank slope of Xiaojiang Bridge in Baihetan Reservoir Area under reservoir water fluctuationM. D. thesis. Chengdu University of Technology. Chengdu, China. 10.26986/d.cnki.gcdlc.2021.001033
37
YangZ. Q.ChenM.ZhangJ.DingP.HeN.YangY. (2023a). Effect of initial water content on soil failure mechanism of loess mudflow disasters. Front. Ecol. Evol.11, 1141155. 10.3389/fevo.2023.1141155
38
YangZ. Q.WeiL.LiuY. Q.HeN.ZhangJ.XuH. H. (2023b). Discussion on the relationship between debris flow provenance particle characteristics, gully slope, and debris flow types along the karakoram highway. Sustainability15, 5998. 10.3390/su15075998
39
YangZ. Q.XiongJ. F.ZhaoX. G.MengX. R.WangS. B.LiR.et al (2023c). Column-hemispherical penetration grouting mechanism for Newtonian fluid considering the tortuosity of porous media. Processes11 (6), 1737. 10.3390/pr11061737
40
YangZ. Q.ZhaoX. G.ChenM.ZhangJ.YangY.ChenW. T.et al (2023d). Characteristics, dynamic analyses and hazard assessment of debris flows in niumiangou valley of wenchuan county. Appl. Sci.13 (2), 1161. 10.3390/app13021161
41
YangZ. R.XiW. F.ShiZ. T.XiaoB.ZhouD. Y. (2022a). Deformation analysis in the bank slopes in the reservoir area of Baihetan Hydropower Station based on SBAS-InSAR technology. Chin. J. Geol. Hazard Control33 (05), 83–92. 10.16031/j.cnki.issn.1003-8035.202202056
42
YangZ. R.XiW. F.YangZ. Q.ShiZ. T.QianT. H. (2022b). Monitoring and prediction of glacier deformation in the meili snow mountain based on InSAR technology and GA-BP neural network algorithm. Sensors22 (21), 8350. 10.3390/s22218350
43
YunY.LuX. L.FuX. K.XueF. Y. (2020). Application of spaceborne interferometric synthetic aperture radar to geohazard monitoring. J. Radars9 (01), 73–85. 10.12000/JR20007
44
ZhaoX. G.YangZ.MengX. R.WangS. B.LiR.XuH. H.et al (2023). Study on mechanism and verification of columnar penetration grouting of time-varying Newtonian fluids. Processes11 (4), 1151. 10.3390/pr11041151
45
ZhouZ. K. (2018).Study of geo-hazards investigation for baihetan reservoir bank by InSAR technologyM. D. thesis. Beijing, China: Chinese Academy of Geological Sciences. 10.27744/d.cnki.gzgdk.2018.000006
46
ZhuJ. J.HuJ.LiZ. W.SunQ.ZhengW. J. (2022). Recent progress in landslide monitoring with InSAR. Acta Geodetica Cartogr. Sinica51 (10), 2001–2019. 10.11947/j.agcs.2022.20220294
47
ZhuY.PengM.CaiS.ZhangL. M. (2021). Risk-based warning decision making of cascade breaching of the tangjiashan landslide dam and two smaller downstream landslide dams. Front. Earth Sci.9. 10.3389/FEART.2021.648919
Summary
Keywords
SBAS-InSAR, landslide source area, deformation monitoring, vegetation coverage, surface deformation
Citation
Liu M, Yang Z, Xi W, Guo J and Yang H (2023) InSAR-based method for deformation monitoring of landslide source area in Baihetan reservoir, China. Front. Earth Sci. 11:1253272. doi: 10.3389/feart.2023.1253272
Received
05 July 2023
Accepted
01 August 2023
Published
10 August 2023
Volume
11 - 2023
Edited by
Haijun Qiu, Northwest University, China
Reviewed by
Chao Chen, Suzhou University of Science and Technology, China
Pan Cao, University of Hertfordshire, United Kingdom
Updates
Copyright
© 2023 Liu, Yang, Xi, Guo and Yang.
This is an open-access article distributed under the terms of the Creative Commons Attribution License (CC BY). The use, distribution or reproduction in other forums is permitted, provided the original author(s) and the copyright owner(s) are credited and that the original publication in this journal is cited, in accordance with accepted academic practice. No use, distribution or reproduction is permitted which does not comply with these terms.
*Correspondence: Zhiquan Yang, yzq1983816@kust.edu.cn; Wenfei Xi, xiwenfei911@163.com
Disclaimer
All claims expressed in this article are solely those of the authors and do not necessarily represent those of their affiliated organizations, or those of the publisher, the editors and the reviewers. Any product that may be evaluated in this article or claim that may be made by its manufacturer is not guaranteed or endorsed by the publisher.