- 1College of Geography and Remote Sensing Sciences, Xinjiang University, Urumqi, China
- 2Xinjiang Key Laboratory of Oasis Ecology, Xinjiang University, Urumqi, China
- 3State Key Laboratory of Desert and Oasis Ecology, Xinjiang Institute of Ecology and Geography, Chinese Academy of Sciences, Urumqi, China
- 4Research Center for Ecology and Environment of Central Asia, Chinese Academy of Sciences, Urumqi, China
- 5University of Chinese Academy of Sciences, Beijing, China
Identifying and quantifying the drivers of runoff (R) variability is fundamental to our understanding of the hydrologic cycle and necessary for decision makers to manage water resources. Climate variables and vegetation are the main factors influencing the R. However, the effects of climate and vegetation changes on R are still poorly understood, especially in arid regions with limited water resources. This study quantifies the contribution of precipitation (PRE), potential evapotranspiration (ET0), and Normalized Difference Vegetation Index (NDVI) to R in Lake Issyk-Kul Basin (LIKB) dryland Central Asia by using the Budyko model. The results showed that R, PRE, and ET0 decreased from 2000 to 2020, while the NDVI and underlying parameter (ω) showed a slightly increasing trend. By using the Mann-Kendall (M-K) statistical approach, divided the R series into a baseline period (2000–2010) and a change period (2011–2020) based on the breakthrough point (2011). In the baseline period, R showed a decreasing trend, while in the change period, R showed an increasing trend of 1.8 mm/yr. The sensitivity analysis shows that a 1 mm increase in PRE results in a 0.48 mm increase in R (sensitivity coefficient to R is 0.48). Conversely, a 1 mm increase in ET0 (sensitivity coefficient to R of −0.03) and a 1 unit increase in NDVI (sensitivity coefficient to R of −343.31) lead to R decreasing by 0.03 and 343.31 mm, respectively. The relative contributions of PRE, ET0 and NDVI were 33.98%, −3.17% and 3.67%, respectively, suggesting that changes in PRE and NDVI contributed to the decrease in R while the opposite for ET0. PRE dominated the decrease in R, which decreased by 26.58 mm, leading to a decrease in R of 12.76 mm. A decrease of 65.33 mm in ET0 and an increase of 0.003 in NDVI resulted in an increase and decrease of 1.96 and 1.18 mm in R, respectively. This study enhances the understanding of the response of the water cycle to climate and vegetation changes in arid regions and can provide theoretical support for water resource management and ecological restoration.
1 Introduction
Runoff (R) is an essential component of the water cycle and critical in understanding the water and energy balance between the atmosphere and the surface (Sorg et al., 2012; Jiang et al., 2015). R variability is related to the region’s ecological environment and water security and is an essential indicator of sustainable regional development. Climate factors such as precipitation (PRE) and potential evapotranspiration (ET0) are the main factors influencing R changes (Wang et al., 2019; Gan et al., 2021). Moreover, vegetation, as a crucial regulator and component of the watershed ecosystem, affects water infiltration, retention, and evaporation during PRE (Piao et al., 2007; Zhang et al., 2016; Luo et al., 2020a), changing the R of the watershed. Quantifying the effects of climate variables and vegetation changes on R helps to clarify the climate-vegetation-hydrology interactions and facilitates regional water resources planning and management.
Previous studies have used statistical methods (Xu, 2011; Xu X. Y. et al., 2013), hydrological models (Huang et al., 2016; Veldkamp et al., 2018), and conceptual models of water-energy balance (Budyko, 1974; Yang H. et al., 2008; Wang and Tang, 2014) to generalize the variation of R. Statistical methods (such as trend analysis or correlation analysis) are simple to operate. Still, it is difficult to explain the physical process of R changes (Wu et al., 2017; Ni et al., 2022). Process-based hydrological modeling is an effective way to understand the different variables and their interactions through physical mechanisms. However, the results’ reliability has not been fully demonstrated due to model structure, data requirements, calibration, and validation (Nash and Gleick, 1991; Johnston and Smakhtin, 2014; Song et al., 2015). The conceptual approach refers mainly to the Budyko model (Budyko, 1974). The Budyko model is simple and concise, considering water and energy constraints in long-term hydrological processes (Yang H. B. et al., 2008; Sposito, 2017). Using the Budyko model, it is possible to derive the relative contributions of climate and human activities to changes and trends in the R of a catchment. Recently, the Budyko model has been widely used to quantify and disentangle the impacts of climate change and human activities on R in different regions (Shen et al., 2017; Li et al., 2021b; Lv et al., 2021). Hu Y. A. et al. (2021) found that the Budyko model can quantify the impact of climate and human activities on R in the Amu Darya basin in Central Asia, and that the expansion of cropland is the main reason for the decrease in R. Li Z. L. et al. (2020)found that the Budyko model is more flexible than hydrological models in revealing runoff changes in the upper part of the Heihe River Basin because the Budyko model uses less data. However, previous studies have focused mainly on the effects of climate change and human activities on R and less on quantifying the relationship between vegetation changes and R. Vegetation, as one of the components of the subsurface, can affect R by trapping PRE and regulating regional evapotranspiration (Luo et al., 2020b). Especially, in ecologically fragile arid regions, the relationship between vegetation and the water cycle is even stronger because vegetation growth is mainly limited by water resources. In addition, in the context of climate change, the water cycle and vegetation growth in arid regions are more sensitive to climate change (Chen et al., 2015; Hu et al., 2021c), and the relative impacts of climate and vegetation on runoff are not yet clear. Therefore, it is important to quantify the impact of climate and vegetation changes on R in data-scarce arid regions by using the Budyko model.
As one of the most typical arid regions, social development and ecosystem stability in Central Asia are constrained by water resources (Xu C. C. et al., 2013; Bai et al., 2019). However, the spatiotemporal patterns of water resources in Central Asia have changed significantly in recent decades due to climate change and human activities (Luo et al., 2019; Duan et al., 2020; Alifujiang et al., 2021; Hu Z. et al., 2021). There is also a worrying crisis in the Aral Sea due to irrational water withdrawal for irrigation (Khamzina et al., 2008). In addition, changes in R have exacerbated water disputes, causing friction between countries and affecting regional stability and national security (Wang X. et al., 2021; Shi et al., 2021). The Lake Issyk-Kul basin (LIKB) is an inland lake basin with the largest alpine lake in Central Asia. LIKB is critical in adjusting regional climate and maintaining the balance of regional ecosystems (Yuan et al., 2019; Alifujiang et al., 2021). However, the water cycle of the LIKB has become imbalanced in recent decades, as evidenced directly by the overall decreasing trend of Issyk-Kul water level (Alifujiang et al., 2017b). For attributing changes in the LIKB water cycle, most previous studies have focused on changes in lake surface area and less on the dynamics of R in the basin. In particularly, there is a lack of quantification of the relationship between R and changes in climate and vegetation. In addition, most of the studies focused on the period before 2012 and lacked monitoring of recent changes of R in the LIKB.
Based on the above considerations, this study uses the Budyko model to simulate the surface R of the LIKB from 2000 to 2020. It uses the Moderate Resolution Imaging Spectroradiometer (MODIS) Normalized Difference Vegetation Index (NDVI) data to characterize the changes in vegetation. The main objectives of this study are 1) to reveal R’s spatial and temporal characteristics in the LIKB over the last 20 years; 2) to investigate spatial and temporal changes in climate variables and vegetation of the LIKB; and 3) to quantify the relative impacts of climatic factors and vegetation changes on R. The study may provide some reference for water cycle and ecological monitoring in inland lake basins, especially in arid areas, in the context of environmental change.
2 Materials and methods
2.1 Study area
Lake Issyk-Kul Basin is in Kyrgyzstan and is the largest alpine-enclosed inland lake in Central Asia (Figure 1). LIKB has a continental climate with a warm and dry environment. The average temperature is −6°C in January and 15°C in July (Yuan et al., 2019). The average annual PRE is 200–300 mm, increasing gradually from west to east (Alifujiang et al., 2021). The predominant soil type in LIKB is sandy, with a content of up to 63%, and a lower content of silt and clay (Sanchez et al., 2009). The main vegetation types in the basin are grassland, cropland, and forest (Figure 1). Grassland is the largest vegetation type in the LIKB (7581.34 km2), followed by cropland (2299.88 km2), mainly distributed in the northeast of the LIKB, and forest area is smaller (1377.62 km2), mainly distributed in mountainous areas. Among the mountain lakes, Lake Issyk-Kul ranks first in the world in terms of depth and volume of water. However, the ecological balance of the LIKB has been disturbed over the past decades. The most direct manifestation is the rapid change in climate and the consequent change in vegetation greening (Jiang et al., 2017). In this case, changes in climate and vegetation can lead to alterations in surface R from the LIKB. R may affect the water cycle and water allocation within the basin. However, R’s spatial and temporal characteristics in the LIKB and the relationship with climatic factors and vegetation changes are not clear. Therefore, it is necessary to quantify the spatial and temporal variation of climatic factors and vegetation changes on R impact, which can provide a reference for the rational use of water resources in the basin.
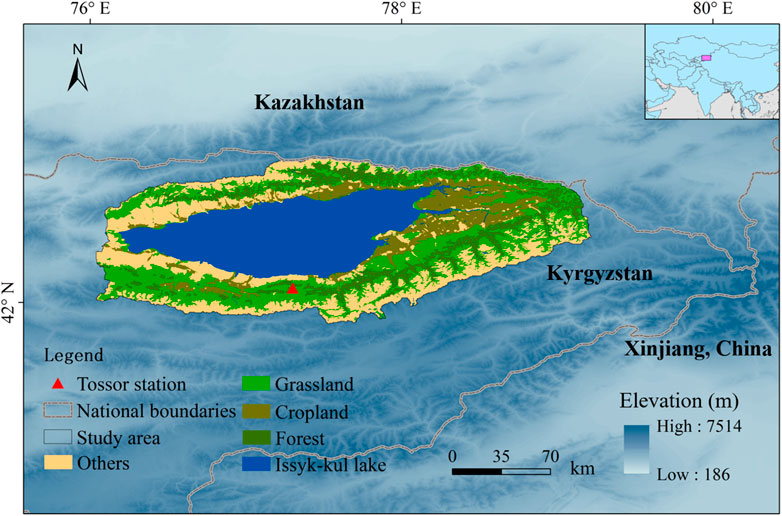
FIGURE 1. Location and Land cover maps of the Lake Issyk-Kul Basin (LIKB). The land cover data is obtained from the website https://www.resdc.cn/.
2.2 Dataset
2.2.1 Meteorological data
The meteorological data used in this study included monthly precipitation, atmospheric pressure, wind speed and direction, average temperature, sunshine duration, relative humidity, and maximum and minimum temperatures for the growing seasons 2000–2020. The maximum and minimum temperatures with a spatial resolution of 0.5° were obtained from Climate Research Unit (CRU 4.06) dataset, and the other meteorological data were obtained from European Reanalysis-Interim v5 (ERA5) with a spatial resolution of 0.1° (Hersbach et al., 2020). Potential evapotranspiration (ET0) was estimated using the Penman-Monteith equation recommended by the Food and Agriculture Organization (FAO) (Allen et al., 1998). Before calculating ET0, all meteorological variables were resampled to a consistent spatial resolution (0.1°× 0.1°) by bilinear interpolation.
2.2.2 Ancillary data
Land use cover change (LUCC) data is obtained from Resource Environment Data Cloud (https://www.resdc.cn/) with a resolution of 1 km. The data is obtained through visual interpretation of Landsat TM and OLI images. The classification accuracy reaches 94.3% (Liu et al., 2014). The land use classification includes cropland, water, forest, grassland, urban areas, and bare land. This study reclassified urban areas and bare land as others (Figure 1). Observations from 2000 to 2012 at the Tossor hydrological station (Alifujiang et al., 2017a) were used to validate the R simulated by the Budyko model.
This study used the MOD13A1 NDVI at 500 m spatial resolution to characterize the dynamics of vegetation cover in LIKB during the growing season 2000–2020. Actual evapotranspiration (ET) data were obtained from Mod16A2 at a spatial resolution of 500 m (https://lpdaac.usgs.gov/data/). The LUCC and NDVI data were resampled to a spatial resolution of 0.1° by majority and bilinear interpolation, respectively.
2.3 Methods
2.3.1 Linear trend analysis and breakpoint testing
This study used linear regression analysis to calculate trends in each variable to detect changes in hydrology, meteorological variables, and vegetation (Kawabata et al., 2001). Then, using the Pearson correlation method, the correlation coefficients were calculated, and when the significance level of the correlation coefficients was at 95% level (Yu et al., 2022b), indicating a close relationship between the two variables. The slope was calculated using the following equation:
where n denotes the cumulative years in the study period, i denotes the ith year, Xi denotes the variable’s value in an ith year.
The Mann-Kendall (M-K) non-parametric statistical test can exclude outliers from confounding the results (Mann, 1945; Kendall, 1948) and has been widely used to identify breakpoints in basin hydrological variables (Xu et al., 2014a; Li et al., 2017). In this study, the M-K test was used to test for breakpoints in R.
Firstly, UF follows a standard normal distribution and is the result of a positive time series statistic. As for UB, it is the result of the time series in inverse order. By analyzing the statistical series UF and UB, the time point of the mutation can be further analyzed. If there is an intersection of the UF and UB curves and the intersection is between the two critical value lines, then the moment corresponding to the intersection is the mutation point.
2.3.2 Sensitivity analysis
Fu (1981) derived different forms of the Budyko model based on the physical processes of basin hydrometeorology, which have been widely used to quantify the effects of vegetation and climate factors on R global and basin scales (Luo et al., 2020a; Li et al., 2021a). The expression of the Budyko model for each pixel is calculated as follows:
where ET is actual evapotranspiration, PRE is precipitation, ET0 is potential evapotranspiration, and ω is the model parameter, ω is significantly affected by vegetation change and climate change (Roderick and Farquhar, 2011). Based on the basin water balance Eq. 6:
Then the R can be obtained by Eqs 5, 6:
Based on Eq. 7, the sensitivity coefficients (∂R/∂X) of R in the basin to the climate factors (PRE, ET0) and the parameter ω were obtained by applying the partial differential equation:
When the sensitivity coefficient is positive (negative), it means that an increase in the variable has a promoting (reducing) effect on R. Concerning previous studies (Luo et al., 2020a; Yang et al., 2021), the sensitivity coefficient of R to NDVI (∂R/∂NDVI) is:
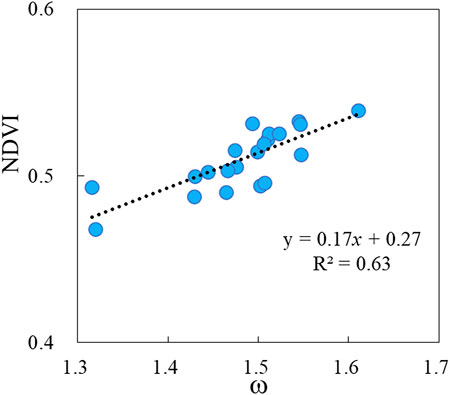
where SNDVI−ω is the sensitivity of ω to changes in vegetation and was determined as the slope of the best linear regression between ω and NDVI (Figure 2).
2.3.3 Attribution analysis of R changes
The study period was divided into a base period and a change period based on abrupt change analysis. The analysis of the contribution to R change is based on the base and change periods. ΔR, ΔPRE, ΔET0, Δω, and ΔNDVI are the mean changes between the two periods. The change in R (ΔR) can be attributed to the effects of climate and substratum. The impact of changes in climate factors on R can be divided into PRE (ΔRPRE) and ET0 (ΔRET0). The influence of the following parameter ω (ΔRω) R is divided in this study into the result of vegetation (ΔRNDVI) and other factors (ΔRothers). The following equation can quantify the contribution of the above variables to R (Xu et al., 2014b; Ni et al., 2022):
Then the contribution of PRE (C_PRE), ET0 (C_ET0), and NDVI (C_NDVI) to the change in R was calculated using the following equation:
3 Results
3.1 Temporal and spatial variability of PRE, ET0, NDVI and
The spatial and temporal characteristics of PRE, ET0, NDVI, and parameters ω for the period 2000–2020 are shown in Figure 3. Spatial variability shows a decreasing trend (−3.8 mm/yr) in PRE in the northern and southern parts of the LIKB (Figure 3B1). In terms of interannual variability, PRE showed a decreasing trend over the study period (Figure 3C1). The mean ET0 is higher than 1200 mm in most parts of LIKB (Figure 3A2), except in the southeast. The spatial distribution of mean NDVI shows higher values in the eastern part of LIKB and lower values in the west (Figure 3A3). The mean value of the ω based on Eq. 1 is >1 throughout LIKB, with the mean value of ω > 2 in the northeast (Figure 3A4). Regarding dynamic characteristics, the spatial patterns of the slopes of PRE and ET0 are essentially consistent, showing a widespread downward trend in LIKB (Figures 3B1, 2). The temporal variation of ET0 also shows a decreasing trend (Figure 3C2). NDVI shows a decreasing trend in the southeast of LIKB and an increasing trend in the southwest. Overall, NDVI shows a slightly increasing trend during the study period. The parameter ω shows an increasing trend over most LIKB, consistent with the temporal variation (Figure 3C4).
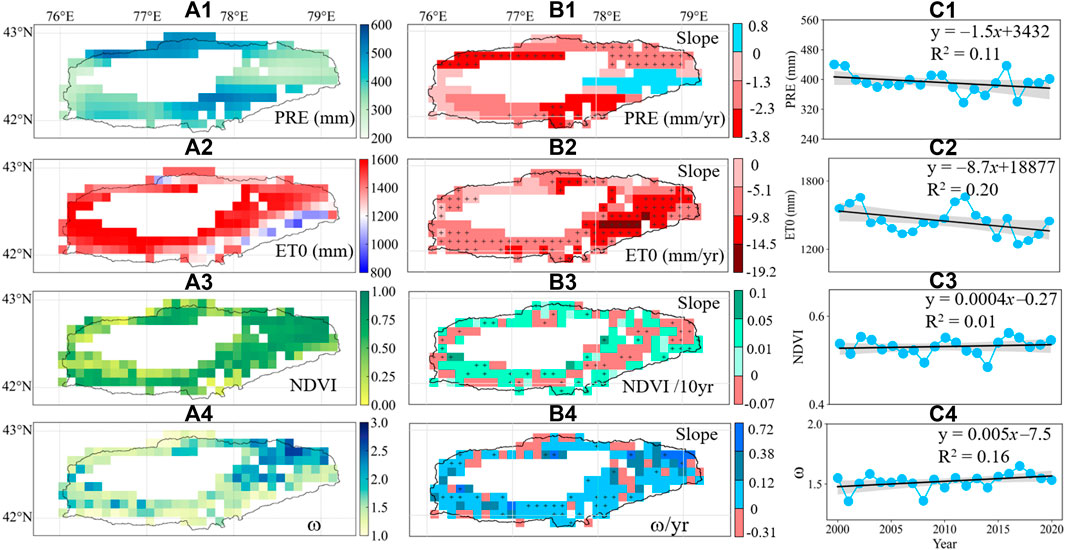
FIGURE 3. Spatial distribution of the mean value (A) and slope (B) of PRE, ET0, NDVI, and ω and the temporal variation (C) in LIKB. The statistically significant regions (p < 0.05) are labeled with black spots. R2 is the coefficient of determination of the fitted function.
3.2 Temporal and spatial variability of R
Figure 4 shows the relationship between the R simulated based on the Budyko model and the observations obtained from the Tossor station. The 1:1 line indicates that the simulated R is higher than the observed R. The determination coefficient of the fitted line between the simulated R and the observed data is 0.58 (R2 = 0.58), indicating that the Budyko model captures the dynamic characteristics of R for LIKB. The multi-year mean of R is higher in the northern and southern parts of LIKB and lower in the western and eastern regions (Figure 5A). The slope of R for most of the LIKB showed a decreasing trend over the study period (Figure 5B). In this study, the breakpoint of R was determined for the period 2000–2020 by the M-K statistical method to determine the baseline and change period for R changes. According to the results of the M-K test, there is an abrupt change point in R in 2011 (Figure 5C). The R series is divided by abrupt change points into a base period (2000–2010) and a change period (2011–2020). There is a decreasing trend in R over the period 2000–2020, and the same trend is observed for the baseline period (−0.6 mm/yr). The change period shows an increasing trend in R (1.8 mm/yr), and its mean value of R is lower than that of the baseline period.
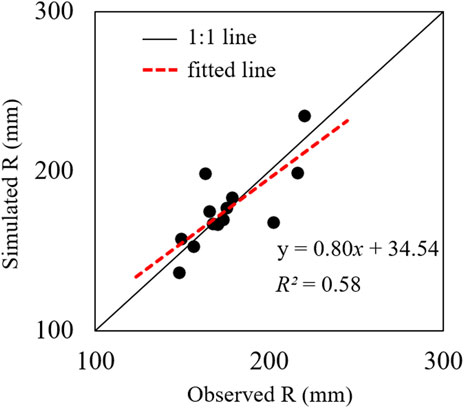
FIGURE 4. Scatter plot of R simulated by the Budyko model compared to the measured results. The black line is the 1:1 line, the red dashed line is the fitted line, and R2 is the coefficient of determination of the fitted function.
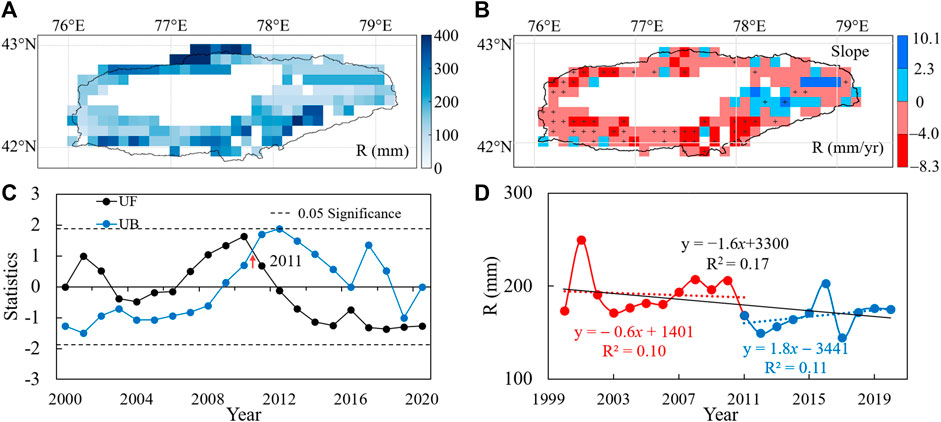
FIGURE 5. The Spatial distribution of mean values of R (A), slope (B) and breakpoint analysis (C), and temporal variation (D). UF is the result of a positive time series statistic; UB is the result of the time series in inverse order. R2 is the coefficient of determination of the fitted function.
3.3 Sensitivity analysis of R changes
Figure 6 shows the spatial and temporal variation of the sensitivity coefficients of R to PRE, ET0, and NDVI. The mean values of the sensitivity coefficients of R to PRE, ET0, and NDVI were 0.48, −0.03, and −343.31, respectively, over the study period. Regarding spatial patterns, the sensitivity coefficients of R to PRE were positive and had higher means in the northern and southern parts of LIKB (0.75–1.00) and lower means in the eastern part of LIKB. The sensitivity coefficients for R to ET0 and NDVI are negative and show a consistent spatial pattern over the years: higher in the southeast of LIKB (higher absolute values of sensitivity coefficients) and lower in the northeast (lower absolute values of sensitivity coefficients). Slopes of R sensitivity coefficients for PRE indicate a decreasing trend in R sensitivity to the PRE over most of the LIKB during the study period, while in the northeast it shows an increasing trend (decreasing sensitivity in absolute terms). Overall, the sensitivity of R to ET0 tends to increase slightly (absolute value of sensitivity increases) over the period 2000–2020. The sensitivity of R to NDVI tends to increase in most of the LIKB except for some areas. In the southeast, which indicates a decreasing sensitivity (absolute value of sensitivity coefficient decreases). The temporal variation in the sensitivity coefficients of R to NDVI also indicates a slight decrease in the sensitivity of R to changes in NDVI over the study period.
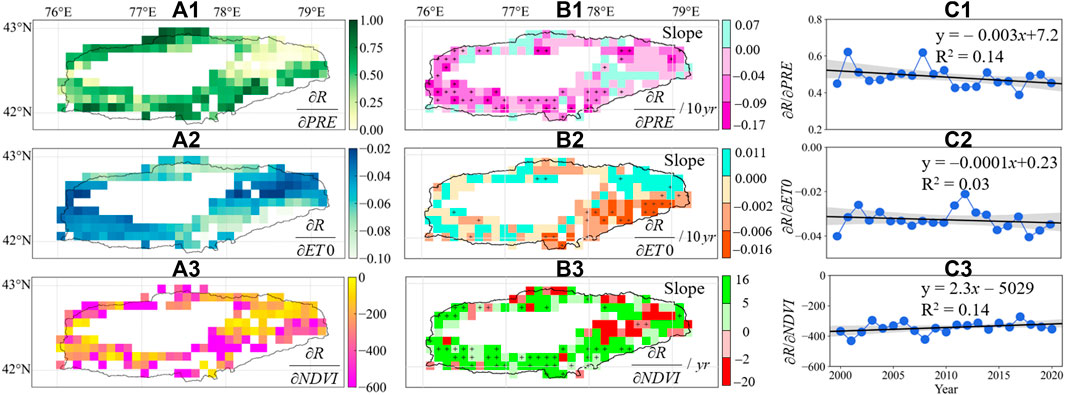
FIGURE 6. The spatial distribution of the mean (A) and slope (B) of the sensitivity coefficients for R and the temporal variation (C). R2 is the coefficient of determination of the fitted function.
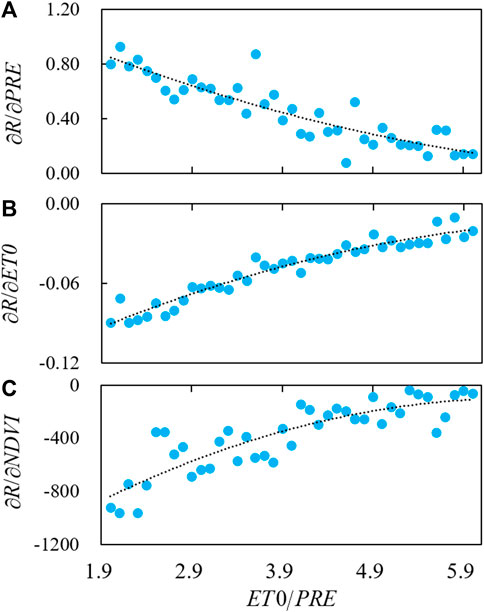
Figure 7 reveals the relationship between the sensitivity coefficient of R and the drought index. The sensitivity coefficient of R to PRE (Figure 7A) decreases with increasing drought, indicating that R is more sensitive to changes in PRE under wetter conditions. The absolute values of the sensitivity of R to ET0 (Figure 7B) and NDVI (Figure 7C) show a decreasing trend with increasing drought, indicating that ET0 and NDVI are more sensitive to changes in PRE under wetter conditions.
To illustrate the practicability of the Budyko hydrothermal coupling model in this study, we map ET/PRE and ET0/PRE at the pixel-scale (Figure 8A) and the whole regional-scale (Figure 8B) together into Budyko’s solution space, respectively. At both the pixel-scale and the whole regional-scale, all points (ET0/PRE, ET/PRE) are shifted to the right along the Budyko curve, indicating gradually drier climatic conditions in the basin. These points also show an upward shift away from the curve in Figure 8A, which indicates an increase in the actual evapotranspiration in the basin. For the same PRE and ET0 conditions, the higher the value of the underlying parameter (ω), the higher the evaporation rate (ET/PRE). This then leads to a lower R according to the water balance equation.
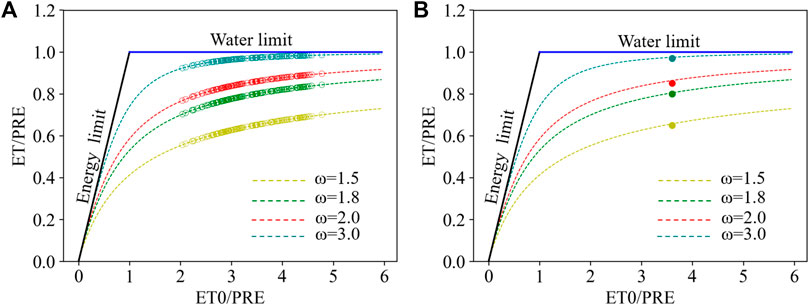
FIGURE 8. Mapping the ET/PRE and ET0/PRE into Budyko space (A) pixel-based average and (B) the regionally averaged time series.
3.4 Attribution analysis of R changes
Compared to the baseline period (2000–2010), the mean value of R for the change period (2011–2020) is lower, which results in a negative amount of R change in most of the LIKB (Figure 9A). The area with a change in R of −100 mm to −60 mm occupied 30% of the total area and was mainly distributed in the southern part of the LIKB. PRE induced changes in R were negative throughout the LIKB (Figure 9B), with the location of −10–0 mm occupying 49% of the study area and the area of −20 to −10 mm occupying 27%, mainly in the northern and southern parts of the LIKB. The change in R induced by ET0 (Figure 9C) is positive over most LIKB, with 0–4 mm and 4–10 mm areas accounting for 74% and 15% of the study area, respectively. Changes in R induced by NDVI were negative (−30–0 mm) in 59% of the study area and were primarily in the southwestern part of LIKB, while positive values (0–35 mm) were mainly in the northeastern part of LIKB (Figure 9D). For the whole LIKB (Table 1), PRE decreased by 26.58 mm, leading to a decrease in R of 12.76 mm. A decrease of 65.33 mm in ET0 and an increase of 0.003 in NDVI resulted in an increase and decrease of 1.96 and 1.18 mm in R, respectively. Regarding relative contribution, the contribution of PRE was 33.98%, and the relative contribution of ET0 and NDVI was −3.17% and 3.67%, respectively.
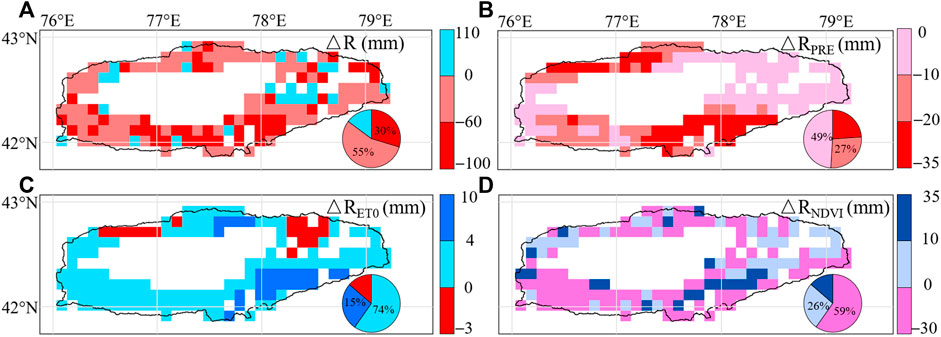
FIGURE 9. Spatial distribution of total R change (ΔR) (A) and R change due to PRE (B), ET0 (C), and NDVI (D) for the period 2000–2020.
Figure 10 shows the spatial distribution of the relative contributions of PRE, ET0, and NDVI to R change. The contribution of PRE to R change is positive in most LIKB, and areas occupy the highest proportion of the study area (73%) with 0%–50% contribution. The contribution of ET0 to R change is negative except for some areas in the northeast and the areas with −10% to 0. The contribution of NDVI to R change is negative in the eastern part of the LIKB (−35%–0), occupying 40% of the study area, and positive in the southern and northern parts of the LIKB, where the 0%–30% area occupies 49% of the study area. Figure 10D reflects the spatial distribution characteristics of the factors that dominate the change in R. During the study period, PRE played a relatively dominant role in R change, with 69% of the areas where PRE contributed more to R than ET0 and NDVI. The areas where NDVI was dominant in R change accounted for 25% of the study area, mainly in the eastern part of the LIKB, while ET0 played the least dominant role.
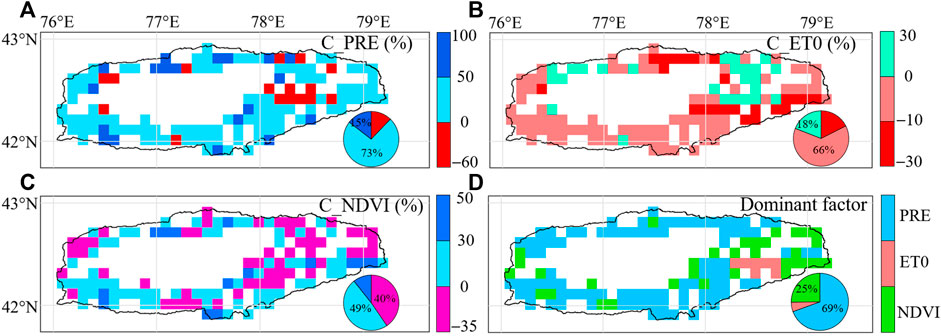
FIGURE 10. The contribution of PRE (A), ET0 (B), and NDVI (C) to R change and the spatial distri-bution of the dominant factors of R change (D).
Table 2 shows that the sensitivity of R to different climatic factors is consistent across vegetation types. The sensitivity of R to NDVI is the strongest among the three vegetation types, followed by the sensitivity of R to PRE. Regarding contribution, the highest contribution of PRE to R was shown on different vegetation types. The contribution of ET0 to R was lower than NDVI in grassland, while the opposite was observed in forest and cropland.
4 Discussion
4.1 Impact of climate factors on R
Based on the Budyko model, this study simulates changes in R in Central Asia, LIKB. R shows a slightly decreasing trend from 2000 to 2020 (Figure 5D). Previous studies have shown that R has shown a decreasing trend in most regions of the globe over the last few decades, especially in arid regions, where the decline in R has been more pronounced (Ukkola et al., 2016; Li L. et al., 2020; Lian et al., 2021). This is consistent with the findings of this study: R in Central Asia, LIKB shows a slightly decreasing trend from 2000 to 2020 (Figure 5D). As one of the essential sources of R recharge, PRE changes have been confirmed to influence regional R dynamics significantly (Ma et al., 2008a; Ning et al., 2016; Lv et al., 2019). This study found that both spatial patterns and temporal variability of R were consistent with PRE in LIKB over the study period (Figure 3). Multi-year means of PRE and R were higher in the southern and northern parts of LIKB and the spatial and temporal trends were also consistent (Figures 3A1, C1). This study suggests that the decline in PRE has eventually contributed to the decrease in R from 2000 to 2020. Contribution analysis based on the Budyko model also supports that PRE is the dominant factor in R change in LIKB relative to ET0 and NDVI (Figure 10). The contribution of PRE to the change in R is 33.98% higher than that of NDVI at 3.67% and ET0 at −3.17% (Table 1). Recent statistical analyses based on site data also indicate that the influence of climate factors on R in LIKB is mainly through changes in PRE (Alifujiang et al., 2021).
ET0 is also one of the factors influencing regional R changes (Piao et al., 2007; Song et al., 2015; Sujud and Jaafar, 2022). This study found that the change in R due to ET0 was positive in most regions (Figure 9C) because ET0 showed a decreasing trend during the study period (Figure 3C2). ET0 is directly related to atmospheric moisture demand, and a decrease in ET0 leads to a reduction in moisture transport from the surface to the atmosphere, contributing to an increase in R (Viola et al., 2017; Ning et al., 2019; Gbohoui et al., 2021). The lower contribution of ET0 to the change in R during the study period is due to the lower sensitivity coefficient of R to ET0 and the lower amount of change in ET0 (Figure 6A2). Wang H. et al. (2021) showed that the sensitivity of R to PRE and ET0 is lower in arid regions with low precipitation, which means that R is less sensitive to climate factors. These results are consistent with our study: the sensitivity coefficients of R to PRE and ET0 are strongly correlated with the aridity index, and the drier the conditions, the less sensitive R is to PRE and ET0 (Figure 7). Such a phenomenon is also found in the Shiyang River Basin and the Tarim River Basin in China (Ma et al., 2008b; Xue et al., 2017). These basins and the LIKB basin located in arid and semi-arid regions and have similar climatic characteristics: lower mean annual PRE and higher ET, suggesting that the hydrothermal conditions of the basins limit the influence of climatic factors on the R.
4.2 Impact of vegetation change on R
Vegetation links moisture transport between the land surface and the atmosphere, whose effects on R have also received extensive attention in recent years (Zhang et al., 2016; Ning et al., 2021). The vegetation directly participates in the surface water cycle through its growth. It can also indirectly influence R by altering the ratio of PRE to surface and atmospheric moisture through interception and transpiration of PRE (Luo et al., 2020a). It may be more pronounced in arid regions (Gan et al., 2021). In arid regions, where water is the most limiting factor for vegetation growth (Yu et al., 2022a; Yu et al., 2023), vegetation will use the most available water, leaving only a smaller amount to resupply R. Recent analyses based on global scales have shown that the sensitivity of R to vegetation is higher and even higher in drylands than the sensitivity of R to climatic factors (Song et al., 2015; Luo et al., 2020a). Our study also supports the finding that the sensitivity of R to NDVI is higher than that of R to PRE and ET0 in the LIKB, an inland river basin in the arid region (Figure 6A3). Although the sensitivity of R to both NDVI and climatic factors decreases with increasing dry conditions, R is still more sensitive to NDVI than to climatic factors (Figure 7). In addition, vegetation growth accelerates terrestrial water loss through denser, rougher canopies and deeper root systems (Luo et al., 2020a). Our results suggest that a slight increase in NDVI leads to a decrease in R in LIKB. Previous studies have shown that the change of R is also regulated by vegetation phenology: an advance in phenology can contribute to a deficit in surface water resources and induce drought (Lian et al., 2020; Wang et al., 2020). The relationship between vegetation growth and regional water resources should be balanced. Unreasonable vegetation growth (e.g., excessive afforestation) may extract too much surface water, reducing R and threatening the security of surface water resources (Cao et al., 2011; Zhang et al., 2018). In our study, NDVI changes had a relatively small impact on LIKB surface water resources. They contributed less to R changes than climatic factors due to smaller changes in NDVI. However, NDVI variations can lead to changes in the parameter ω and turn to changes in R. Luo et al. (2020a) showed that parameter ω is also influenced by soil type and topography and that these factors also affect vegetation dynamics, which together contribute to R.
4.3 Uncertainties
This study quantifies the relative contribution of climatic factors and vegetation to changes in R of LIKB. However, there are still some limitations to the current research. Attribution through the Budyko model assumes that the water storage changes in closed basins are negligible annually. However, changes in water storage are related to groundwater dynamics, especially soil moisture (SM). Neglecting changes in SM may be one of the factors contributing to higher modelling results (Figure 4). Based on ERA5 data, we found that SM varied less in LIKB (Supplementary Figure S1), with Slope values ranging from −0.5 to 0.5 mm/yr, indicating that SM changes have a relatively small effect on water storage. Many factors influence changes in basin R. Besides PRE, ET0, and vegetation dynamics, human activities such as water project construction, irrigation, and land use change can also impact regional R dynamics (Liang et al., 2015; Gao et al., 2016; Ning et al., 2016). However, this study did not analyze human activity and could not be quantified by the Budyko model. Furthermore, LIKB is an alpine lake basin, and its R changes are also influenced by the recharge of snow melt water (Alymkulova et al., 2016; Zhang et al., 2022). In our study, the R obtained from the water balance also does not consider the effect of snowmelt variability, which may impact the R estimates. Moreover, limited by the difficulty of obtaining observational data in the study area, we used remotely sensed and reanalyzed data to reveal the relationship between changes in R and driving factors. Although ET from remotely sensed MODIS is consistent and highly correlated with the temporal dynamics (Supplementary Figure S2) of the widely used Global Land Evaporation Amsterdam Model (GLEAM) and TerraClimate (TERR), flaws in the MODIS ET computational algorithms and errors introduced by the sensors still exist. The errors in the above data may bring some uncertainties to the study results. In future work, we will use higher resolution data to simulate R, and the above uncertainties and factors affecting R will be incorporated into the Budyko model to improve the understanding of the R variability of LIKB. The hydrological models such as SWAT, VIC, and HEC can mechanistically reveal the changes of R in the basin (Chen et al., 2019; Bharat and Mishra, 2021; Zhang et al., 2021). In future studies, R is evaluated in combination with hydrological models and observational data to improve the understanding of R changes in LIKB.
5 Conclusion
Based on the Budyko model, this study reveals the influence of climate factors and vegetation changes on the R of LIKB in Central Asian inland lake basins from 2000 to 2020. This study finds that PRE and ET0 show decreasing characteristics during the study period, while NDVI, which characterizes vegetation greenness, and the basin underlying parameter ω show a slightly increasing trend. The Budyko model captures the dynamics of R in the LIKB with a coefficient of determination of 0.58, and showed a decreasing trend during the study period. This study to determine the baseline and period of change in R, the breakpoint of R for the period 2000–2020 was identified as 2011 through the M-K statistical method. The R series was divided into a baseline period (2000–2010) and a change period (2011–2020) by mutation point. R showed a decreasing trend in the baseline period and an increasing trend in the change period (1.8 mm/yr).
The sensitivity coefficients of R to PRE, ET0, and NDVI show mean values of 0.48, −0.03, and −343.31 for R to PRE, ET0, and NDVI, respectively, throughout the study period. Regarding spatial pattern, the sensitivity coefficient of R to PRE is positive throughout LIKB. The sensitivity coefficients of R to ET0 and NDVI showed a consistent spatial way: the absolute values of sensitivity coefficients were higher in south-eastern LIKB and lower in northeastern LIKB. The sensitivity of R to changes in PRE, ET0, and NDVI decreased with increasing drought, indicating that R was more sensitive to changes in PRE, ET0, and NDVI under wetter conditions.
Analysis of the contribution to R changes showed that most PRE induced R changes were negative across LIKB, mainly in the northern and southern parts of LIKB. ET0 induced R changes were positive in most of LIKB, R induced modifications by NDVI were negative in 59% of the study area (–30–0 mm). For the LIKB as a whole, PRE decreased by 26.58 mm, leading to a decrease in R of 12.76 mm. A decrease of 65.33 mm in ET0 and an increase of 0.003 in NDVI resulted in an increase and decrease of 1.96 and 1.18 mm in R, respectively. Among all of them, the relative contributions of PRE, ET0, and NDVI to R were 33.98%, −3.17%, and 3.67%, respectively. PRE plays a relatively dominant role in R change, with 69% of the areas where PRE contributes more to R than ET0 and NDVI. NDVI plays a dominant role in R change in 25% of the study area, mainly in the eastern part of LIKB, while ET0 plays the least dominant role. Zheng et al., 2021.
Data availability statement
The original contributions presented in the study are included in the article/Supplementary Material, further inquiries can be directed to the corresponding author.
Author contributions
YA and JA designed the research. PF processed the data and wrote the manuscript. NL and YJ provided the analysis tools and technical assistance. All authors contributed to the article and approved the submitted version.
Funding
This study was supported by the State Key Laboratory of Desert and Oasis Ecology, Xinjiang Institute of Ecology and Geography, Chinese Academy of Sciences, Open-ended fund (G2022-02-05), the National Natural Science Foundation of China (42171014, 42307523), Doctoral Research Startup Foundation of Xinjiang University (BS180245), and 100 Young Doctors Introduction Program of Xinjiang (Tianchi Doctor Program) Foundation (tcbs201819).
Acknowledgments
The authors are very grateful to the Climate Research Unit (CRU 4.06) dataset (https://crudata.uea.ac.uk/cru/data/hrg/), the European Reanalysis-Interim v5 (ERA5), the Resource Environment Data Cloud (https://www.resdc.cn/), and the Moderate Resolution Imaging Spectroradiometer (MODIS) (https://lpdaac.usgs.gov/data/). We are grateful to the editor and reviewers for their constructive comments and suggestions for improving the manuscript.
Conflict of interest
The authors declare that the research was conducted in the absence of any commercial or financial relationships that could be construed as a potential conflict of interest.
Publisher’s note
All claims expressed in this article are solely those of the authors and do not necessarily represent those of their affiliated organizations, or those of the publisher, the editors and the reviewers. Any product that may be evaluated in this article, or claim that may be made by its manufacturer, is not guaranteed or endorsed by the publisher.
Supplementary material
The Supplementary Material for this article can be found online at: https://www.frontiersin.org/articles/10.3389/feart.2023.1251759/full#supplementary-material
References
Alifujiang, Y., Abuduwaili, J., Groll, M., Issanova, G., and Maihemuti, B. (2021). Changes in intra-annual runoff and its response to climate variability and anthropogenic activity in the Lake Issyk-Kul Basin, Kyrgyzstan. Catena 198, 104974. doi:10.1016/j.catena.2020.104974
Alifujiang, Y., Abuduwaili, J., Ma, L., Samat, A., and Groll, M. (2017). System dynamics modeling of water level variations of Lake Issyk-Kul, Kyrgyzstan. Kyrg. Water 9 (12), 989. doi:10.3390/w9120989
Allen, R. G., Pereira, L. S., Raes, D., and Smith, M. (1998). Crop evapotranspiration-Guidelines for computing crop water requirements-FAO Irrigation and drainage paper 56. Fao, Rome 300 (9), D05109.
Alymkulova, B., Abuduwaili, J., Issanova, G., and Nahayo, L. (2016). Consideration of water uses for its sustainable management, the case of issyk-kul lake, Kyrgyzstan. Water 8 (7), 298. doi:10.3390/w8070298
Bai, J., Shi, H., Yu, Q., Xie, Z., Li, L., Luo, G., et al. (2019). Satellite-observed vegetation stability in response to changes in climate and total water storage in Central Asia. Sci. Total Environ. 659, 862–871. doi:10.1016/j.scitotenv.2018.12.418
Bharat, S., and Mishra, V. (2021). Runoff sensitivity of Indian sub-continental river basins. Sci. Total Environ. 766, 142642. doi:10.1016/j.scitotenv.2020.142642
Cao, S., Chen, L., Shankman, D., Wang, C., Wang, X., and Zhang, H. (2011). Excessive reliance on afforestation in China's arid and semi-arid regions: lessons in ecological restoration. Earth-Science Rev. 104 (4), 240–245. doi:10.1016/j.earscirev.2010.11.002
Chen, Y. N., Li, Z., Fan, Y. T., Wang, H. J., and Deng, H. J. (2015). Progress and prospects of climate change impacts on hydrology in the arid region of northwest China. Environ. Res. 139, 11–19. doi:10.1016/j.envres.2014.12.029
Chen, Y., Xu, C. Y., Chen, X., Xu, Y., Yin, Y., Gao, L., et al. (2019). Uncertainty in simulation of land-use change impacts on catchment runoff with multi-timescales based on the comparison of the HSPF and SWAT models. J. Hydrology 573, 486–500. doi:10.1016/j.jhydrol.2019.03.091
Duan, Y. C., Liu, T., Meng, F., Yuan, Y., Luo, M., Huang, Y., et al. (2020). Accurate simulation of ice and snow runoff for the mountainous terrain of the kunlun mountains, China. Remote Sens. 12 (1), 179. doi:10.3390/rs12010179
Fu, B. (1981). On the calculation of the evaporation from land surface. Sci.Atmos. Sin. 5 (1), 23–31. doi:10.3878/j.issn.1006-9895.1981.01.03
Gan, G., Liu, Y., and Sun, G. (2021). Understanding interactions among climate, water, and vegetation with the Budyko framework. Earth-Science Rev. 212, 103451. doi:10.1016/j.earscirev.2020.103451
Gao, G., Fu, B., Wang, S., Liang, W., and Jiang, X. (2016). Determining the hydrological responses to climate variability and land use/cover change in the Loess Plateau with the Budyko framework. Sci. Total Environ. 557-558, 331–342. doi:10.1016/j.scitotenv.2016.03.019
Gbohoui, Y. P., Paturel, J. E., Tazen, F., Mounirou, L. A., Yonaba, R., Karambiri, H., et al. (2021). Impacts of climate and environmental changes on water resources: a multi-scale study based on Nakanbé nested watersheds in West African Sahel. J. Hydrology Regional Stud. 35, 100828. doi:10.1016/j.ejrh.2021.100828
Hersbach, H., Bell, B., Berrisford, P., Hirahara, S., Horányi, A., Muñoz-Sabater, J., et al. (2020). The ERA5 global reanalysis. Q. J. R. Meteorological Soc. 146 (730), 1999–2049. doi:10.1002/qj.3803
Hu, Y. A., Duan, W., Chen, Y., Zou, S., Kayumba, P. M., and Sahu, N. (2021a). An integrated assessment of runoff dynamics in the Amu Darya River Basin: confronting climate change and multiple human activities, 1960-2017. J. Hydrology 603, 126905. doi:10.1016/j.jhydrol.2021.126905
Hu, Z., Zhang, Z., Sang, Y. F., Qian, J., Feng, W., Chen, X., et al. (2021b). Temporal and spatial variations in the terrestrial water storage across Central Asia based on multiple satellite datasets and global hydrological models. J. Hydrology 596, 126013. doi:10.1016/j.jhydrol.2021.126013
Huang, P. N., Li, Z. J., Chen, J., Li, Q. L., and Yao, C. (2016). Event-based hydrological modeling for detecting dominant hydrological process and suitable model strategy for semi-arid catchments. J. Hydrology 542, 292–303. doi:10.1016/j.jhydrol.2016.09.001
Jiang, C., Xiong, L., Wang, D., Liu, P., Guo, S., and Xu, C. Y. (2015). Separating the impacts of climate change and human activities on runoff using the Budyko-type equations with time-varying parameters. J. Hydrology 522, 326–338. doi:10.1016/j.jhydrol.2014.12.060
Jiang, L. L., Jiapaer, G., Bao, A. M., Guo, H., and Ndayisaba, F. (2017). Vegetation dynamics and responses to climate change and human activities in Central Asia. Sci. Total Environ. 599, 967–980. doi:10.1016/j.scitotenv.2017.05.012
Johnston, R., and Smakhtin, V. (2014). Hydrological modeling of large river basins: how much is enough? Water Resour. Manag. 28 (10), 2695–2730. doi:10.1007/s11269-014-0637-8
Kawabata, A., Ichii, K., and Yamaguchi, Y. (2001). Global monitoring of interannual changes in vegetation activities using NDVI and its relationships to temperature and precipitation. Int. J. Remote Sens. 22 (7), 1377–1382. doi:10.1080/01431160119381
Khamzina, A., Lamers, J. P. A., and Vlek, P. L. G. (2008). Tree establishment under deficit irrigation on degraded agricultural land in the lower Amu Darya River region, Aral Sea Basin. For. Ecol. Manage. 255 (1), 168–178. doi:10.1016/j.foreco.2007.09.005
Li, H., Shi, C., Sun, P., Zhang, Y., and Collins, A. L. (2021). Attribution of runoff changes in the main tributaries of the middle Yellow River, China, based on the Budyko model with a time-varying parameter. Catena 206, 105557. doi:10.1016/j.catena.2021.105557
Li, L., Ni, J., Chang, F., Yue, Y., Frolova, N., Magritsky, D., et al. (2020a). Global trends in water and sediment fluxes of the world's large rivers. Sci. Bull. 65 (1), 62–69. doi:10.1016/j.scib.2019.09.012
Li, Z. L., Li, Q. J., Wang, J., Feng, Y. R., and Shao, Q. X. (2020b). Impacts of projected climate change on runoff in upper reach of Heihe River basin using climate elasticity method and GCMs. Sci. Total Environ. 716, 137072. doi:10.1016/j.scitotenv.2020.137072
Li, Z., Ning, T., Li, J., and Yang, D. (2017). Spatiotemporal variation in the attribution of streamflow changes in a catchment on China's Loess Plateau. Catena 158, 1–8. doi:10.1016/j.catena.2017.06.008
Lian, X., Piao, S., Chen, A., Huntingford, C., Fu, B., Li, L. Z. X., et al. (2021). Multifaceted characteristics of dryland aridity changes in a warming world. Nat. Rev. Earth Environ. 2 (4), 232–250. doi:10.1038/s43017-021-00144-0
Lian, X., Piao, S., Li, L. Z. X., Li, Y., Huntingford, C., Ciais, P., et al. (2020). Summer soil drying exacerbated by earlier spring greening of northern vegetation. Sci. Adv. 6 (1), eaax0255. doi:10.1126/sciadv.aax0255
Liang, W., Bai, D., Wang, F., Fu, B., Yan, J., Wang, S., et al. (2015). Quantifying the impacts of climate change and ecological restoration on streamflow changes based on a Budyko hydrological model in China's Loess Plateau. Water Resour. Res. 51 (8), 6500–6519. doi:10.1002/2014wr016589
Liu, J. Y., Kuang, W., Zhang, Z., Xu, X., Qin, Y., Ning, J., et al. (2014). Spatiotemporal characteristics, patterns, and causes of land-use changes in China since the late 1980s. J. Geogr. Sci. 24 (2), 195–210. doi:10.1007/s11442-014-1082-6
Luo, M., Liu, T., Meng, F., Duan, Y., Bao, A., Xing, W., et al. (2019). Identifying climate change impacts on water resources in Xinjiang, China. Sci. total Environ. 676, 613–626. doi:10.1016/j.scitotenv.2019.04.297
Luo, Y., Yang, Y., Yang, D., and Zhang, S. (2020). Quantifying the impact of vegetation changes on global terrestrial runoff using the Budyko framework. J. Hydrology 590, 125389. doi:10.1016/j.jhydrol.2020.125389
Lv, X. Z., Liu, S., Li, S., Ni, Y., Qin, T., and Zhang, Q. (2021). Quantitative estimation on contribution of climate changes and watershed characteristic changes to decreasing streamflow in a typical basin of Yellow River. Front. Earth Sci. 9. doi:10.3389/feart.2021.752425
Lv, X., Zuo, Z., Ni, Y., Sun, J., and Wang, H. (2019). The effects of climate and catchment characteristic change on streamflow in a typical tributary of the Yellow River. Sci. Rep. 9 (1), 14535. doi:10.1038/s41598-019-51115-x
Ma, Z., Kang, S., Zhang, L., Tong, L., and Su, X. (2008). Analysis of impacts of climate variability and human activity on streamflow for a river basin in arid region of northwest China. J. Hydrology 352 (3-4), 239–249. doi:10.1016/j.jhydrol.2007.12.022
Mann, H. B. (1945). Nonparametric tests against trend. Econometrica 13 (3), 245–259. doi:10.2307/1907187
Nash, L. L., and Gleick, P. H. (1991). SENSITIVITY OF STREAMFLOW IN THE COLORADO BASIN TO CLIMATIC CHANGES. J. Hydrology 125 (3-4), 221–241. doi:10.1016/0022-1694(91)90030-l
Ni, Y., Yu, Z., Lv, X., Qin, T., Yan, D., Zhang, Q., et al. (2022). Spatial difference analysis of the runoff evolution attribution in the Yellow River Basin. J. Hydrology 612, 128149. doi:10.1016/j.jhydrol.2022.128149
Ning, T., Li, Z., Feng, Q., Li, Z., and Qin, Y. (2021). Attribution of growing season evapotranspiration variability considering snowmelt and vegetation changes in the arid alpine basins. Hydrology Earth Syst. Sci. 25 (6), 3455–3469. doi:10.5194/hess-25-3455-2021
Ning, T., Li, Z., and Liu, W. (2016). Separating the impacts of climate change and land surface alteration on runoff reduction in the Jing River catchment of China. Catena 147, 80–86. doi:10.1016/j.catena.2016.06.041
Ning, T., Zhou, S., Chang, F., Shen, H., Li, Z., and Liu, W. (2019). Interaction of vegetation, climate and topography on evapotranspiration modelling at different time scales within the Budyko framework. Agric. For. Meteorology 275, 59–68. doi:10.1016/j.agrformet.2019.05.001
Piao, S. L., Friedlingstein, P., Ciais, P., de Noblet-Ducoudré, N., Labat, D., and Zaehle, S. (2007). Changes in climate and land use have a larger direct impact than rising CO2 on global river runoff trends. Proc. Natl. Acad. Sci. U. S. A. 104 (39), 15242–15247. doi:10.1073/pnas.0707213104
Roderick, M. L., and Farquhar, G. D. (2011). A simple framework for relating variations in runoff to variations in climatic conditions and catchment properties. Water Resour. Res. 47 (12). doi:10.1029/2010wr009826
Sanchez, P. A., Ahamed, S., Carré, F., Hartemink, A. E., Hempel, J., Huising, J., et al. (2009). Digital soil map of the world. Science 325 (5941), 680–681. doi:10.1126/science.1175084
Shen, Q. N., Cong, Z. T., and Lei, H. M. (2017). Evaluating the impact of climate and underlying surface change on runoff within the Budyko framework: a study across 224 catchments in China. J. Hydrology 554, 251–262. doi:10.1016/j.jhydrol.2017.09.023
Shi, H., Luo, G., Zheng, H., Chen, C., Hellwich, O., Bai, J., et al. (2021). A novel causal structure-based framework for comparing a basin-wide water–energy–food–ecology nexus applied to the data-limited Amu Darya and Syr Darya river basins. Hydrology Earth Syst. Sci. 25 (2), 901–925. doi:10.5194/hess-25-901-2021
Song, X., Zhang, J., Zhan, C., Xuan, Y., Ye, M., and Xu, C. (2015). Global sensitivity analysis in hydrological modeling: review of concepts, methods, theoretical framework, and applications. J. Hydrology 523, 739–757. doi:10.1016/j.jhydrol.2015.02.013
Sorg, A., Bolch, T., Stoffel, M., Solomina, O., and Beniston, M. (2012). Climate change impacts on glaciers and runoff in Tien Shan (Central Asia). Nat. Clim. Change 2 (10), 725–731. doi:10.1038/nclimate1592
Sujud, L. H., and Jaafar, H. H. (2022). A global dynamic runoff application and dataset based on the assimilation of GPM, SMAP, and GCN250 curve number datasets. Sci. data 9 (1), 706. doi:10.1038/s41597-022-01834-0
Ukkola, A. M., Prentice, I., Keenan, T. F., van Dijk, A. I., Viney, N. R., Myneni, R., et al. (2016). Reduced streamflow in water-stressed climates consistent with CO2 effects on vegetation. Nat. Clim. Change 6 (1), 75–78. doi:10.1038/nclimate2831
Veldkamp, T. I. E., Zhao, F., Ward, P. J., de Moel, H., Aerts, J. C. J. H., Schmied, H. M., et al. (2018). Human impact parameterizations in global hydrological models improve estimates of monthly discharges and hydrological extremes: a multi-model validation study. Environ. Res. Lett. 13 (5), 055008. doi:10.1088/1748-9326/aab96f
Viola, F., Caracciolo, D., Forestieri, A., Pumo, D., and Noto, L. V. (2017). Annual runoff assessment in arid and semiarid Mediterranean watersheds under the Budyko's framework. Hydrol. Process. 31 (10), 1876–1888. doi:10.1002/hyp.11145
Wang, D., and Tang, Y. (2014). A one-parameter Budyko model for water balance captures emergent behavior in darwinian hydrologic models. Geophys. Res. Lett. 41 (13), 4569–4577. doi:10.1002/2014gl060509
Wang, F., Duan, K., Fu, S., Gou, F., Liang, W., Yan, J., et al. (2019). Partitioning climate and human contributions to changes in mean annual streamflow based on the Budyko complementary relationship in the Loess Plateau, China. Sci. total Environ. 665, 579–590. doi:10.1016/j.scitotenv.2019.01.386
Wang, H., Lv, X., and Zhang, M. (2021a). Sensitivity and attribution analysis based on the Budyko hypothesis for streamflow change in the Baiyangdian catchment, China. Ecol. Indic. 121, 107221. doi:10.1016/j.ecolind.2020.107221
Wang, S., Zhang, Y., Ju, W., Porcar-Castell, A., Ye, S., Zhang, Z., et al. (2020). Warmer spring alleviated the impacts of 2018 European summer heatwave and drought on vegetation photosynthesis. Agric. For. Meteorology 295, 108195. doi:10.1016/j.agrformet.2020.108195
Wang, X., Chen, Y., Li, Z., Fang, G., Wang, F., and Hao, H. (2021b). Water resources management and dynamic changes in water politics in the transboundary river basins of Central Asia. Hydrology Earth Syst. Sci. 25 (6), 3281–3299. doi:10.5194/hess-25-3281-2021
Wu, J., Miao, C., Wang, Y., Duan, Q., and Zhang, X. (2017). Contribution analysis of the long-term changes in seasonal runoff on the Loess Plateau, China, using eight Budyko-based methods. J. Hydrology 545, 263–275. doi:10.1016/j.jhydrol.2016.12.050
Xu, C. C., Chen, Y. N., Chen, Y. P., Zhao, R. F., and Ding, H. (2013a). Responses of surface runoff to climate change and human activities in the arid region of central Asia: a case study in the Tarim River Basin, China. Environ. Manage. 51 (4), 926–938. doi:10.1007/s00267-013-0018-8
Xu, J. (2011). Variation in annual runoff of the Wudinghe River as influenced by climate change and human activity. Quat. Int. 244 (2), 230–237. doi:10.1016/j.quaint.2010.09.014
Xu, X., Yang, D., Yang, H., and Lei, H. (2014). Attribution analysis based on the Budyko hypothesis for detecting the dominant cause of runoff decline in Haihe basin. J. Hydrology 510, 530–540. doi:10.1016/j.jhydrol.2013.12.052
Xu, X. Y., Yang, H. B., Yang, D. W., and Ma, H. (2013b). Assessing the impacts of climate variability and human activities on annual runoff in the Luan River basin, China. Hydrology Res. 44 (5), 940–952. doi:10.2166/nh.2013.144
Xue, L. Q., Yang, F., Yang, C., Chen, X., Zhang, L., Chi, Y., et al. (2017). Identification of potential impacts of climate change and anthropogenic activities on streamflow alterations in the Tarim River Basin, China. Sci. Rep. 7, 8254. doi:10.1038/s41598-017-09215-z
Yang, H. B., Yang, D. W., Lei, Z. D., and Sun, F. B. (2008b). New analytical derivation of the mean annual water-energy balance equation. Water Resour. Res. 44 (3). doi:10.1029/2007wr006135
Yang, H., Yang, D., Lei, Z., and Sun, F. (2008a). New analytical derivation of the mean annual water-energy balance equation. Water Resour. Res. 44 (3). doi:10.1029/2007wr006135
Yang, L., Feng, Q., Adamowski, J. F., Alizadeh, M. R., Yin, Z., Wen, X., et al. (2021). The role of climate change and vegetation greening on the variation of terrestrial evapotranspiration in northwest China's Qilian Mountains. Sci. total Environ. 759, 143532. doi:10.1016/j.scitotenv.2020.143532
Yu, T., Jiapaer, G., Long, G., Li, X., Jing, J., Liu, Y., et al. (2022b). Interannual and seasonal relationships between photosynthesis and summer soil moisture in the Ili River basin. Xinjiang, 2000–2018. The Science of the total environment. 856, 159191. doi:10.1016/j.scitotenv.2022.159191
Yu, T., Guli·Jiapaer, , Bao, A., Zhang, J., Tu, H., Chen, B., et al. (2023). Evaluating surface soil moisture characteristics and the performance of remote sensing and analytical products in Central Asia. J. Hydrology 617, 128921. doi:10.1016/j.jhydrol.2022.128921
Yu, T., Jiapaer, G., Bao, A., Zheng, G., Zhang, J., Li, X., et al. (2022a). Disentangling the relative effects of soil moisture and vapor pressure deficit on photosynthesis in dryland Central Asia. Ecol. Indic. 137, 108698. doi:10.1016/j.ecolind.2022.108698
Yuan, Y., Diushen, M., Bakytbek, E., Shang, H., Gao, Y., Huang, L., et al. (2019). Tree ring record of annual runoff for Issyk lake, central Asia. J. Water Clim. Change 10 (3), 610–623. doi:10.2166/wcc.2018.232
Zhang, G. T., Cui, P., Jin, W., Zhang, Z., Wang, H., Bazai, N. A., et al. (2021). Changes in hydrological behaviours triggered by earthquake disturbance in a mountainous watershed. Sci. Total Environ. 760, 143349. doi:10.1016/j.scitotenv.2020.143349
Zhang, S., Yang, D., Yang, Y., Piao, S., Yang, H., Lei, H., et al. (2018). Excessive afforestation and soil drying on China's loess plateau. J. Geophys. Res. Biogeosciences 123 (3), 923–935. doi:10.1002/2017jg004038
Zhang, S., Yang, H., Yang, D., and Jayawardena, A. W. (2016). Quantifying the effect of vegetation change on the regional water balance within the Budyko framework. Geophys. Res. Lett. 43 (3), 1140–1148. doi:10.1002/2015gl066952
Zhang, Y., Wang, N., Yang, X., and Mao, Z. (2022). The dynamic changes of Lake Issyk-Kul from 1958 to 2020 based on multi-source satellite data. Remote Sens. 14 (7), 1575. doi:10.3390/rs14071575
Keywords: budyko model, runoff, climate factors, vegetation, NDVI, Lake Issyk-Kul Basin
Citation: Feng P, Alifujiang Y, Abuduwaili J, Lu N and Jiang Y (2023) Quantifying the impact of climate and vegetation changes on runoff based on the budyko framework in the Lake Issyk-Kul Basin, Kyrgyzstan. Front. Earth Sci. 11:1251759. doi: 10.3389/feart.2023.1251759
Received: 02 July 2023; Accepted: 13 October 2023;
Published: 31 October 2023.
Edited by:
Muhammad Ashraf, Khwaja Fareed University of Engineering and Information Technology (KFUEIT), PakistanCopyright © 2023 Feng, Alifujiang, Abuduwaili, Lu and Jiang. This is an open-access article distributed under the terms of the Creative Commons Attribution License (CC BY). The use, distribution or reproduction in other forums is permitted, provided the original author(s) and the copyright owner(s) are credited and that the original publication in this journal is cited, in accordance with accepted academic practice. No use, distribution or reproduction is permitted which does not comply with these terms.
*Correspondence: Yilinuer Alifujiang, ZXl1MTEwM0B4anUuZWR1LmNu; Jilili Abuduwaili, amlsaWxAbXMueGpiLmFjLmNu
†These authors have contributed equally to this work
 Pingping Feng
 Yilinuer Alifujiang
 Jilili Abuduwaili3,4,5*†