 Ruiheng Xie
 Chunhua Liao1,2*
- 1Hunan Meteorological Service Centre, Changsha, China
- 2Key Laboratory for Meteorological Prevention and Mitigation of Disasters in Hunan Province, Changsha, China
The study of road surface temperature (Ts) characteristics in winter and the early warning method of road icing is of great significance to reduce traffic accidents and improve transportation efficiency. Using the hourly observation data of Hunan traffic meteorological stations from December 2020 to February 2022, this study analyzes the winter Ts characteristics of ordinary roads in Hunan Province, and uses the Logistic regression model to establish the temperature threshold for icing of ordinary roads in the province. So as to build a road icing early warning model hierarchically. The results show that the Ts in southern Hunan is relatively high, the Ts at most stations is above 10 °C, and the low Ts area is in western Hunan, and the stations below 8 °C are mostly distributed in this area. This may be due to the higher altitude in western Hunan. In terms of diurnal variation, the lowest value of average Ts and air temperature (Ta) in Hunan Province in winter both appeared at 7:00 Beijing Time (BT), while the highest value appeared at 15:00 BT, and the average Ta is always lower than the Ts. The temperature variation on the bridge surface is more pronounced. When the Ta is lower than −2.5 °C, more than 70% of the sites have a rapid increase in the risk of icing; and when the Ta is lower than −5°C, nearly 87% of the sites have a risk level of 4, which means icing risk is extremely high. Furthermore, combining the warning model with thermal spectrum mapping can improve the spatial resolution of the warning model and also solve the problem of lack of observations in some areas.
1 Introduction
With the rapid development of Chinese economy, domestic highway construction is undergoing significant changes (Jing et al., 2023). Highways play a crucial role in our daily lives and production. By the end of 2017, the total length of existing roads in China had exceeded 4.7 million kilometers, with each province having over 500,000 km of roads that play a leading role. Meteorological disasters such as heavy fog, torrential rain, and road icing can cause damage to road facilities, traffic delays, and accidents, thereby significantly impacting transportation and road safety (Chen et al., 2017; Tian et al., 2018). Among these disasters, road icing is one of the most significant meteorological conditions that affect transportation safety. It has been included by the China Meteorological Administration as one of the first batch of sudden meteorological disasters requiring warning signals (Xin and Xu, 2007; Strong et al., 2010). Road icing occurs when precipitation, such as rain, snow, freezing rain, or fog droplets, comes into contact with the ground at a temperature below 0 °C, resulting in the accumulation of snow or ice. It is the main meteorological disaster that affects normal road operation during winter (Liu and Rao, 2020). Road icing significantly reduces the friction coefficient of tires, thus affecting driving and braking performance, increasing the risk of vehicle skidding or brake failure, and elevating the likelihood of accidents (Kamenchukov et al., 2020).
As early as the 1990s, many scholars had conducted in-depth research on forecasting road surface temperature (abbreviated as Ts). They utilized statistical models and energy balance methods to forecast meteorological conditions like water accumulation and road icing (Sass, 1992; Bouilloud et al., 2009; Berrocal et al., 2010). Shao and Lister (1996) extended the winter Ts and humidity forecasting model to Europe and Japan, demonstrating its high accuracy in predicting ice conditions. Based on pavement factors and basic urban properties, Meng (2018) developed a refined model for predicting pavement parameters and found that solar radiation correction factors, asphalt depth, and asphalt thermal conductivity are important parameters for simulating Ts. In addition, Canada developed the METRo warning model for Ts, which considers various phases of road surface water and calculate Ts based on energy balance methods (Crevier and Delage, 2001). This model has been successfully implemented in multiple countries (Sokol et al., 2014). In contrast to physical models, statistical models require substantial measured data, but they overcome the disadvantages of complex forms, numerous and difficult-to-obtain parameters, and laborious calculations. Typically, statistical models are constructed by linear or nonlinear models between Ts and other meteorological elements (Bai et al., 2022). Kršmanc et al. (2013) employed stepwise linear regression method with different input parameters and time intervals to predict Ts. Marchetti et al. (2015) conducted principal component analysis to study the impact of road surface features and subgrade morphology on Ts.
The Logistic regression model is a generalized linear regression model primarily used for binary classification problems that cannot be addressed by ordinary linear regression models. By using certain mathematical methods, it transforms the values of variables into the probability space of (0,1), allowing the establishment of different meteorological risk levels based on probabilities. Logistic regression models are commonly employed to develop meteorological warning and forecasting models (Mohr et al., 2015; Pang et al., 2019). Luo et al. (2007) utilized a logistic regression model to establish an early warning model for traffic accidents, combining meteorological observations and road traffic accident data in Xi’an City. The model exhibited high predictive accuracy. Similarly, based on a logistic regression model, Bai et al. (2016) analyzed the frequency of bridge and road surface icing temperature conditions relative to changes in ambient air temperature. They established a risk probability model for road icing temperature conditions and constructed a warning model for the risk levels of ice formation on the Wuying Expressway’s bridges and road surfaces.
Currently, there is a significant focus on expressways in research, while ordinary roads, such as national and provincial roads, receive comparatively less attention. However, compared to expressways, the environmental conditions of ordinary roads are more complex, with different road surface materials and heat absorption characteristics. Therefore, it is necessary to carry out corresponding research on ordinary roads. This study utilizes data from the Hunan provincial traffic meteorological stations to analyze the spatiotemporal distribution characteristics of winter Ts. By applying a logistic regression model, temperature thresholds for different levels of road icing in Hunan Province are calculated. Consequently, a road icing warning model for ordinary roads in the province is constructed. The aim of this study is to enhance the capability of traffic meteorological forecasting services in Hunan Province, fill the gap in road icing prediction and warning methods for ordinary roads, reduce traffic accidents, improve transportation efficiency, and provide theoretical support for decision making and management in the transportation sectors.
2 Materials and methods
2.1 Study area
The study area is Hunan Province (108°47′-114°15′E, and 24°38′-30°08′N), which is located in central China. It is a transitional zone from the Yungui Plateau to the Jiangnan hills and Nanling Mountains to the Jianghan Plain, and belongs to the sub-tropical monsoon climate. The terrain is shaped like a horseshoe with three sides surrounded by mountains and facing north. As of 2020, the total length of highways in Hunan Province exceeded 240,000 km. The heavy snowfall events that occurred in 2008 had a significant impact on transportation, further highlighting the importance of research on road icing (Zhao et al., 2008).
2.2 Data description
The study selected observation data of hourly road surface temperature and air temperature from 313 traffic meteorological stations during the winter seasons of 2020 and 2021 (i.e., from December 2020 to February 2021 and from December 2021 to February 2022) for analysis. The traffic blockage data used in this study was obtained from the Hunan Provincial Highway Affairs Center of Department of transportation of Hunan Province and encompasses blockage information from Hunan Province in 2018 and 2019.
Like all weather stations, there are varying degrees of missing data in the observations recorded by traffic meteorological stations. Prior to analysis, we conducted some quality control measures. We first removed outliers from the data, such as air temperatures (abbreviated as Ta) above 35 °C or below −20 °C, and Ts above 40 °C or below −20 °C. Then we verified the reliability of traffic meteorological station data by comparing it with temperatures from nearby meteorological stations. If the difference between Ta exceeded 3 °C, it was also considered an outlier and removed. Finally, we excluded sites with less than 80% data completeness. After screening, data with high completeness and credibility were obtained from 224 sites, as shown in Figure 1 for site distribution.
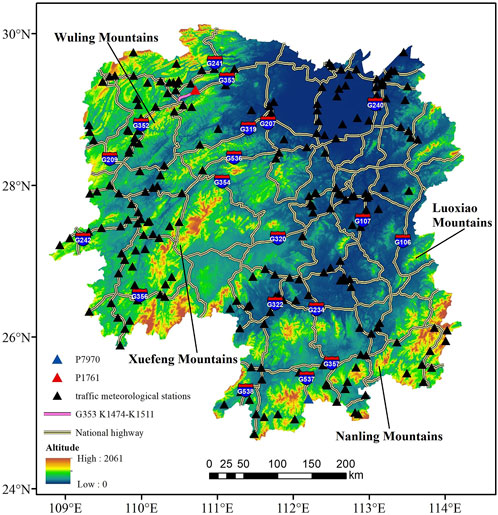
FIGURE 1. Locations of traffic meteorological stations in Hunan Province.
2.3 Research methodology
2.3.1 Logistic regression model
Road icing refers to the phenomenon of snow accumulation and freezing when precipitation encounters a ground temperature lower than 0 °C. Under different Ta conditions (with an interval of 0.5 °C), the probability distribution of Ts below 0 °C shows a reverse S-shaped curve (Figure 2, taking station P7970 as an example, and the location of P7970 is marked in Figure 1). Therefore, the logistic function can be used to conduct regression simulation for it (Bai et al., 2016). Which is calculated as follows:
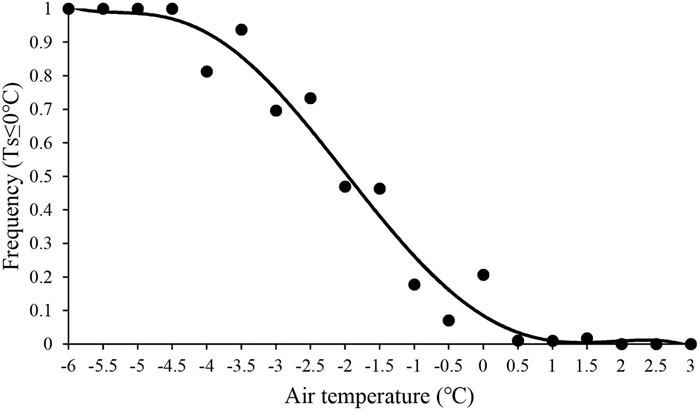
FIGURE 2. Frequency of P7930 road surface icing under different temperature conditions (Ts is the road surface temperature).
It can be linearly transformed to Eq. 2:
Where y is the possibility of road icing (i.e., the Ts ≤ 0 °C) and x is the ambient Ta. In this study, Equation 2 can be considered as a linear regression model with the dependent variable
2.3.2 Thermal mapping technology
The thermal mapping technology, developed in the 1980s by the University of Birmingham (UK) and the University of Gothenburg (Sweden), is an important method for analyzing patterns of Ts changes. It has become widely used for measuring Ts and issuing road icing warnings (Shao and Lister, 1995; Shao et al., 1997; Marchetti et al., 2014). In road networks, certain sections consistently exhibit higher or lower Ts compared to others, but the relative temperature differences between different sections remain relatively stable. Thermal mapping technology utilizes infrared devices to measure the continuous spatial changes in Ts. By collecting observational data from traffic meteorological stations in monitored road section as reference values, subtracting the time-adjusted Ts from the reference value can yield the relative Ts between the monitored road section and the traffic meteorological station. Then, by utilizing the relationship between Ts and Ta, the relative difference in Ta between the monitored road section and the traffic weather station can be determined. The temperature threshold obtained through logistic regression is then extrapolated to the entire monitored road section, allowing more precise road icing warnings.
3 Result
3.1 Characteristics of winter road surface temperature
3.1.1 Spatial distribution characteristics of road surface temperature
From 2020 to 2022, the average winter Ts in Hunan Province is 8.82 °C. Among 224 stations, 63 have values below 8 °C, 107 have values between 8°C–10 °C, and the rest are above 10 °C. Overall, the Ts in southern Hunan is higher, with most stations having a temperature above 10 °C, while the Ts in western Hunan is lower, with more stations having a temperature below 8 °C (Figure 3A). These differences in Ts distribution may be attributed to the relatively high altitude in western Hunan, as well as several significant snowfall events that occurred in this area during the study period, resulting in lower average Ts. The central and eastern parts of Hunan have relatively lower altitudes, leading to relatively higher Ts. In the southern part of Hunan, although some stations have higher altitudes, the influence of cold air is limited due to the obstruction of the Nanling Mountains, resulting in relatively higher Ts. There are also differences in Ts among different months in winter (Figures 3B–D). January has the lowest average Ts, only 7.65 °C, with only a few stations in southern Hunan recording values above 10 °C, while most stations in western and northern Hunan have Ts below 8 °C. The average Ts in February is 9.19 °C, and the highest is in December at 9.49 °C, with 88 stations having a Ts above 10 °C. The lowest Ts occurs in January due to the lowest Ta. And there were five instances of snowfall in January in 2021 and 2022. In February 2022, although there were also four instances of snowfall, February 2021 was noticeably warmer, resulting in a relatively higher average Ts compared to January. Only one occurrence of snowfall happened during December, which had the highest Ts that month.
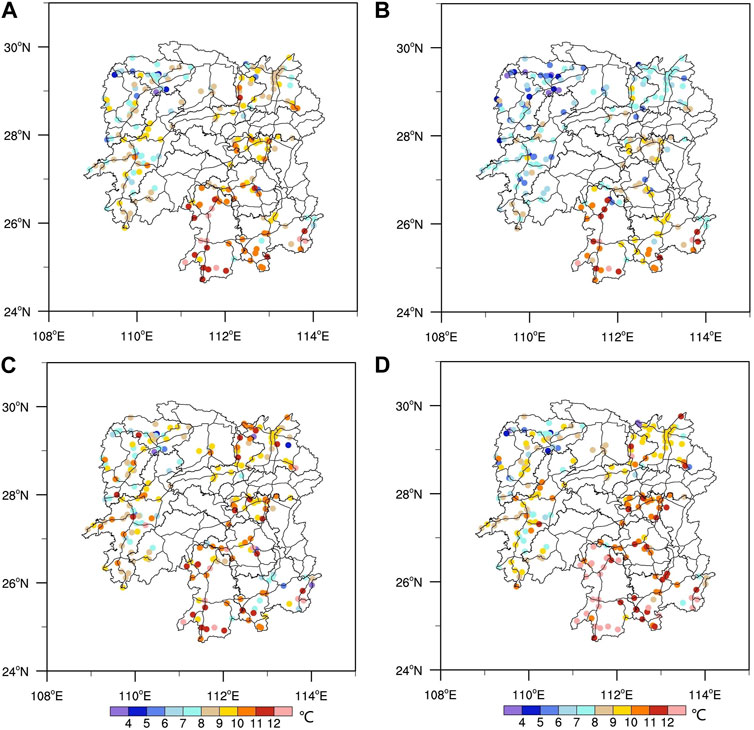
FIGURE 3. Spatial distribution of mean road surface temperature. (A) Winter. (B) January. (C) February. (D) December.
3.1.2 Diurnal variation of winter road surface temperature
Analysis of the diurnal variation curves for Ts and Ta in winter in Hunan Province reveals that the lowest average values for both Ts and Ta consistently occur at 7:00 Beijing time (BT), while the highest values are observed at 15:00 BT. Overall, the average Ta at all stations is always lower than the Ts (Figure 4). The lowest Ts are predominantly concentrated at 7:00 and 8:00 BT across 135 and 65 stations, respectively; Similarly, the lowest Ta occur at 7:00 BT across 173 stations. After sunrise, the Ts increases faster than the Ta. The temperature difference between the Ts and Ta gradually increases after 9:00 BT, reaching a maximum value of 1.9 °C at 12:00 BT; then the temperature difference decreases, reaching a minimum value of 1.1 °C around 17:00 BT. After sunset (17:00 BT), the temperature difference gradually increases again. The heating rate from the lowest Ts to the highest is 0.49 °C/h, while the heating rate of Ta is 0.42 °C/h. This discrepancy arises due to the fact that during daylight hours, Ta primarily receives heat from long-wave radiation emitted by the Earth’s surface, while Ts experiences greater heating from short-wave radiation emitted by the Sun. As a result, the ground absorbs more short-wave radiation after sunrise than the atmosphere absorbs long-wave radiation, leading to a faster increase in Ts compared to Ta (Yan et al., 2018; Bao et al., 2021). To compare the diurnal variations in Ta and Ts in different environments, we selected three sites (P8131, P8133, P8135) located in Jianghua County, Yongzhou City. P8131 is located inside a tunnel, while P8135 is located on a bridge (Supplementary Figure S1). It can be observed that the Ta and Ts inside the tunnel are lower compared to regular road and bridges. This is likely due to the absence of solar radiation inside the tunnel. Furthermore, during daytime, the bridge surface temperature (BST) is higher than that of regular road surfaces, and the increase in the BST is most noticeable. After sunset, the BST also decreases more significantly, and during nighttime, it is lower than the temperature of regular road surfaces. In a word, the diurnal temperature range of the bridge surface is more significant. In Supplementary Figure S2, we conducted an analysis of the temperature variations on the bridge surface and road surface during a snowfall event in Huaihua City on December 26–27, 2021. The data collected from P4270 (located on the bridge) and P4268 (located on the regular road) revealed that all temperatures exhibited a significant downward trend during the snowfall. The Ta decreased more rapidly and dropped below 0 °C during the snowfall, while the Ts remained stable at 0 °C. The temperature variation on the bridge surface is more pronounced, which could be attributed to the bridge’s higher specific heat capacity compared to the road surface.
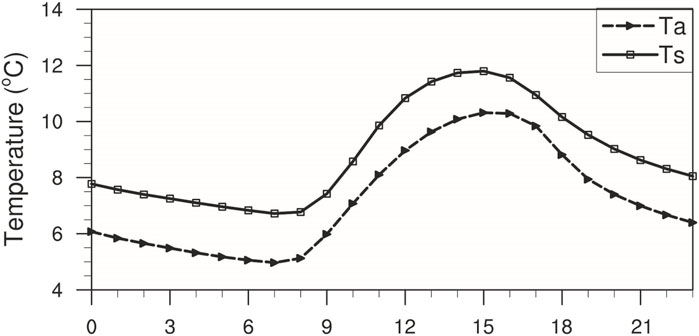
FIGURE 4. Diurnal variation of mean air temperature (Ta) and road surface temperature (Ts) at Hunan traffic meteorolo gical stations.
3.2 The temperature threshold for road icing
By using the ratio of the number of times when Ts is ≤0 °C to the total research time, a frequency distribution map of road icing (Ts ≤ 0 °C) for each station in Hunan Province is obtained (Figure 5A). We find that during the study period, 78 stations do not have any instances of Ts below 0 °C, mostly located in southern Hunan. Only 10 stations have an icing frequency higher than 5%, with the highest frequency of 18.5% observed at station P3147 on S202 in Huarong, Yueyang. As some stations have no instances of Ts below 0 °C or too few data points, they can not meet the requirement for an anti-S-shaped frequency distribution. Therefore, we selected 104 stations that can meet the requirements of the logistic model, and analyze the frequency of Ts below 0 °C under different Ta conditions using the logistic regression model with a 0.5 °C interval. The icing frequency increased as Ta decreased. When Ta is below 0 °C, the average road surface icing frequency of the 104 stations reaches 24%.
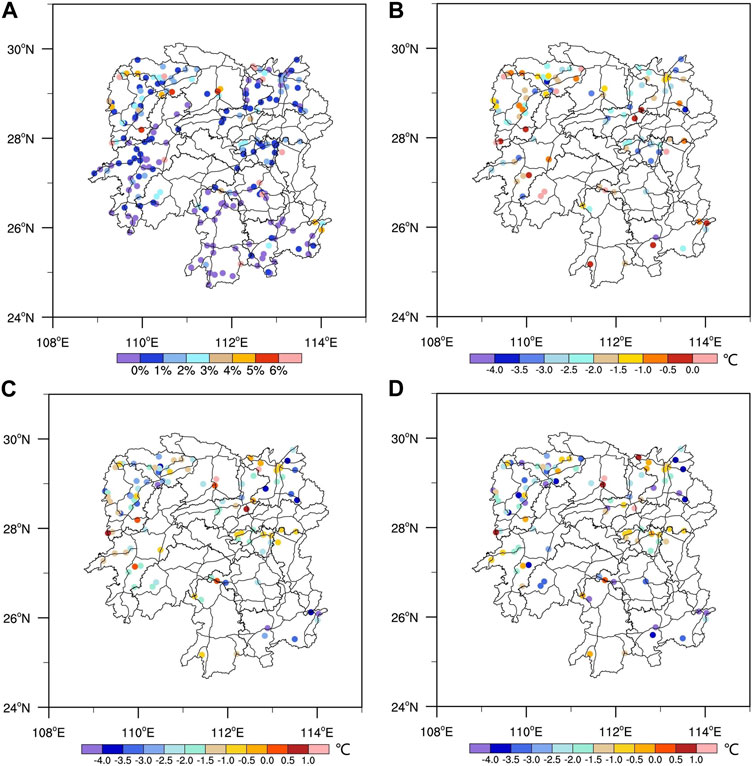
FIGURE 5. Distribution of road icing frequency and temperature threshold for road icing. (A) Road icing frequency. (B) Distribution of critical temperature (Tc). (C) Distribution of inflection point temperature (Ti). (D) Distribution of base point temperature (Tb).
We define the critical temperature (Tc) as the maximum Ta when the Ts reaches 0 °C at each traffic meteorological station in Hunan Province. When the Ta of a road segment is lower than Tc, there can be a risk of road icing. Then we define the Ta corresponding to the starting point of the logistic function as the inflection point temperature (Ti). When the Ta is lower than Ti, the possibility of the Ts being below 0 °C increases rapidly, and the risk of road icing also increases rapidly. The base point temperature (Tb) represents the environmental Ta at the base point in the logistic function, where the risk of icing is most sensitive to changes in air temperature, resulting in an extremely high risk of road icing. By analyzing the logistic functions of these 104 stations, we obtain the distribution of Tc, Ti and Tb. (Figures 5B–D). We find that there are significant differences in the temperature threshold values for different road segments and stations, which may be due to differences in terrain and climate across regions. The Ti ranges from −5°C to 1.5 °C, with about 70% of the stations having Ti between −2.5 °C and 0 °C, and 8 stations having values greater than 0 °C. In addition, although Tb ranges from −9.5 °C to 0.5 °C, 90 stations have Tb higher than −5°C. This indicates that when the environmental Ta is below −2.5 °C, the risk of road icing will increase rapidly in over 70% of the stations in Hunan Province; when the Ta is below −5°C, the icing possibility of nearly 87% of the stations will reach the base point in the logistic function, indicating an extremely high risk of road icing.
3.3 Road icing warning model
By combining the three temperature thresholds obtained in Section 3.2 (i.e., Tc, Ti and Tb) with Ta and precipitation (P) forecast products, a road icing warning model can be established. The risk of road icing is divided into four levels, with higher levels indicating higher risks. The specific grading standards are detailed in Table 1.

TABLE 1. The classification criteria of road icing grades in Hunan province.
The model can calculate the risk level of road icing for each site and issue corresponding warnings and reminders, providing scientific basis and theoretical support for transportation departments to carry out ice removal and road management. For example, when the risk reaches level 2, vehicles should be reminded to slow down; when the risk reaches level 3 or above, correspondingly road sections may need to be controlled or deicing measures may need to be taken.
3.4 Warning model validation
3.4.1 Validation of road icing events
To verify the performance of the road icing risk warning model in Hunan Province, two freezing events that occurred on 30 December 2018 and February 10–11, 2019 are selected for analysis. Based on the traffic blockage data provided by the Hunan Provincial Highway Administration Center, road sections that experienced traffic blockages due to road icing are selected to verify the warning capabilities of nearby traffic meteorological stations (Table 2; Table 3). In order to avoid the uncertainty of forecast data itself, we use observation data for verification. The Ta and precipitation data in the table were obtained from adjacent meteorological stations in the area where the traffic meteorological station is located. From Table 2 and Table 3, we can see that the predicted ice risk levels for each site are all greater than level 1, and most sites have reached level 4, indicating that the risk model can provide good warnings for road icing.
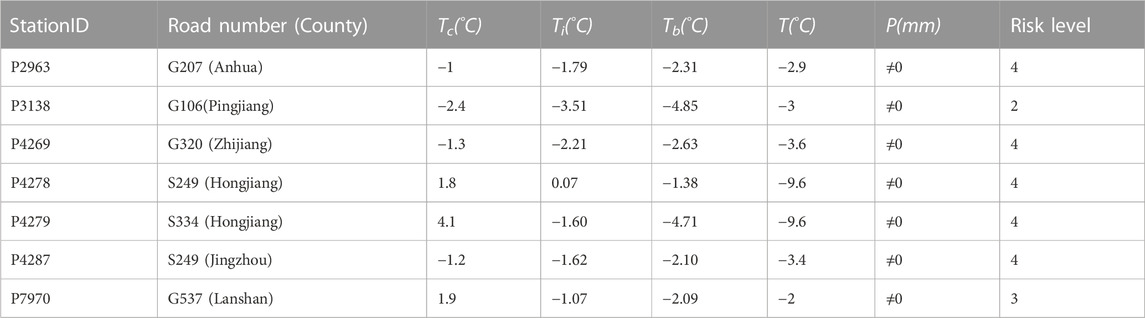
TABLE 2. Early warning of road icing risk in Hunan Province on 30 December 2018.
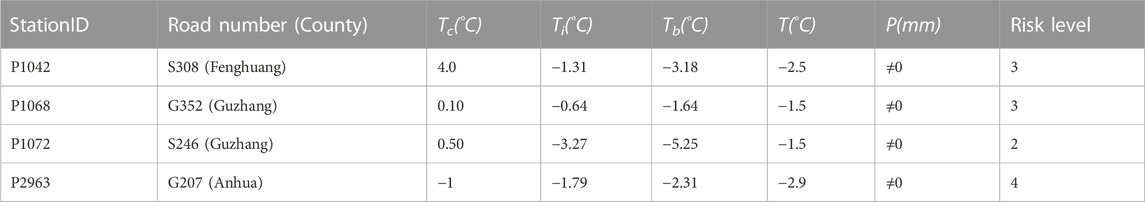
TABLE 3. Same as Table 2, but on 10–11 February 2019.
3.4.2 Validation of the false alarm rate and missing rate
We define Ts below 0 °C as road icing, and use the data from 104 traffic meteorological stations obtained in the previous text, covering December 2022 to February 2023, to evaluate the false alarm rate and missing rate of the model. When the risk level predicted by the warning model is equal to or greater than level 2 (i.e., there is a risk of icing), we consider the model to have predicted icing occurrence; otherwise, no icing is predicted by the model. The false alarm rate and missing rate of the model are shown in Figure 6. The average false alarm rate for all sites is 18.2%, while the average missing rate is 29.4%. Out of the 104 stations, 10 exhibit a false alarm rate exceeding 50%, and 19 show a missing rate surpassing 50%. Some stations have a false alarm rate of 0 but a high missing rate, while others may have a missing rate of 0 but a higher false alarm rate. There are 75 sites with both missing rates and false alarm rate below 50%. High missing rates at some stations may be due to the relatively small number of Ts records below 0 °C used for testing, as a few false alarm during these times can cause significant fluctuations in the false alarm rate.
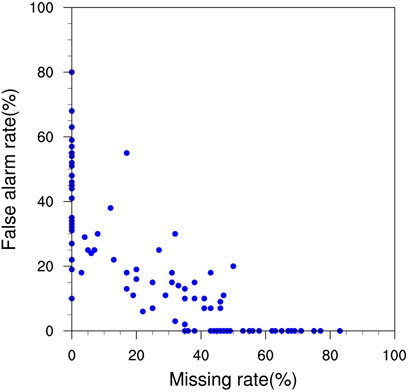
FIGURE 6. The false alarm rate and missing rate of the warning model.
4 Discussion
The number of traffic meteorological stations is limited, which makes it difficult to obtain the Ts distribution along a continuous road. Thermal mapping technology can solve this problem effectively. During February 2022, thermal spectrum mapping research was conducted on National Highway 353 (G353) in Hunan Province. Combined with the warning model, the research can convert the station-based model into a continuous icing warning product based on road, providing higher quality services for road traffic. The trial section for this research is from section K1474 to K1511 on G353, which passes through Zhangjiajie City, Hunan Province, spanning a total length of 36 km. The straight-line distance between the traffic weather station P1761 and our test section is less than 1 km. The locations of P1761 and G353 K1474-K1511 are marked in Figure 1. We first compare the Ts observation of P1761 with the Ts measurement results of the thermal map at that point, and find that the Ts measured by the thermal map is 1.4 °C higher. Based on this finding, we adjust the Ts for the entire test section accordingly. Then utilizing the distribution results of the thermographic map, we determine the Ts difference between P1761 and the entire test section (Figure 7A). By using Ta and Ts data from station P1761, we establish a simple linear regression equation for the two variables. This allows us to convert the difference in Ts to the difference in Ta and add the temperature threshold of station P1761 to derive the temperature threshold for the entire road section (Figure 7B, using the Ti as an example). It is worth mentioning that if the Ts at a certain point is lower than P1761, the temperature threshold for road icing at that point should be higher than P1761, indicating that the point is more prone to icing. Combining the warning model with thermal spectrum mapping can improve the spatial resolution of the warning model and also solve the problem of lack of observations in some areas.
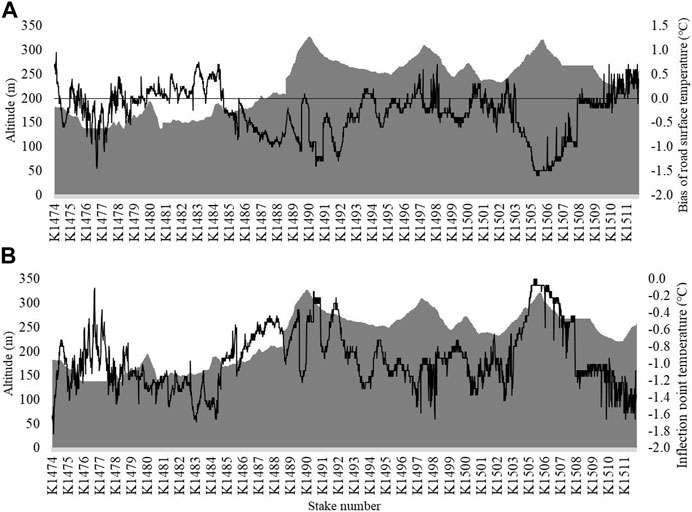
FIGURE 7. Distribution of road surface temperature difference between G353 (K1474 to K1511) and P1761 on 18 February 2022 and inflection point temperature (Ti) for G353 (K1474 to K1511). (A) Distribution of road surface temperature difference. (B) Ti for G353 (K1474 to K1511). (The shading represent elevation, while lines represent temperature).
In addition, different road materials, elevations, and surrounding environments can lead to variations in Ts. Special attention should be given to special road sections that have a significant impact on driving safety, such as sharp turns, continuous curves, and uphill/downhill slopes. For example, section K1476 of G353 is located in a valley with continuous curves. During the night, the air on both sides of the hill slopes experiences a significant decrease in Ta due to radiative cooling. The cold air flows down the slopes into the valley, resulting in a lower Ts for this section. Besides, on sections K1489-K1490 and K1503-K1505, the Ts is significantly lower due to the increasing in elevation (with a maximum elevation difference of about 100 m) and continuous uphill slopes.
It is worth mentioning that the construction of Hunan traffic meteorological stations has been relatively recent, and thus there is only relatively complete data available since September 2020. Meanwhile, some station data has poor quality, with missing and erroneous data (such as the absence of road surface temperature observations at traffic stations in Changsha City). After quality control, the remaining station density is limited, and some areas have no observation stations at all. Moreover, the length of observation data is also relatively limited, which may affect the accuracy and reliability of the model to some extent. Currently, some sites have high false alarm rate and missing rate for the model. In the future, more data should be collected to optimize the model and improve the accuracy of the warning model. Furthermore, in future research, we can continue to strengthen the measurement of thermal spectrum mapping for major roads in Hunan Province, and ultimately build a road icing warning model with a resolution of 100 m (or even finer) for Hunan Province.
5 Conclusion
This study analyzed the spatial and temporal distribution characteristics of winter road surface temperatures on ordinary highways in Hunan Province, utilizing data from Hunan traffic meteorological stations during the period from December 2020 to February 2022. By using a logistic regression model, the threshold for road icing in the province is calculated. Based on these results, a road icing risk level model for ordinary highways in Hunan Province is established. The model is evaluated by using two road icing events in December 2018 and February 2019, and the model’s false alarm rate and missing rate are verified by traffic meteorological station data from December 2022 to February 2023. The main conclusions are as follows:
Ts in southern Hunan are relatively high, with most sites having temperatures above 10 °C, while Ts in western Hunan are relatively low, with many sites having temperatures below 8 °C. In terms of the different months, the average Ts in January is the lowest and the Ts in December is the highest.
For the diurnal variation, the lowest average Ts and Ta in winter in Hunan Province both occur at 7:00 BT, while the highest values occur at 15:00 BT, with the average Ta always lower than the Ts. The temperature difference between the road surface and air gradually increases after 9:00 BT, reaching its maximum at 12:00 BT; it then gradually decreases, reaching its minimum at 17:00 BT before gradually increasing again. The temperature variation on the bridge surface is more pronounced.
Using a logistic regression model, we calculate the temperature thresholds for road icing at different levels in Hunan Province and establish a road icing risk level model based on these thresholds. When the Ta is below −2.5 °C, the risk of ice formation increases rapidly at over 70% of sites in Hunan Province. And when the Ta drops below −5°C, the ice frequency at 87% of sites will reach the base point of the logistic function, indicating an extremely high risk of road icing. Then the model’s false alarm rate and missing rate are verified by traffic meteorological station data from December 2022 to February 2023. The average false alarm rate for all sites is 18.2%, and the average missing rate is 29.4%. By combining the warning model with the thermal spectrum map of G353 K1474-K1511, the station-based model can be extrapolated to continuous road sections.
Data availability statement
The datasets presented in this article are not readily available because data available on request due to restrictions, e.g., privacy or ethical. The data are not publicly available due to confidentiality. Requests to access the datasets should be directed to CL, TGNoX2NoYXRAMTI2LmNvbQ==.
Author contributions
Conceptualization, HG and CL; methodology, RX and CL; investigation, XL; data curation, ZH and WP; formal analysis, RX and XL; writing–original draft preparation, RX; writing–review and editing, CL and XL; Funding acquisition, CL; supervision HG. All authors contributed to the article and approved the submitted version.
Funding
The research was funded by Key Project of the Innovation Fund of the Public Meteorological Service Center, China Meteorological Administration (K2021006).
Acknowledgments
The authors thank the Hunan Provincial Meteorological Information Center for providing the data of traffic meteorological stations. The author would like to thank the Hunan Provincial Highway Affairs Center of Department of transportation of Hunan Province for providing the traffic blockage data.
Conflict of interest
The authors declare that the research was conducted in the absence of any commercial or financial relationships that could be construed as a potential conflict of interest.
Publisher’s note
All claims expressed in this article are solely those of the authors and do not necessarily represent those of their affiliated organizations, or those of the publisher, the editors and the reviewers. Any product that may be evaluated in this article, or claim that may be made by its manufacturer, is not guaranteed or endorsed by the publisher.
Supplementary material
The Supplementary Material for this article can be found online at: https://www.frontiersin.org/articles/10.3389/feart.2023.1251635/full#supplementary-material
References
Bai, S., Yang, W., Zhang, M., Liu, D., Li, W., and Zhou, L. (2022). Attention-based BiLSTM model for pavement temperature prediction of asphalt pavement in winter. Atmosphere 13, 1524. doi:10.3390/atmos13091524
Bai, Y., Chen, C., He, M., Bai, J. M., Rath, E., Jiang, F., et al. (2016). Dissecting the biological relationship between TCGA miRNA and mRNA sequencing data using MMiRNA-Viewer. Meteor. Sci. Technol. 44, 336–340. (In Chinese). doi:10.1186/s12859-016-1219-y
Bao, G., Yang, C., Zhou, D., Ma, S., Liu, W., and Yan, Z. (2021). Variation characteristics of road surface temperature and its influence on air temperature factors of Beijing-Tibet Expressway in the Qaidam Hinterland. Arid. Land Geo 44, 1213–1221. (In Chinese). doi:10.12118/j.issn.1000-6060.2021.05.02
Berrocal, V. J., Raftery, A. E., Gneiting, T., and Steed, R. C. (2010). Probabilistic weather forecasting for winter road maintenance. J. Am. Stat. Assoc. 89, 522–537. doi:10.1198/jasa.2009.ap07184
Bouilloud, L., Martin, E., Habets, F., Boone, A., Moigne, P. L., Livet, J., et al. (2009). Road surface condition forecasting in France. J. Appl. Meteorol. Clim. 48, 2513–2527. doi:10.1175/2009jamc1900.1
Chen, S., Saeed, T. U., and Labi, S. (2017). Impact of road-surface condition on rural highway safety: A multivariate random parametersnegative binomial approach. Anal. Methods Accid. Res. 16, 75–89. doi:10.1016/j.amar.2017.09.001
Crevier, L. P., and Delage, Y. (2001). METRo: A new model for road-condition forecasting in Canada. J. Appl. Meteor. 40, 2026–2037. doi:10.1175/1520-0450(2001)040<2026:manmfr>2.0.co;2
Jing, T., Liu, D., Bao, Y., Wang, H., Yan, M., and Zu, F. (2023). Spatiotemporal distributions and vulnerability assessment of highway blockage under low-visibility weather in eastern China based on the FAHP and CRITIC methods. Atmosphere 14, 756. doi:10.3390/atmos14040756
Kamenchukov, A. V., Tyan, V. D., Voinash, S. A., Ariko, S. Y., Rzhavtsev, A. A., Sokolova, V. A., et al. (2020). Modeling heat transfer processes in heating systems for surface of highways. J. Phys. Conf. Ser. 1679, 042045–045. doi:10.1088/1742-6596/1679/4/042045
Kršmanc, R., Slak, A. Š., and Demšar, J. (2013). Statistical approach for forecasting road surface temperature. Meteorol. Appl. 20, 439–446. doi:10.1002/met.1305
Liu, W., and Rao, Z. (2020). Road icing warning system based on support vector classification. IOP Conf. Ser. Earth Environ. Sci. 440, 052071–071. doi:10.1088/1755-1315/440/5/052071
Luo, H., Li, L., Hu, S., Nairn, J., Liu, Y., and Zheng, L. (2007). The relationship between road traffic crashes and meteorological condition with construction of its road weather warning model. J. Appl. Meteor. Sci. 18, 350–357. (In Chinese). doi:10.11898/1001-7313.20070311
Marchetti, M., Chapman, L., Khalifa, A., and Buès, M. (2014). New role of thermal mapping in winter maintenance with principal components analysis. Adv. Meteorol. 2014, 1–11. doi:10.1155/2014/254795
Marchetti, M., Khalifa, A., and Bues, M. (2015). Methodology to forecast road surface temperature with principal components analysis and partial least-square regression: application to an urban configuration. Adv. Meteorol. 2015, 562621–562710. doi:10.1155/2015/562621
Meng, C. (2018). A numerical forecast model for road meteorology. Meteorol. Atmos. Phys. 130, 485–498. doi:10.1007/s00703-017-0527-8
Mohr, S., Kunz, M., and Keuler, K. (2015). Development and application of a logistic model to estimate the past and future hail potential in Germany. J. Geophys Res-Atmos. 120, 3939–3956. doi:10.1002/2014jd022959
Pang, G., He, J., Huang, Y., and Zhang, L. (2019). A binary logistic regression model for severe convective weather with numerical model data. Adv. Meteorol. 6127281, 1–15. doi:10.1155/2019/6127281
Sass, B. H. (1992). A numerical model for prediction of road temperature and ice. J. Appl. Meteor. 31, 1499–1506. doi:10.1175/1520-0450(1992)031<1499:anmfpo>2.0.co;2
Shao, J., and Lister, P. J. (1996). An automated nowcasting model of road surface temperature and state for winter road maintenance. J. Appl. Meteor. 35, 1352–1361. doi:10.1175/1520-0450(1996)035<1352:aanmor>2.0.co;2
Shao, J., and Lister, P. J. (1995). Data filtering for thermal mapping of road surface temperatures. Meteorol. Appl. 2, 131–135. doi:10.1002/met.5060020206
Shao, J., Swanson, J. C., Patterson, R., Lister, P. J., and Mcdonald, A. N. (1997). Variation of winter road surface temperature due to topography and application of thermal mapping. Meteorol. Appl. 4, 131–137. doi:10.1017/s135048279700042x
Sokol, Z., Zacharov, P., Sedlak, P., Hosek, J., Bliznak, V., Chladova, Z., et al. (2014). First experience with the application of the metro model in the Czech republic. Atmos. Res. 143, 1–16. doi:10.1016/j.atmosres.2014.01.017
Strong, C. K., Ye, Z., and Shi, X. (2010). Safety effects of winter weather: the state of knowledge and remaining challenges. Transp. Rev. 30, 677–699. doi:10.1080/01441640903414470
Tian, H., Wang, Z., Dai, Z., and Li, W. (2018). Research on relationship between highway traffic blocking induced by Waterlogging and precipitation. Meteorol. Mon. 44, 684–691. (In Chinese). doi:10.7519/j.issn.1000-0526.2018.05.009
Xin, J., and Xu, X. (2007). The main meteorological disasters in China and countermeasures. J. Catastrophol. 22, 85–89. (In Chinese). doi:10.3969/j.issn.1000-811X.2007.03.020
Yan, X., Wang, X., Da, X., Zhao, F., and Niu, X. (2018). Variation characteristics of expressway pavement temperature and forecast model in mountainous area of Gansu. Arid. Meteor 36, 864–872. (In Chinese). doi:10.11755/j.issn.1006-7639(2018)-05-0864
Keywords: hunan province, logistic regression model, early warning of icing, thermal spectrum mapping, road surface temperature
Citation: Xie R, Liao C, Luo X, Guo H, Huang Z and Peng W (2023) Research on road surface temperature characteristics and road ice warning model of ordinary highways in winter in Hunan province, central China. Front. Earth Sci. 11:1251635. doi: 10.3389/feart.2023.1251635
Received: 02 July 2023; Accepted: 11 September 2023;
Published: 21 September 2023.
Edited by:
Chenghai Wang, Lanzhou University, ChinaReviewed by:
Zhiwen Dong, Chinese Academy of Sciences (CAS), ChinaDongliang Luo, Chinese Academy of Sciences (CAS), China
Copyright © 2023 Xie, Liao, Luo, Guo, Huang and Peng. This is an open-access article distributed under the terms of the Creative Commons Attribution License (CC BY). The use, distribution or reproduction in other forums is permitted, provided the original author(s) and the copyright owner(s) are credited and that the original publication in this journal is cited, in accordance with accepted academic practice. No use, distribution or reproduction is permitted which does not comply with these terms.
*Correspondence: Chunhua Liao, TGNoX2NoYXRAMTI2LmNvbQ==