 Zigang Ji1,2
 Jinhang Li
 Zhanping Song
- 1China Communications Construction Group Southwest Construction Co., Ltd, Chengdu, China
- 2Shaanxi Key Laboratory of Geotechnical and Underground Space Engineering, Xi’an, China
- 3School of Civil Engineering, Xi’an University of Architecture and Technology, Xi’an, China
With the implementation of the “Belt and Road” initiative, tunnel projects were designed in accordance with Russian design specifications and constructed by Chinese companies in countries along the route. Design companies and construction companies use different rock classification methods, which will increase the safety risk and cost of the tunnels. Therefore, it is necessary to study the correlation between Chinese engineering rock mass classification and Russian rock mass classification. The goal was to establish the correlation between rock mass basic quality (BQ) and Protodyakonov coefficient (f) for rock mass classification. Firstly, based on the equivalence principle of uniaxial compressive strength (UCS), the relationship between BQ and f containing the velocity index of rock mass (Kv) was established by comparing the relationship between f and BQ in the empirical formula of UCS. Secondly, through the equivalent principle of volumetric joint count of rock mass (Jv), we compared the empirical formula between the intactness index of Kv and rock quality designation (RQD) and conducted linear regression analysis on a large amount of data. The relationship between Kv and RQD was established. Finally, the relationship between BQ and f is quantitatively expressed and a classification table corresponding to the Russian rock classification and the Chinese engineering rock classification is obtained. The method is applied to Kyrgyzstan mountain tunnels.
1 Introduction
Rock mass basic quality (BQ) and Protodyakonov coefficient (f) are the rock classification methods in China and Russia respectively. Due to the different methods of rock classification, serious communication problems arose during the tunnel project, which was designed according to Russian norms and built according to Chinese standards. Coupled with the implementation of the “Belt and Road” initiative, there will be tunnel projects designed according to Russian norms and built by China in the countries along the route (Song et al., 2019; Tian et al., 2019; Wang et al., 2022). Differences in the methods of rock classification can lead to lots of problems. For example, the North-South Crossing Tunnel in Kyrgyzstan was designed according to Russian standards, built according to Chinese tunnel construction concepts, and supervised by Kyrgyzstan. The surrounding rock is classified according to the Russian Code of Rock Strength. However, according to the Chinese Code for Design of Highway Tunnels (JTG-D70-2004), the tunnel surrounding rock should be classified according to the Standard for Engineering Classification of Rock Mass (GB/T 50218-2014). Due to different construction concepts and standard systems, it was difficult to communicate on site (Song et al., 2020). Therefore, in order to ensure smooth tunnel construction, it is necessary to establish the correlation between Chinese engineering rock classification BQ and Russian rock classification f.
Regarding the classification method of Engineering rock mass, there is no uniform standard across the world. There are several methods such as the RQD classification method (Li et al., 2022; Ren et al., 2022), the Protodyakonov coefficient method (Barton, 1974), the Q system classification method (Bieniawski, 1978), geomechanical RMR classification method (Nicholson and Bieniawski, 1990; Hoek and Brown, 1997), Geological Strength Index method (Palmström, 1996), the Rock Mass Index method, and China’s Engineering rock mass classification BQ method (Yan-jun et al., 2017). The rock mass classification method has been widely used (Zhao et al., 2021; Zhao et al., 2017). During tunnel construction, rock classification needs to take into account not only the effect of rock physical properties on rock hardness (Du et al., 2020; Song et al., 2022), but it is also necessary to consider the effect of tunnel excavation on variable slopes, leading to the deformation of the rock (Du et al., 2023; Chen et al., 2023). Rock classification is influenced by multiple factors, but there is no doubt that there is a relationship between the physical properties and integrity of rocks (Zhang and Einstein, 2004). Some scholars have gained new insights into the research and application process. They improved the BQ surrounding rock classification method and proposed a new surrounding rock classification method (Liu et al., 2019; Guo et al., 2020) There are also some scholars who conduct research on the relationship between grading standards. Barton (2002) proposed a rock mass classification method based on the rock mass quality index BQ. In order to eliminate the differences between various engineering rock mass classifications, many experts have tried to establish the correlation between various rock mass classifications. Dai et al. (2022) studied the correlation between RMR and Q. Palmstrom and Broch (2006) analyzed the individual parameters and discussed their relevance to the natural geological features they were trying to simulate. Results show that the RMR and the Q, the HC and the Q, and the BQ and the Q are in logarithmic correlation. Luo et al. (2015) analyzed the effects of freezing and thawing on rocks and established a linear relationship between the Geological Strength Index (GSI) and the Tianshan slope rock mass rating (TSMR) system. Chen and Liu (2007) proposed a rock mass quality evaluation model combining AHP and the Fuzzy Delphi Method (FDM). Zhang et al. (2019) analyzed the correlations between rock mass rating (RMR) and geological strength index (GSI).
The study of the various rock classification systems mentioned above basically focuses on RMR, GSI, Q, and BQ, and does not address the correlation between the Protodakonov coefficient f classification of Russian rocks and the BQ classification of engineering rocks in China. Therefore, it is important to study the correlation between the two systems to provide a reference for tunnel construction in countries along the “Belt and Road.” In this paper, the similarity relationship between BQ and f is established. Firstly, the relationship between f and BQ is established by UCS, and the relationship between BQ and f containing parameter Kv is obtained. Furthermore, the relationship between Kv and RQD is obtained through the equivalent volume joint coefficient (Jv) and the linear regression analysis of a large amount of data. Finally, the quantitative relationship between BQ, f, and RQD was obtained, and the rock mass classification table corresponding to BQ and f was established through this relationship, which was applied to the north-south cross-ridge tunnel in Kyrgyzstan and achieved good construction results.
2 Analysis of the correlation between BQ and f
The BQ method of Chinese engineering rock classification is a comprehensive method to reflect various indexes of rocks. The Protodyakonov coefficient f takes into account the physical factors of the rock (Wang et al., 2020) and numerically reflects the solidity of the rock. Although both methods can reflect the firmness of rocks, the number of rock solidity indicators varies considerably due to the different classification methods used. However, both methods use rock UCS to evaluate rock firmness, which shows that there is a certain correlation between the two methods. We established the correlation between BQ and f based on the UCS equivalence principle.
2.1 Russian rock Protodyakonov coefficient classification
The solidity of rock reflects the ability of the rock to resist damage from an external force, such as rock stability, explosibility, and resistance to disturbance. In the construction process of underground engineering, most of the rocks are in the state of compression, so the compressive strength method has better applicability. Protojakonov modified the previous formula for f and proposed Eq. 1 for calculating f using compressive strength. The Protodyakonov coefficient f corresponds to the classification of the rock mass as shown in Table 1.
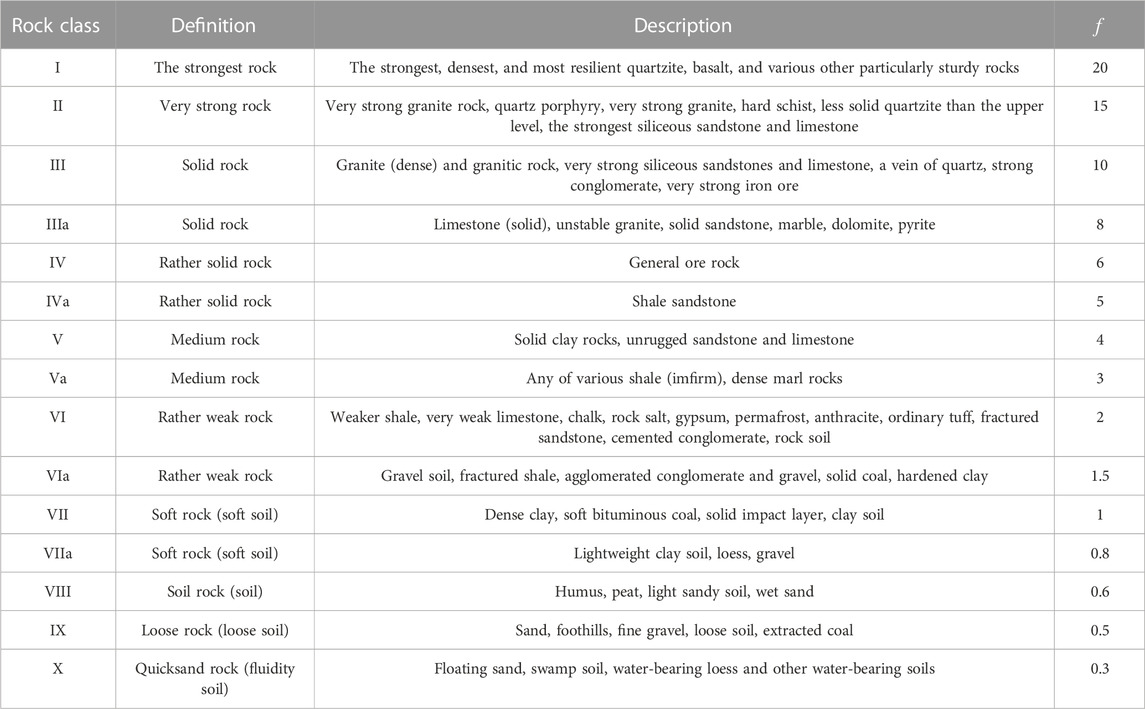
TABLE 1. Rock mass classification by Protodyakonov.
Where R is the UCS of rock.
Guo et al. (2008) explored the correlation between a variety of rock fragmentation functions in underground engineering disasters through rock fragmentation and rock UCS experiments. The linear correlation between rock strength coefficient and UCS was obtained by linear regression on the experimental results of f and UCS of different rocks as in Eq. 2.
This correlation is highly correlated, and the correlation coefficient is 0.984.
A distinctive feature of rocks compared to other materials is the high variability of data when solidity measurements are repeated (Gökceoğlu et al., 2000). Therefore, the f established by Protodyakonov and Guo differs significantly from the correlation formula of the UCS. The non-homogeneity of the rocks, which leads to the inevitable dispersion of the measured data, makes the difference between the two indistinguishable. Equations 1, 2 should be used as a basis for derivation.
2.2 China’s engineering rock mass classification
Qualitative classification of engineered rocks was carried out by integrating rock strength, rock integrity, degree of rock weathering, and degree of cementation of structural surfaces (Hashemi et al., 2010). UCS and Kv are the main influencing factors of the rock quality index, and the relationship between BQ, Kv, and UCS is given in the Standard for Engineering Classification of Rock Mass using the following equations:
Where R is the UCS of the rock, and KV is the integrity factor of the rock mass.
Notes, in the process of applying Eq. 3, when R > 90Kv +30, R = 90Kv +30, and Kv should be taken into Eq. 3 to calculate BQ. When Kv > 0.04R +0.4, Kv = 0.04R +0.4, and R should be taken into Eq. 3 to calculate BQ. The corresponding rock mass classification of the BQ method is shown in Table 2.
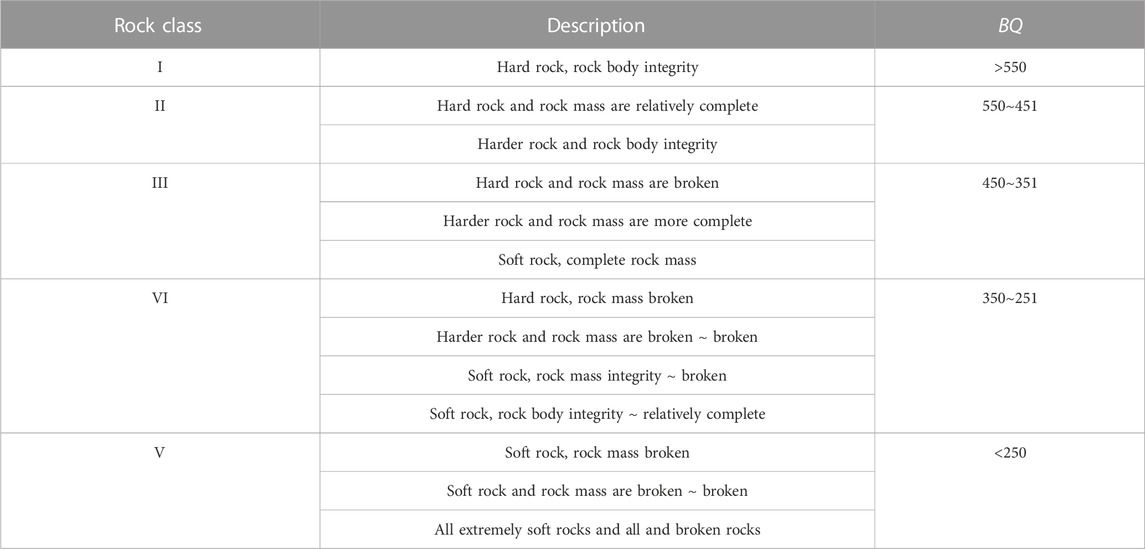
TABLE 2. China’s engineering rock mass classification.
2.3 The correlation between BQ and f
Both classification methods use the indicator of the UCS of rock, so the correlation between BQ and f can be established according to the UCS equivalent principle.
Comparing Eqs 1, 3, we can obtain:
Comparing Eqs 2, 3, we can obtain
It can be seen from Eqs 4, 5 that the correlation between BQ and f is obtained by equivalent substitution of UCS. When f is known, the basic quality BQ of the rock still cannot be obtained, because the integrity factor Kv of the rock mass is still missing in the formula. Therefore, the correlation between Kv and RQD can be further investigated to improve Eqs 4, 5. In order to achieve the goal that the Kv and f parameters in the classification method with known Protodyakonov coefficients can be linked to the BQ classification method.
2.4 The correlation between RQD and Kv
The correlation was calculated between rock mass integrity coefficient Kv, rock quality designation RQD, and volumetric joint count of rock mass Jv (Bieniawski, 1989; Jiang et al., 2013).
According to the equivalent principle of volumetric joint count of rock mass, comparing Eqs 6, 7, we can obtain
Deere et al. (1969), China’s Ministry of Water Resources, the Kunming Survey and Design Institute of the Ministry of Energy, and The Southwest Research Institute of the Ministry of Railways Science Research, China (Wang et al., 2007) studied the correlation between rock quality designation and rock mass integrity coefficients, which is as shown in Table 3.
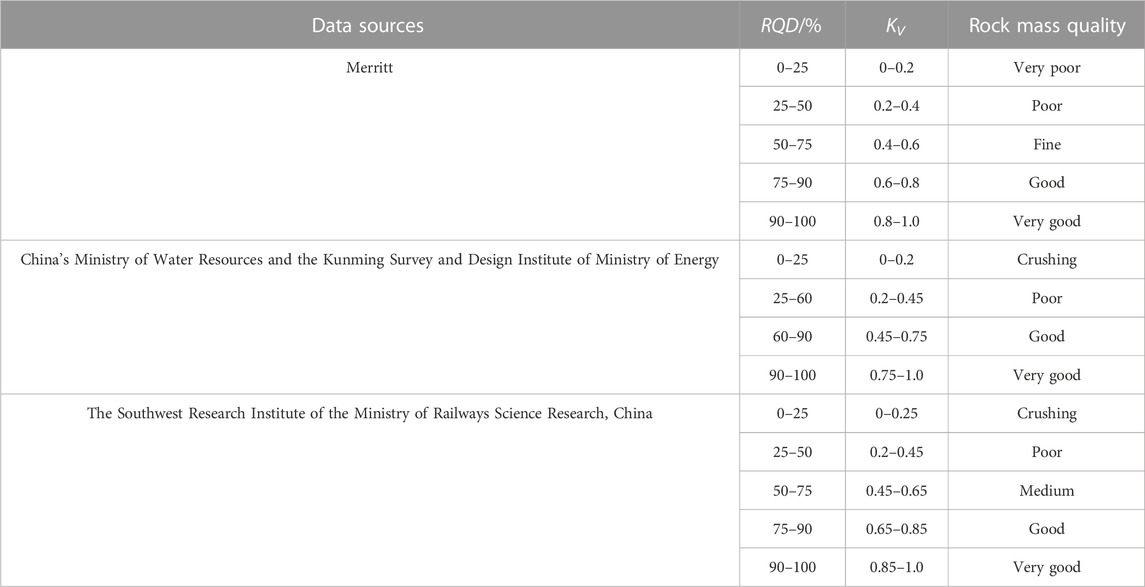
TABLE 3. Correlation between RQD and KV.
Based on the data in Table 3, The curve of the correlation between Kv and RQD is plotted (Figure 1), and linear regression is performed to obtain Eqs 9–11.
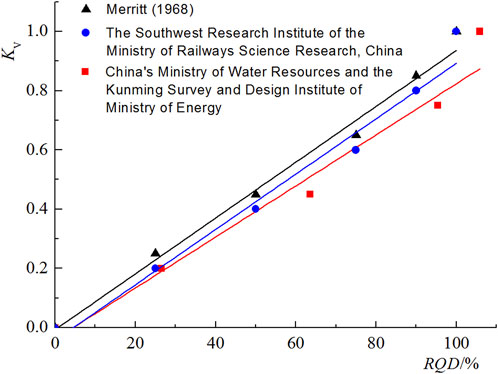
FIGURE 1. Correlation curve between KV and RQD.
Put Eqs 8, 9 into Eq. 4 respectively, we can obtain
Put Eqs 8, 9 into Eq. 5 respectively, we can obtain
Put Eqs 10, 11 into Eq. 4 respectively, we can obtain
Put Eqs 10, 11 into Eq. 5 respectively, we can obtain
3 Discussion
In terms of the upper limit, when f is too large and RQD is not large, such a hard but poorly intact rock mass has poor stability. Although f is high, it plays little role in keeping stability. In terms of the lower limit, when f is very low and the corresponding RQD value is too high. The stability of such a complete and weak rock mass is still not good. Therefore, when carrying out rock mass classification, special attention should be paid to the upper and lower limits (Laubscher, 1990).
RQD was taken as the abscissa, and f was the ordinate to draw the BQ contour map. According to the limit value of the BQ index of each surrounding rock grade in the highway tunnel specification, the position of each surrounding rock in the figure is determined. In Figures 2A–F correspond to the Eqs 12–19, respectively.
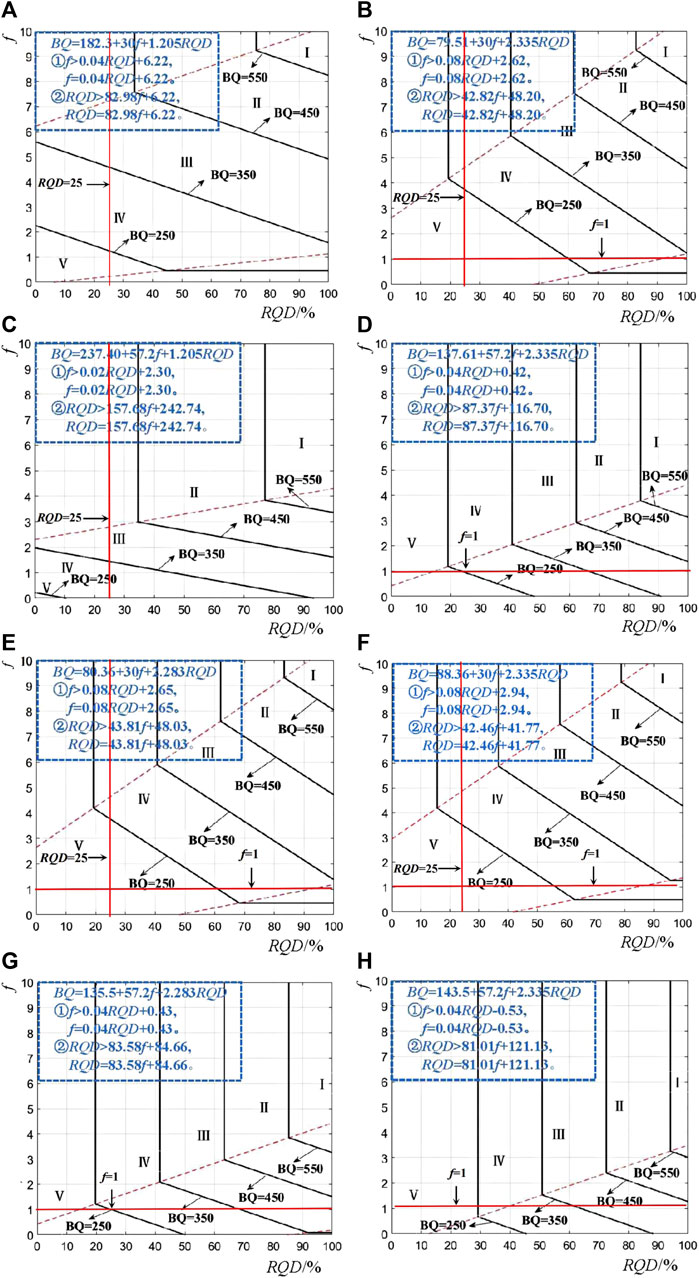
FIGURE 2. Classification diagram of rock mass quality: (A) BQ = 182.3 + 30f + 1.205RQD, (B) BQ = 79.51 + 30f + 2.335RQD, (C) BQ = 237.40 + 57.2f + 1.205RQD, (D) BQ = 137.61 + 57.2f + 2.335RQD, (E) BQ = 80.36 + 30f + 2.283RQD, (F) BQ = 88.36 + 30f + 2.335RQD, (G) BQ = 135.5 + 57.2f + 2.283RQD, (H) BQ = 143.5 + 57.2f + 2.335RQD.
When RQD < 25, the integrity of such surrounding rock is extremely poor, which is not conducive to tunnel excavation. Even if the rock is hard, it cannot raise its surrounding rock level. When RQD < 25, Figures 2A, C reach the grade III surrounding rock, which is therefore unreasonable. When f < 1, even if the integrity of such a soft stratum of dense clay, gravel, and sand is very good, its stability is very poor. Figures 2D, G, H reach Class III surrounding rock, which is therefore unreasonable. It can be seen from Figure 2 that when RQD < 25 and f < 1, the grades in Figures 2B, E, F are IV and V. They have good upper and lower limits, which can fully reflect the characteristics of rock mass classification. Figure 2F can best reflect the characteristics of rock mass classification and meet the requirements of rock mass classification. And the intermediate Eq. 11 for the derivation of Figure 2F has the highest correlation coefficient. Therefore, Figure 2F was recommended as the basis of rock mass classification. In other words, Eq. 17a was selected as a basis for the qualitative classification of rock mass.
According to the classification Table 1 of rock mass classification by Protodyakonov, when f < 2, the surrounding rock is mostly weak and broken rock, soil, and sand. According to China’s engineering rock mass classification, this kind of rock mass is divided into V rock mass. Therefore, Eq. 17b is further modified to add a restriction condition, when f < 2, BQ < 250. When applying the Eq. 17b, 1) when f > 0.08RQD + 2.94, f > 0.08RQD + 2.94, and RQD should be put in Eq. 17b to calculate BQ. 2) When RQD > 42.46f + 41.7, RQD = 42.46f + 41.7, and f should be put in Eq. 17b to calculate BQ. 3) When f < 2, BQ < 250.
For example, when f = 10 is solid rock, RQD = 50∼75 is fine rock, which corresponds to RQD = 451∼550 as hard and fine II rock. The correspondence between BQ and f is based on Eq. 17b. However, since RQD, f, and BQ are all within a range, the correspondence is subject to some error near the lower and upper limits of the range. Eq. 17b is an empirical formula established based on the North-South Crossing Tunnel in Kyrgyzstan, which has application in similar stratigraphic conditions, but the adaptive conditions in other stratigraphic conditions need to be further verified.
4 Results
According to Eq. 17b, the correlation between Russian rock Protodyakonov coefficient classification and China’s engineering rock mass classification can be obtained, as shown in Table 4. Russian rock Protodyakonov coefficient classification was divided into corresponding engineering rock mass classifications according to different RQD values. When RQD < 14, this kind of surrounding rock is unfavorable to tunnel excavation, so the rock mass is divided into V rock mass no matter what the value of f is. When f < 2, this kind of surrounding rock is not conducive to tunnel excavation, so no matter how large the RQD value, the rock mass is divided into V surrounding rock.
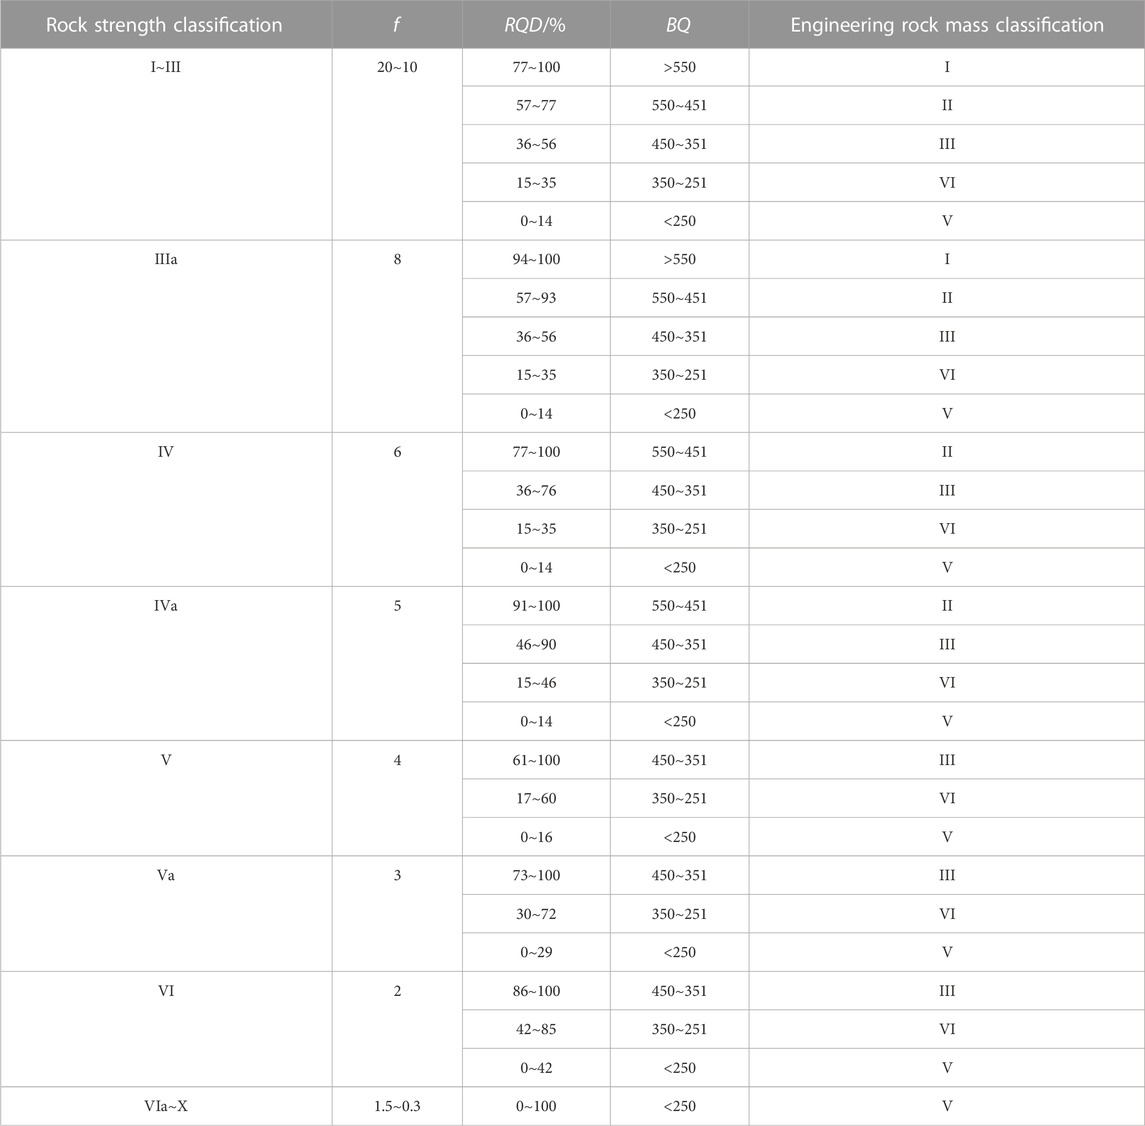
TABLE 4. The correlation between BQ and f.
5 Mechanical parameter estimation
Different rock classifications correspond to different construction methods. Different rock physical parameters have an important influence on the structural design. Such as the weight γ(kN/m3), deformation modulus E(GPa), internal friction angle φ(°), cohesion c(MPa), and Poisson’s ratio μ (Kaya et al., 2017). For this purpose, according to the data in the table of physical and mechanical parameters of rock bodies provided by the specification for the classification of engineering rock bodies, the curves of each physical and mechanical parameter are plotted with BQ as the horizontal coordinate, as shown in Figure 3.
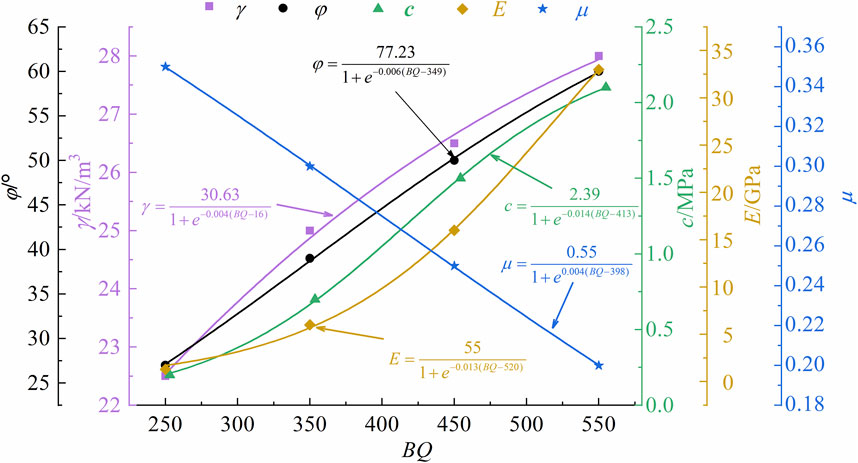
FIGURE 3. Relationship between mechanical parameters of rock mass and BQ.
It can be seen from Figure 3 that there is a strong correlation between rock mechanical parameters and BQ. Therefore, the fitting method was used to analyze the relationship between each mechanical parameter and BQ in Figure 3, and the following empirical formula was obtained. The empirical formula is as follows:
The fitting curve obtained by Eqs 20–24 is shown in Figure 3. The weight γ(kN/m3), deformation modulus E(GPa), internal friction angle φ (°) and cohesion c(MPa) tend to increase with the increase of BQ value. The Poisson’s ratio μ tends to decrease with the increase of BQ. However, the change speed of mechanical parameters with BQ is not consistent, especially E, when BQ < 425, the speed of increase is slow, and when BQ > 425, it increases rapidly. RQD cannot explain the trend of physical parameters intuitively. Therefore, combining Eq. 17b with Eqs 20–24 can establish the relationship between physical parameters and RQD, f in the following equation.
From Eq. 1 to Eq. 8, f is related to uniaxial compressive strength, which can reflect the nature of rock strength, and RQD is related to the volumetric joint count of rock mass Jv, which can reflect the nature of rock integrity. Therefore, Eqs 25–29 comprehensively consider the effects of multiple factors on rock physical parameters.
6 Engineering applications
The Kyrgyz North and South Cross-Ridge Tunnel has a total length of 3,750 m. The length of the main tunnel of the 3-A section is 1,850 m. The portal chainage is K 431+90. The boundary chainage is K 450+40. The length of the service guide hole is 1,850 m, the portal chainage is K 431+90, and the boundary chainage is K 450+40. Tunneling is carried out on the Paleozoic stratum with sedimentary rocks (Devonian, Carbon, and Early Permian sedimentary rocks), which were medium-strength and relatively fractured. The tunnel passes through some structural fault zones, which can range from the first few meters to several tens of meters in the near-fault zone. The tunnel, tunnel portal, and the borehole core are shown in Figure 4.
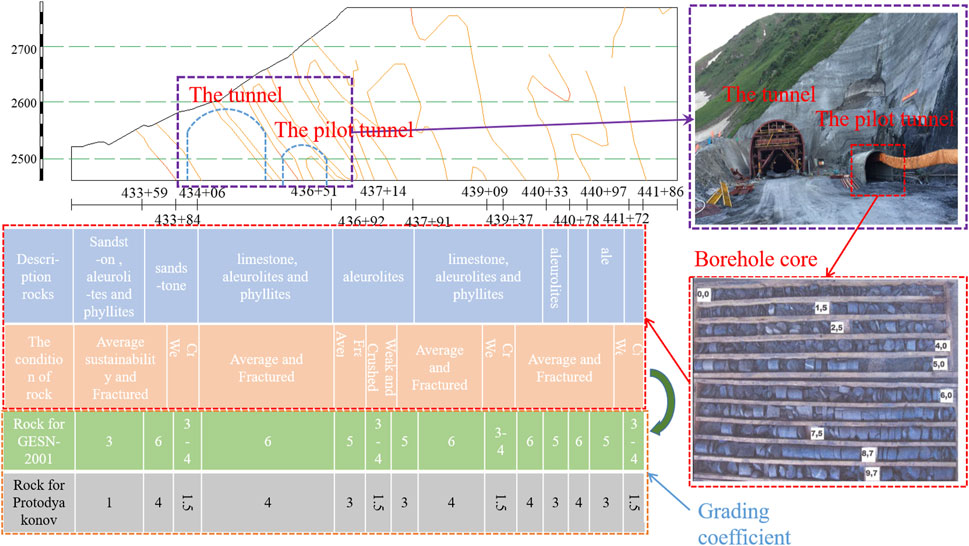
FIGURE 4. Engineering-geological cross-section along the axis of the tunnel.
According to the Russian code, the tunnel surrounding rock is classified according to the Protodyakonov coefficient (f). However, according to the requirements of the Chinese Highway Tunnel Design Code, the tunnel surrounding rock classification is carried out according to the BQ method. Therefore, in order to solve the contradiction of construction methods, the correlation between Chinese engineering rock mass classification BQ and Russian rock Protodyakonov coefficient f was studied. At the same time, it is also of great significance for improving construction quality, ensuring completion, and optimizing design.
The tunnel is a small distance tunnel. Due to the complex geological conditions, the construction adopts the pilot tunnel sequential construction scheme. A drilling room is set every 100 m along the tunneling direction, and engineering geological exploration is carried out throughout the tunnel. The property information of the surrounding rock is shown in Figure 4. The grade of the surrounding rock was estimated by the Protodyakonov coefficient f method and BQ method. The results are shown in Table 5.
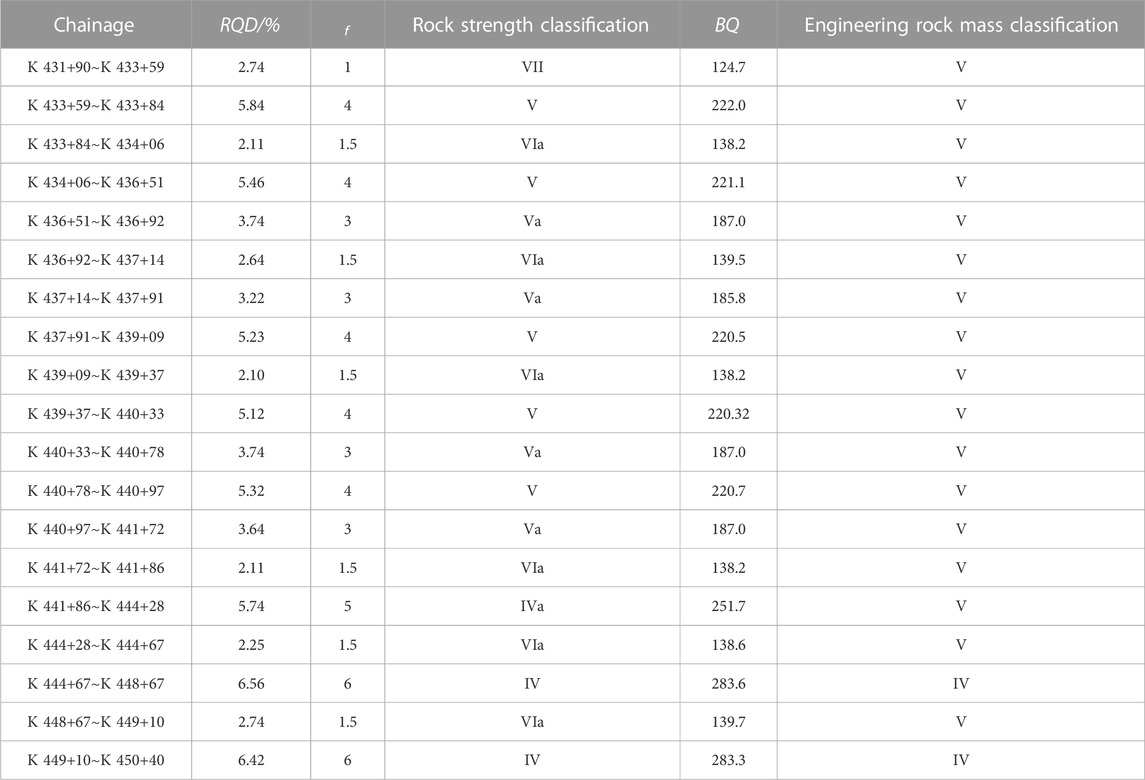
TABLE 5. Classification of tunnel surrounding rock.
It can be seen from Table 5 that the Russian rock Protodyakonov coefficient classification has a clear correspondence with China’s engineering rock mass classification. The IV surrounding rock of Russian rock Protodyakonov coefficient classification corresponds to the IV surrounding rock of BQ classification, and the V∼VII surrounding rock of Russian rock Protodyakonov coefficient classification is equivalent to the V surrounding rock of BQ classification. The main reason for the difference in the classification of the two methods is that the rock strength quantitative classification index only has the rock Protodyakonov coefficient indicating the rock strength, while the BQ quantitative classification index selects the compressive strength for characterizing the rock strength and the integrity coefficient characterizing the integrity of the rock mass.
At the same time, the physical and mechanical parameters of the surrounding rock were estimated, which can provide a theoretical basis for the subsequent construction and optimal design. The parameters are shown in Table 6.
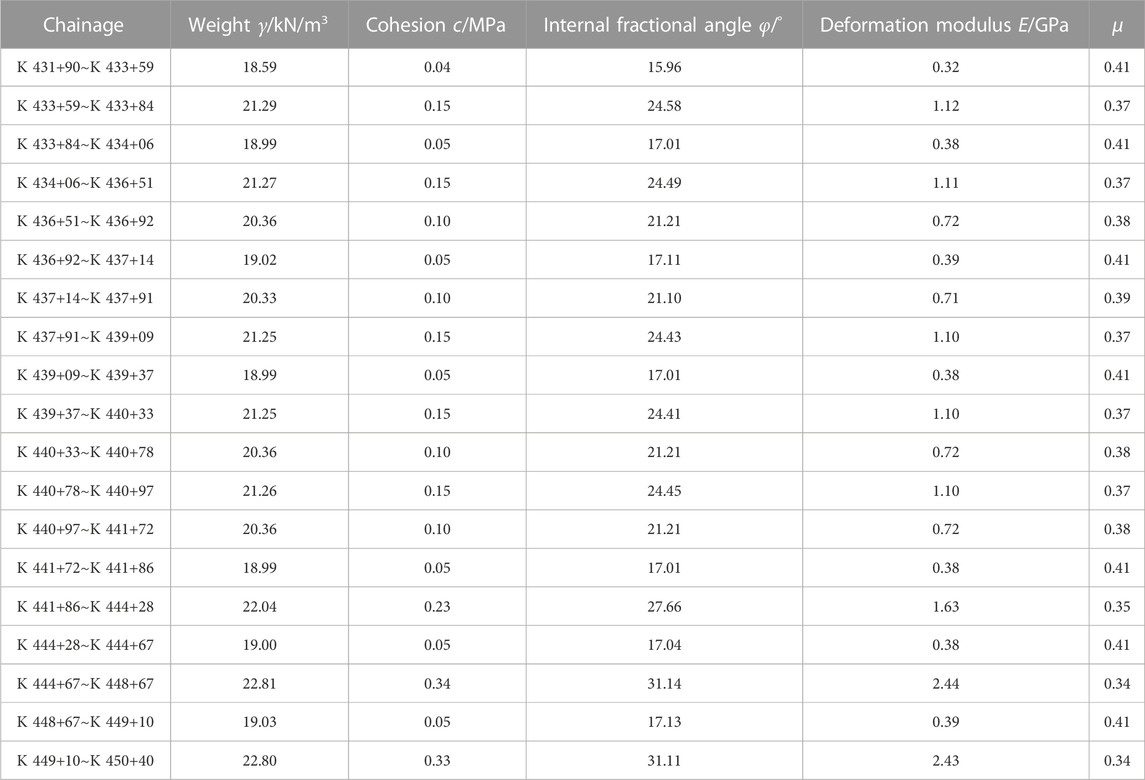
TABLE 6. Estimation of physical and mechanical parameters of rock mass.
7 Conclusion
The surrounding rocks of Kyrgyzstan’s north-south cross-ridge tunnel are classified according to Russian standards. The tunnel is built according to the tunnel construction concept of China. Different grades of surrounding rock correspond to different construction schemes, so the problem of on-site communication difficulties appeared during the tunnel construction process. Therefore, the correlation between the BQ classification of Chinese engineering rock mass and the classification of Russian rock Protodyakonov coefficient f is studied.
(1) This paper establishes a correlation between the basic quality (BQ) of a rock mass and the Protodiakonov coefficient (f) for rock classification. It solves the differences in construction concepts due to the differences in the surrounding rock classification system in engineering construction.
(2) Based on the UCS equivalence principle, the correlation between BQ and f is deduced from the empirical formula between f, BQ, and UCS. According to the equivalent principle of volumetric joint coefficients (Jv), the correlation between Kv and RQD is deduced by using the empirical formula and linear regression analysis between Kv, RQD, and Jv. Then the relationship between BQ, f, and RQD was obtained.
(3) The corresponding tables of rock mass classification for Russian rock Protodyakonov coefficient classification and China’s engineering rock mass classification are obtained. Russian rock Protodyakonov coefficient classification is divided into corresponding China’s engineering rock mass classification according to different RQD values. When RQD < 14, this kind of surrounding rock is unfavorable to tunnel excavation, so the rock mass is divided into V rock mass no matter what the value of f is. When f < 2, this kind of surrounding rock is not conducive to tunnel excavation, so no matter how large the RQD value, the rock mass is divided into V surrounding rock.
(4) In the North and South Cross-Ridge Tunnel of Kyrgyzstan, The IV surrounding rock of Russian rock Protodyakonov coefficient classification corresponds to the IV surrounding rock of BQ classification. The V∼VII surrounding rock of Russian rock Protodyakonov coefficient classification is equivalent to the V surrounding rock of BQ classification.
Data availability statement
The raw data supporting the conclusion of this article will be made available by the authors, without undue reservation.
Author contributions
ZJ conceived of the presented idea. ZJ developed the theory and performed the computations. JL and XZ verified the analytical methods. ZS encouraged JL to investigate BQ and RQD and supervised the findings of this work. All authors contributed to the article and approved the submitted version.
Funding
This study would not have been possible without financial support from the Science and Technology Innovation Team of Shaanxi Innovation Capability Support Plan (No. 2020TD005) and Shaanxi Province Housing and Rural Construction Science and Technology Plan (No. 2019-K39).
Conflict of interest
Authors ZJ and XZ were employed by China Communications Construction Group Southwest Construction Co., Ltd.
The remaining authors declare that the research was conducted in the absence of any commercial or financial relationships that could be construed as a potential conflict of interest.
Publisher’s note
All claims expressed in this article are solely those of the authors and do not necessarily represent those of their affiliated organizations, or those of the publisher, the editors and the reviewers. Any product that may be evaluated in this article, or claim that may be made by its manufacturer, is not guaranteed or endorsed by the publisher.
References
Barton, N. (1974). A review of the shear strength of filled discontinuities in rock. Norwegian Geotechnical Institute Publication, 105.
Barton, N. (2002). Some new Q-value correlations to assist in site characterisation and tunnel design. Int. J. rock Mech. Min. Sci. 39 (2), 185–216. doi:10.1016/S1365-1609(02)00011-4
Bieniawski, Z. T. (1978). “Determining rock mass deformability: experience from case histories,” in International journal of rock mechanics and mining sciences and geomechanics abstracts (Pergamon), 15, 237–247. doi:10.1016/0148-9062(78)90956-7
Bieniawski, Z. T. (1989). Engineering rock mass classifications: A complete manual for engineers and geologists in mining, civil, and petroleum engineering. John Wiley and Sons.
Chen, C. S., and Liu, Y. C. (2007). A methodology for evaluation and classification of rock mass quality on tunnel engineering. Tunn. Undergr. Space Technol. 22 (4), 377–387. doi:10.1016/j.tust.2006.10.003
Chen, Z., Song, D., Du, Y., and Dong, L. (2023). Investigation on the spatial distribution of landslides in Sichuan Province, southwest China. Geomatics, Nat. Hazards Risk 14 (1), 2232085. doi:10.1080/19475705.2023.2232085
Dai, B., Li, D., Zhang, L., Liu, Y., Zhang, Z., and Chen, S. (2022). Rock mass classification method based on entropy weight–TOPSIS–grey correlation analysis. Sustainability 14 (17), 10500. doi:10.3390/su141710500
Deere, D. U., Coon, R. F., and Merritt, A. H. (1969). Engineering classification of in-situ rock. ILLINOIS UNIV AT URBANA DEPT OF CIVIL ENGINEERING.
Du, H., Song, D., Chen, Z., and Guo, Z. (2020). Experimental study of the influence of structural planes on the mechanical properties of sandstone specimens under cyclic dynamic disturbance. Energy Sci. Eng. 8 (11), 4043–4063. doi:10.1002/ese3.794
Du, H., Song, D., Liu, G., Guo, W., Wang, X., and Bai, R. (2023). Influence of the extra-thick coal seam exploitation on the deformation characteristics of the overlying rock mass in an open-pit mine slope. Geomatics, Nat. Hazards Risk 14 (1), 1–23. doi:10.1080/19475705.2022.2161952
Gökceoğlu, C., Ulusay, R., and Sönmez, H. (2000). Factors affecting the durability of selected weak and clay-bearing rocks from Turkey, with particular emphasis on the influence of the number of drying and wetting cycles. Eng. Geol. 57 (3-4), 215–237. doi:10.1016/S0013-7952(00)00031-4
Guo, C., Xian, X., Wu, X., Yao, W., and Zhang, C. (2008). The relationship among rock gushing Energy, the Protodyakonov coefficient and rock strengt. J. Civ. Environ. Eng. 30 (06), 28–31. (in Chinese).
Guo, S. F., Qi, S. W., and Saroglou, C. (2020). A-BQ, a classification system for anisotropic rock mass based on China National Standard. J. Central South Univ. 27 (10), 3090–3102. doi:10.1007/s11771-020-4531-7
Hashemi, M., Moghaddas, S., and Ajalloeian, R. (2010). Application of rock mass characterization for determining the mechanical properties of rock mass: A comparative study. Rock Mech. Rock Eng. 43, 305–320. doi:10.1007/s00603-009-0048-y
Hoek, E., and Brown, E. T. (1997). Practical estimates of rock mass strength. Int. J. rock Mech. Min. Sci. 34 (8), 1165–1186. doi:10.1016/S1365-1609(97)80069-X
Jiang, Z., Meng, Y., and Zhang, L. (2013). Study of the correlation of rock mass classification’s quantitative indices in coal mine. Appl. Sci. 36 (6), 722–726. (in Chinese).
Kaya, A., Karaman, K., and Bulut, F. (2017). Geotechnical investigations and remediation design for failure of tunnel portal section: A case study in northern Turkey. J. Mt. Sci. 14, 1140–1160. doi:10.1007/s11629-016-4267-x
Laubscher, D. H. (1990). A geomechanics classification system for the rating of rock mass in mine design. J. South. Afr. Inst. Min. Metallurgy 90 (10), 257–273.
Li, D., Jia, W., Cheng, X., Zhao, L., Zhang, Y., and Yu, P. (2022). Limit state analysis of stepped sliding of jointed rock slope based on tensile-shear composite failure mode of rock bridges. Bull. Eng. Geol. Environ. 81 (6), 233. doi:10.1007/s10064-022-02731-x
Liu, K., Liu, B., and Fang, Y. (2019). An intelligent model based on statistical learning theory for engineering rock mass classification. Bull. Eng. Geol. Environ. 78, 4533–4548. doi:10.1007/s10064-018-1419-y
Luo, X., Jiang, N., Fan, X., Mei, N., and Luo, H. (2015). Effects of freeze–thaw on the determination and application of parameters of slope rock mass in cold regions. Cold Regions Sci. Technol. 110, 32–37. doi:10.1016/j.coldregions.2014.11.002
Nicholson, G. A., and Bieniawski, Z. T. (1990). A nonlinear deformation modulus based on rock mass classification. Int. J. Min. Geol. Eng. 8, 181–202. doi:10.1007/BF01554041
Palmstrom, A., and Broch, E. (2006). Use and misuse of rock mass classification systems with particular reference to the Q-system. Tunn. Undergr. space Technol. 21 (6), 575–593. doi:10.1016/j.tust.2005.10.005
Palmström, A. (1996). Characterizing rock masses by the RMi for use in practical rock engineering: part 1: the development of the rock mass index (RMi). Tunn. Undergr. space Technol. 11 (2), 175–188. doi:10.1016/0886-7798(96)00015-6
Ren, S., Zhao, Y., Liao, J., Liu, Q., and Li, Y. (2022). Lugeon test and grouting application research based on RQD of grouting sections. Sustainability 14 (19), 12748. doi:10.3390/su141912748
Song, Z., Shi, G., Zhao, B., Zhao, K., and Wang, J. (2020). Study of the stability of tunnel construction based on double-heading advance construction method. Adv. Mech. Eng. 12 (1), 168781401989696. doi:10.1177/1687814019896964
Song, Z., Song, W., Cheng, Y., Yang, T., Wang, T., and Wang, K. (2022). Investigation on strain characteristics and fatigue constitutive model of limestone under osmotic pressure and cyclic disturbance coupling. KSCE J. Civ. Eng. 26 (4), 1740–1753. doi:10.1007/s12205-022-1416-3
Song, Z., Tian, X., Zhang, Y., and Wang, J. (2019). Optimization analysis of controlled blasting for passing through houses at close range in super-large section tunnels. Adv. Civ. Eng. 2019, 1–16. doi:10.1155/2019/1941436
Tian, X., Song, Z., and Wang, J. (2019). Study on the propagation law of tunnel blasting vibration in stratum and blasting vibration reduction technology. Soil Dyn. Earthq. Eng. 126, 105813. doi:10.1016/j.soildyn.2019.105813
Wang, C., Cheng, Y., Yi, M., Lei, Y., and He, X. (2020). Powder mass of coal after impact crushing: A new fractal-theory-based index to evaluate rock firmness. Rock Mech. Rock Eng. 53, 4251–4270. doi:10.1007/s00603-020-02174-4
Wang, J., Zhou, P., Song, Z., Li, S., and Zhang, Q. (2022). A new calculation method for tunneling-caused stratum settlement. KSCE J. Civ. Eng. 26 (6), 2624–2640. doi:10.1007/s12205-022-1258-z
Wang, S. C., He, F. L., and Li, C. S. (2007). Rock mass classification of tunnel engineering. Chengdu: Southwest Jiao Tong University Press.
Yan-jun, S., Rui-xin, Y., Geng-she, Y., Guang-li, X., and Shan-yong, W. (2017). Comparisons of evaluation factors and application effects of the new [BQ] GSI system with international rock mass classification systems. Geotechnical Geol. Eng. 35, 2523–2548. doi:10.1007/s10706-017-0259-z
Zhang, L., and Einstein, H. H. (2004). Using RQD to estimate the deformation modulus of rock masses. Int. J. Rock Mech. Min. Sci. 41 (2), 337–341. doi:10.1016/S1365-1609(03)00100-X
Zhang, Q., Huang, X., Zhu, H., and Li, J. (2019). Quantitative assessments of the correlations between rock mass rating (RMR) and geological strength index (GSI). Tunn. Undergr. Space Technol. 83, 73–81. doi:10.1016/j.tust.2018.09.015
Zhao, Y., Zhang, C., Wang, Y., and Lin, H. (2021). Shear-related roughness classification and strength model of natural rock joint based on fuzzy comprehensive evaluation. Int. J. Rock Mech. Min. Sci. 137, 104550. doi:10.1016/j.ijrmms.2020.104550
Keywords: tunnel, rock mass basic quality (BQ), Protodyakonov coefficient (f), velocoty index of rock mass (Kv), rock quality designation (RQD)
Citation: Ji Z, Li J, Zhang X and Song Z (2023) A quantitative assessment method for the correlation between rock mass basic quality and Protodyakonov coefficient. Front. Earth Sci. 11:1249866. doi: 10.3389/feart.2023.1249866
Received: 29 June 2023; Accepted: 24 August 2023;
Published: 08 September 2023.
Edited by:
Yong Wang, Southwest Petroleum University, ChinaReviewed by:
Yanlin Zhao, Hunan University of Science and Technology, ChinaDanqing Song, South China University of Technology, China
Copyright © 2023 Ji, Li, Zhang and Song. This is an open-access article distributed under the terms of the Creative Commons Attribution License (CC BY). The use, distribution or reproduction in other forums is permitted, provided the original author(s) and the copyright owner(s) are credited and that the original publication in this journal is cited, in accordance with accepted academic practice. No use, distribution or reproduction is permitted which does not comply with these terms.
*Correspondence: Jinhang Li, bGlqaG1sQHhhdWF0LmVkdS5jbg==