 Chenhao Zhu1,2
 Zhiqing Li
- 1Sino Rail Information Engineering Group Co., Ltd., Beijing, China
- 2Beijing Zhongyan Tiandi Technology Co., Ltd., Beijing, China
- 3Key Laboratory of Shale Gas and Geoengineering, Institute of Geology and Geophysics, Chinese Academy of Sciences, Beijing, China
- 4College of Earth and Planetary Science, University of Chinese Academy of Sciences, Beijing, China
- 5Innovation Academy for Earth Science, Chinese Academy of Sciences, Beijing, China
- 6School of Engineering and Technology, China University of Geosciences, Beijing, China
- 7Anhui Wantou Real Estate Co., Ltd., Anhui, China
- 8Yunnan Communications Investment and Construction Group Co., Ltd., Kunming, China
- 9Yunnan Huiqiao Expressway Co., Ltd., Qujing, China
The utilization of enzyme-induced calcium carbonate precipitation (EICP) to consolidate aeolian sand has received significant attention in recent years. When EICP was used and cementing solution was injected in stages, the calcium carbonate content and uniformity were not improved simultaneously. A method is proposed to alleviate this problem by pre-reacting urea and urease before injecting the cementing solution and speeding up the injection rate. Experiments were designed to compare staged injections of EICP-cemented aeolian sand with and without the use of prehydrolysis and with different injection rates. The results show that 1) at the same injection rate, the content of calcium carbonate in the prehydrolysis samples after 12 injections was 66.1% higher than that in the samples without prehydrolysis. 2) When using prehydrolysis, the calcium carbonate content as a function of the injection rate decreased in the following order: 10 mL/min >15 mL/min >7.5 mL/min. The highest amount of calcium carbonate was generated at an injection rate of 10 mL/min and was mainly distributed on the surface. The calcium carbonate generated with an injection rate of 15 mL/min was uniformly distributed in the sand. These results indicate that the method could improve the efficiency of calcium carbonate generation and distribution uniformity, and could also be applied to form a hard crust on the surface of sandy soil or for reinforcing sandy soil by multiple injections.
1 Introduction
Recently, microbial mineralization technology, a new technology in the field of geotechnical reinforcement, has received extensive attention from scholars (Dejong et al., 2011; Montoya and Dejong, 2015). Microbially induced calcite precipitation (MICP) has been studied extensively due to its high efficiency (Bibi et al., 2018; Lv et al., 2020). The results show that MICP technology effectively strengthens the soil and reduces its permeability (Montoya and Dejong, 2015; Helmi et al., 2016). The basic principle is to use urease from urease-producing bacteria such as Sporosarcina pasteurii to decompose urea and produce carbonate ions: carbonate ions and calcium ions in the environment use urease bacteria as nucleation sites to produce calcium carbonate crystals, thus filling soil pores and leading to cementation between soil particles (Pan et al., 2020; Tiwari et al., 2021). The improved method of using urease to directly decompose urea based on MICP is called enzyme-induced calcite precipitation (EICP) (Martin et al., 2020). Microbial mineralization technology has been widely used in many applications, such as reinforcing sandy soil (Pan et al., 2020; Tiwari et al., 2021), strengthening concrete and stone materials (Gavimath et al., 2012; Achal et al., 2013; Khan et al., 2015; Jiang et al., 2016), suppressing dust (Hamdan et al., 2016; Liu et al., 2020; Miao et al., 2020), and controlling pollution (Mitchell and Ferris, 2005; Lai et al., 2020; Zhao et al., 2020; Singh et al., 2021).
Compared with traditional reinforcement methods, EICP and MICP technologies can be controlled in terms of reaction rate and cementation strength, with less environmental pollution (Mitchell and Santamarina, 2005; Portugal et al., 2020). The key to using microbial mineralization technology is to increase the amount and uniformity of calcium carbonate because the effectiveness of EICP reinforcement is related to the amount of calcium carbonate produced. In general, higher amounts of calcium carbonate lead to lower permeabilities and higher strengths (Cheng et al., 2013; Dakhane et al., 2018; Phua and Royne, 2018). For the same amount of calcium carbonate, a more uniform distribution provides a better reinforcement effect (Sa et al., 2021). However, when injecting solutions with identical concentrations and volumes in stages into sandy soils, the runoff colloid must be recovered and reinjected, or the high injection rates will result in a more uniform distribution of calcium carbonate but a lower content because the solute is washed away by the solution; with lower injection rates, more calcium carbonate will be produced, but it will not penetrate deeply because the calcium carbonate on the surface will clog the material (Konstantinou et al., 2021). To enhance the amount or uniformity of calcium carbonate, some scholars have proposed methods such as repeated injection of low-concentration cementing solutions (Qabany et al., 2012), injection from the bottom of the sample (Martinez et al., 2013), and controlling of the pH of the solution (Cheng et al., 2019). However, these methods have difficulty achieving the goal of simultaneously increasing the amount and uniformity of calcium carbonate.
To increase calcium carbonate content and improve the uniformity of its distribution in the sand, inspired by the fact that sand particles can be used as nucleation sites to help precipitate calcium carbonate and improve its production (Ferris et al., 2004; Cheng et al., 2013), this paper presents a method to mix urea and urease and then increase the injection rate of the solution to increase the calcium carbonate content, and then increasing the solution injection speed to improve the uniformity of calcium carbonate. The research on this method has not been reported so far. Control experiments to consolidate aeolian sand using EICP were designed, i.e., with or without prehydrolysis and with prehydrolysis and different injection rates. During these experiments, the amounts of calcium carbonate produced in the top, middle and bottom sections of the samples after 3, 6, 9, and 12 injections were examined. In addition, the colloidal morphology of the calcium carbonate was observed using scanning electron microscopy (SEM).
2 Materials and methods
2.1 Materials
The sand used for the experiments was natural wind-deposited sand from the Mu Us Desert in Inner Mongolia, China (coordinates E107.4, N38.2). To reduce the contamination of aeolian sand components by human activities, all aeolian sand was harvested from an open area 100 m away from the road. The gradation curves obtained from particle analysis experiments are shown in Figure 1. The results show that d50 = 0.18 mm, the curvature coefficient Cc = 1.01, and the uniformity coefficient Cu = 2.63<5, so this sand was judged to be poorly graded. In addition, a natural density of ρ = 1.61 g/cm3 was observed. Before being used in the experiments, the sand was rinsed with distilled water to remove soluble salts and a standard of 2 g of distilled water per gram of dry sand was used. Then, the aeolian sand samples was sterilized (aeolian sand was heated in a 100°C baking oven for 24 h to eliminate the effect of microorganisms).
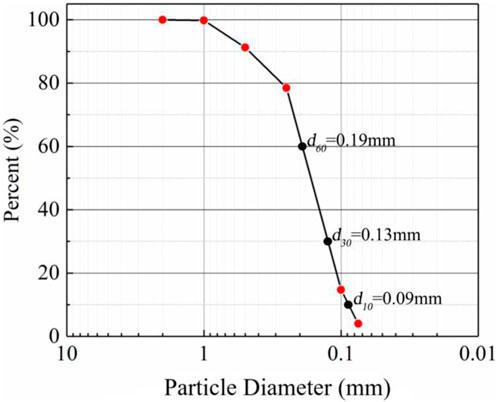
FIGURE 1. Particle size distribution of the aeolian sand from the Mu Us Desert, Inner Mongolia.
Anhydrous calcium chloride and urea were purchased from Tianjin Hengxing Chemical Preparation Co., Ltd. with purities of CaCl2 ≥ 96.0% and CO(NH2)2 ≥ 99.0%, respectively. The urease was purchased from Kamaxu (Shanghai) Biotechnology Co., Ltd. was extracted from giant beans, and exhibited an enzyme activity of 100 U/mg at room temperature. Cylindrical moulds were used for the preparation of the sand column sample. The mould for holding the sand was made of high-density polyethylene and had a cylindrical shape, with a diameter of 5 cm and a height of 10 cm.
2.2 Sample preparation and treatment
To better simulate the natural state of wind-carried deposition, a sand pourer was used to allow the dried sand to fall freely from a height of 80 cm into the mould (Li et al., 2014). Based on the water content rate of the dried sand after reaching water saturation, each specimen was designed to be injected with 67 mL of the solution at a constant rate using a peristaltic pump at each phase. The concentrations of urea and calcium chloride were 1 mol/L and 0.67 mol/L, respectively (Almajed et al., 2018). The concentration of urease was then set at 10 mg/L. A solution injection rate ≥5.83 mL/min prevented specimen clogging (Whiffin et al., 2007) in total, four groups and three injection rates were used: Group 1 (G1) and Group 2 (G2) with an injection rate of 7.5 mL/min, Group 3 (G3) with an injection rate of 10 mL/min, and Group 4 (G4) with an injection rate of 15 mL/min. The cementing solution that flowed out of the mould was not recycled for injection. Table 1 lists the amounts of sand, urea, calcium chloride, and urease added to each sample and the injection rate for each group.
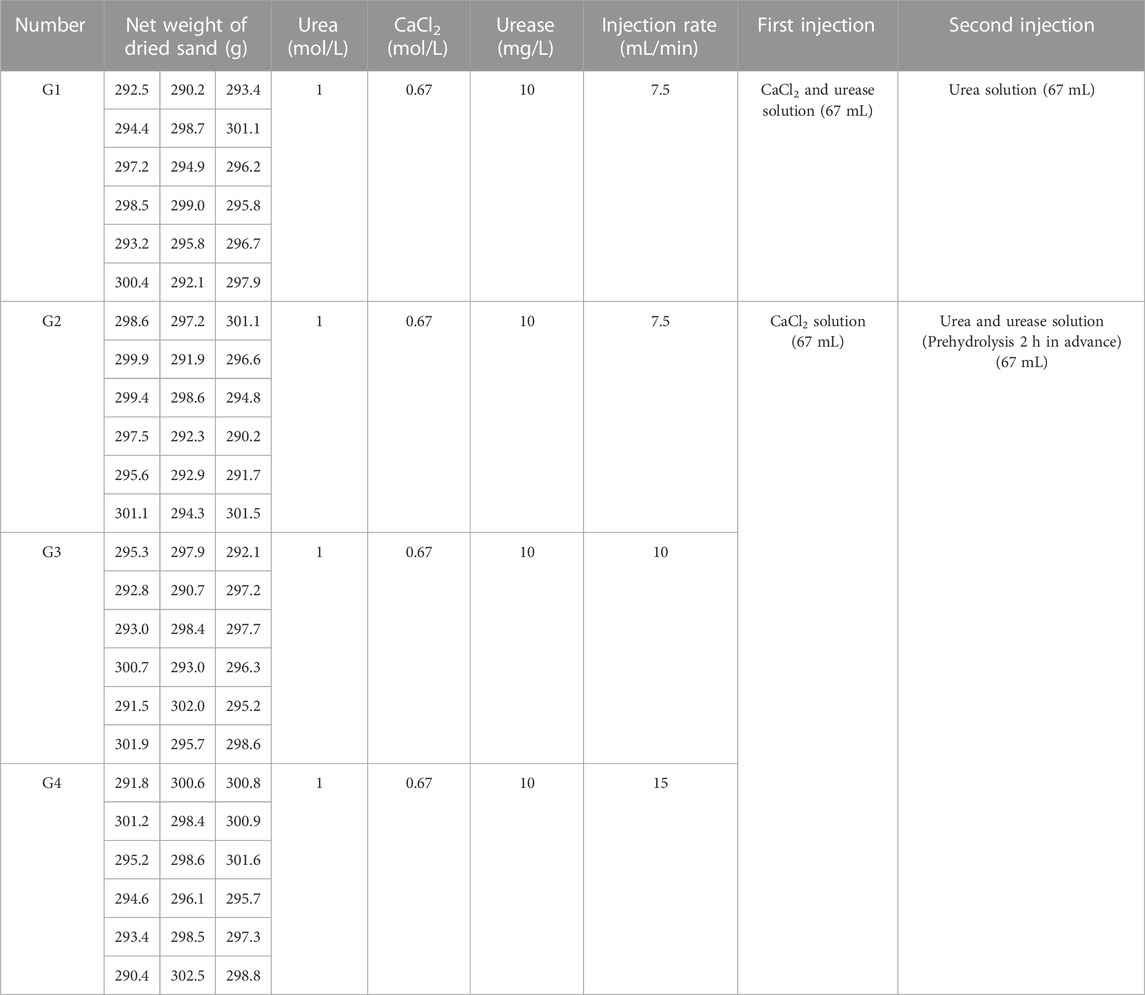
TABLE 1. Content of cementing solution and injection methods used for each group of samples.
The solution injection and sample curing methods are shown in Figure 2. Specifically, before injection, each sample was covered with a layer of filter paper on top. At the time of injection, G1 was injected with 67 mL of a mix of calcium chloride and urea in the first stage and then held at room temperature for 1 h. In the second stage, 67 mL of a urease solution was injected, and the sample was placed into a thermostatic water bath box for maintenance. According to the suitable reaction temperature and reaction time of EICP, the temperature in the thermostatic water bath box was designed to be 30 °C, and the curing time was 48 h (Sahrawat, 1984).
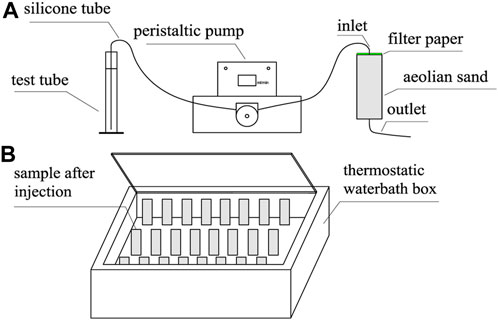
FIGURE 2. Injection of cement solution and sample maintenance method: (A) injection of a cementing solution into the sample using a peristaltic pump; (B) maintenance in a thermostatted water bath at a temperature is 30°C ±1°C.
G2, G3, and G4 were designed as pre-reaction experimental groups, that is, urease and urea were reacted at room temperature for 2 h before injection. The G2, G3, and G4 were injected with 67 mL of calcium chloride solution in the first stage and then left standing at room temperature for 1 h. In the second stage, 67 mL of the mixed solution of urease and urea pre-reacted for 2 h was injected, and immediately placed in a thermostatic water bath box at 30°C for 48 h.
A complete injection in each group included the first and second-stage injections and 48 h post-injection maintenance, and 12 complete injections were performed in each group. Four samples were removed after 3, 6, 9, and 12 injections to detect calcium carbonate content which was not used after the measurements. A total of 12 injections and 4 tests were performed. Therefore, 16 samples were needed for each group of 4 tests. To avoid sample damage affecting the experiment, 2 additional samples were made for each group as backups, so 72 samples were made in total.
When the sand inside the sample was saturated, the flow field of the solution would be in a relatively controlled state (Martinez et al., 2013). In this experiment, the sample was saturated after the first stage of injection, so the internal solution flow field was in a relatively controllable state, which ensured the relative uniformity of calcium carbonate content in the same height plane during sampling. The amounts of calcium carbonate generated at different locations and the total amount of calcium carbonate generated within the samples were measured. The former was used to evaluate the uniformity of calcium carbonate distribution affected by different injection methods, and the latter was used to evaluate the total amount of calcium carbonate generated by different injection methods within each sample. The amount of calcium carbonate produced was tested using the acid-washing method (Montoya and Dejong, 2015).
Because the sample was settled after injection, to test the amount of calcium carbonate generated at different locations, 2 samples were cut along the vertical direction over the center of the circle, as shown in Figure 3, and sand samples were taken for testing from the top, middle, and bottom of the cut surface at three locations in proportion to the height. The sampling volume was 10 mm × 5 mm × 5 mm. The amount of calcium carbonate generated after the nth group of the dth injection was recorded as Gn-d. Each sample was sampled once at each location, and the average of the experimental results of two samples at the same location was taken for analysis.
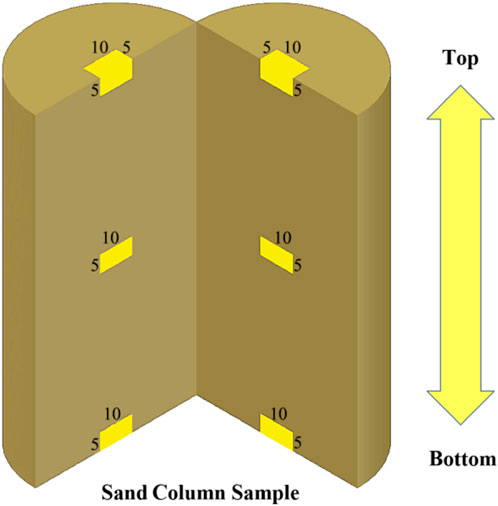
FIGURE 3. Locations of sampling positions for acid washing after sample injection (unit: mm).
To test the total amount of calcium carbonate generated, take out two new specimens, then pour out the sand sample, stir to mix well, and take out about 5 g sand for the acid washing test. This experiment was repeated three times and the average of the three results was taken for comparison.
The removed samples were put into glass dishes injected with distilled water and washed with stirring to remove soluble salts. To avoid aspiration of fine solid particles, the upper layer of clear liquid was aspirated after standing for 1 h and dried after repeating this 3 times, and the dry matter mass was noted as m1. An excess of 0.1 mol/L HCl solution was injected into the dry matter, it was stirred until no bubbles emerged, left for 1 h to aspirate the upper clear layer, rinsed 3 times with distilled water, and then dried. The mass of the dry matter was noted as m2. The mass difference for the dry matter after two drying cycles (m1-m2) divided by m2 was taken as the amount of calcium carbonate generated within a unit of dry sand.
The uniformity of calcium carbonate distribution was calculated using Eq. 1.
Where
2.3 Observation of calcium carbonate cementation morphology
SEM photographs were taken to visualize the sizes and attachment patterns of calcium carbonate. Sampling was performed after 12 injections at 2 locations, the top surface and 1 cm below the top surface, to analyze the internal and external cementation states. The SEM model is Zeiss crossbeam 540.
3 Results
3.1 Effect of prehydrolysis on the generated calcium carbonate
Figure 4 shows the state of the sand at the top of the sample taken after the corresponding number of injections and before acid washing. Figure 4 shows that after 3 injections, a small amount of calcium carbonate precipitation, the insoluble white-grey particles shown in Figure 4, began to appear in the G2 samples, and the substance was not observed in G1. After 6 to 12 injections, a large amount of insoluble white-grey particles appeared in the G2 samples, and G1 began to show a small amount after 6 to 9 injections and a large amount of the substance after 12 injections. The white-grey particles disappeared immediately after the injection of hydrochloric acid solution. This is because the hydrochloric acid reacts with carbonates.
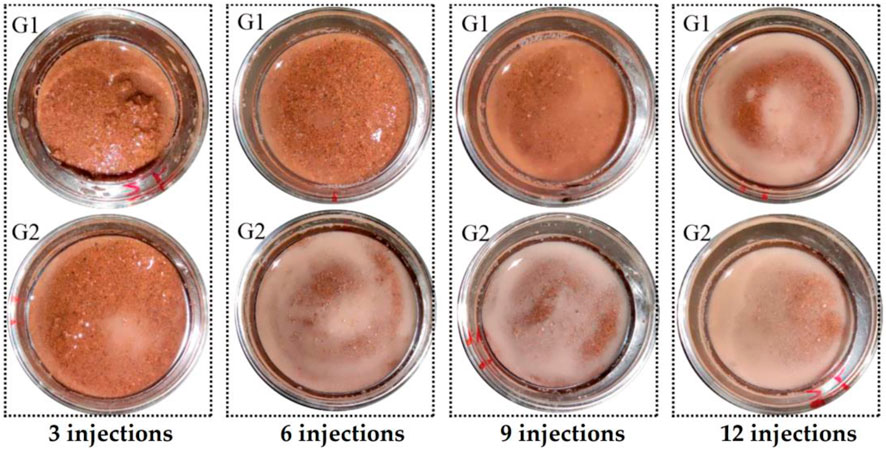
FIGURE 4. Status of the sample after EICP treatment and before acid washing.
Figure 5 shows the calcium carbonate distributions of the G1 sample without prehydrolysis and the prehydrolysed G2 samples. The amounts of calcium carbonate produced in the top and middle positions of G2 samples were higher than those of G1 samples after each injection, and the differences became more significant after multiple injections. The difference in calcium carbonate contents between the tops of the G2 and G1 samples after the 9th injection reached the highest level of 93.4%. However, the difference in calcium carbonate contents at the bottoms of the samples was small, and the amount of calcium carbonate generated at the bottom of G2 was even smaller than that of G1 after the first nine injections; the largest difference occurred after the 6th injection when G1 generated 36.1% more calcium carbonate than G2 at the bottom. This may be because, during the injection of the solution, the calcium carbonate generated later was separated from the solution by the calcium carbonate produced earlier (Singh et al., 2021). This resulted in lower uniformity for G2 than for G1 at all times after different injections (Figure 6).
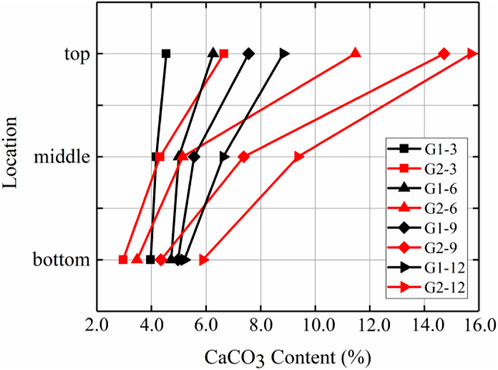
FIGURE 5. Distribution of calcium carbonate in the vertical direction after different numbers of injections of G1 and G2.
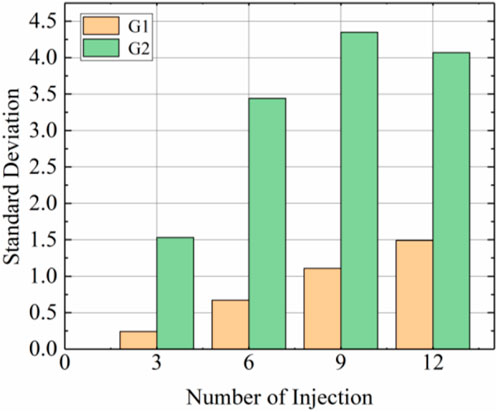
FIGURE 6. Standard deviation of calcium carbonate distribution after different injections of G1 and G2.
Figure 7 shows the total calcium carbonate content after different numbers of injections for G2 and G1. The data illustrate that, first, the total amount of calcium carbonate produced within the sample increased gradually after several injections, regardless of whether it was prehydrolysed. Comparing the slope of each segment of the curve showed that the slopes for G2 increased in each segment and that the slopes of G1 changed less. The slope represents the growth rate for total calcium carbonate content, so the total calcium carbonate content of G2 grew more rapidly with increases in the number of injections. Second, the total calcium carbonate content was higher in G2 than in G1. A total of 10.4% more calcium carbonate was produced in G2 than in G1 after 3 injections and 66.1% more calcium carbonate was produced in G2 than in G1 after 12 injections. The above 2 points suggest that prehydrolysis increased the total calcium carbonate content, and calcium carbonate content grew at increasingly faster rates.
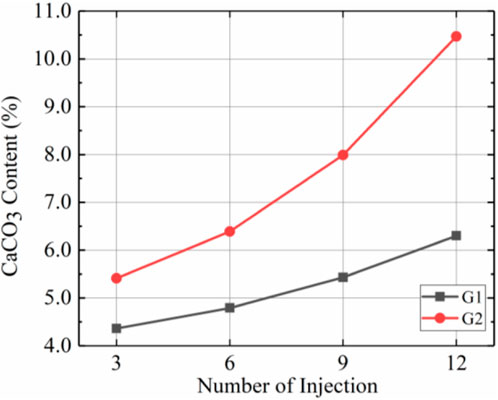
FIGURE 7. Total calcium carbonate content after different injections of G1 and G2.
According to Figures 5–7, the use of prehydrolysis improved the total calcium carbonate content by 66.7% after 12 injections, but prehydrolysis caused an uneven distribution of calcium carbonate within the sample; sample G2 showed more calcium carbonate concentrated mainly in the top part than G1 due to the low injection rate (7.5 mL/min).
3.2 Effect of different injection rates on prehydrolysis content of calcium carbonate
Figure 8 demonstrates the amounts of calcium carbonate produced at the top, middle and bottom positions for different injection rates with the prehydrolysis samples. These results showed that the amounts of calcium carbonate produced at different locations in G3 (10 mL/min) after each injection were greater than those of the corresponding locations in G2 (7.5 mL/min). However, the amounts of calcium carbonate produced at different locations of G3 were lower than those at the corresponding location of G4 (15 mL/min) after 3 injections. After 6 injections, the calcium carbonate content in the top and middle sections of G3 began to exceed those of G4; especially after 9 injections, G3 produced 66.7% more calcium carbonate than that produced at the top of G4. This indicates that when the injection rate was increased from 7.5 mL/min to 10 mL/min while using the prehydrolysis method, the amount of calcium carbonate produced at different locations was improved after several injections, but the amount of calcium carbonate produced at different locations started to decrease after reaching a rate of 15 mL/min.
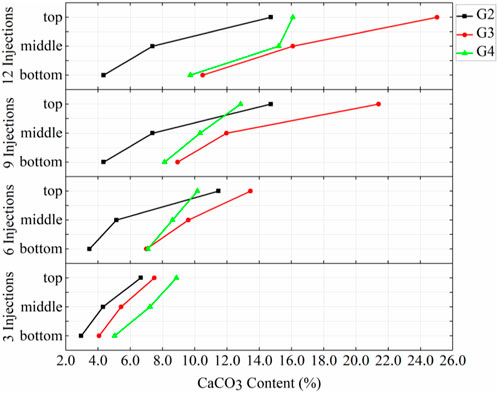
FIGURE 8. Distributions of calcium carbonate in G2, G3, and G4 after different numbers of injections.
Figure 9 shows standard deviations for calcium carbonate content with each group using prehydrolysis and different injection rates. These results showed that the standard deviation of calcium carbonate distribution tended to increase with the number of injections, with the standard deviations decreasing in the order G3>G2>G4 after 12 injections. The distribution of calcium carbonate in the G3 sample was the most uneven because calcium carbonate in G3 was mainly produced in the top section; content in the middle section was 66.4% of that in the top part and content in the bottom section was only 42.0% of that in the top part. The distribution of calcium carbonate in G4 was the most uniform, and the standard deviation was only 46.7% of that for G3 after 12 injections, which indicated that the uniformities of the prehydrolysis samples were improved by increasing the injection rate to 15 mL/min.
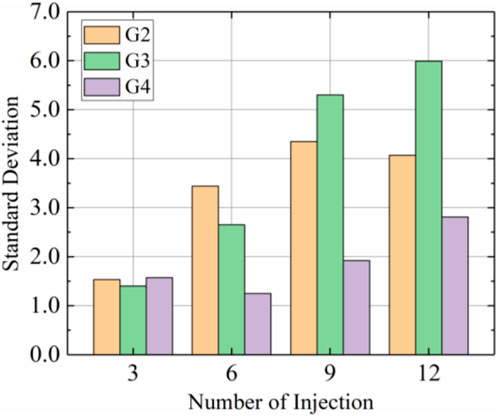
FIGURE 9. Standard deviations of calcium carbonate distributions after different injections in samples G2, G3, and G4.
Figure 10 demonstrates the total calcium carbonate content after different numbers of injections for the G2, G3, and G4 samples. These results show that the total amount of calcium carbonate produced after 12 injections decreased in the order G3 > G4 > G2. Total calcium carbonate content was higher in G3 than in all other groups except after the 3rd injection when it was lower than that in G4. For example, after 12 injections, G3 produced 59.0% and 28.5% more calcium carbonate than G2 and G4, respectively. Therefore, the optimal injection rate for increasing total calcium carbonate content after prehydrolysis was 10 mL/min.
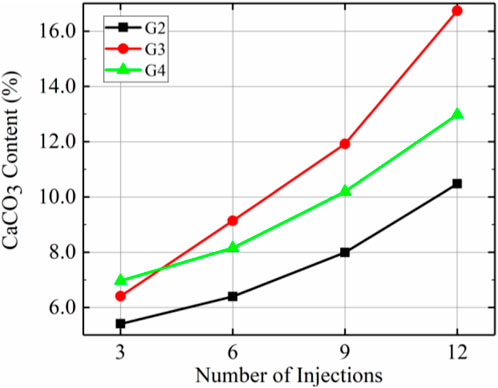
FIGURE 10. Total calcium carbonate content of G2, G3, and G4 after different injections.
According to Figures 8–10, the injection rate corresponding to the highest amount of calcium carbonate produced after prehydrolysis was 10 mL/min, and 16.7% calcium carbonate was produced per gram of dry sand after 12 injections. However, since calcium carbonate was mainly distributed at the top, this calcium carbonate distribution was the most uneven. The most uniform distribution of calcium carbonate was that for G4, with a standard deviation that was 46.7% of that for G3 after 12 injections, and a calcium carbonate content that reached 77.5% of that for G3.
3.3 Differences in the cementation state of calcium carbonate in different positions
Figures 11A–D shows SEM images of the cementation morphologies of calcium carbonate in the samples treated with EICP. Figures 11A, B show that the generated calcium carbonate precipitate formed a thick film blocking the pores between sand particles at the inlet surface of the solution injection, which explained why solutions injected in the first and second stages could not penetrate downward when the solution was injected in phases. Figures 11C, D show that the thicknesses of calcium carbonate were approximately 10–25 µm inside the samples, and calcium carbonate was generated around sand particles serving as nucleation sites and attached to the sand particles instead of being distributed between the pores in a diffuse state. This suggests that Sand particles can be used as nucleation sites for the separation of calcium carbonate from solution (Banfield and Zhang, 2001; Kawaguchi and Decho, 2002; Achal and Mukherjee, 2015; Bains et al., 2015; Hamdan and Kavazanjian, 2016; Almajed et al., 2020).
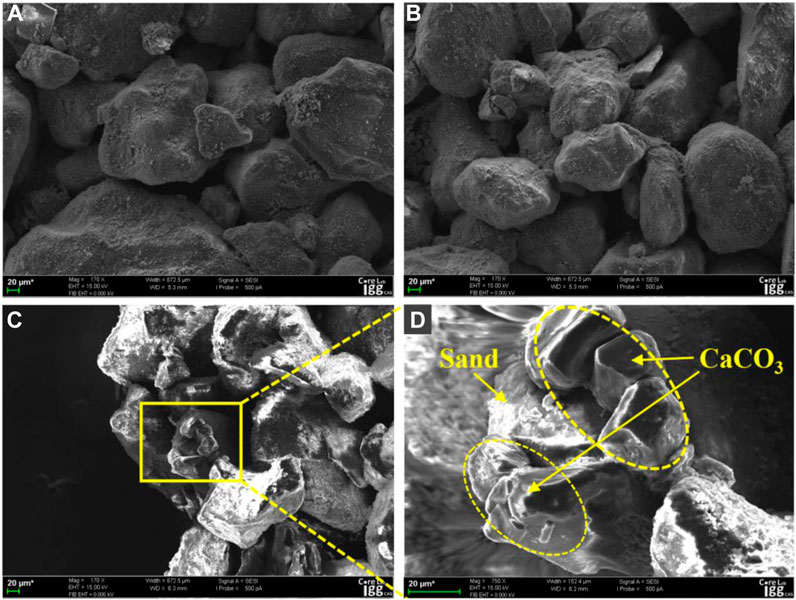
FIGURE 11. SEM images of calcium carbonate cementation states after 12 injections of the G3 sample: (A,B) show views from the top surface of G3; (C,D) show views from 1 cm below the top surface of G3.
4 Discussion
4.1 Mechanism by which prehydrolysis promotes calcium carbonate content
The results for the distribution of calcium carbonate content and total calcium carbonate content with and without the use of prehydrolysis, as shown in Figures 5, 7, indicate that prehydrolysis effectively increased the total content of calcium carbonate, but under the condition of low flow rate, the more generated calcium carbonate is mainly distributed in the top.
The reason why prehydrolysis increased EICP content is that prehydrolysis accelerated the 2 processes of the EICP, reaction, and precipitation cementation. The EICP reaction can be divided into three stages (Ferris et al., 2004); in the first stage, the ammonium carbonate generated by the hydrolysis of urea reacts with calcium chloride, and a supersaturated calcium carbonate solution is formed. In the second stage, calcium carbonate crystals nucleate at critical saturation points. In the third stage, the calcium carbonate precipitate grows at the nucleation site by stable precipitation. We consider prehydrolysis to be optimized for all three phases. In the first stage, part of the carbonate produced by prehydrolysis reacts rapidly after injection with adjacent calcium ions to produce a supersaturated calcium carbonate solution, which partially solves the problem of calcium ions being washed away. In the second stage, the rapidly formed supersaturated calcium carbonate solution nucleates and precipitates around the sand particles. In the third stage, the calcium carbonate generated first becomes a site for later calcium carbonate nucleation (Cheng et al., 2013), helping the subsequent formation of calcium carbonate precipitates from the supersaturated calcium carbonate solution and reducing the amount of calcium carbonate carried out by the water flow. Thus, after 12 injections at the same injection rate, the total calcium carbonate content in G2 reached 1.7 times that of G1, demonstrating that prehydrolysis substantially increased calcium carbonate content.
The reason for the low content of calcium carbonate in G1 is that as biologically active materials, the rate of the urea and urease reaction was much slower than the rate of reaction between calcium ions and carbonate. The rate of decomposition of urea at 20 °C was only 1.1 mmol/(L*day), and the rate of decomposition tended to decrease gradually with increasing temperature (Mitchell and Ferris, 2005). Even when all materials were mixed in a test tube, it took 15 min to observe turbidity in the solution, and 30–40 min before calcium carbonate slowly formed a precipitate (Martin et al., 2020). Although the use of phased injection of the cementing solution brought about a more uniform spatial distribution of calcium carbonate, it caused the material injected water to wash away the first injected solution; the higher the injection rate was, the more significant this negative effect was. Even using a minimum injection rate of 7.5 mL/min with G1, it took less than 9 min to inject 67 mL of solution, a period during which the urea and urease could not achieve full contact and react within the samples to form ammonium carbonate.
4.2 Effect of injection rate on calcium carbonate content during prehydrolysis
Figure 7 shows that prehydrolysis increased the amount of calcium carbonate produced, but the results of Figure 6 reveal that prehydrolysis increased the inhomogeneity of calcium carbonate. Combining Figures 9, 10 shows that simultaneous increases in total calcium carbonate content and homogeneity were achieved by accelerating the injection rate to 15 mL/min of the cementing solution.
At an injection rate of 7.5 mL/min, prehydrolysis decreased the uniformity of calcium carbonate distribution, although it increased the amount of calcium carbonate produced. This was due to the low injection rate. Therefore, after using prehydrolysis to increase the amount of calcium carbonate produced, it was possible to use a higher injection rate to improve the uniformity of calcium carbonate distribution and achieve increased calcium carbonate content and uniformity of distribution at the same time. The total amounts of calcium carbonate produced in the samples after repeated injections were higher for G3 with a 10 mL/min injection rate than for the other groups. Accordingly, analysis of Figure 8 shows that the calcium carbonate distribution in G3 was also more uneven at the latter stage of the process due to the large amount of calcium carbonate produced at the top. With a 15 mL/min injection rate, the total amount of calcium carbonate produced reached 78% of that of G3 after 12 injections. Figure 8 shows that the distribution of calcium carbonate in G4 was more uniform, and the standard deviation of calcium carbonate content was the lowest among the three groups using prehydrolysis. A prehydrolysis injection rate of 10 mL/min was suitable for spraying to form a hard crust on the dust surface and prevent wind erosion because calcium carbonate was mainly generated in a depth range of 0–5 cm at this injection rate (Jiang et al., 2016). A prehydrolysis injection rate of 15 mL/min promoted a more uniform distribution of calcium carbonate in sandy soil, which was suitable for generating more calcium carbonate to enhance the overall mechanical strength of sandy soil after repeated injections (Cheng et al., 2013). The injection rate of 15 mL/min is the optimal condition for the experimental objectives.
5 Conclusion
This paper proposes an optimized approach involving prehydrolysis of urea and urease with accelerated injection rates to improve the amount and uniformity of calcium carbonate content before using EICP to reinforce sandy soils. Through comparative tests, the effects of prehydrolysis and different injection rates on the amount and distribution of calcium carbonate content are examined. Meanwhile, the mineralized external cementation state was observed by SEM. The following conclusions are obtained:
1. At the same injection rate, the content of calcium carbonate in the prehydrolysis samples was higher than that in the samples without prehydrolysis. The reason why prehydrolysis increased calcium carbonate content is that prehydrolysis accelerated the 2 processes of the EICP, reaction, and precipitation cementation, which can reduce the amount of calcium carbonate carried out by the water flow.
2. The injection rate affects the total amount and uniformity of calcium carbonate when using the staged injection method. 10 mL/min produces the greatest amount of calcium carbonate but is only mainly distributed at the top. While 15 mL/min results in a uniform distribution of calcium carbonate inside and outside the sand. Higher injection rates can be used to improve the uniformity of calcium carbonate distribution.
3. The Prehydrolysis and an Accelerated Injection Rate could be a viable method to simultaneously improve the efficiency of calcium carbonate generation and distribution uniformity, and could also be applied to form a hard crust on the surface of sandy soil or for reinforcing sandy soil by multiple injections.
Data availability statement
The original contributions presented in the study are included in the article/Supplementary Material, further inquiries can be directed to the corresponding authors.
Author contributions
Conceptualization, ZL; data curation, CZ and YZ; formal analysis, ZL; investigation, YZ; methodology, ZL; project administration, ZL, ZZ, and YxZ; validation, ZL and JW; writing—original draft, CZ and YZ; writing and editing draft, ZL. All authors contributed to the article and approved the submitted version.
Funding
This research is financially supported by the Second Tibetan Plateau Scientific Expedition and Research Program (STEP) (Grant No. 2019QZKK0904), the National Key Research and Development Plan of China (Grant No. 2019YFC1509903), the Major Projects of Financial Science and Technology Plan of Xinjiang Production and Construction Corps (Grant No. 2020AA002) and the Key Research and Development Plan of Yunnan Province (Grant No. 202103AA080013).
Conflict of interest
Author CZ was employed by Sino Rail Information Engineering Group Co., Ltd. and Beijing Zhongyan Tiandi Technology Co., Ltd. Author YuZ was employed by Anhui Wantou Real Estate Co., Ltd. Author YZ was employed by Yunnan Communications Investment and Construction Group Co., Ltd. Author JW was employed by Yunnan Huiqiao Expressway Co, Ltd.
The remaining authors declare that the research was conducted in the absence of any commercial or financial relationships that could be construed as a potential conflict of interest.
Publisher’s note
All claims expressed in this article are solely those of the authors and do not necessarily represent those of their affiliated organizations, or those of the publisher, the editors and the reviewers. Any product that may be evaluated in this article, or claim that may be made by its manufacturer, is not guaranteed or endorsed by the publisher.
References
Achal, V., Mukerjee, A., and Reddy, M. S. (2013). Biogenic treatment improves the durability and remediates the cracks of concrete structures. Constr. Build. Mater. 48, 1–5. doi:10.1016/j.conbuildmat.2013.06.061
Achal, V., and Mukherjee, A. (2015). A review of microbial precipitation for sustainable construction. Constr. Build. Mater. 93, 1224–1235. doi:10.1016/j.conbuildmat.2015.04.051
Almajed, A., Hamed, K. T., and Edward, K. (2018). Baseline investigation on enzyme-induced calcium carbonate precipitation. J. Geotech. Geoenviron. 144, 11. doi:10.1061/(ASCE)GT.1943-5606.0001973
Almajed, A., Lemboye, K., Arab, M. G., and Alnuaim, A. (2020). Mitigating wind erosion of sand using biopolymer-assisted EICP technique. Soils. Found. 60, 356–371. doi:10.1016/j.sandf.2020.02.011
Bains, A., Dhami, N. K., Mukherjee, A., and Reddy, M. S. (2015). Influence of exopolymeric materials on bacterially induced mineralization of carbonates. Appl. Biochem. Biotechnol. 175, 3531–3541. doi:10.1007/s12010-015-1524-3
Banfield, J. F., and Zhang, H. (2001). Nanoparticles in the environment. Rev. Mineral. Geochem. 44, 1–58. doi:10.2138/rmg.2001.44.01
Bibi, S., Oualha, M., Ashfaq, M. Y., Suleiman, M. T., and Zouari, N. (2018). Isolation, differentiation and biodiversity of ureolytic bacteria of qatari soil and their potential in microbially induced calcite precipitation (MICP) for soil stabilization. RSC Adv. 8, 5854–5863. doi:10.1039/C7RA12758H
Cheng, L., Cord-Ruwisch, R., and Shahin, M. A. (2013). Cementation of sand soil by microbially induced calcite precipitation at various degrees of saturation. Can. Geotech. J. 50, 81–90. doi:10.1139/cgj-2012-0023
Cheng, L., Shahin, M. A., and Chu, J. (2019). Soil bio-cementation using a new one-phase low-pH injection method. Acta Geotech. 14, 615–626. doi:10.1007/s11440-018-0738-2
Dakhane, A., Das, S., Hansen, H., O'Donnell, S., Hanoon, F., Rushton, A., et al. (2018). Crack healing in cementitious mortars using enzyme-induced carbonate precipitation: quantification based on fracture response. J. Mater. Civ. Eng. 30, 4018031–4018035. doi:10.1061/(ASCE)MT.1943-5533.0002218
Dejong, J. T., Soga, K., Banwart, S. A., Whalley, W. R., Barkouki, T., Nelson, D. C., et al. (2011). Soil engineering in vivo: harnessing natural biogeochemical systems for sustainable, multi-functional engineering solutions. J. R. Soc. Interface. 8, 1–15. doi:10.1098/rsif.2010.0270
Ferris, F. G., Phoenix, V., Fujita, Y., and Smith, R. W. (2004). Kinetics of calcite precipitation induced by ureolytic bacteria at 10 to 20°C in artificial groundwater. Geochim. Cosmochim. Ac. 68, 1701–1710. doi:10.1016/S0016-7037(03)00503-9
Gavimath, C. C., Mali, B. M., Hooli, V. R., Mallpur, J. D., and Ravishankera, B. E. (2012). Potential application of bacteria to improve the strength of cement concrete. Int. J. Adv. Biotechnol. Res. 3, 541–544. doi:10.1016/j.micres.2015.03.009
Hamdan, N., and Kavazanjian, E. J. (2016). Enzyme-induced carbonate mineral precipitation for fugitive dust control. Géotechnique 66, 546–555. doi:10.1680/jgeot.15.P.168
Hamdan, N., Zhao, Z., Mujica, M., Kavazanjian, E., and He, X. M. (2016). Hydrogel-assisted enzyme-induced carbonate mineral precipitation. J. Mater. Civ. Eng. 28, 10. doi:10.1061/(ASCE)MT.1943-5533.0001604
Helmi, F. M., Elmitwalli, H. R., Elnagdy, S. M., and El-Hagrassy, A. F. (2016). Calcium carbonate precipitation induced by ureolytic bacteria bacillus licheniformis. Ecol. Eng. 90, 367–371. doi:10.1016/j.ecoleng.2016.01.044
Jiang, N. J., Yoshioka, H., Yamamoto, K., and Soga, K. (2016). Ureolytic activities of a urease-producing bacterium and purified urease enzyme in the anoxic condition: implication for subseafloor sand production control by microbially induced carbonate precipitation (MICP). Ecol. Eng. 90, 96–104. doi:10.1016/j.ecoleng.2016.01.073
Kawaguchi, T., and Decho, A. W. (2002). A laboratory investigation of cyanobacterial extracellular polymeric secretions (EPS) in influencing CaCO3 polymorphism. J. Cryst. Growth. 240, 230–235. doi:10.1016/S0022-0248(02)00918-1
Khan, M., Amarakoon, G., Shimazaki, S., and Kawasaki, S. (2015). Coral sand solidification test based on microbially induced carbonate precipitation using ureolytic bacteria. Mater. Trans. 56, 1725–1732. doi:10.2320/matertrans.M-M2015820
Konstantinou, C., Wang, Y., Biscontin, G., and Soga, K. (2021). The role of bacterial urease activity on the uniformity of carbonate precipitation profiles of bio-treated coarse sand specimens. Sci. Rep. 11, 6161. doi:10.1038/s41598-021-85712-6
Lai, Y., Yu, J., Liu, S., Liu, J., and Dong, B. (2020). Experimental study to improve the mechanical properties of iron tailings sand by using MICP at low pH. Constr. Build. Mater. 273, 121729. doi:10.1016/j.conbuildmat.2020.121729
Li, H., Luo, Q., Zhang, Z., Zhang, L., and Jiang, L. W. (2014). Experimental study on control element of sand pourer preparation of sand foundation model. Chin. J. Geotech. Eng. 36, 1872–1878. doi:10.11779/CJGE201410015
Liu, S., Wang, R., Yu, J., Cai, Y., and Tu, B. X. (2020). Effectiveness of the anti-erosion of an MICP coating on the surfaces of ancient clay roof tiles. Constr. Build. Mater. 243, 118202. doi:10.1016/j.conbuildmat.2020.118202
Lv, C. R., Zhu, C., Tang, C. S., Cheng, Q., and Shi, B. (2020). Effect of fiber reinforcement on the mechanical behavior of bio-cemented sand. Geosynth. Int. 28, 195–205. doi:10.1680/jgein.20.00037
Martin, K., Hamed, K. T., and Kavazanjian, E. (2020). Enhancing the strength of granular material with a modified enzyme-induced carbonate precipitation (EICP) treatment solution. Constr. Build. Mater. 271, 121529. doi:10.1016/j.conbuildmat.2020.121529
Martinez, B. C., Dejong, J. T., Gin, T. R., Montoya, B. M., Barkouki, T. H., Hunt, C., et al. (2013). Experimental optimization of microbial-induced carbonate precipitation for soil improvement. J. Geotech. Geoenviron. 139, 587–598. doi:10.1061/(ASCE)GT.1943-5606.0000787
Miao, L., Wu, L., and Sun, X. (2020). Enzyme-catalysed mineralisation experiment study to solidify desert sands. Sci. Rep. 10, 10611. doi:10.1038/s41598-020-67566-6
Mitchell, A. C., and Ferris, F. G. (2005). The coprecipitation of Sr into calcite precipitates induced by bacterial ureolysis in artificial groundwater: temperature and kinetic dependence. Geochim. Cosmochim. Ac. 69, 4199–4210. doi:10.1016/j.gca.2005.03.014
Mitchell, J. K., and Santamarina, J. C. (2005). Biological considerations in geotechnical engineering. J. Geotech. Geoenviron 131, 1222–1233. doi:10.1061/(ASCE)1090-0241(2005)131:10(1222)
Montoya, B. M., and Dejong, J. T. (2015). Stress-strain behavior of sands cemented by microbially induced calcite precipitation. J. Geotech. Geoenviron. 141, 6. doi:10.1061/(ASCE)GT.1943-5606.0001302
Pan, X., Chu, J., Yang, Y., and Cheng, L. (2020). A new biogrouting method for fine to coarse sand. Acta Geotech. 15, 1–16. doi:10.1007/s11440-019-00872-0
Phua, Y. J., and Royne, A. (2018). Bio-cementation through controlled dissolution and recrystallization of calcium carbonate. Constr. Build. Mater. 167, 657–668. doi:10.1016/j.conbuildmat.2018.02.059
Portugal, C. R. M. E., Fonyo, C., Machado, C. C., Meganck, R., and Jarvis, T. (2020). Microbiologically induced calcite precipitation biocementation, green alternative for roads-is this the breakthrough? A critical review. J. Clean. Prod. 262, 121372. doi:10.1016/j.jclepro.2020.121372
Qabany, A. A., Soga, K., and Santamarina, C. (2012). Factors affecting efficiency of microbially induced calcite precipitation. J. Geotech. Geoenviron. 138, 992–1001. doi:10.1061/(ASCE)GT.1943-5606.0000666
Sa, A., Wp, B., and Sl, C. (2021). Efficiency of Microbially-induced calcite precipitation in natural clays for ground improvement. Constr. Build. Mater. 282, 122722. doi:10.1016/j.conbuildmat.2021.122722
Sahrawat, K. L. (1984). Effects of temperature and moisture on urease activity in semi-arid tropical soils. Plant. Soil. 78, 401–408. doi:10.1007/bf02450373
Singh, A., Paramkusam, B. R., and Maiti, P. R. (2021). Cyclic degradation and pore pressure dynamics of EICP treated hydrocarbon contaminated sands. Soil Dyn. Earthq. Eng. 140, 106369. doi:10.1016/j.soildyn.2020.106369
Tiwari, N., Satyam, N., and Sharma, M. (2021). Micro-mechanical performance evaluation of expansive soil biotreated with indigenous bacteria using MICP method. Sci. Rep. 11, 10324. doi:10.1038/s41598-021-89687-2
Whiffin, V. S., Paassen, L. A. V., and Harkes, M. P. (2007). Microbial carbonate precipitation as a soil improvement technique. Geomicrobiol. J. 24, 417–423. doi:10.1080/01490450701436505
Keywords: aeolian sand, enzyme-induced calcium carbonate precipitation (EICP), microbially induced calcite precipitation (MICP), calcium carbonate content, microstructure
Citation: Zhu C, Li Z, Zhang Z, Zhang Y, Zhou Y and Wang J (2023) Increased content and uniformity of enzyme-induced calcite precipitation realized by prehydrolysis and an accelerated injection rate. Front. Earth Sci. 11:1249295. doi: 10.3389/feart.2023.1249295
Received: 28 June 2023; Accepted: 07 September 2023;
Published: 21 September 2023.
Edited by:
Hong-Hu Zhu, Nanjing University, ChinaReviewed by:
Narala Gangadhara Reddy, Fiji National University, FijiLalit Borana, Indian Institute of Technology Indore, India
Copyright © 2023 Zhu, Li, Zhang, Zhang, Zhou and Wang. This is an open-access article distributed under the terms of the Creative Commons Attribution License (CC BY). The use, distribution or reproduction in other forums is permitted, provided the original author(s) and the copyright owner(s) are credited and that the original publication in this journal is cited, in accordance with accepted academic practice. No use, distribution or reproduction is permitted which does not comply with these terms.
*Correspondence: Zhiqing Li, bGl6aGlxLTIwMDJAMTYzLmNvbQ==, bGl6aGlxaW5nQG1haWwuaWdnY2FzLmFjLmNu; Zhongjian Zhang, emhhbmd6aG9uZ2ppYW5AY3VnYi5lZHUuY24=