
95% of researchers rate our articles as excellent or good
Learn more about the work of our research integrity team to safeguard the quality of each article we publish.
Find out more
METHODS article
Front. Earth Sci. , 22 September 2023
Sec. Geohazards and Georisks
Volume 11 - 2023 | https://doi.org/10.3389/feart.2023.1248340
This article is part of the Research Topic Prevention, Mitigation, and Relief of Compound and Chained Natural Hazards View all 10 articles
 Shiwei Ma1,2,3,4
 Shouding Li1,2,3*
 Xintao Bi5Hua Qiao6Zhigang Duan7
 Yiming Sun1,2,3Jingyun Guo1,2,3Xiao Li1,2,3
Landslides are a natural disaster that exists widely in the world and poses a great threat to human life and property, so it is of great importance to identify and locate landslides. Traditional manual interpretation can effectively identify landslides, but its efficiency is very low for large interpreted areas. In this sense, a landslide recognition method based on the Dual Graph Convolutional Network (DGCNet) is proposed to identify the landslide in remote sensing images quickly and accurately. The remote sensing image (regional remote sensing image) of the northern mountainous area of Tuergen Township, Xinyuan County, Xinjiang Province, was obtained by GeoEye-1 (spatial resolution: 0.5 m). Then, the DGCNet is used to train the labeled images, which finally shows good accuracy of landslide recognition. To show the difference with the traditional convolutional network model, this paper adopts a convolution neural network algorithm named GoogLeNet for image recognition to carry out a comparative analysis, the remote sensing satellite images (single terrain image) of Xinyuan County, Xinjiang Province is used as the data set, and the prediction accuracy is 81.25%. Compared with the GoogLeNet model, the DGCNet model has a larger identification range, which provides a new method for landslide recognition of large-scale regional remote sensing images, but the performance of DGCNet is highly dependent on the quality and characteristics of the input image. If the input data quality is poor or the image structure is unclear, the model’s performance may decline.
In recent years, the identification of geological disasters using remote sensing images has become a prominent research area within the realm of natural disasters. Landslide geological disasters are widespread across the globe and pose a severe threat to human life and property. In 2021, a total of 367 severe natural disasters occurred worldwide, including 11 significant landslides. These landslides impacted 12 countries or regions, predominantly in Asia and South America, resulting in a tragic loss of 224 lives, affecting the livelihoods of 56,600 people, and causing direct economic damages totaling $250 million (Beijing Normal University, 2021). Therefore, timely and accurate identification of landslide locations and the implementation of corresponding prevention and control measures are of paramount importance. As artificial intelligence continues to advance, the integration of artificial intelligence with remote sensing imagery for the identification of geological disasters is gradually evolving. In recent years, numerous studies have been conducted on landslides using deep learning algorithms (Hu et al., 2019; Piralilou et al., 2019; Ye et al., 2019; Prakash et al., 2020; Yu et al., 2020; Zhu et al., 2020). For instance, Cheng et al. (2013) introduced a new scenario classification method for automatic landslide detection based on remote sensing images. Danneels et al. (2007) presented a landslide recognition method utilizing the maximum likelihood classification (MLC) approach for multispectral remote sensing images. Zhan et al. (2022) devised a method for extracting landslide trails using the Fire Extinguishing Model. Shao et al. (2021); Shao et al. (2022) proposed the Novel Multiscale Decision Fusion approach for unsupervised change detection in high-resolution images, as well as an unsupervised change detection method using Fuzzy Topology-Based Majority Voting. Fu et al. (2022) introduced the Novel Higher-Order Clique Conditional Random Field for unsupervised change detection in remote sensing images. Zhang et al. (2001) employed a support vector machine (SVM) for hyperspectral data classification. Nikoobakht et al. (2022) conducted a landslide susceptibility assessment using convolutional neural networks, and Azarafza et al. (2021) presented a deep learning-based approach for landslide susceptibility mapping. Each of these AI algorithms applied to landslide identification possesses distinct properties, as summarized in Table 1.
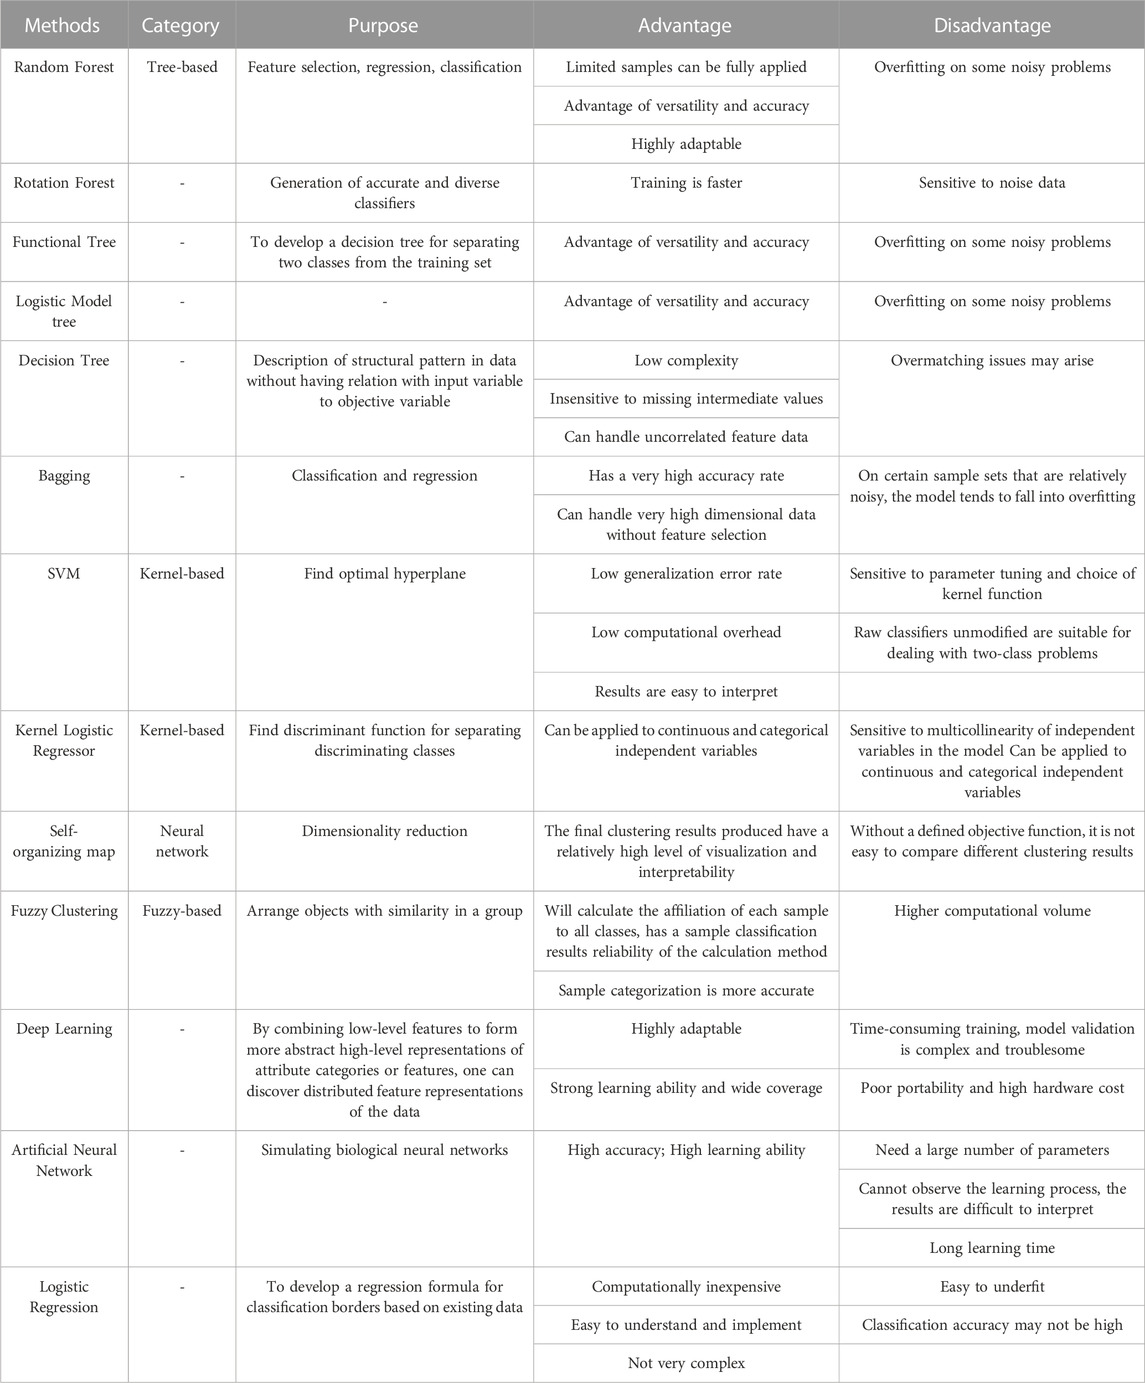
TABLE 1. List of machine learning techniques practiced for landslide susceptibility analysis (Breiman, 1996; Wan, 2013; Alimohammadlou et al., 2014; Bien Bui et al., 2016; Tien Bui et al., 2016; Wang et al., 2016; Kavzoglu et al., 2019; Du et al., 2020; Mohan et al., 2020; Chen et al., 2023).
A general convolutional neural network operates on an Euclidean structure so that the data from the convolutional operation shows a very neat matrix. However, most of the data are irregular, such data usually do not follow obvious patterns or rules and are characterized by diversity, complexity, and uncertainty. The data interact with each other to form the shape of the graph in the data structure. The Dual Graph Convolutional Network (DGCNet) is characterized by its ability to operate on graph-structured data, treating nodes and their connections as fundamental elements. DGCNet employs dual graph convolution layers, allowing it to capture both local and global structural information efficiently. It can integrate diverse data sources, adapt to graph data, and excel in tasks involving spatial relationships and complex networks, making it particularly suitable for applications such as social network analysis, geospatial data, and recommendation systems. DGCNet offers a powerful framework for addressing problems with graph-based data. Zhang et al. (2019) used the model for semantic segmentation and achieved good results.
In this study, we employed two different network models to identify landslide geological disasters in remote sensing images from Xinyuan County. Firstly, the regional remote sensing images of Tuergen town (a mountainous area in Xinyuan County) are annotated, which was trained and predicted by the DGCNet model. To show the difference between the DGCNet model and the traditional convolutional network model, one of the traditional convolutional network models named GoogLeNet is used to identify the landslide geological disaster of remote sensing image (single terrain image) in Xinyuan County. Compared with the GoogLeNet model, the DGCNet model has a wider recognition range. The identification of landslides requires the consideration of various data sources such as geographical information, topography, vegetation, and more. DGCNet allows the integration of these diverse data sources into a unified graph structure, making it more suitable for this type of task. It can effectively amalgamate multi-source information, account for spatial relationships, adapt to graph data, and offer novel, advanced approaches for landslide recognition. This will contribute to improving the accuracy and timeliness of landslide identification, thereby safeguarding human lives and property. The DGCNet model is introduced into the field of landslide recognition, which provides a new method for landslide recognition of large-scale regional remote sensing images.
Xinjiang province is located in the northwestern part of China, with a vast territory of rolling mountains, wide topographic height difference, strong neotectonic movement, and a complex and changeable climate and natural environment. The underground cavities formed by underground projects (underground mining and air defense work) have led to ground collapse geological disasters to some extent. Therefore, the geological disasters in this region are characterized by many types, high frequency, wide affected areas, and serious hazards. Due to the frequency and severity of landslides, it was decided to use Xinjiang province as the study area. The location of Xinjiang Province and the study area of the DGCNet model are shown in Figure 1.
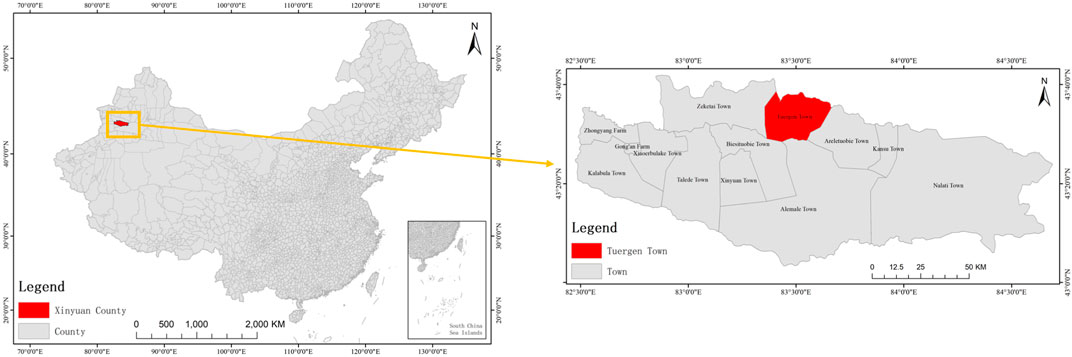
FIGURE 1. The study area of the DGCNet model (Tuergen Township, Xinyuan County, Xinjiang province).
Geological disasters in Xinjiang Province are of significant concern, as they have consistently posed severe threats to the safety of towns, critical engineering facilities, and the lives and properties of residents. A statistical analysis conducted during the investigation of geological hazards in Xinjiang Province revealed that out of the 90 counties (cities) examined, 81 of them have experienced geological hazards. A total of 4791 geological disasters have occurred in Xinjiang province, resulting in 541 deaths, and $65 million of direct economic losses. Among the geological disasters that occurred in this area, according to the classification and grading standards for geological hazards issued by the China Association of Geological Hazard Prevention and Control Engineering (T/CAGHP 018-2016) (China Association of Geological Hazard Prevention and Control Engineering, 2016), there are 10 super large disasters, 9 large disasters, 79 medium disasters, and 4693 small disasters (Xinjiang Geological Environment Monitoring Institute, 2014).
Xinyuan County is situated at the eastern end of the Yili River Valley in the northern region of Xinjiang Province. This area falls within the North Temperate Continental Semi-Arid climate zone, characterized by mild winters and cool summers, owing to the influence of moist air currents moving from west to east. The average annual temperature stands at 8.5°C, with the coldest month (January) averaging −14.4°C, and the hottest month (July) registering an average of 27.95°C. Extreme temperature fluctuations have been observed, ranging from a minimum of −27.7°C to a maximum of 39.8°C. Annual precipitation ranges between 270 and 880 mm, while water evaporation levels vary from 1300 to 2000 mm. Rainwater infiltrates through cracks at the rear edge of slopes, causing erosion at the front edge, ultimately leading to landslide occurrences. Different types of landslides occur under the influence of various rock mass structures, which can be classified into the following six types.
(1) When the upper part of the slope is the slope deposit and the lower part is the bedrock structure type, the main groundwater type is mainly pore water, and the deformation characteristics are the overall surface sliding. The landslide type is shallow sliding landslides.
(2) When the upper part of the slope is aeolian deposit loess and the lower part is bedrock structure type, the main groundwater type is fissure water and the deformation characteristic is the overall surface sliding collapse. The landslide type is collapse landslide.
(3) When the upper part of the slope body is aeolian deposit loess, the middle part is the terrace, and the lower part is bedrock structure type, the main groundwater type is fissure water, and the formation of cracks at the back edge of the slope. The landslide type is a fluid landslide.
(4) When the upper part of the slope body is the terrace, and the lower part is the bedrock structure type, the main groundwater type is fissure water and the deformation characteristic is collapse. The landslide type is collapse landslide.
(5) When the slope is a deep gully structure of loess, the main groundwater type is mainly pore water, and the deformation characteristic is slope creep, resulting in lateral diffusion or flow landslide.
(6) In the case of high and steep fracture rock mass structures, the main groundwater type is fissure water, and the deformation characteristics are mainly rock fracture expansion. The landslide type is collapse landslide.
To solve the identification problem of geological disasters in Xinyuan County, the DGCNet model is used to identify landslides, because it is suitable for the identification in a large area. Based on the remote sensing image data of Tuergen Township in Xinyuan County, three remote sensing images in the northern mountainous area of Tuergen Township were selected for labeling and training, and another one for testing and identification. The labeling was done with Labelme software, which is a graphical interface image labeling software. The first step is to import the image into the software, select the landslide area to label as a landslide, and then save and export the file. The remote sensing images of Tuergen Township used are GeoEye-1 image data (spatial resolution: 0.5 m) from Google Earth, and the location area is shown in Figure 1. The training set is shown in Figure 2.
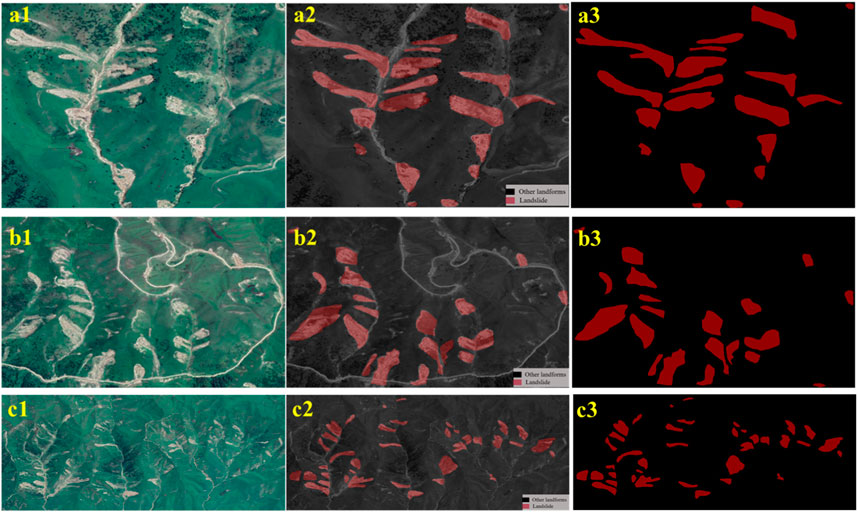
FIGURE 2. Schematic diagram of training set: (a1, b1, c1) remote sensing images, (a2, b2, c2) landslide labeling, (a3, b3, c3) landslide areas.
On the other hand, the GoogLeNet model is selected to identify and classify landslide terrain images. A total of 102 landslides and 152 other topographic images from satellite images were selected based on known landslides in several areas throughout Xinyuan County. The images used are GeoEye-1 image data (spatial resolution: 0.5 m), Figure 3 and Figure 4 show some landslides and other topographic images in the sample set respectively. The sample is divided into two parts: the training set and the test set. 80% of the images of landslide terrain and other terrain are selected as the training set, and the other 20% are selected as the test set for analysis.
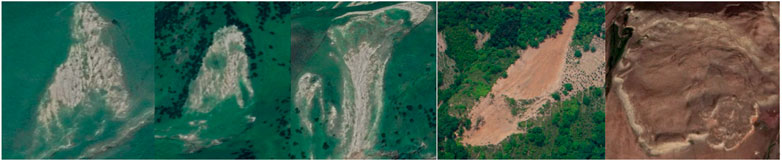
FIGURE 3. The terrain images of landslides in the sample set.
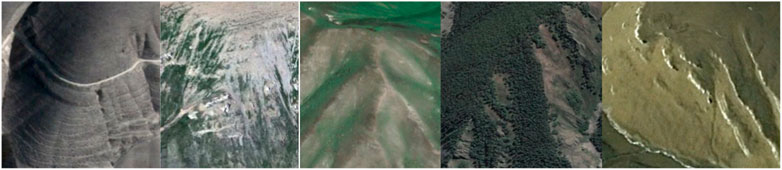
FIGURE 4. The other terrain images of the sample set.
The process of data and model application is shown in Figure 5.
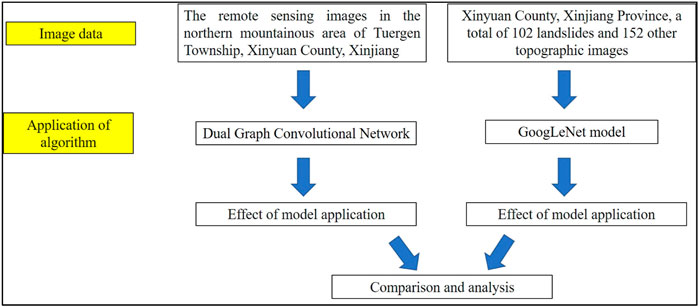
FIGURE 5. Data and model application process.
The ResNet50 is used as the basic network for training. It was proposed by four Chinese scholars, including Kaiming of Microsoft Research Institute (He et al., 2016). By using residual units, a 50-layer deep neural network was successfully trained with an error rate of 3.57%. At the same time, the number of parameters is lower than the Visual Geometry Group Network (VGGNet), and the effect is very prominent. The structure of the ResNet 50 model can accelerate the training of the ultra-deep neural network, and the accuracy of the model is also greatly improved. Assuming that a shallow neural network has reached the saturated accuracy, then add several congruent mapping layers of y = x, at least the error will not increase, that is, a deeper network should not lead to an increase in the error on the training set. Assuming that the input of a neural network is x and the expected output is H (x) if we directly transfer the input x to the output as the initial result, then the goal we need to learn is f (x) = H (x) - X. The ResNet is equivalent to changing the learning goal. Since it is no longer learning a complete output H (x), the difference between output and input H (x) - x, is the residual.
The residual block is implemented using a shortcut connection, where the input and output of the block overlap with the shortcut. This straightforward addition does not introduce additional parameters or computational overhead to the network. Simultaneously, it significantly enhances training speed and improves the model’s training effectiveness. This simple structure can effectively address the degradation problem that arises when deepening the layers of the model. In traditional convolutional or fully connected layers, issues like information loss can occur. ResNet partially addresses this problem by directly bypassing input information to the output, thus preserving the integrity of the information. Consequently, the entire network only needs to learn the differences between input and output, simplifying the learning objectives and reducing complexity.
The DGCNet models the global context of the input feature by modeling two orthogonal graphs in a single framework. The first component models spatial relationships between pixels in the image, whilst these cond model interdependencies along the channel dimensions of the network’s feature map. This is done efficiently by projecting the feature into a new, lower-dimensional space where all pairwise interactions can be modeled, before reprojecting into the original space (Zhang et al., 2019).
It consists of two branches, each consisting of a graph convolutional network (GCN) to model contextual information in the spatial and channel dimensions in a convolutional feature map. The model has the following main components, the specific model structure explanation refers to the Reference (Zhang et al., 2019).
The input to DGCNet is a graph data representation, consisting of nodes and edges. Each node represents an element of data, and edges indicate relationships between nodes. This forms the foundational data structure for DGCNet.
DGCNet employs graph convolutional layers to process the input graph data. These layers perform convolution operations to capture relationships between nodes and facilitate feature propagation.
A distinguishing feature of DGCNet is the presence of dual graph convolution layers, typically comprising two parallel graph convolution operations. These layers simultaneously capture local and global structural information.
Within each convolutional layer, features propagate from one node to its neighboring nodes, facilitating the capture of inter-node relationships and information dissemination. This is crucial for feature extraction.
Pooling operations are often applied after each convolutional layer to reduce the graph’s size and extract the most salient features. This helps in reducing computational complexity.
Following the convolutional layers, one or more fully connected layers can be included to map the extracted features to the desired output space, such as classification or regression.
Between layers, activation functions are commonly used to introduce non-linearity and enhance the model’s expressive power. Common activation functions include ReLU, Sigmoid, and Tanh.
These components collectively form the basic structure of a DGCNet model, enabling it to effectively handle semi-supervised learning tasks on graph-structured data.
The model used in this paper consists of two branches:
1) The GCN of coordinate space models the spatial relationships of pixels, enabling the network to produce continuous predictions and consider all objects in the graph.
2) The feature space GCN captures the correlation among more abstract features. The features of the two parts of the inference are mapped to the original coordinate space and added to the original features.
The backbone of the model is a ResNet series. The ResNet series is connected to the DGCNHead. DGCNHead consists of coordinate branches and channel branches. The input features are first learned in the coordinate branch, the original input features are mapped into new dimensions and convolution learning is carried out. Then, the feature map is combined with some features of the channel to output the final feature result.
As is shown in Figure 6.
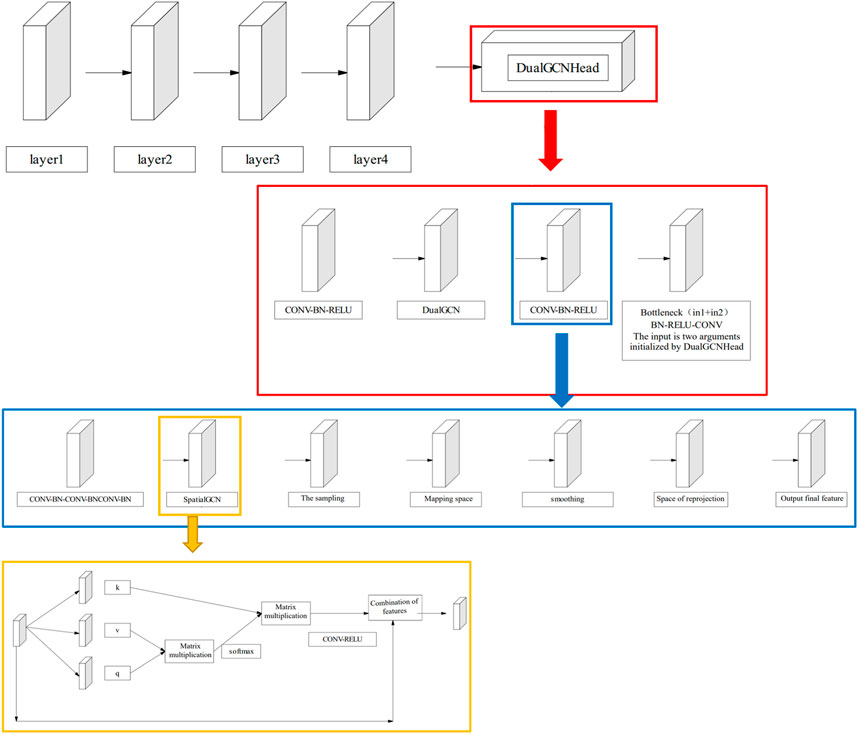
FIGURE 6. Schematic diagram of the model structure.
The overall process is as follows:
1) Training stage: The supervision loss function of training is the cross-entropy loss function.
2) In the training process, the results of the last round will be verified in each training, and the relevant loss value will be printed.
3) The trained model is used to test the accuracy of the test set.
PASCAL-VOC represents the sample dataset.
As is shown in Figure 7.
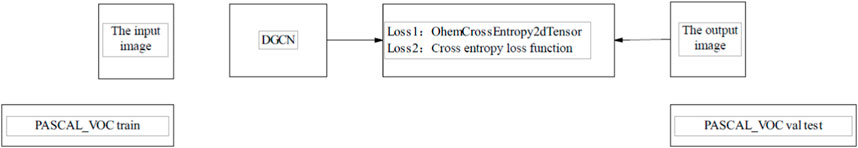
FIGURE 7. Schematic diagram of the process.
GoogLeNet is a Convolutional Neural Network (CNN) architecture introduced by Christian Szegedy and his team at Google, which secured the championship in the Imagenet competition in 2014. The GoogLeNet model consists of 22 layers in total, featuring 9 inception structures. Despite its depth of 22 layers and 5 million parameters, the number of parameters is significantly lower than that of both the AlexNet and VGG models. In fact, GoogLeNet has only 1/12 of the parameters of AlexNet and 1/36 of those in VGG. Therefore, when facing limitations in memory or CPU and GPU resources, GoogLeNet emerges as the preferable choice.
The standout characteristic of GoogLeNet lies in its utilization of the inception module. This module is designed to create a network with a robust local topology. It achieves this by performing multiple convolution and pooling operations on input images and then combining all the output results into a deep feature map. As various convolution and pooling operations, such as 1 × 1, 3 × 3, or 5 × 5, capture different information from the input images, processing these operations in parallel and merging the results yields a superior image representation. For a detailed explanation of the specific model structure, please refer to Reference (Szegedy et al., 2015).
The model has the following characteristics.
(1) It can integrate feature information from different scales and retain more input information. Before this, most other commonly used convolutional neural networks improved the performance of the network by stacking more and more convolutional layers.
(2) A 1 × 1 convolution kernel is used for reduction and mapping processing. Compared with AlexNet and VGGNet, there is only one output layer.
(3) Two auxiliary classifiers are added in the middle of the network to help with training, with a total of three output layers, the problem of gradient disappearance in the training process is solved.
(4) The average pooling is used instead of the fully connected layer, which greatly reduces the number of model parameters.
The Inception structure is a crucial component of the GoogLeNet model, and its core idea is to approximate or directly replace the optimized local sparse component structure with a dense component structure. This structure retains the original Inception design, consisting of four convolutional branches:
Branch 1 employs a 1 × 1 convolutional layer with a step size of 1. The convolution kernel does not alter the length and width of the feature map but directly modifies its depth.
Branch 2 utilizes a 3 × 3 convolutional layer with a step size of 1 and padding of 1, aimed at extracting feature maps of varying sizes.
Branch 3 incorporates a 5 × 5 convolutional layer with a step size of 1 and padding of 2, also intended to extract feature maps of different sizes.
Branch 4 is a max-pooling layer with a pool core size of 3 × 3, a step size of 1, and padding of 1. This layer suppresses non-maximal information in the original image, replacing it with the most significant neighborhood information while preserving the image’s size.
When the feature matrix is input, all four branches can simultaneously apply convolutional or pooling operations, resulting in four parallel outputs. As the step size for all branches is 1, the convolution or pooling dimensions remain unchanged. This allows them to be concatenated in the same dimension to produce the final output. Compared to the series-structured models like AlexNet and VGGnet, GoogLeNet alters the input into a parallel structure. It combines inputs after various operations and then proceeds to the subsequent layers. In contrast to other convolutional neural network architectures, where the next convolutional layer can only process the feature map from the preceding layer, GoogLeNet’s approach helps prevent information loss from the earlier stages, ensuring it can still be accessed in subsequent layers.
The GoogLeNet model incorporates two auxiliary classifiers and structures to facilitate training. The first level comprises a 5 × 5 average pooling layer with a step size of 3. The second level consists of a 1 × 1 convolutional layer with a step size of 1, featuring a total of 128 convolution kernels. The third and fourth levels consist of fully connected layers with 1024 and 1000 nodes, respectively. It is important to note that the auxiliary classifier is solely utilized during training and not during testing. It is introduced into the overall network loss with a weight of 0.3 to counteract gradient vanishing and provide regularization.
The training set consists of three remote sensing satellite images. The verification set consists of one remote sensing image, and the test set consists of one remote sensing image. The number of training epochs is set to 20, the batch size is set to 8, and the input picture size is set to 600. In the training process, the loss value will be displayed in the window, the Excel data generated in the training process will be saved as pictures, and the network model generated in the training will be saved at the same time. The device model used in this work is NVIDIA Geforce GTX 3080 GPU (8 GB memory) on the Windows system, which applies Pycharm editor, and uses Python for programming. The curves of training accuracy, training loss, training precision, DSC, F1, and M-IOU are shown in the figure. Ideally, the training loss value should decrease rapidly in the first few epochs. When 20 epochs are trained, the accuracy of the training set tended to the maximum, the loss rate tended to the minimum. The results are shown in Figure 8.
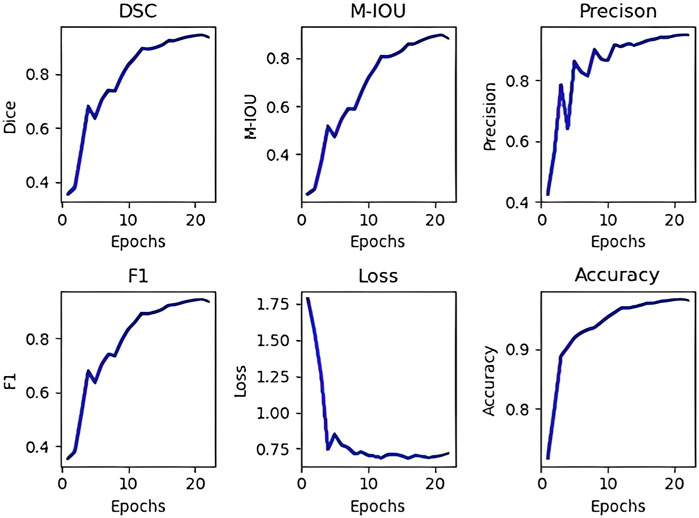
FIGURE 8. Line chart of the DSC, M-IOU, accuracy, loss, precision, and F1 in the training data set experiment.
Similarly, the verification accuracy, verification loss, verification precision, and verification M-IOU curves of this work are shown in Figure 9. As can be seen in Figure 9, the lowest value of the loss is found at the 20 epochs, the DSC is 0.8815, the M-IOU is 0.77, the precision is 0.82, the F1 is 0.86, and the accuracy is 0.96.
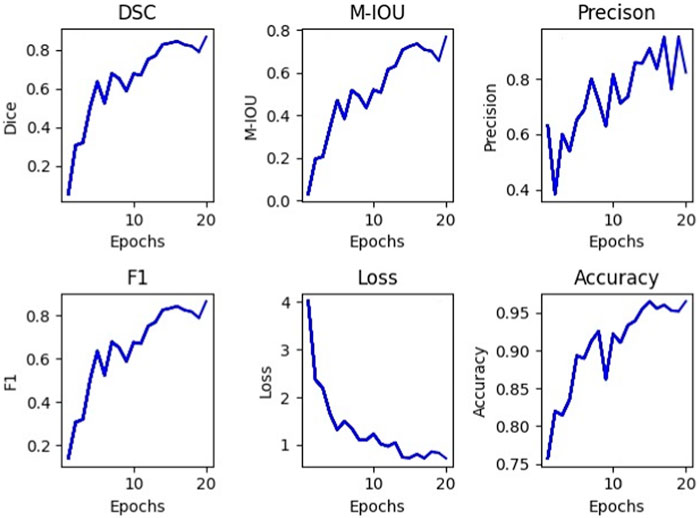
FIGURE 9. Line chart of the DSC, M-IOU, accuracy, loss, precision, and F1 in the validation data set experiment.
The test set results are shown in Figure 10, it can be seen from Figure 10 that the landslide identification accuracy using this method is high. Large-scale landslides can be identified. The unrecognized area is mainly the landslide boundary, and the incorrectly identified area is mainly the exposed area on the top of the mountain, but the area is small. Because this model training uses fewer training sets, which may have a certain impact on the results, the training sets can be added later to improve the accuracy of the model.
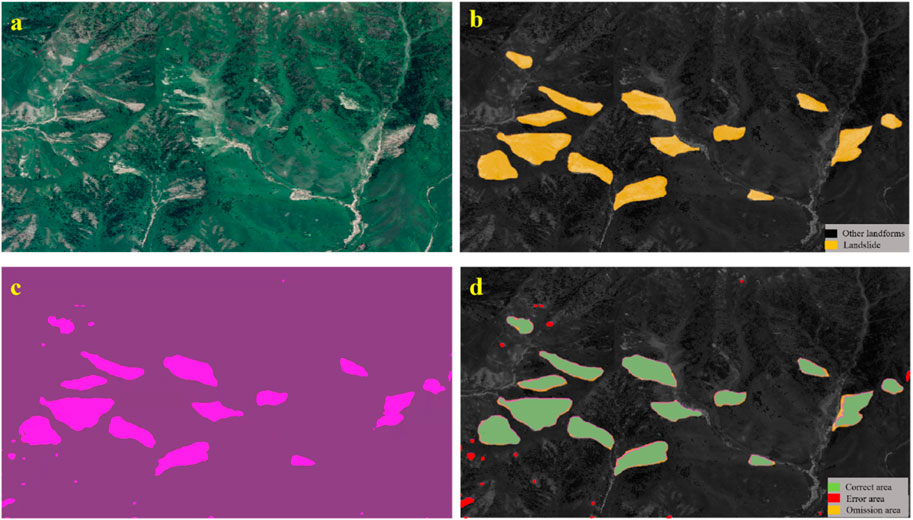
FIGURE 10. The test set prediction results: (A) the sample to be tested; (B) manual interpretation area; (C) model identification area; (D) identification area distribution characteristics.
During the process of model training, optimizing parameters to minimize the loss function is a crucial parameter-tuning step. The optimizer’s task is to compute the gradient of the loss function in each epoch and consequently update the parameters. The Adam optimizer, developed by Kingma and Ba in 2014, amalgamates the strengths of the AdaGrad and RMSProp optimization algorithms. It takes into account both first-moment and second-moment estimations of the gradient to determine the update step.
An image is an array of pixels organized in a specific sequence, with colors represented by the three primary channels of red, green, and blue. These pixels assume values ranging from 0 to 255; for instance, (0, 0, and 0) represents black. When employing a convolutional neural network for image recognition, pixel values are transformed into an array. The values within this array represent the image’s features, and any changes in the image result in corresponding alterations in these pixel values. Furthermore, it is essential to preserve the spatial arrangement of images as much as possible when feeding image features into a neural network. In the process of identifying images of landslides and other topographic features through convolution layers, distinct convolutional kernels are utilized to generate corresponding output values, determining which one best characterizes the landslide features. When a convolution kernel yields high output values for landslide features and low output values for non-landslide terrain, it effectively extracts the desired features from the image. The optimal convolution kernel is then passed through a pooling layer after multiplication with the image’s corresponding feature matrix. This step serves to reduce the number of trainable parameters, retain the most pertinent landslide information from the terrain images, and mitigate the risk of overfitting.
For the training process when the image data is small, when there are a small number of incorrect labels in the sample, the incorrect labels will have an impact on the accuracy of the prediction. Therefore, label smoothing is adopted to reduce overfitting and improve the model’s generalization ability. Weight_ Decay can adjust the complexity of the model and reduce the impact on the loss function. With a smaller weight, the complexity of the network is lower, and the fitting of the data will be better. Picture size through img = cv2 Resize [img, (224)] is scaled to the size format of 224 pixels * 224 pixels. The parameter batch size is 32, the optimizer is Adma, the learning rate is 0.0001, and the weight_decay is 0.001.
During the training of the model, the loss rate and accuracy of the training set and validation set are used to evaluate the model. A total of 100 epochs were trained. After training 20 epochs, the curves of the loss rate and accuracy rate of the training set tended to be flat. After 60 epochs, the accuracy rates of the training and validation sets become close to the peak Figure 11 and Figure 12 show the images of the change in loss rate and accuracy of the training and validation sets during the training process.
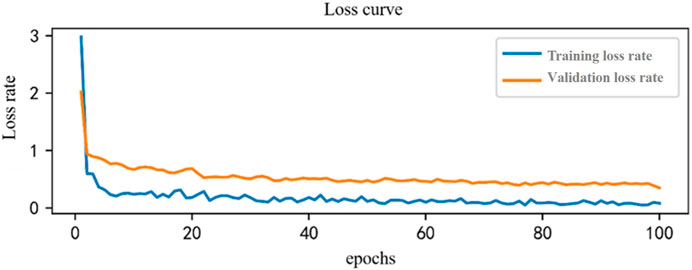
FIGURE 11. Epoch loss curve of the training set and validation set.
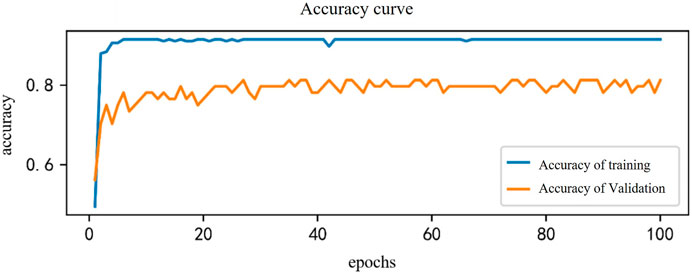
FIGURE 12. Epoch Accuracy curve of the training set and validation set.
The loss and accuracy rates of the training set and validation set after 100 epochs of training iteration were saved as a document file. The accuracy of the validation set fluctuates between 78.125% and 81.25%, with the highest prediction accuracy of 81.25%.
Also, the trained optimal model was saved and applied to predict the label of the input picture. Some prediction results are shown in Figure 13.
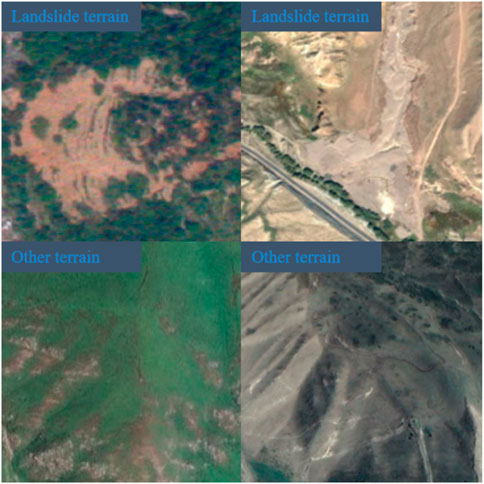
FIGURE 13. Prediction results of some topographic images.
The GoogLeNet model used in this paper has the highest prediction accuracy of 81.25%, while Zhang et al. (2020) proposed a model for seismic landslide recognition based on deep learning, and the accuracy of this model on the validation set is 88.15%. It is 6.9% higher than the GoogLeNet model. It can be seen from Figure 9 that the accuracy of the DGCNet Model is also higher than that of the GoogLeNet model. In addition, the two models have different applicable situations, the DGCNet model can identify and label landslides in a satellite remote sensing image that contains dozens of slopes, while the GoogLeNet model can only classify whether a single slope in a remote sensing satellite image is a landslide, which is relatively inefficient. Therefore, the DGCNet model has a better recognition effect and plays a good reference role in landslide identification, which can quickly identify large-scale landslides and provide a basis for emergency rescue and disposal in the later stage of landslide disasters.
DGCNet typically demands some data for training to achieve optimal performance. In the context of landslide image recognition, when datasets are limited in size, the model may face challenges related to overfitting or decreased performance. The effectiveness of DGCNet is highly dependent on the choice of hyperparameters, including the number of convolutional layers, kernel sizes, and learning rates. Fine-tuning these parameters for different applications can be time-consuming and computationally intensive. DGCNet may require significant computational resources, including high-performance GPUs, especially when dealing with large graph-based data. This can be impractical in resource-constrained environments. DGCNet is a deep learning model with complex internal mechanisms, making it challenging to interpret. In applications where decision explainability is crucial, the model’s lack of interpretability may be a limitation.
DGCNet excels at integrating diverse data sources, such as topography, vegetation information, etc. This capability enables a comprehensive analysis of landslide image recognition. DGCNet can capture spatial correlations between nodes (representing geographical locations) within the graph, emphasizing the importance of geographical context, thereby enhancing the accuracy of landslide image recognition. Landslide data is often represented as a graph, where locations and their interconnections constitute nodes and edges. DGCNet is purpose-built for handling graph-based data, making it well-suited for such tasks. Employing DGCNet for landslide image recognition represents a relatively novel approach. It offers the potential to introduce fresh research perspectives and technological advancements to the field, ultimately improving the efficiency and accuracy of landslide recognition assessment.
In summary, DGCNet shows promise in landslide image recognition but also presents certain limitations. Addressing issues related to data requirements, hyperparameter tuning, and computational complexity, while enhancing model interpretability, will facilitate its broader adoption and utility in landslide recognition analysis.
The identification and location of landslides are of paramount importance due to their significant threat to human life and property worldwide. Traditional manual interpretation methods, while effective, are inefficient for large areas. In response to this challenge, this study introduced a landslide recognition method based on the Dual Graph Convolutional Network for quick and accurate identification of landslides in remote sensing images. The results demonstrated the efficacy of the DGCNet model in accurately identifying landslides within the regional remote sensing images of Tuergen Township, Xinyuan County, Xinjiang Province. A comparative analysis was conducted with the traditional convolutional network model, GoogLeNet, using single terrain images from Xinyuan County. The DGCNet model exhibited a broader recognition range, making it a valuable tool for large-scale regional remote sensing image analysis. However, it is important to note that the performance of the DGCNet model is highly dependent on the quality and characteristics of the input graph data. Poor data quality or unclear graph structures can lead to a decline in performance. Therefore, data preprocessing and quality assurance remain essential aspects of landslide recognition using DGCNet. In the future, other landslide databases can be used to train the model to improve the accuracy of the model. DGCNet has stronger learning and transmission ability than other methods and can handle more data types. This research contributes to the growing body of knowledge in this field, offering a new approach to address the challenges associated with landslide recognition in large-scale regional remote sensing images.
The original contributions presented in the study are included in the article/Supplementary Material, further inquiries can be directed to the corresponding author.
Data resources, HQ and ZD; The research methods, SM, XB, and SL; writing–original draft preparation, SM and SL; editing, SM, YS, JG, and XL; All authors contributed to the article and approved the submitted version.
This research was financially supported by the National Natural Science Foundation of China (42077440, 41202217), the second Tibet Plateau Scientific Expedition and Research (2019QZKK0904), the project (Grant Nos. BJH16J030, BJH16J032), the National Key Research and Development Program of China (2018YFC1505503), the Key Developing Program of the Chinese Academy of Sciences (Grant Nos. ZDRW-ZS-2021-3-1, ZDBS-LY-DQC003), the Scientific Research and Technology Development Project of China National Petroleum Corporation (No. 2022DJ5503) and CAS Key Technology Talent Program.
The authors declare that the research was conducted in the absence of any commercial or financial relationships that could be construed as a potential conflict of interest.
All claims expressed in this article are solely those of the authors and do not necessarily represent those of their affiliated organizations, or those of the publisher, the editors and the reviewers. Any product that may be evaluated in this article, or claim that may be made by its manufacturer, is not guaranteed or endorsed by the publisher.
Alimohammadlou, Y., Najafi, A., and Gokceoglu, C. (2014). Estimation of rainfall-induced landslides using ANN and fuzzy clustering methods: a case study in saeen slope, Azerbaijan province, Iran. Catena 120, 149–162. doi:10.1016/j.catena.2014.04.009
Azarafza, M., Azarafza, M., Akgün, H., Atkinson, P. M., and Derakhshani, R. (2021). Deep learning-based landslide susceptibility mapping. Sci. Rep. 11 (1), 24112. doi:10.1038/s41598-021-03585-1
Beijing Normal University (2021). Global natural disaster assessment report-EN. Beijing: Beijing Normal University.
Bien Bui, D., Tuan, T. A., Klempe, H., Pradhan, B., and Revhaug, I. (2016). Spatial prediction models for shallow landslide hazards: a comparative assessment of the efficacy of support vector machines, artificial neural networks, kernel logistic regression, and logistic model tree. Landslides 13 (2), 361–378. doi:10.1007/s10346-015-0557-6
Chen, Z., Song, D., Du, Y., and Dong, L. (2023). Investigation on the spatial distribution of landslides in Sichuan Province, southwest China. Geomatics, Nat. Hazards Risk 14 (1), 2232085. doi:10.1080/19475705.2023.2232085
Cheng, G., Guo, L., Zhao, T. Y., Han, J. W., Li, H. H., and Fang, J. (2013). Automatic landslide detection from remote-sensing imagery using a scene classification method based on BoVW and pLSA. Int. J. Remote Sens. 34 (1), 45–59. doi:10.1080/01431161.2012.705443
China Association of Geological Hazard Prevention and Control Engineering (2016). T/CAGHP 018-2016 standard of classification for geological hazard. WuHan: China University of Geosciences Press.
Danneels, P., Pirard, E., and Havenith, H. B. (2007). “Automatic landslide detection from remote sensing images using supervised classification methods,” in Proceedings of the 2007 IEEE International Geoscience and Remote Sensing Symposium, Barcelona, Spain, 23-28 July 2007.
Du, H., Song, D., Chen, Z., Shu, H., and Guo, Z. (2020). Prediction model oriented for landslide displacement with step-like curve by applying ensemble empirical mode decomposition and the PSO-ELM method. J. Clean. Prod. 270, 122248. doi:10.1016/j.jclepro.2020.122248
Fu, W. Q., Shao, P., Dong, T., and Liu, Z. W. (2022). Novel higher-order Clique conditional random field to unsupervised change detection for remote sensing images. Remote Sens. 14, 3651. doi:10.3390/rs14153651
He, K. M., Zhang, X. Y., Ren, S. Q., and Sun, J. (2016). “Deep residual learning for image recognition,” in 2016 IEEE Conference on Computer Vision and Pattern Recognition (CVPR), Las Vegas, NV, USA, 27-30 June 2016.
Hu, Q., Zhou, Y., Wang, S., Wang, F., and Wang, H. (2019). Improving the accuracy of landslide detection in“off-site” area by machine learning model portability comparison: a case study of jiuzhaigou earthquake, China. Remote Sens. 11, 2530. doi:10.3390/rs11212530
Kavzoglu, T., Colkesen, I., Sahin, E. K., and Sahin, E. K. (2019). “Machine learning techniques in landslide susceptibility mapping: A survey and a case study,” in Landslides: Theory, practice and modelling. Advances in natural and technological hazards research. Editors S. Pradhan, V. Vishal, and T. Singh (Cham, Switzerland: Springer), 50.
Mohan, A., Singh, K. A., Kumar, B., and Dwivedi, R. (2020). Review on remote sensing methods for landslide detection using machine and deep learning. Trans. Emerg. Telecommun. Technol. 32 (7). doi:10.1002/ett.3998
Nikoobakht, S., Azarafza, M., Akgün, H., and Derakhshani, R. (2022). Landslide susceptibility assessment by using convolutional neural network. Appl. Sci. 12 (12), 5992. doi:10.3390/app12125992
Piralilou, S., Shahabi, H., Jarihani, B., Ghorbanzadeh, O., Blaschke, T., Gholamnia, K., et al. (2019). Landslide detection using multi-scale image segmentation and different machine learning models in the Higher Himalayas. Remote Sens. 11, 2575. doi:10.3390/rs11212575
Prakash, N., Manconi, A., and Loew, S. (2020). Mapping landslides on EO data: performance of deep learning models vs. traditional machine learning models. Remote Sens. 12, 346. doi:10.3390/rs12030346
Shao, P., Shi, W., Liu, Z., and Dong, T. (2021). Unsupervised change detection using fuzzy topology-based majority voting. Remote Sens. 13, 3171. doi:10.3390/rs13163171
Shao, P., Yi, Y., Liu, Z., Dong, T., and Ren, D. (2022). Novel Multiscale decision fusion approach to unsupervised change detection for high-resolution images. IEEE Geoscience Remote Sens. Lett. 19, 1–5. Art no. 2503105. doi:10.1109/LGRS.2022.3140307
Szegedy, C., Liu, W., Jia, Y. Q., Sermanet, P., Reed, S., Anguelov, D., et al. (2015). “Going deeper with convolutions,” in 2015 IEEE Conference on Computer Vision and Pattern Recognition (CVPR), Boston, MA, USA, 07-12 June 2015, 1–9. doi:10.1109/CVPR.2015.7298594
Tien Bui, D., Ho, T. C., Pradhan, B., Pham, B. T., Nhu, V. H., and Revhaug, I. (2016). GIS-based modeling of rainfall-induced landslides using data mining-based functional trees classifier with AdaBoost, Bagging, and MultiBoost ensemble frameworks. Environ. Earth Sci. 75 (14), 1101–1122. doi:10.1007/s12665-016-5919-4
Wan, S. (2013). Entropy-based particle swarm optimization with clustering analysis on landslide susceptibility mapping. Environ. Earth Sci. 68 (5), 1349–1366. doi:10.1007/s12665-012-1832-7
Wang, L. J., Guo, M., Sawada, K., Lin, J., and Zhang, J. (2016). A comparative study of landslide susceptibility maps using logistic regression, frequency ratio, decision tree, weights of evidence and artificial neural network. Geosci. J. 20 (1), 117–136. doi:10.1007/s12303-015-0026-1
Xinjiang Geological Environment Monitoring Institute (2014). The mechanics of landslide in Yili, Xinjiang county. Urumqi: Xinjiang Geological Environment Monitoring Institute.
Ye, C., Li, Y., Cui, P., Liang, L., Pirasteh, S., Marcato, J., et al. (2019). Landslide detection of hyperspectral remote sensing data based on deep learning with constrains. IEEE J. Sel. Top. Appl. Earth Obs. Remote Sens. 12, 5047–5060. doi:10.1109/jstars.2019.2951725
Yu, B., Chen, F., and Xu, C. (2020). Landslide detection based on contour-based deep learning framework in case of national scale of Nepal in 2015. Comput. Geosci. 135, 104388. doi:10.1016/j.cageo.2019.104388
Zhan, Z., Shi, W., Zhang, M., Liu, Z., Peng, L., Yu, Y., et al. (2022). Landslide trail extraction using Fire extinguishing model. Remote Sens. 14, 308. doi:10.3390/rs14020308
Zhang, J. P., Zhang, Y., and Zhou, T. X. (2001). “Classification of hyperspectral data using support vector machine,” in Proceedings of the 2001 International Conference on Image Processing (Cat. No.01CH37205), Thessaloniki, Greece, 07-10 October 2001.
Zhang, L., Li, X., Arnab, A., Yang, K. Y., Tong, Y. H., and Philip, H. S. (2019). Dual graph convolutional network for semantic segmentation. arXiv preprint arXiv:1909.06121.
Zhang, P., Xu, C., Ma, S., Shao, X., Tian, Y., and Wen, B. (2020). Automatic extraction of seismic landslides in large areas with complex environments based on deep learning: an example of the 2018 iburi earthquake, Japan. Remote Sens. 12, 3992. doi:10.3390/rs12233992
Keywords: geological disaster, landslide identification, GoogLeNet model, Dual Graph Convolutional Network, model
Citation: Ma S, Li S, Bi X, Qiao H, Duan Z, Sun Y, Guo J and Li X (2023) Automatic landslide identification by Dual Graph Convolutional Network and GoogLeNet model-a case study for Xinjiang province, China. Front. Earth Sci. 11:1248340. doi: 10.3389/feart.2023.1248340
Received: 27 June 2023; Accepted: 11 September 2023;
Published: 22 September 2023.
Edited by:
Chong Xu, Ministry of Emergency Management, ChinaReviewed by:
Mohammad Azarafza, University of Tabriz, IranCopyright © 2023 Ma, Li, Bi, Qiao, Duan, Sun, Guo and Li. This is an open-access article distributed under the terms of the Creative Commons Attribution License (CC BY). The use, distribution or reproduction in other forums is permitted, provided the original author(s) and the copyright owner(s) are credited and that the original publication in this journal is cited, in accordance with accepted academic practice. No use, distribution or reproduction is permitted which does not comply with these terms.
*Correspondence: Shouding Li, bHNkbHloQG1haWwuaWdnY2FzLmFjLmNu
Disclaimer: All claims expressed in this article are solely those of the authors and do not necessarily represent those of their affiliated organizations, or those of the publisher, the editors and the reviewers. Any product that may be evaluated in this article or claim that may be made by its manufacturer is not guaranteed or endorsed by the publisher.
Research integrity at Frontiers
Learn more about the work of our research integrity team to safeguard the quality of each article we publish.