 JunKe Xu
 Jiwei Zhu1,2,3
 JianCang Xie
94% of researchers rate our articles as excellent or good
Learn more about the work of our research integrity team to safeguard the quality of each article we publish.
Find out more
ORIGINAL RESEARCH article
Front. Earth Sci. , 30 August 2023
Sec. Hydrosphere
Volume 11 - 2023 | https://doi.org/10.3389/feart.2023.1237884
This article is part of the Research Topic Risk Assessment and Management of Water Conservancy Projects View all 16 articles
This study aims to utilize complex network theory and network immune strategies to identify relevant risks in urban river ecological governance projects and develop corresponding risk response strategies. By constructing a risk evolution network with 53 nodes and 255 edges, we analyzed the network’s degree centrality, betweenness centrality, closeness centrality, and composite value parameters, confirming the network’s scale-free characteristics. Based on this, we used network global efficiency as a metric to assess the network’s robustness under random and targeted attacks. The results revealed that under targeted attack scenarios, the degree value attack immune strategy performed optimally, while random immune strategies were less effective than targeted immune strategies. Moreover, this model offers various advantages in early risk response decision-making and establishing a forward-looking risk warning framework, providing an effective tool for risk management in urban river ecological governance projects.
With the continuous acceleration of urbanization, the urban ecological environment faces increasingly severe challenges (Deng et al., 2022; Luo et al., 2022). Urban rivers are an essential part of the urban ecosystem and have significant implications for the quality of the urban ecological environment and its sustainable development (Liu et al., 2022; Zhao and Huang, 2022). The risk characteristics of urban river ecological governance projects encompass ecosystem restoration risk, water quality improvement risk, engineering safety risk, and social participation risk. To address these risk features, urban river ecological management projects need to take a comprehensive approach, considering ecological, engineering, and social factors, and implementing appropriate measures and governance strategies. Urban river ecological governance projects are essential for ecological and environmental governance. Through the extensive use of multidisciplinary knowledge and technological means such as ecology, engineering, and environmental science, urban rivers are comprehensively managed to achieve the purification of the water environment, restoration of ecological systems, and improvement of the ecological environment. However, urban river ecological governance projects involve multiple stakeholders, including governments, enterprises, and social organizations. The technologies and knowledge involved are also relatively complex and diverse, so the project’s risks and uncertainties are significant.
Risk studies for urban river ecological governance projects are an important way to ensure successful project implementation and sustainability. Various methods and tools such as qualitative analysis, quantitative modeling and expert judgment have been used to identify and assess potential risk factors and risk events (Yu et al., 2017; Zhu et al., 2022). In past studies, extensive research has been conducted on risk studies in urban river ecological governance projects (Ullah et al., 2021). Some researchers have assessed the impact of different stakeholders on the implementation of urban river ecological governance projects by applying social network analysis methodology. They found that cooperation and information flow among stakeholders play an important role in the successful implementation of a project, which provides a useful reference for the development of risk management strategies (Lienert et al., 2013). Xu et al. (2023a) conducted an in-depth study on risk management strategies for urban river ecological governance projects. They explored the effectiveness of implementing strategies such as risk avoidance, risk transfer, risk mitigation, and risk acceptance, and made recommendations to optimize risk management to improve the success and sustainability of the project (Xu et al., 2023a). Notably, in terms of technology, the researchers explored the application of emerging technologies in risk studies for urban river ecological governance projects. They focused on the application of technologies such as intelligent technologies, remote sensing, and big data analysis to improve the efficiency and accuracy of project monitoring and management, thereby better-supporting risk identification, assessment, and decision-making. Risk research on urban river ecological management projects involves many aspects, from social network analysis to risk management strategies to technology applications, and these studies will help provide comprehensive risk perception and management strategies for the implementation of urban river ecological governance projects. However, the field still faces challenges and opportunities, and further research is needed to address the complexity of urban environments and socio-economic factors to achieve sustainable development of ecological governance projects for urban rivers.
Based on this, this paper applies the social network theory (Valeri and Baggio, 2021) to the characteristics and evolutionary features of urban river ecological governance projects. Based on existing research, it constructs a directional weighted network model for the evolution of urban river ecological governance project risks. The network’s degree centrality, mediator centrality, proximity centrality, and the ranking of key risk factors for a combined value scenario of the three have been analyzed. The scale-free characteristics of the network are pointed out. MATLAB programming simulations are used to analyze the changes in the proportion of randomly and deliberately attacked nodes under the structural stability and performance stability of the network and to compare and analyze the robustness effects of the degree value attacks, meso-value attacks, proximity centrality attacks, and combined value attacks. The method of identifying the key risk factors of the network is selected to clarify the critical risk factors of the network and propose a chain-breaking control strategy to theoretically enrich the relevant research on the risk of urban river ecological governance projects, make up for the shortcomings of existing research, and practically providing new ideas for the correct understanding, governance, and control of the risk network of urban river ecological governance projects.
Domestic and international academics have conducted preliminary studies on the interrelationship between risks, and some of the more common approaches include explanatory structural models (Soti et al., 2010; Karmaker et al., 2021; Abbas et al., 2022) and Bayesian network analysis (Leoni et al., 2019; Huang et al., 2021; Mohamed and Tran, 2021). These approaches explore the interrelationships between risks from different perspectives and provide some basis for decision-makers to manage risks scientifically. Still, none of them can provide a quantitative analysis of the position of risk factors in the risk network. For this reason, this paper introduces Social Network Analysis (SNA). The method is a research orientation based on graph theory to examine the connected relationships between social entities, their structural features, and the characteristics of relationships and networks through systematically analyzing relational data (Valente, 2012). Applying this method makes it possible to quantitatively analyze the virtual nodes in the risk network in terms of network density and centrality, thus deepening managers’ understanding of project risks and improving risk management.
Research by many experts and scholars has shown that risk factors in engineering projects interact with each other rather than independently of each other (Teller and Kock, 2013; Xie et al., 2019). Therefore, effective risk response strategies emerge from risk research. Methods of risk association analysis can be classified as qualitative and quantitative. Qualitative methods: Quantifying qualitative evaluation results using these methods presents unpredictable information loss, especially when using linguistic variables (Wirba et al., 1996), design structure matrixes (Marle et al., 2013), and Delphi methods (Aloini et al., 2012). Quantitative methods: Bayesian network analysis is representative (Marcot and Penman, 2019), and Wang and Chen (2017) used Bayesian network analysis to assess risk in a tunneling project. They have developed a Bayesian network model to identify and evaluate the relationships between various risk factors and to predict the probability of successful project implementation. Ghasemi et al. (2018) used Bayesian network analysis to develop a network of engineering project risk relationships to identify and quantify the relationships between engineering project risk factors and predict the probability of successful project implementation. The findings suggest that Bayesian network models can help managers better identify and control project risks. The abstract mathematical tools and complex mathematical calculations involved in quantitative methods make them inapplicable to engineering practice, despite being theoretically powerful (Yang et al., 2021). Complex network theory appears more appropriate for risk-related analysis of complex projects given its simplicity and visibility. For example, Desavelle (2015) used complex network theory to analyze nuclear power engineering risks, constructing a complex network including various risk factors and identifying key risk factors and the relationships between them by analyzing the network structure and characteristics. Fang et al. (2012) considered risk factors as nodes and constructed a complex network model by measuring the correlation and influence between nodes, and they used complex network theory to analyze the network structure and characteristics to identify key risk factors. Zhang et al. (2021) constructed a complex network model based on complex network theory. It treats risk factors and their degree of influence as nodes and edges, identifies critical risk factors and their relationships through network analysis methods, and proposes corresponding risk management strategies. However, they still use traditional numerical ranking and comparison methods of generic parameter values to determine key risks and interactions. After the risk has been resolved, the network is not updated because this is a static, one-time, global network process.
Yang et al. (2021) proposed an engineering risk management method combining SNA and immune network algorithms, which modeled a complex engineering risk problem as a multi-level network structure and used the SNA method to analyze the characteristics of the nodes and edges in the risk network. The risk nodes are then optimally selected and eliminated through a network immunity algorithm, thus enabling effective risk management. The method has been applied in a hydropower project, and good results have been achieved. Zhou et al. (2018) Propose an engineering risk assessment method combining SNA and immune network algorithms. The technique models the engineering risk problem as a complex network. It uses the SNA method to analyze the importance of the nodes and edges in the risk network-the network immunity algorithm eliminated and patched the risk nodes, resulting in an effective risk assessment scheme. The method was applied in a highway engineering project and achieved good results. Ma et al. (2022) In this paper, a complex network-based engineering risk management method is proposed, which models the engineering risk problem as a complex network and uses the SNA method to analyze the relationship between nodes and edges in the network. Then, the risk nodes are optimally selected and excluded by a network immunity algorithm, and finally, an effective risk management scheme is obtained. The method has been applied in a construction project with good results.
Among the network immunization methods (Subramanian et al., 2015) are random immunization (RI), targeted immunization (TI), and acquaintance immunization (AI) (Lanaridis and Stafylopatis, 2014). RI completely randomly selects some nodes for immunization (Wu et al., 2018), inconsistent with risk management principles. TI specifies a small number of immune nodes with blocking properties based on global information about the network (García-Pedrajas and Fyfe, 2007). AI (Cao, 2021) represents a compromise between immunization cost and effectiveness by randomly selecting certain nodes as immune nodes and subsequently immunizing one neighboring node for each of the immune nodes. In other words, it aims to strike a balance between the cost and effectiveness of the immunization process. Based on the above analysis, given the simplicity and operability of risk management requirements in engineering practice, this paper proposes a TI method oriented to the network characteristic parameters combined with RI to analyze risk models. In this study, we explore the difficulties involved in identifying key risks and developing risk response strategies.
In this study, a risk immune response strategy research method based on complex networks is developed to identify critical risks in urban river ecological governance projects and to analyze the propagation pathways affecting the abnormal degree of risk association in urban river ecological governance projects. The logical framework of the technique, as shown in Figure 1, involves five distinct steps. Firstly, we reviewed relevant research and tabulated the list of risks for complex projects. Secondly, the risk correlation data was taken from a brainstorming session. Then, we used the visualization software to build the model. Finally, the analysis is based on network immunity. As a result, we can develop risk response strategies based on key risks and significant abnormal risk transmissions.
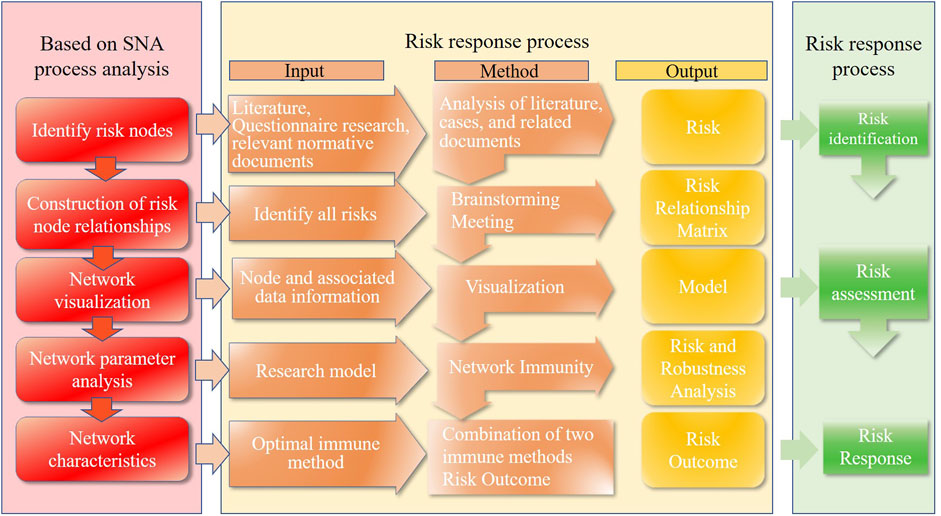
FIGURE 1. The logical framework of the risk immune response strategy research methodology.
The risk identification for this study is based primarily on literature research (Thorne et al., 2015; Damnjanovic and Reinschmidt, 2020; Erol et al., 2020; Gondia et al., 2020), combined with actual project risk research and the Ministry of Water Resources Supervision Department’s Notice on the Issuance of a List of Common Problems in the Inspection of Water Construction Projects (for Trial Implementation). The system of risk indicators is derived from the authors’ published research papers (Xu et al., 2023b), as shown in Table 1.
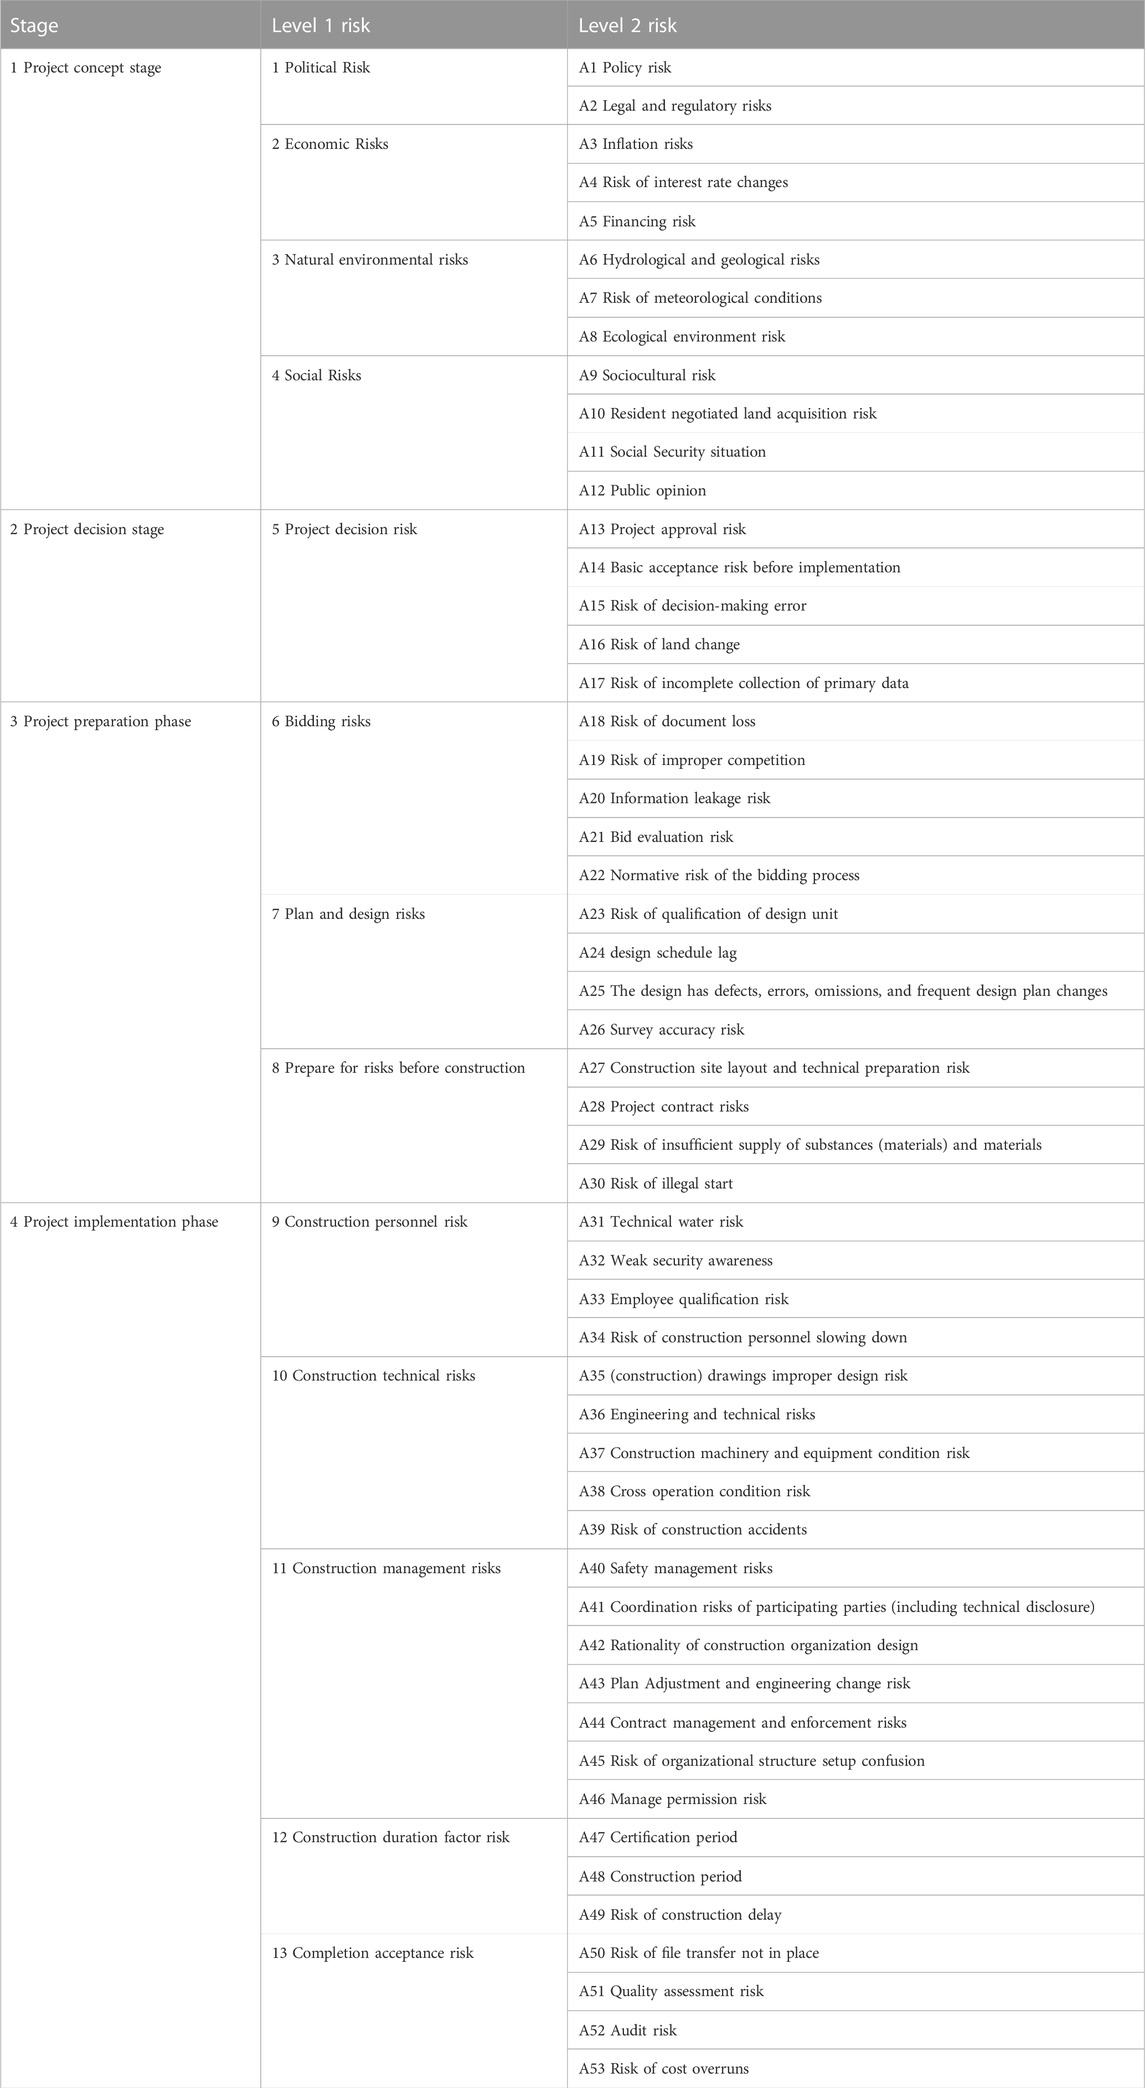
TABLE 1. Risk table factors of river ecological management project.
In the construction process of urban river ecological governance projects, economic relations or a network of responsibilities and rights are formed between the participants, with financial contracts as the link. Different participants play different roles and bear additional responsibilities in this network. This study divided the project into four stages and listed the composition of the participants in each step in Table 2. The study systematically identified and screened the risk factors of urban river ecological governance projects using relevant questionnaires to prepare the groundwork for subsequent research work.
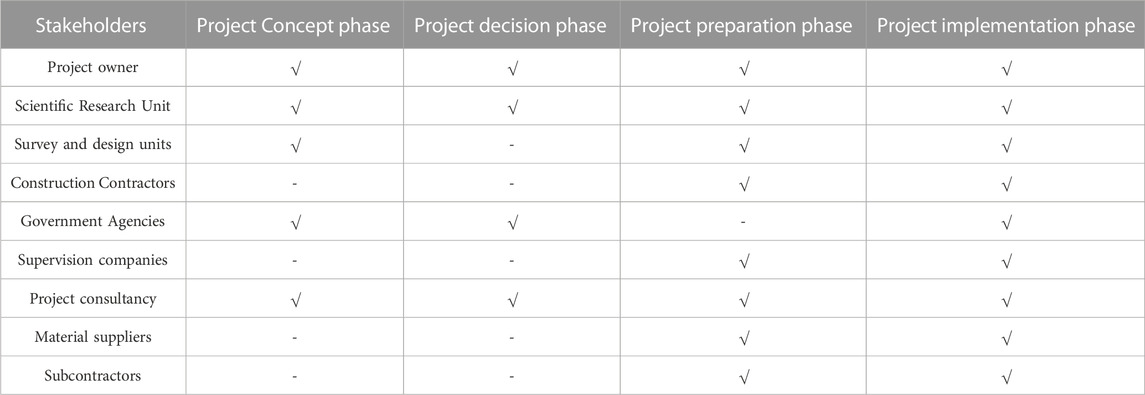
TABLE 2. Composition of parties involved in each phase of the project.
The risk evolution of urban river ecological governance projects can be viewed as a process of complex networks, in which there are complex interconnections between different risk factors. Complex network theory provides a powerful tool for analyzing the network topology and relationships between nodes. By constructing a risk evolution network, the risk factors in an urban river ecological governance project can be taken as nodes, and the influence relationships between different risk factors can be taken as edges to form a complex network, to reveal the laws and characteristics of risk evolution.
To develop a reasonable and effective risk response strategy for urban river ecological governance projects, the entire risk system needs to be quantitatively analyzed and visualized. This study used 53 risk nodes, plus risk-associated edges, for modeling. Figure 2 presents the visual model of the generated network (Xu et al., 2023b).
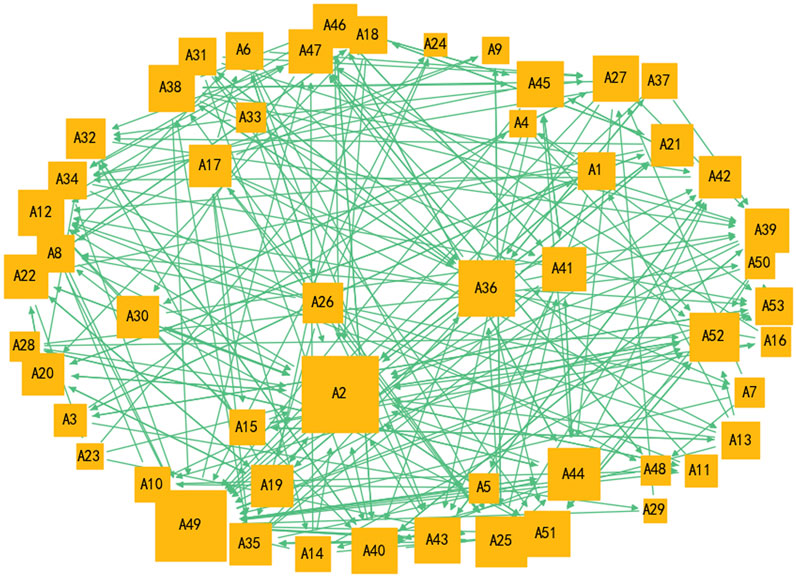
FIGURE 2. A complex network of risks for urban river ecological governance projects.
The foundation of this study relies on a risk factor relationship data matrix (Table 3). In this matrix, columns represent the causers (emitters) of the relationship, while rows represent the effectors (affected parties) of the relationship. The presence of a relationship is denoted by “1,” whereas the absence of a relationship is denoted by “0.” Let there be n risk nodes in the risk element set
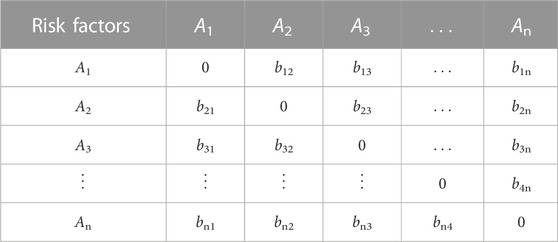
TABLE 3. Risk relationship matrix for urban river ecological management projects.
We refer to the existing methods in the relevant literature, and the risk-associated data bij for urban river ecological governance projects were determined by 10 experts who have been involved in urban river ecological governance projects in the past 10 years through a brainstorming session with purposeful sampling (Yang et al., 2021). We invited 10 experts who have been involved in urban river ecological governance projects over the past decade to participate in a purposive sampling brainstorming session. These 10 experts included 2 personnel from government water departments, 1 project owner representative, 1 researcher from a scientific institution, 1 personnel from a survey and design unit, 1 from a construction contracting unit, 1 from a supervision company, 1 from a project consulting agency, 1 material supplier, and 1 subcontractor. In the first round of assessment, all 10 participants anonymously provided their evaluation results, and then a plenary meeting was convened to discuss the outcomes. Subsequently, a second round of scoring and discussion was conducted to obtain more consistent results. The data collected in the third round closely resembled the information obtained in the previous rounds, signifying the conclusion of the brainstorming session. Following three complete rounds of discussions, the participants’ final opinions were compiled into the corresponding risk association adjacency matrix. We used the “0, 1”judging method to determine the existence of relationships between risks. When judging the risk relationships, we selected the answers with the highest frequency to maximize the determination of risk relationships and obtain the judgment results for risk association elements.
To validate the risk association data matrix constructed by the 10 experts, we established an independent validation focus group consisting of 20 individuals who were directly involved in urban river ecological governance projects on the front lines (Yang et al., 2021). Ten of the participants were practitioners from the same organization as the experts in the brainstorming session, with no knowledge of the experts’ identities. The remaining ten participants were scholars specializing in engineering management. After extensive discussions, a consensus was reached that all the risk association data in the matrix were deemed reasonable and did not require retesting. As a result, the binary values of risk associations were considered both reliable and effective.
The network model was analyzed using software (Mandell, 1984; Lee et al., 2018), and the parameters of the overall network were obtained, as shown in Table 4 (Xu et al., 2023b).
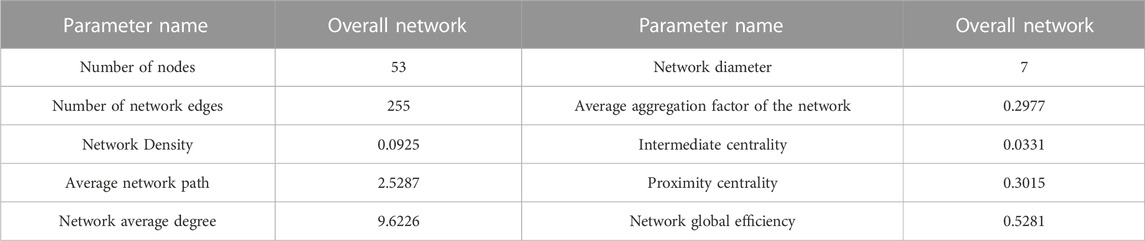
TABLE 4. Overall network parameter characteristics.
As can be seen from Table 4, the density of the network is 0.0925, indicating that the risk evolution network of the urban river ecological governance project is less tight, the evolution path of risk factors is single, and the interaction relationship between them is general; The average degree value of the network is 9.6226, which indicates that each risk factor in the network is directly related to nine other risk factors on average, a result consistent with the small-world nature of complex networks; The average path length of a risk network is 2.5287, indicating that a risk factor only needs to pass through a unit length of 2.5287 to influence other risk factors; the maximum distance (i.e., network diameter) in this network is 7, indicating that a risk factor in the network needs to pass through a maximum of 7 steps to influence the risks in the network; The clustering coefficient of the network is 0.2977, indicating that the interactions between risk events in the network are not apparent and that risks are passed between risk events, which in turn leads to changes in take-off and landing safety risks; the global efficiency value of the network is 0.5281, a parameter that reflects the speed of transfer of threats in the network, and the connectivity of the network. Other parameters of the network are characterized as follows.
Node degree is one of the indicators of network centrality, reflecting the influence of a node in the network. In a directed network, degrees can be categorized into in-degree, out-degree, and total degrees. In the urban river ecological governance project, the degrees of all network nodes were obtained using the anaconda3 software, as shown in Figure 3. Nodes with higher out-degree imply a greater number of risk factors generated under their influence. In the study, node (A25) has the highest out-degree, and node (A2) has the highest in-degree. The total degree value of the node (A2) is 34, ranking first in the network. This indicates that (A25) has the greatest influence on other nodes in the network, and (A2) is most affected by other nodes, which aligns with the actual situation.

FIGURE 3. Map of riskiness values for urban river ecological governance projects.
According to Figure 3, the nodes with larger degree values are, in order, A2, A49, A36, A44, A25, A52, A12, A27, A38, A40, A43, A45, A51, A22, A39, A41, A46, A47, A17, A19, A20, A21, A30, A35, A42, A26, A32, A1, A6, A8, A13, A18, A31, A34, A53, A10, A14, A15, A37, A3, A11, A5, A7, A16, A28, A33, A48, A50, A4, A9, A23, A24, A29.
Software was used to calculate the meso-centrality of the nodes in the network. Then, the meso-number of each node was calculated, and the nodes were ranked according to the magnitude of the meso-number, as shown in Figure 4.
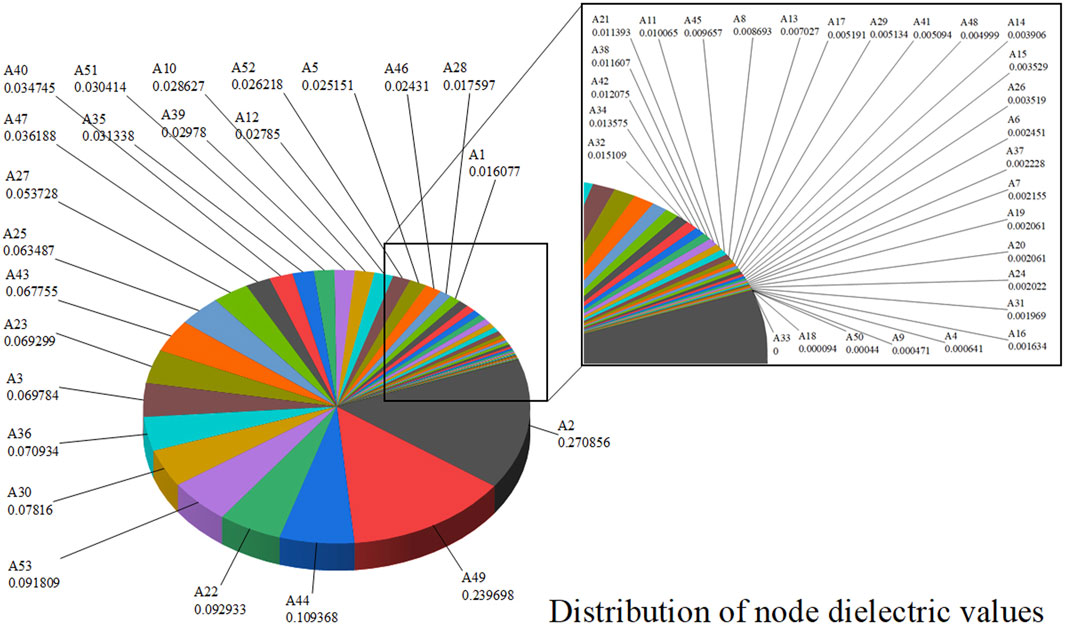
FIGURE 4. The intermediation centrality of nodes.
A node’s intermediation centrality indicates its transport capacity, and the higher the intermediation centrality, the more influential it is. It is therefore believed that nodes with high intermediation centrality values in the project risk network are capable of effectively transmitting risk. As can be seen from Figure 4, A2 has the highest betweenness centrality, indicating that legal and regulatory risks are passed through multiple shortest paths in the entire network and play an essential role in risk transmission throughout the network. In practical work, many risk factors can affect risk generation by influencing A2. Nodes with high betweenness centrality have an important position in the risk network.
Closeness centrality is defined as the reciprocal of the average distance from a node to all other nodes in the network, reflecting the importance of the node’s position in the model. The closeness centrality of each node, calculated using software, is shown in Table 5. The distribution and ranking of closeness centrality of each node in the risk network were obtained through analysis using software, as shown in Figure 5.
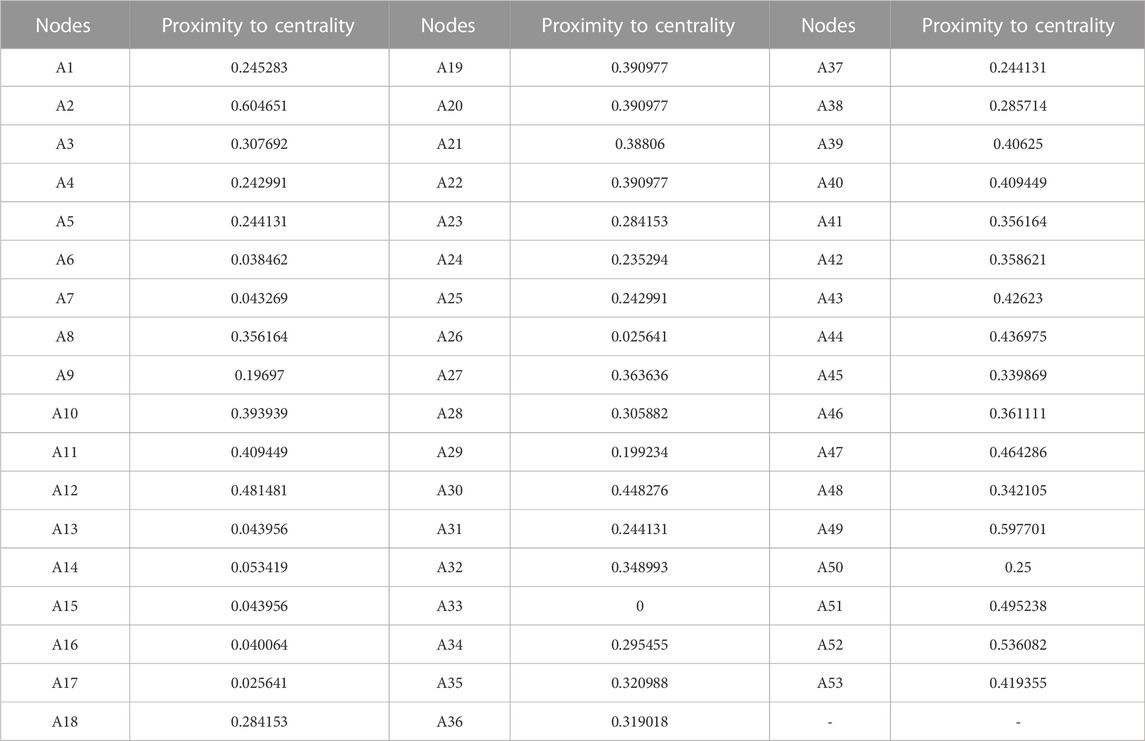
TABLE 5. Node proximity centrality values.
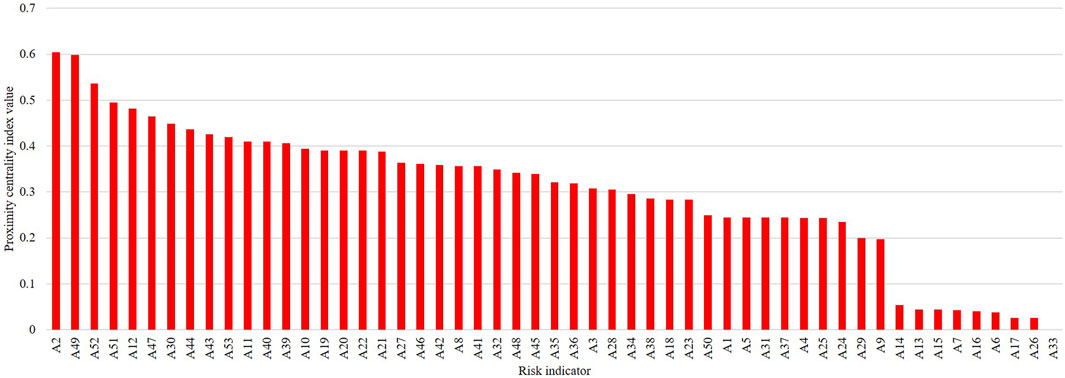
FIGURE 5. Ranking of the Node proximity centrality.
In a network, a higher closeness centrality value indicates fewer paths between nodes, indicating the node is nearer the center. To determine whether a node is a central node in the overall project risk network, the closeness centrality is used. According to Figure 5, the top 10 nodes ranked by the closeness centrality index are A2, A, A52, A51, A12, A47, A30, A44, A43, and A53. Located closest to the network center, these nodes are extremely important. Therefore, when developing risk management plans, it is necessary to consider targeted control measures for the above risk factors.
Different parameter measurements may have other effects on the overall network. A single measurement parameter cannot often determine the importance of a risk factor in a network. To determine the final key risk factor, different parameters must be considered and compared comprehensively. In this study, network measurement indicators such as node degree centrality, betweenness centrality, and closeness centrality were analyzed. The average value of these indicators can be calculated to obtain the total value of each node, and their sizes are ranked, as indicated in Table 6.
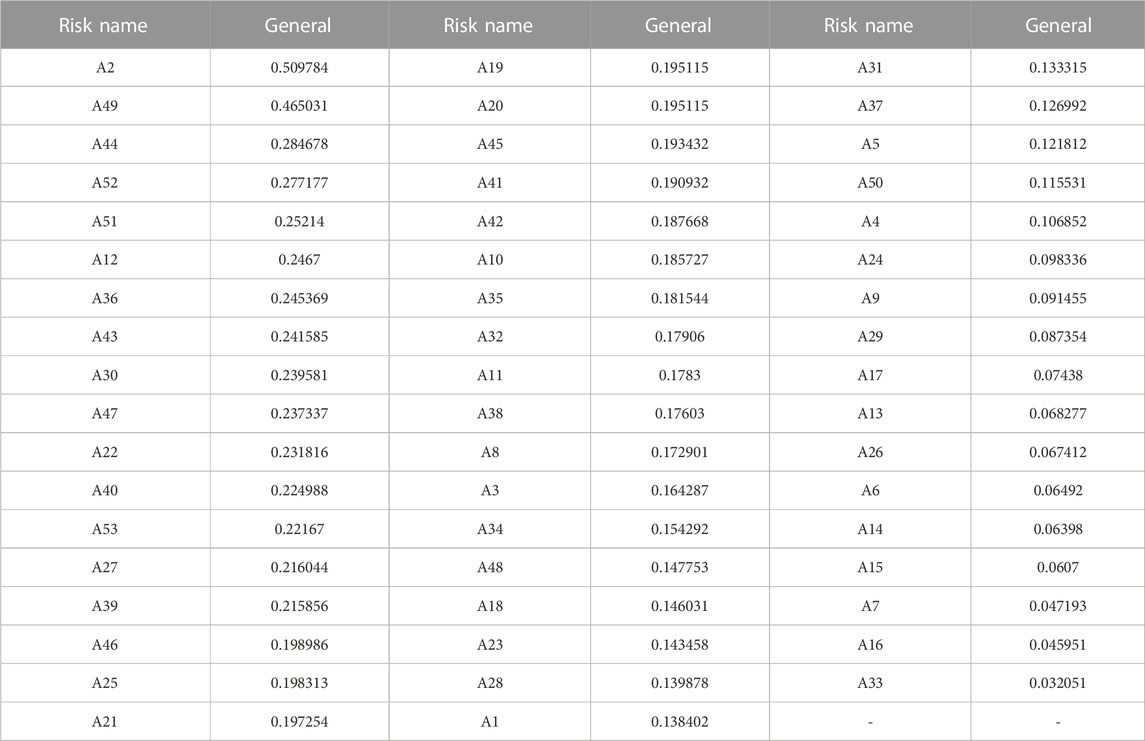
TABLE 6. Parameters for the combined value of risk nodes.
According to the rankings of the total values of each node in Figure 6, it can be seen that node A2 has the most significant complete value, indicating that legal and regulatory risks are the most critical node in the network. Meanwhile, in the rankings of degree centrality, closeness centrality, and betweenness centrality, legal and regulatory risks rank first in all three centrality measures, indicating that legal and regulatory risks have the highest importance in the risk network. When evaluating the importance of risk factors, the evaluation results of a single metric may be biased, and the judgment based on the total value is more accurate.
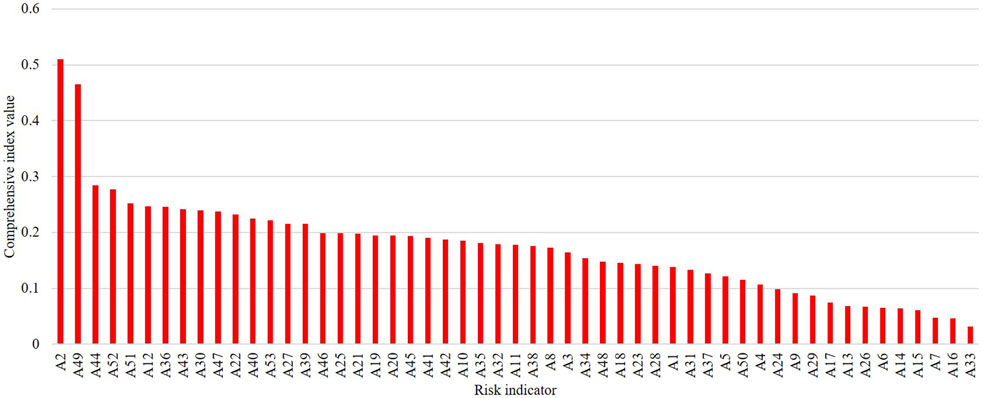
FIGURE 6. Ranking of the combined values of the risk nodes.
The principle of node importance refers to the relationship between the importance of a node in a network and its position, connectivity, and other relevant factors in the network. Generally, the more a node is connected to other nodes in the network, the more critical it is. Additionally, node importance is also related to other factors such as its degree centrality, betweenness centrality, and closeness centrality. Analyzing and evaluating the significance of nodes can help identify critical nodes and main influencing factors in the network, thereby developing risk management strategies and measures in a targeted manner. Network robustness refers to the ability of a network to maintain connectivity in the event of an attack or failure of one or more nodes in the network. Network robustness reflects the impact of partial structural loss on the overall structure and functionality of a network when one or more nodes in the network are attacked or fail. Recently, it has become a hot research topic in complex networks. Scholars have conducted related research on the robustness of networks, and the leading indicators used to analyze the robustness of networks are average path length, size of the most significant connected component, and global efficiency. This study builds upon previous research and selects global efficiency as the indicator to investigate the performance robustness of the network.
The choice of which indicator to use for intentional attacks is also crucial. In this section, based on the above analysis and careful consideration, we propose four immune strategies, focusing on the immunity of nodes and the evaluation of network efficiency to reflect node importance, as shown in Table 7.
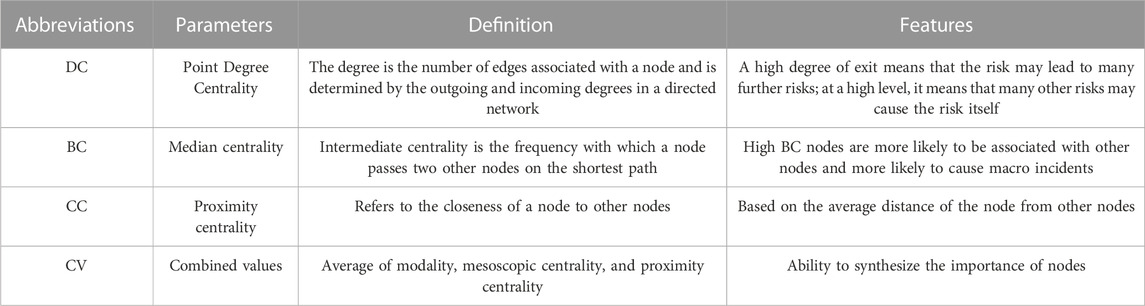
TABLE 7. Four immunization strategies and characteristics.
According to multi-attribute decision-making, the commonly used indicators of node importance in the risk evolution network were obtained through software. The importance of 53 risk points was ranked. Based on the four importance indicators listed earlier, the results of node importance were shown in Figures 3–6 in descending order of importance values.
The selection of nodes for random immunity is entirely arbitrary. In this paper, the 53 nodes were sorted randomly using the random function in Excel. On the other hand, deliberate impunity is carried out by simulating immunity by targeting different node indicators one by one. To make the comparison more objective, this study added a control group of random immunity (RI) in this section and the four targeted immunity (TI) strategies to achieve a more straightforward comparison. For the risk network of urban river ecological governance projects, ND reflects the overall scale of the project risk system after the risks have been fully transmitted. Thus, the primary objective of the subsequent immunization process is to decrease the ND value. This study used the TI method to identify the key risks that determine the project’s final scale. A degree-targeted immunity program (DTI), a betweenness centrality-targeted immunity program (BCTI), a closeness centrality-targeted immunity program (CCTI), and a comprehensive value-targeted immunity program (CVTI) are all part of it. In TI, the optimal immunized node represents the critical risk of the project, which can provide a basis for developing risk response strategies for the project.
According to Figure 7, the initial size of the network’s most significant connected component (structural robustness) is close to 1. Under both attack modes, the structural robustness of the network decreases as the number of removed nodes increases, and the decrease in robustness is faster under deliberate attacks than random attacks. After randomly attacking 49% of the nodes on the network, the structural robustness of the network decreased to 0.5094. Similarly, attacking the same number of network nodes using the degree attack method reduced the network’s structural robustness to 0.3396, the betweenness centrality attack method decreased it to 0.2452, the closeness centrality attack method reduced it to 0.4906, and the comprehensive value attack method reduced it to 0.4716. This indicates that the urban river ecological governance project risk evolution network is more robust and fault tolerant in the random attack mode and less robust in the deliberate attack mode. The degree value attack method is most effective in the intentional attack, i.e., the least robust. Under a random attack, the structural robustness of the network drops to zero only when the removal of nodes approaches 100%, suggesting that only effective control of the vast majority of risk factors in the network can bring down the entire network. However, in reality, risk factors exist objectively, and the probability of completely controlling all risk factors is small, so the urban river ecological governance project risk evolution network is highly robust to random attacks. Under deliberate attacks, the structural robustness of the network decreases faster when some of the nodes are attacked, indicating that these nodes are the core nodes of the network, and once these core nodes are attacked, the whole network is paralyzed. Thus, the urban river ecological governance project risk evolution network has poor robustness against deliberate attacks.
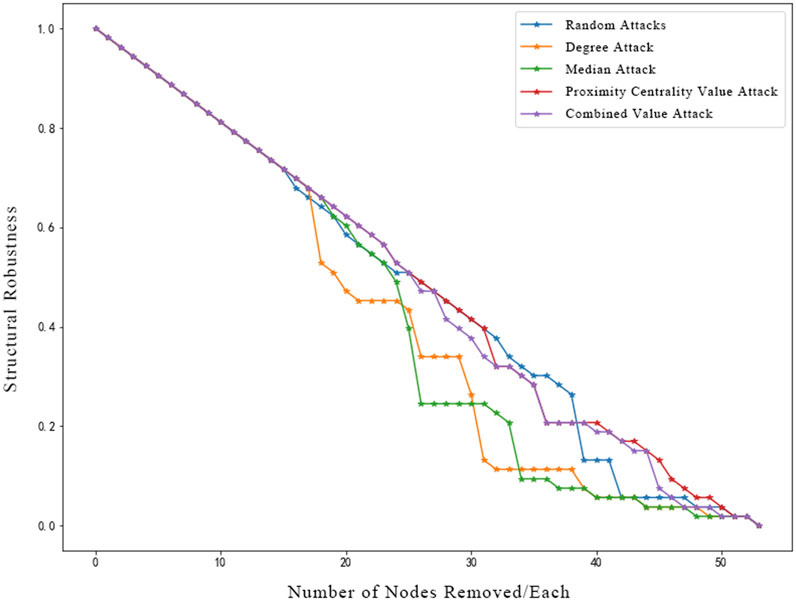
FIGURE 7. Structural robustness analysis diagram.
As can be seen from Figure 8, the line for the random attack is above the deliberate attack. Although some areas of contrast exist, the overall global efficiency decreases to a lesser extent than the intended attack. The reason for the poor effectiveness of the intentional attack is that when using the proximity centrality attack and the combined value attack, some of the edge nodes in the network may have been removed, making the network more efficient instead, resulting in a short-lived contrast. The initial global efficiency (performance robustness) of the network was 0.5281, and a random attack on 38% of the nodes in the network resulted in a global efficiency of 0.5297; the same deliberate attack on 38% of the nodes reduced the global efficiency of the degree value attack to 0.2079, the global efficiency of the median value attack to 0.2896, and the global efficiency of the proximity centrality value attack to 0.9359. Among deliberate attacks, the metric attack makes the fastest and most effective reduction in global efficiency, i.e., the network is most vulnerable under this attack. The order of the nodes deliberately attacked shows that attacking the critical nodes first will cause a rapid change in the topology of the network, creating many isolated nodes relatively quickly and causing the network to go down quickly. In contrast, the probability of attacking exactly these critical nodes in a random attack is small, and only if enough nodes are attacked at random will the network go down.
1) The random immunization strategy was significantly less effective than the TI immunization strategy. According to the network performance robustness and structural robustness analysis, the overall effect of the random immunization strategy was considerably worse than that of the deliberate immunization strategy after removing the same nodes. In the intentional immunization strategy, the network efficiency of degree, mesh number, and near-center degree are worse than in random immunization. Therefore, it can be proved that focused management of critical nodes is an essential and effective means of risk management for urban river ecological governance projects.
2) Of the immunization strategies, near-center value attacks are the least effective, median value immunity is slightly more effective, and degree value immunity attacks are the most effective.
3) For risk management with urban river ecological governance projects, as nodal degree value immunity is the most effective, prevention solutions for risks are more preferred, and important nodes corresponding to nodal degree value immunity should be considered for prevention and control, i.e., nodes A2, A49, A36, A44, A25, A5, A12, etc.
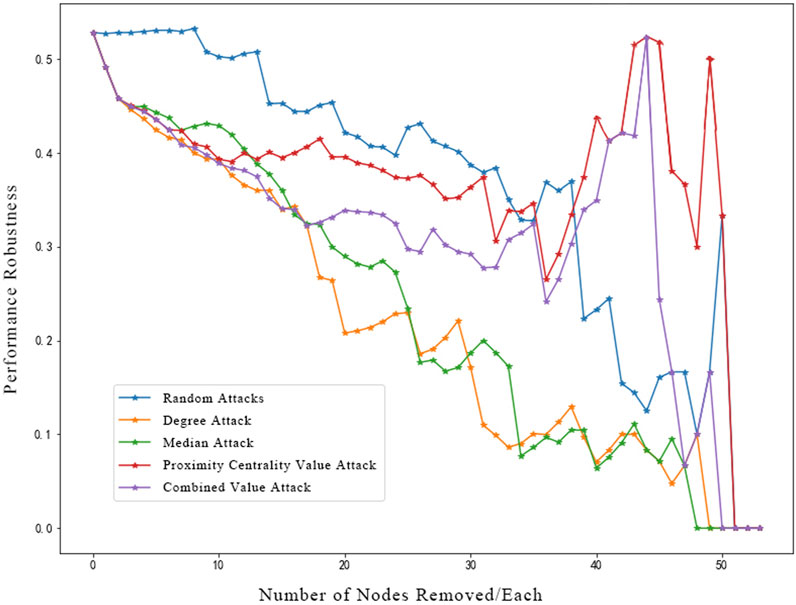
FIGURE 8. Performance robustness analysis chart.
In summary, the structural robustness and performance robustness of the network both decrease as the number of attacks (number of nodes removed) increases. In addition, the impact of deliberate attacks on robustness is more significant. For the risk evolution network of the urban river ecological governance project, robustness is poorer in the intentional attack mode. In contrast, robustness and fault tolerance are more robust in the random attack mode.
By identifying the risks associated with urban river ecological governance projects, a risk network model was developed, visualized, and analyzed in this study. The risk response strategy for urban river ecological governance projects is explored through the perspective of network immunity. The results of the model parameter analysis demonstrate the applicability of this study to the risk of urban river ecological governance projects and the feasibility of a risk response strategy for urban river ecological governance projects developed based on the network immunity approach.
Firstly, the model parameter analysis results can be further explained and validated through complex network theory. In a risk network, DTI has a clear advantage as it can effectively control the spread effectiveness of the entire network. Therefore, identifying key risks and controlling abnormal risk-associated network immune strategies are not only more effective and reliable in assessing the importance of risks in the project but also more effective and reliable in subsequent risk-sharing tasks. Secondly, the model has several advantages, such as facilitating early risk response decisions and building a future-proof risk warning framework. To enhance the applicability of the model in urban river ecological governance projects, this study conducted a complete literature and case study and brainstorming sessions with 10 experienced experts to clarify risk relationships. Therefore, the risk list and 53-risk network developed in this study may be more effective and prospective. In addition, the accuracy of the network analysis process can be improved by simulating the analysis of different decision scenarios. This paper also develops and visualizes the entire risk network and filters out the accurate network through a simple statistical process. Finally, the evolution of landing and take-off safety risks for urban river ecological governance projects can be effectively controlled by disconnecting key risk factors in the network or effectively reducing the position of these key risk factors. The risk evolution of nodes can be prevented by disconnecting these risk factors or by reducing the risk level of these factor nodes and the intensity of the interaction between these factors using corresponding means. The way to reduce the level of risk at these factor nodes and the power of action between these factors using appropriate means is more suitable to prevent the evolution of risk in urban river ecological governance projects.
The impact of changing project conditions on the assessment of risk networks is a critical step in ensuring the stability and reliability of the results. The interactions between risk factors can vary significantly when dealing with different projects, hence the analytical methods that can be used when targeting different project-specific risk studies. 1) Validation based on historical data: If relevant data from previous projects are available, it can be used to validate the accuracy and stability of risk network assessment. By incorporating historical project data into the current project’s risk network and comparing actual results with predicted results, the applicability and accuracy of risk network assessment across different projects can be evaluated. 2) Analyzing different scenarios: In risk network assessment, considering different scenarios of risks can be beneficial. For example, constructing separate risk networks for different project conditions or risk assumptions and conducting comparative analysis. This approach helps understand the interactions and influences of risk factors under different conditions. 3) Expert discussions and validation: During the assessment process, seeking expert opinions and validation is crucial. Engaging in discussions and validation with experts in relevant fields can lead to more comprehensive and accurate evaluation results, thereby reducing the impact of project condition changes on the assessment. By applying a combination of these methods, the stability and reliability of risk network assessment can be improved, reducing the influence of project condition changes on the evaluation results. This, in turn, provides decision-makers with more reliable risk management strategies and decision-making foundations.
To investigate the advantages of social network-based analysis by comparing it with traditional methods and to highlight the unique value of the method in risk studies of urban river ecological governance projects. In terms of accuracy: Compare the accuracy of methods based on social network analyses with traditional methods in identifying key risk factors, risk relationships, risk propagation paths, and so on. Which method more accurately reflects the actual risk situation can be verified by some case studies or field surveys. In terms of efficiency: compare the efficiency of methods based on social network analysis with traditional methods in analyzing large-scale complex networks. Whether social network analysis produces results more quickly and handles large amounts of data better can be used as a basis for comparison. In terms of predictability: methods based on social network analysis are better at predicting future risk evolution and potential risks of a project. By comparing the performance of the two approaches in terms of risk prediction, it is possible to see whether the approach based on social network analysis is more forward-looking. At the same time whether the method based on social network analysis can provide clearer and more intuitive visualization results. Thus, the application of the method of social network analysis in the risk research of urban river ecological governance projects has greater advantages. It can further enhance its application value in the field of risk research.
Based on the causal pathways among risk factors, a complex network topology of 53 nodes and 255 edges was constructed for the risk evolution of urban river ecological governance projects. The risk factors were ranked based on degree centrality, betweenness centrality, closeness centrality, and composite value in the weighted directed network. The analysis demonstrated the scale-free property of the network. The application of complex network theory in analyzing the risk system for urban river ecological governance projects can effectively identify the critical factors of the entire risk system, determine the risk relationships, and then take targeted measures to reduce the risk of water engineering systems. The global efficiency of the network was used as an indicator to analyze the robustness of the risk evolution network under random and intentional attacks, revealing the changing patterns of performance stability and structural stability of the scale-free network. Based on the robustness analysis, the critical risk factors of the network were identified using degree centrality ranking. Based on this, corresponding network disconnect strategies were developed, which provides a theoretical basis for effectively preventing risk evolution.
The methodology used in this study is influenced to some extent by the subjectivity and experience of the individual experts. To address this limitation more comprehensively, future research could consider adopting more objective and reliable data sources, such as analyses based on actual observational data or large-scale datasets, to reduce reliance on expert subjective judgment. Additionally, combining quantitative and qualitative methods for a comprehensive analysis could enhance the objectivity and reliability of the research. Further studies can explore more comprehensive and objective approaches to fill this research gap and promote the advancement of related fields.
The original contributions presented in the study are included in the article/supplementary material, further inquiries can be directed to the corresponding author.
Conceptualization: JKX; methodology: JKX; validation: JCX and JZ; formal analysis: JCX and JZ; data curation: JKX; writing—original draft preparation, JKX; writing—review and editing, JCX and JZ; funding acquisition, JZ. All authors contributed to the article and approved the submitted version.
This research was supported by Jinghe New City Jinghe Flood Control and Ecological Governance Engineering Consulting Research Project (No. 107-441220098).
The authors declare that the research was conducted in the absence of any commercial or financial relationships that could be construed as a potential conflict of interest.
All claims expressed in this article are solely those of the authors and do not necessarily represent those of their affiliated organizations, or those of the publisher, the editors and the reviewers. Any product that may be evaluated in this article, or claim that may be made by its manufacturer, is not guaranteed or endorsed by the publisher.
Abbas, H., Asim, Z., Ahmed, Z., and Moosa, S. (2022). Exploring and establishing the barriers to sustainable humanitarian supply chains using fuzzy interpretive structural modeling and fuzzy MICMAC analysis. Soc. Responsib. J. 18 (8), 1463–1484. doi:10.1108/srj-12-2020-0485
Aloini, D., Dulmin, R., and Mininno, V. (2012). Modelling and assessing erp project risks: a petri net approach. Eur. J. operational Res. 220 (2), 484–495. doi:10.1016/j.ejor.2012.01.062
Cao, H., Duan, L., Zhang, Y., Cao, J., and Zhang, K. (2021). Current hydrogel advances in physicochemical and biological response-driven biomedical application diversity. J. Inf. Process. Syst. 17 (2), 426–439. doi:10.1038/s41392-021-00830-x
Damnjanovic, I., and Reinschmidt, K. (2020). Data analytics for engineering and construction project risk management. Germany: Springer.
Deng, Q., Qin, Y., and Ahmad, N. (2022). Relationship between environmental pollution, environmental regulation and resident health in the urban agglomeration in the middle reaches of yangtze river, China: spatial effect and regulating effect. Sustainability 14 (13), 7801. doi:10.3390/su14137801
Desavelle, J. (2015). A risk management strategy for effective planning and budgeting for new build nuclear power plant construction: research methodology and implementation of the olkiluoto 3 project. Master’s thesis. Finland: Satakunta University of Applied Sciences. Available at: http://www.theseus.fi/handle/10024/95636.
Erol, H., Dikmen, I., Atasoy, G., and Birgonul, M. T. (2020). Exploring the relationship between complexity and risk in megaconstruction projects. J. Constr. Eng. Manag. 146 (12), 04020138. doi:10.1061/(asce)co.1943-7862.0001946
Fang, C., Marle, F., Zio, E., and Bocquet, J.-C. (2012). Network theory-based analysis of risk interactions in large engineering projects. Reliab. Eng. Syst. Saf. 106, 1–10. doi:10.1016/j.ress.2012.04.005
García-Pedrajas, N., and Fyfe, C. (2007). Immune network based ensembles. Neurocomputing 70 (7-9), 1155–1166. doi:10.1016/j.neucom.2006.11.005
Ghasemi, F., Sari, M. H. M., Yousefi, V., Falsafi, R., and Tamošaitienė, J. (2018). Project portfolio risk identification and analysis, considering project risk interactions and using Bayesian networks. Sustainability 10 (5), 1609. doi:10.3390/su10051609
Gondia, A., Siam, A., El-Dakhakhni, W., and Nassar, A. H. (2020). Machine learning algorithms for construction projects delay risk prediction. J. Constr. Eng. Manag. 146 (1), 04019085. doi:10.1061/(asce)co.1943-7862.0001736
Huang, S., Wang, H., Xu, Y., She, J., and Huang, J. (2021). Key disaster-causing factors chains on urban flood risk based on bayesian network. Land 10 (2), 210. doi:10.3390/land10020210
Karmaker, C. L., Ahmed, T., Ahmed, S., Ali, S. M., Moktadir, M. A., and Kabir, G. (2021). Improving supply chain sustainability in the context of COVID-19 pandemic in an emerging economy: exploring drivers using an integrated model. Sustain. Prod. Consum. 26, 411–427. doi:10.1016/j.spc.2020.09.019
Lanaridis, A., and Stafylopatis, A. (2014). An artificial immune network for multiobjective optimization problems. Eng. Optim. 46 (8), 1008–1031. doi:10.1080/0305215x.2013.823193
Lee, C.-Y., Chong, H.-Y., Liao, P.-C., and Wang, X. (2018). Critical review of social network analysis applications in complex project management. J. Manag. Eng. 34 (2), 04017061. doi:10.1061/(asce)me.1943-5479.0000579
Leoni, L., BahooToroody, A., De Carlo, F., and Paltrinieri, N. (2019). Developing a risk-based maintenance model for a natural gas regulating and metering station using bayesian network. J. Loss Prev. Process industries 57, 17–24. doi:10.1016/j.jlp.2018.11.003
Lienert, J., Schnetzer, F., and Ingold, K. (2013). Stakeholder analysis combined with social network analysis provides fine-grained insights into water infrastructure planning processes. J. Environ. Manag. 125, 134–148. doi:10.1016/j.jenvman.2013.03.052
Liu, K., Yang, S., Zhou, Q., and Qiao, Y. (2022). Spatiotemporal evolution and spatial network analysis of the urban ecological carrying capacity in the Yellow River Basin. Int. J. Environ. Res. Public Health 19 (1), 229. doi:10.3390/ijerph19010229
Luo, W., Deng, Z., Zhong, S., and Deng, M. (2022). Trends, issues and future directions of urban health impact assessment research: a systematic review and bibliometric analysis. Int. J. Environ. Res. Public Health 19 (10), 5957. doi:10.3390/ijerph19105957
Ma, X., Deng, W., Qiao, W., and Luo, H. (2022). A novel methodology concentrating on risk propagation to conduct a risk analysis based on a directed complex network.Risk Anal.
Mandell, M. (1984). Application of network analysis to the implementation of a complex project. Hum. Relat. 37 (8), 659–679. doi:10.1177/001872678403700806
Marcot, B. G., and Penman, T. D. (2019). Advances in bayesian network modelling: integration of modelling technologies. Environ. Model. Softw. 111, 386–393. doi:10.1016/j.envsoft.2018.09.016
Marle, F., Vidal, L.-A., and Bocquet, J.-C. (2013). Interactions-based risk clustering methodologies and algorithms for complex project management. Int. J. Prod. Econ. 142 (2), 225–234. doi:10.1016/j.ijpe.2010.11.022
Mohamed, M., and Tran, D. Q. (2021). Risk-based inspection for concrete pavement construction using fuzzy sets and bayesian networks. Automation Constr. 128, 103761. doi:10.1016/j.autcon.2021.103761
Soti, A., Shankar, R., and Kaushal, O. (2010). Modeling the enablers of Six Sigma using interpreting structural modeling. J. Model. Manag. 5 (2), 124–141. doi:10.1108/17465661011060989
Subramanian, N., Torabi-Parizi, P., Gottschalk, R. A., Germain, R. N., and Dutta, B. (2015). Network representations of immune system complexity. Wiley Interdiscip. Rev. Syst. Biol. Med. 7 (1), 13–38. doi:10.1002/wsbm.1288
Teller, J., and Kock, A. (2013). An empirical investigation on how portfolio risk management influences project portfolio success. Int. J. Proj. Manag. 31 (6), 817–829. doi:10.1016/j.ijproman.2012.11.012
Thorne, C., Castro, J., Cluer, B., Skidmore, P., and Shea, C. (2015). Project risk screening matrix for river management and restoration. River Res. Appl. 31 (5), 611–626. doi:10.1002/rra.2753
Ullah, F., Qayyum, S., Thaheem, M. J., Al-Turjman, F., and Sepasgozar, S. M. (2021). Risk management in sustainable smart cities governance: a toe framework. Technol. Forecast. Soc. Change 167, 120743. doi:10.1016/j.techfore.2021.120743
Valente, T. W. (2012). Network interventions. science 337 (6090), 49–53. doi:10.1126/science.1217330
Valeri, M., and Baggio, R. (2021). Social network analysis: organizational implications in tourism management. Int. J. Organ. Analysis 29 (2), 342–353. doi:10.1108/ijoa-12-2019-1971
Wang, Z., and Chen, C. (2017). Fuzzy comprehensive Bayesian network-based safety risk assessment for metro construction projects. Tunn. Undergr. Space Technol. 70, 330–342. doi:10.1016/j.tust.2017.09.012
Wirba, E., Tah, J., and Howes, R. (1996). Risk interdependencies and natural language computations. New York: Engineering, Construction and Architectural Management.
Wu, G., Peng, C., and Liao, T. W. (2018). Research on edges immunization strategy for complex network based on SIS-CA model. Procedia Manuf. 17, 1065–1072. doi:10.1016/j.promfg.2018.10.079
Xie, L., Han, T., and Skitmore, M. (2019). Governance of relationship risks in megaprojects: a social network analysis. Adv. Civ. Eng. 2019, 1–13. doi:10.1155/2019/1426139
Xu, J., Zhu, J., and Xie, J. (2023a). Research on risk evolution mechanism of urban river ecological governance project based on social network analysis. Water 15 (11), 2012. doi:10.3390/w15112012
Xu, J., Zhu, J., and Xie, J. (2023b). Study on the evolution of risk contagion in urban river ecological management projects based on SEIRS. Water 15 (14), 2622. doi:10.3390/w15142622
Yang, L., Lou, J., and Zhao, X. (2021). Risk response of complex projects: risk association network method. J. Manag. Eng. 37 (4), 05021004. doi:10.1061/(asce)me.1943-5479.0000916
Yu, G., Liu, D., Liao, X., Wang, T., Tian, Q., and Liao, Y. (2017). Quantitative research on regional ecological compensation from the perspective of carbon-neutral: the case of hunan province, China. Sustainability 9 (7), 1095. doi:10.3390/su9071095
Zhang, S., Sunindijo, R. Y., Loosemore, M., Wang, S., Gu, Y., and Li, H. (2021). Identifying critical factors influencing the safety of Chinese subway construction projects. Eng. Constr. Archit. Manag. 28 (7), 1863–1886. doi:10.1108/ecam-07-2020-0525
Zhao, X., and Huang, G. (2022). Urban watershed ecosystem health assessment and ecological management zoning based on landscape pattern and swmm simulation: a case study of yangmei river basin. Environ. Impact Assess. Rev. 95, 106794. doi:10.1016/j.eiar.2022.106794
Zhou, C., Ding, L., Skibniewski, M. J., Luo, H., and Zhang, H. (2018). Data based complex network modeling and analysis of shield tunneling performance in metro construction. Adv. Eng. Inf. 38, 168–186. doi:10.1016/j.aei.2018.06.011
Zhu, W., Shen, M., Dai, S., Liu, K., and Qi, Y. (2022). Channel evolution under the control of base-level cycle change and the influence on the sustainable development of the remaining oil—a case in jiang ling depression, jiang han basin, China. Sustainability 14 (19), 12518. doi:10.3390/su141912518
Keywords: SNA, engineering project risk, robustness, urban rivers, manage
Citation: Xu J, Zhu J and Xie J (2023) Risk evolution and mitigation of the urban river ecological governance project based on social network analysis. Front. Earth Sci. 11:1237884. doi: 10.3389/feart.2023.1237884
Received: 10 June 2023; Accepted: 14 August 2023;
Published: 30 August 2023.
Edited by:
Wei Ge, Zhengzhou University, ChinaReviewed by:
Tao Yu, Harbin Institute of Technology, ChinaCopyright © 2023 Xu, Zhu and Xie. This is an open-access article distributed under the terms of the Creative Commons Attribution License (CC BY). The use, distribution or reproduction in other forums is permitted, provided the original author(s) and the copyright owner(s) are credited and that the original publication in this journal is cited, in accordance with accepted academic practice. No use, distribution or reproduction is permitted which does not comply with these terms.
*Correspondence: JunKe Xu, MTE4MDcxMTAxNEBzdHUueGF1dC5lZHUuY24=
Disclaimer: All claims expressed in this article are solely those of the authors and do not necessarily represent those of their affiliated organizations, or those of the publisher, the editors and the reviewers. Any product that may be evaluated in this article or claim that may be made by its manufacturer is not guaranteed or endorsed by the publisher.
Research integrity at Frontiers
Learn more about the work of our research integrity team to safeguard the quality of each article we publish.