- 1Faculty of Civil Engineering and Mechanics, Kunming University of Science and Technology, Kunming, China
- 2Power China Kunming Engineering Corporation Limited, Kunming, China
In the freezing process, the soil is accompanied by heat conduction, heat release for ice-water phase change, phase change interface movement, and a change in thermal diffusion coefficient, which is a complex nonlinear problem and is hard to solve. This study uses the enthalpy method to establish a unified control equation for heat conduction in the entire calculation region (including the solid-phase zone, liquid-phase zone, and phase change interface). It solves the equation numerically, relying on the D2Q4 model of the lattice Boltzmann method, and determines the evolution of the temperature field and solid-liquid phase change interface position with time. The trends in the soil’s temperature field evolution and freezing front movement under unilateral and bilateral cold sources are discussed using an example from an artificial freezing project. The results show that when −10°C is taken as the limit for freezing wall temperature, the freezing wall thickness developed at 5, 10, 20, 30, and 40 days under the unilateral cold source is 0.24, 0.33, 0.47, 0.57, and 0.66 m, respectively. The overall temperature in the soil drops below −13.6°C and −26.4°C at 35 days and 45 days under the bilateral cold sources. These values can provide a basis for engineering design.
1 Introduction
In building underground projects, the heat conduction problem accompanied by phase change frequently occurs, such as in tunnelling projects in cold areas (Hunag et al., 1986), constructing underground projects, including subways (Van Dorst, 2013), artificial freezing reinforcement of soil during shaft sinking at mine (Levin et al., 2021), treatment of underground repositories of permanently isolated radioactive waste (Jing et al., 1995), and others. If the development mechanism of the temperature field of the geotechnical materials in the freezing process cannot be comprehended in engineering practice, it will seriously affect the project’s safety and directly or indirectly cause significant economic losses. For example, a shaft submergence accident occurred in an auxiliary shaft of Huainan Xieqiao Mining Area due to the freezing tube fracture, resulting in direct economic losses of over 10 million yuan. Repeated water-bursting accidents happened during excavation in a concealed excavation tunnel in Shenzhen because of a frozen wall connection failure. Due to the water gushing at the frozen wall in the intermediate wind well in the tunnel of Shanghai Metro Line 4, a severe surface collapse occurred, and the entire tunnel was destroyed by Huangpu River water gushing, resulting in an economic loss of nearly 150 million yuan. Therefore, a systematic and in-depth study of the development trends of the solid-liquid phase change interface, and the evolution of the temperature field during the soil freezing process, can provide a valuable technical foundation for projects associated with soil freezing. This has significant value for theoretical research and offers broad engineering application prospects.
When soil water condenses into ice and forms a solid-liquid phase change interface, heat will be released at the interface, and the interface will move continuously with time during freezing. Thus, the heat conduction problem with phase change is highly nonlinear. Due to the nonlinear nature of the phase change system at its moving interfaces, it is difficult to predict its behaviour, and no rigorous theory can be developed (Rabin and Korin, 1993; Costa et al., 1998). A large number of practical engineering problems are often solved with the assistance of numerical algorithms. In dealing with phase change boundaries, current computational methods include the heat capacity (Rabin and Korin, 1993; Alva et al., 2006), Kirchhoff transformation (Voller et al., 1990), and enthalpy methods (Costa et al., 1998; Jiaung et al., 2001; Miller and Succi, 2002; Eshraghi and Felicelli, 2012). In dealing with phase change interfaces, the enthalpy approach has been widely used because of its advantages, such as clear physical meaning, no need to trace the interface, and ease of numerical calculation. The lattice Boltzmann method is a mesoscopic numerical calculation technique that can establish the relation between macroscopic and microscopic computations in numerical simulation of heat conduction. The method core is to establish a bridge between the microscopic and macroscopic scales. It does not need to consider the motion law of individual particles but instead considers the motion of all particles as a whole and describes their overall macroscopic motion characteristics using the distribution function. Due to its clear physical concepts, ease in dealing with complex boundaries, simple implementation of procedures, and suitability for parallel computation, it has gained increasing attention for phase change heat conduction problems. Jiaung et al. (Jiaung et al., 2001) improved the lattice Boltzmann model using the enthalpy method to simulate the heat conduction problem associated with solid-liquid phase changes. Miller and Succi (Miller and Succi, 2002) simulated two-dimensional crystal solidification and dendrite growth by introducing a time-dependent phase change fraction. Eshraghi and Felicelli (Eshraghi and Felicelli, 2012) developed an implicit lattice Boltzmann model for phase change heat conduction using the D2Q9 model and considering different boundary conditions.
By combining the enthalpy method and the lattice Boltzmann method, the strengths of both approaches can be leveraged, enhancing the accuracy and reliability of heat conduction studies in soil. Both the enthalpy method and the lattice Boltzmann method are capable of dealing with intricate geometries and boundary conditions. This enables more precise simulations of heat conduction in soil with complex structures and spatial heterogeneity. The lattice Boltzmann method inherently lends itself to parallel computing. When combined with the enthalpy method, the parallel computing advantage can be further exploited, accelerating the computational speed of heat conduction simulations and improving efficiency. The enthalpy and lattice Boltzmann methods allow for modeling at different scales. Their combination enables multiscale heat conduction simulations, encompassing various scales from micro to macro, facilitating a comprehensive understanding of heat transfer behavior in soil.
This study uses the lattice Boltzmann model relying on the enthalpy method to transform the heat conduction problem solved by partitioning it into a nonlinear heat conduction problem with a phase change over the entire region. The enthalpy method establishes a unified control equation for the entire computational region (solid-phase zone, liquid-phase zone, and solid-liquid phase change interface). The heat conduction equation with phase change is solved numerically in the discrete calculation region utilizing the lattice Boltzmann method. The temperature field and the solid-liquid phase change interface’s position are derived as a time function based on the relationship between enthalpy and temperature. The calculation method validity is verified by combining the Neumann solution of the semi-infinite space solid-liquid phase change heat conduction problem. Finally, trends of temperature field evolution and freezing front movement in the soil under unilateral and bilateral cold sources are discussed using an example from an artificial freezing project.
2 Materials and methods
2.1 Physical model of soil freezing
In order to study the temperature field evolution in the soil during freezing and the movement trend of the freezing front, a schematic diagram of the freezing model for the soil’s solid-liquid phase in a semi-infinite region is established (Figure 1), where the X-axis direction represents the soil’s freezing direction;
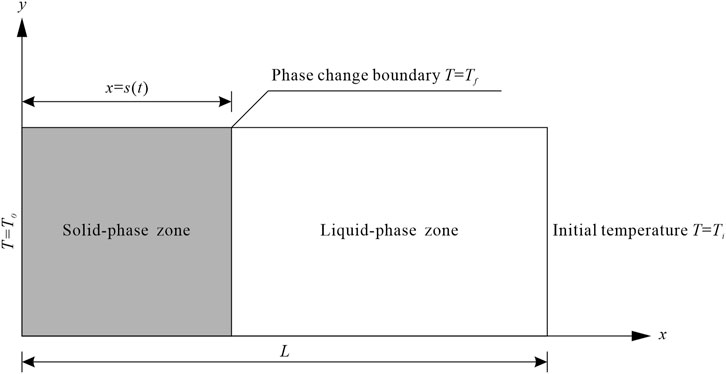
FIGURE 1. Schematic diagram of the soil’s solid-liquid phase freezing model in a semi-infinite region.
2.1.1 Basic assumptions
In order to numerically solve the heat conduction equation while considering the phase change, the following basic assumptions were made: 1) The soil was considered a homogeneous isotropic continuous medium, which was divided into solid and liquid phase zones according to the physical state of the internal moisture. The thermophysical parameters of each phase zone were fixed at constant values and were made independent of the temperature; 2) The effects of moisture migration, soil frost heaving, and stress field change were ignored. Whereas the heat conduction effect during the freezing process was only considered; 3) The heat conduction and the movement of the phase change interface during the soil’s freezing process are along a single direction; 4) The effect of the solid-liquid phase change interface’s thickness in the soil body is not considered; 5) The soil’s freezing temperature is constant. Besides, the freezing process was completed instantaneously, ignoring its physical evolution process.
2.1.2 Mathematical equations
The mathematical equation for the temperature field evolution can be simplified according to the temperature-induced change in the physical state of water in the soil, which is divided into the solid-phase zone and liquid-phase zones (Ozisik, 1993) as follows:
Solid-phase zone:
Liquid-phase zone:
where
2.1.3 The enthalpy method model
In order to study the movement process for the phase change interface during soil freezing, the enthalpy parameter was introduced into the heat conduction equation according to the enthalpy model proposed by Shamsundar and Sparrow (Shamsundar and Sparrow, 1975) as follows:
where
where
Substituting Eq. 4 into Eq. 5 yields the following:
Comparing Eq. 5 to the heat conduction in Eqs. 1, 2, it can be seen that Eq. 5 adds a source term related to the latent heat of the phase change
When the soil’s freezing temperature is a constant value
2.1.4 Boundary conditions
The temperature of the soil’s cold source can be defined as follows:
The soil body has a constant initial temperature that is defined as follows:
At the solid-liquid phase change interface
2.1.5 Dimensionless processing
In order to simplify the calculation, the soil’s heat conduction equation and the corresponding boundary conditions are normalized as follows:
where
Substituting Eq. 11 into Eqs. 1, 2 yields the following:
Solid-phase zone:
Liquid-phase zone:
The corresponding boundary condition transformations are cold source temperature
The following equations are valid at the solid-liquid phase change interface
where
2.2 Lattice Boltzmann model based on the enthalpy method
2.2.1 Lattice Boltzmann model
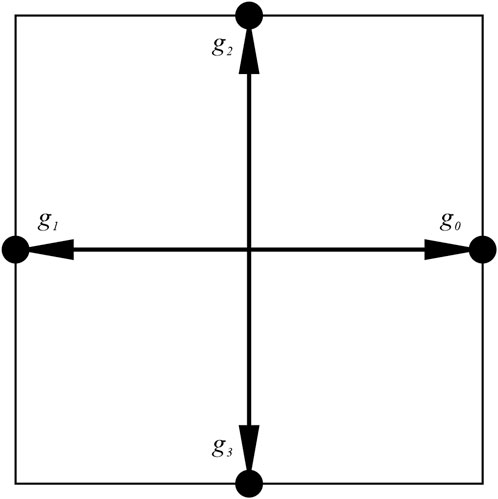
In this study, the temperature in the macroscopic heat conduction equation is taken as a scalar, and the D2Q4 model proposed by Qian et al. (Qian et al., 1992) is used for the soil’s temperature field evolution process during freezing (Figure 2). The time evolution of the particle temperature distribution function
where
where
where
The discrete source term
where
Substituting Eqs. 18, 19, and 20 into Eq. 16, the final discrete lattice Boltzmann equation for the freezing process of the soil is obtained as follows:
In this study, Eq. 21 was implemented in two steps for the convenience of the programming calculations. These steps are as follows:
(1) Collision
(2) Migration
Based on the Chapman-Enskog multiscale expansion method, the lattice Boltzmann Eq. 21 can be reduced to Eq. 5 that contains the phase change by considering the relationship between the macroscopic temperature
where
Since the soil’s thermal diffusion coefficients in the liquid and solid phase zones during freezing soil differ, the relaxation times also vary. In this paper, the variation of the variable relaxation time with the liquid-phase fraction was considered and set according to the thermal diffusion coefficients of different phases as follows:
The soil’s thermal diffusion coefficient is found according to the percentage of the liquid phase fraction among different phases. Consequently, a unified equation can solve the thermal diffusion coefficient of different phases according to the changes in liquid phase fraction. During the numerical calculation, the relaxation time is obtained from Eq. 25, which is then brought into Eq. 16 for the evolution of the temperature field.
2.2.2 Boundary conditions
Accurate simulation of the boundary conditions is an important part of the numerical calculation that significantly influences accuracy, efficiency, and stability. The following determines the corresponding particle temperature distribution functions according to the macroscopic boundary conditions:
(1) Initial conditions
Assuming that the temperature of the soil body at the initial moment is constant
(2) Boundary conditions
The non-equilibrium state extrapolation format proposed by Guo et al. (Guo et al., 2002) was used to handle the seepage field boundary of the soil. For the temperature field boundary, there is no essential difference between the two in terms of application (Yong et al., 2009; Gao et al., 2014). This method produces the distribution function with overall second-order accuracy. The basic idea is that the particle temperature distribution function
For the equilibrium part
2.2.3 Unit conversions
The program’s parameters are typically taken in lattice units during the numerical calculation of the lattice Boltzmann method. In contrast, physical problems are usually taken in physical units. Hence, a conversion relationship between physical and lattice units must be established. For this purpose, all physical and lattice units involved in the calculation must be dimensionless separately to ensure that the heat conduction criterion before and after dimensionless processing remains the same. Accordingly, a dimensionless parameter was used as a connection bridge to realize the unit conversion between the physical and lattice units.
Based on the dimensionless time, the relationship between the physical time t and the lattice time step can be established as follows:
where
If
The correspondence between the physical unit phase change parameters (latent heat of phase change
where
2.2.4 Flow chart of the calculation procedure
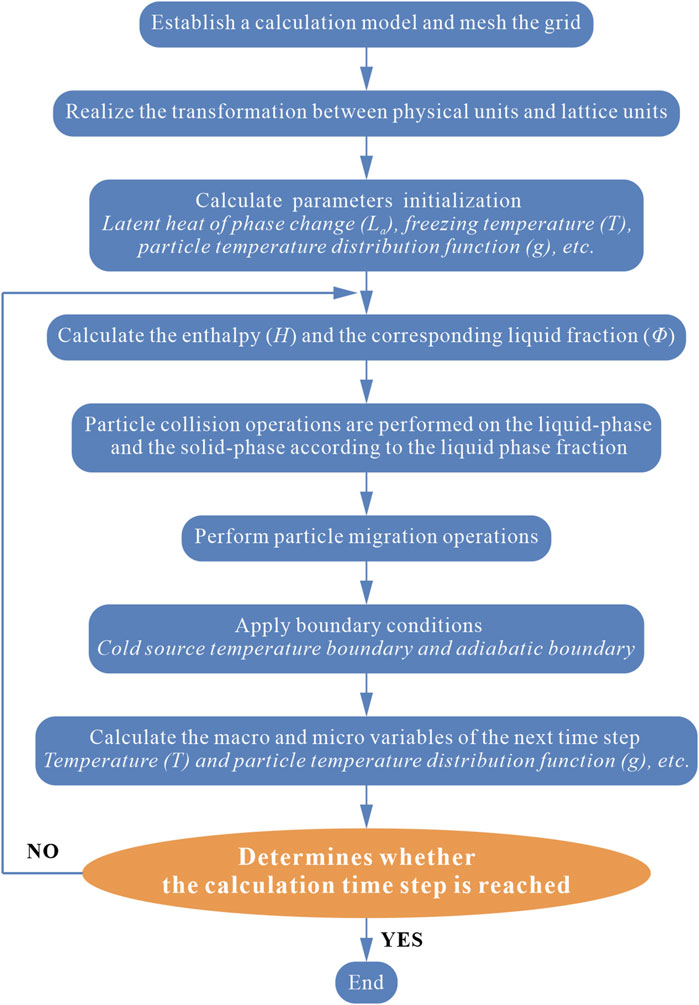
In this study, a lattice Boltzmann model based on the enthalpy method is established, and the corresponding calculation procedure is prepared by considering the effects of heat conduction, latent heat release from solid-liquid phase change, and phase change interface movement in the soil’s freezing process. The adopted flowchart is shown in Figure 3.
3 Results
3.1 Algorithm validation
In order to verify the accuracy and rationality of this numerical calculation method, the Neumann solution of the unidirectional solid-liquid phase change heat conduction process in a semi-infinite region was solved based on Eqs. 31, 32, 33, and 34 (Ozisik, 1993).
The calculation area was set into a
Figure 4 shows the solid-liquid phase change interface variation with time when
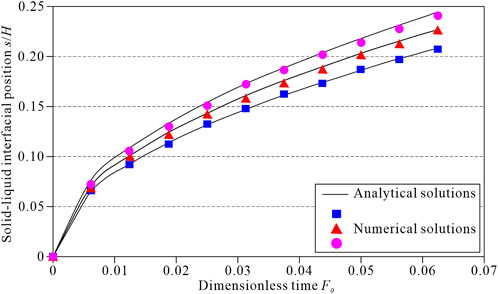
FIGURE 4. Comparison between the numerical and analytical solutions. The top black curve represents
Figure 5 shows a comparison between the numerical calculation results and the analytical solutions for the temperature field at a dimensionless time of
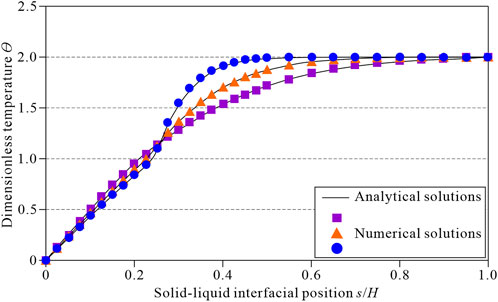
FIGURE 5. Comparison between the numerical and analytical solutions when
3.2 An example of the temperature field evolution
As many researchers have done, all the methods should be verified by examples (Wang et al., 2019; Lei et al., 2022; Wang et al., 2023; Zhao et al., 2023). We have chosen an engineering example in Shanghai to validate the lattice Boltzmann model based on the enthalpy method. The foundation soil of an artificial freezing project in Shanghai is straw-yellow sandy silt. The thermophysical parameters were measured according to the physical property tests of samples in the normal state and the frozen state as follows: the thermal diffusion coefficient of the formation is
3.2.1 Evolution of temperature field in the soil under unilateral cold source
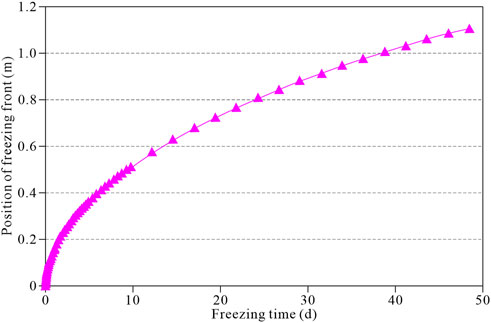
Under a unilateral cold source, the temperature of the soil body decreases rapidly, leading to the freezing front’s formation by condensing internal water into ice. Figure 6 shows the evolution of the freezing front in the soil body with time. The figure shows that at the early stage of freezing, the freezing front in the soil body moves faster, and the evolution rate slows down with time. Besides, the frozen front moved 0.37, 0.52, 0.74, 0.89, and 1.02 m at 5, 10, 20, 30, and 40 days, respectively.
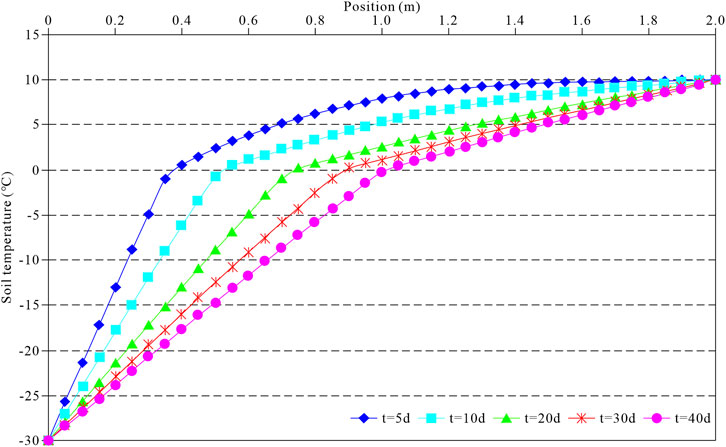
Figure 7 shows the development of the soil’s temperature field under the unilateral cold source. The soil temperature decreases rapidly at the early stage of freezing because the cold source temperature is
3.2.2 Evolution of temperature field in the soil under the action of bilateral cold sources
In artificial freezing works, multiple tubes are usually used to form the soil’s freezing curtain. Therefore, the interaction between two or more cold sources must be studied. For this purpose, the temperature of the cold source was applied on both sides of the soil within 2.0 m width to study the variation of the temperature field in the soil. Figure 8 shows the trend in the variation of the liquid-phase fraction in the soil for 5, 10, 20, and 30 days. It can be seen that the position of the freezing front moves 0.37, 0.54, 0.78, and 0.98 m under the action of the bilateral cold sources for the time periods of 5, 10, 20, and 30 days. Compared to the unilateral cold source, the freezing front’s movement has moved faster with time.
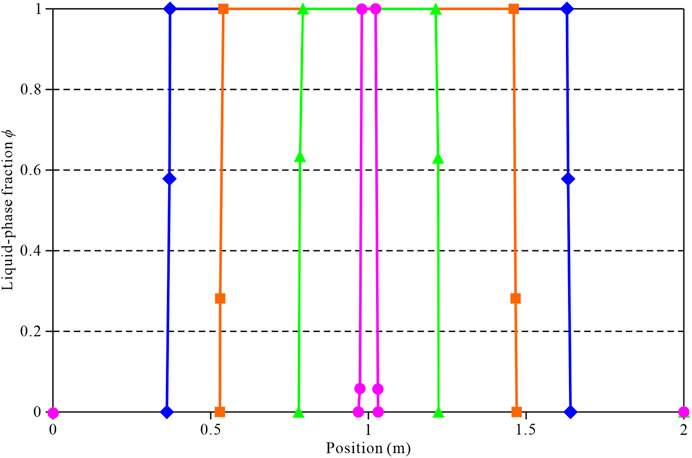
FIGURE 8. Distribution of the liquid-phase fraction
Figure 9 shows that due to the bilateral cold sources, the temperature in the soil gradually decreases from both sides to the middle. The overall temperature in the soil drops below
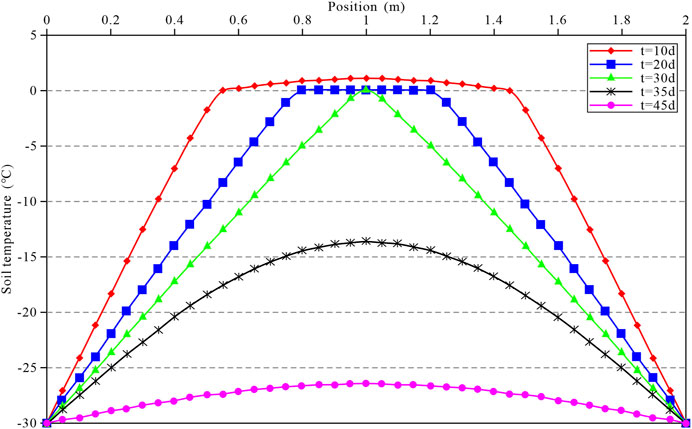
FIGURE 9. Variation in the soil temperature field when time
4 Conclusion and discussion
This study considers the effects of heat conduction, heat release from solid-liquid phase change, phase change interface movement, and heat diffusion coefficient changes during soil freezing to establish a unified evolution equation in the entire calculation region (solid-phase zone, liquid-phase zone, and phase change interface) using the enthalpy method. It numerically solves the D2Q4 model based on the lattice Boltzmann method for the heat conduction equation accompanied by the phase change. Combined with an engineering example of an artificial freezing method in Shanghai, the temperature field in the soil, the development trend of the freezing front with time, and the formation time of the freezing wall under the influence of unilateral and bilateral cold sources (considering the interaction between the cold sources) are determined, and the following conclusions are drawn:
(1) The numerical calculation results are analysed based on the lattice Boltzmann method and compared to the Neumann solution of the solid-liquid phase change heat conduction problem in semi-infinite space, which verifies the accuracy of the present numerical calculation method.
(2) According to the code (DG/T J08-902, 2016), when
(3) Compared to the unilateral cold source, the freezing front’s movement moves faster under the bilateral cold sources. The position of the freezing front moves 0.37, 0.54, 0.78, and 0.98 m for the time periods of 5, 10, 20, and 30 days. The overall temperature in the soil drops below
(4) The lattice Boltzmann model based on the enthalpy method established in this paper can be used to deal with the heat conduction problem accompanied by phase change in underground engineering. However, the effect of moisture migration during the freezing process of soil and the resulting freezing deformation are not considered. The next step is to study the coupled heat transfer mechanism between the moisture field and soil particles using the double distribution function. Besides, a numerical model for simulating the freezing process of soil at the pore scale needs to be established by considering the freezing phase change of the moisture field and the influence of moisture migration heat conduction.
Data availability statement
The original contributions presented in the study are included in the article/Supplementary Material, further inquiries can be directed to the corresponding author.
Author contributions
LT, and LS contributed to conception and methodology of the study. JL organized the database. ZW performed the statistical analysis. LT and LS wrote the first draft of the manuscript. LT, LS, ZW, and JL wrote sections of the manuscript. All authors contributed to the article and approved the submitted version.
Funding
This work was supported by the National Natural Science Foundation of China (Grant Numbers 11962008, 42167022, and 42067043).
Acknowledgments
The authors thank Chao Yang and Qiming Zhou for their invaluable assistance in plotting figures.
Conflict of interest
Author JL was employed by Power China Kunming Engineering Corporation Limited, Kunming, China.
The remaining authors declare that the research was conducted in the absence of any commercial or financial relationships that could be construed as a potential conflict of interest.
Publisher’s note
All claims expressed in this article are solely those of the authors and do not necessarily represent those of their affiliated organizations, or those of the publisher, the editors and the reviewers. Any product that may be evaluated in this article, or claim that may be made by its manufacturer, is not guaranteed or endorsed by the publisher.
References
Alva, L. H., González, J. E., and Dukhan, N. (2006). Initial analysis of PCM integrated solar collectors. J. Sol. Energy Eng. 128, 173–177. doi:10.1115/1.2188532
Costa, M., Buddhi, D., and Oliva, A. (1998). Numerical simulation of a latent heat thermal energy storage system with enhanced heat conduction. Energy Convers. manage. 39, 319–330. doi:10.1016/S0196-8904(96)00193-8
DG/T J08 902 (2016). Technical code for crosspassage freezing method. Shanghai, China: Shanghai Municipal Commission of Housing and Urban-Rural Development.
Eshraghi, M., and Felicelli, S. D. (2012). An implicit lattice Boltzmann model for heat conduction with phase change. Int. J. Heat. Mass Transf. 55, 2420–2428. doi:10.1016/j.ijheatmasstransfer.2012.01.018
Gao, D. Y., Chen, Z. Q., and Chen, L. H. (2014). A thermal lattice Boltzmann model for natural convection in porous media under local thermal non-equilibrium conditions. Int. J. Heat. Mass Transf. 70, 979–989. doi:10.1016/j.ijheatmasstransfer.2013.11.050
Gao, D. Y. (2001). Study on solid-liquid phase change heat transfer in metal foams based on lattice Boltzmann method. Doctor Thesis. Nanjing: Southeast University.
Guo, Z. L., Zheng, C. G., and Shi, B. C. (2002). Non-equilibrium extrapolation method for velocity and pressure boundary conditions in the lattice Boltzmann method. Chin. Phys. 11, 366–374. doi:10.1088/1009-1963/11/4/310
Huang, S. L., Aughenbaugh, N. B., and Wu, M. C. (1986). Stability study of CRREL permafrost tunnel. J. Geotech. Eng. 112, 777–790. doi:10.1061/(ASCE)0733-9410(1986)112:8(777)
Jiaung, W. H., Ho, J. R., and Kuo, C. P. (2001). Lattice Boltzmann method for the heat conduction problem with phase change. Numer. Heat. Transf. Part B 39, 167–187. doi:10.1080/10407790150503495
Jing, L., Tsang, C. F., and Stephansson, O. (1995). DECOVALEX—An international co-operative research project on mathematical models of coupled THM processes for safety analysis of radioactive waste repositories. Int. J. Rock Mech. Min. Sci. Geomech. Abstr. 32, 389–398. doi:10.1016/0148-9062(95)00031-B
Lei, Z. D., Wu, B. S., Wu, S. S., Nie, Y. X., Cheng, S. Y., and Zhang, C. (2022). A material point-finite element (MPM-FEM) model for simulating three-dimensional soil-structure interactions with the hybrid contact method. Comput. Geotechnics 152, 105009. doi:10.1016/j.compgeo.2022.105009
Levin, L., Golovatyi, I., Zaitsev, A., Pugin, A., and Seminet, M. (2021). Thermal monitoring of frozen wall thawing after artificial ground freezing: Case study of Petrikov Potash Mine. Tunn. Undergr. Space Technol. 107, 103685. doi:10.1016/j.tust.2020.103685
Miller, W., and Succi, S. (2002). A lattice Boltzmann model for anisotropic crystal growth from melt. J. Stat. Phys. 107, 173–186. doi:10.1023/A:1014510704701
Mohamad, A. A. (2011). Lattice Boltzmann method: Fundamentals and engineering applications with computer codes. London: Springer-Verlag. doi:10.1007/978-0-85729-455-5
Qian, Y. H., D’Humières, D. D., and Lallemand, P. (1992). Lattice BGK models for Navier-Stokes equation. Europhys. Lett. 17, 479–484. doi:10.1209/0295-5075/17/6/001
Rabin, Y., and Korin, E. (1993). An efficient numerical solution for the multidimensional solidification (or melting) problem using a microcomputer. Int. J. Heat. Mass Transf. 36, 673–683. doi:10.1016/0017-9310(93)80043-T
Radoslwa, L., Michaloeski, E., and Zhu, M. (2006). “Freezing and ice growth in frost-susceptible soils,” in Geotechnical symposium in roma, soil stress-strain behavior: Measurement, modeling and analysis (Roma, Italy: Spinger). doi:10.1007/978-1-4020-6146-2_25
Shamsundar, N., and Sparrow, E. M. (1975). Analysis of multidimensional conduction phase change via the enthalpy model. J. Heat. Transf. 97, 333–340. doi:10.1115/1.3450375
Sukop, M. C., and Thorne, D. T. (2006). Lattice Boltzmann Modeling: An introduction for geoscientists and engineers. Berlin: Springer-Verlag. doi:10.1007/978-3-540-27982-2
Van Dorst, A. A. E. (2013). Artificial ground freezing as a construction method for underground spaces in densely built up areas. Master thesis. Delft: Delft University of Technology.
Voller, V. R., Swaminathan, C. R., and Thomas, B. G. (1990). Fixed grid techniques for phase change problems: A review. Int. J. Numer. Meth. Engng. 30, 875–898. doi:10.1002/nme.1620300419
Wang, G. J., Tian, S., Hu, B., Xu, Z. F., Chen, J., and Kong, X. Y. (2019). Evolution pattern of tailings flow from dam failure and the buffering effect of debris blocking dams. Water 11, 2388. doi:10.3390/w11112388
Wang, G. J., Zhao, B., Wu, B. S., Zhang, C., and Liu, W. L. (2023). Intelligent prediction of slope stability based on visual exploratory data analysis of 77 in situ cases. Int. J. Min. Sci. Technol. 33, 47–59. doi:10.1016/j.ijmst.2022.07.002
Yong, Y. M., Yang, C., and Mao, Z. S. (2009). Numerical simulation of thermal convection in triangular enclosure using lattice Boltzmann method. Chin. J. Process Eng. 9, 841–847. doi:10.3321/j.issn:1009-606X.2009.05.002
Keywords: lattice Boltzmann method, enthalpy method, temperature field, freezing soil, numerical simulation
Citation: Tian L, Shen L, Wang Z and Luo J (2023) Numerical calculation of phase change heat conduction in freezing soil by lattice Boltzmann method based on enthalpy method. Front. Earth Sci. 11:1236829. doi: 10.3389/feart.2023.1236829
Received: 08 June 2023; Accepted: 27 June 2023;
Published: 07 July 2023.
Edited by:
Wenzhuo Cao, Imperial College London, United KingdomReviewed by:
Zhitang Lu, Hefei University of Technology, ChinaHaoran Zhang, China Earthquake Administration, China
Copyright © 2023 Tian, Shen, Wang and Luo. This is an open-access article distributed under the terms of the Creative Commons Attribution License (CC BY). The use, distribution or reproduction in other forums is permitted, provided the original author(s) and the copyright owner(s) are credited and that the original publication in this journal is cited, in accordance with accepted academic practice. No use, distribution or reproduction is permitted which does not comply with these terms.
*Correspondence: Linfang Shen, c2hlbmxpbmZhbmdAa3VzdC5lZHUuY24=
 Lin Tian
 Linfang Shen1*