 Léo Aimar1,2*
 Emanuelle Frery1*
 Julian Strand1Charles Heath1Shahbaz Khan1
 Isabelle Moretti2,3Cindy Ong1
- 1CSIRO Energy, Perth, WA, Australia
- 2ISTeP, Sorbonne Université, Paris, France
- 3LFCR-UPPA, Pau, France
Natural hydrogen exploration is picking up around the world while the geogenic hydrogen system is still a Frontier science. Natural hydrogen seepage can occur in the form of a sub-circular surface feature named by some authors “fairy circles.” Numerous hydrogen seep-alike surface features are visible from the sky in Australia but can be difficult to distinguish from the many salt lakes. In this study, we combined literature review, remote sensing, field and lab measurements (soil gas sampling, X-Ray diffraction, salinity) to uncover a potential hydrogen system and its differences with the salt lakes in the Grass Patch area in Western Australia. The local geology shows a good potential to generate hydrogen. Study of the surface geology and Digital Elevation Model showed that salt lakes are static old features influenced by the soil composition and long-term climatic trend whereas potential hydrogen seeps have recently appeared. This study soil-gas sampling method includes a monitoring procedure compatible with time series measurements via a portable gas analyser, getting rid of artificially produced hydrogen. Low hydrogen values (<30 ppm) have been measured. Those measurements are lower than measurements published along potential hydrogen seeps in Australia. Vegetation indexes are also less constructed than explored fairy circles in Namibia. Salinity and mineralogical results did not indicate any trend with the hydrogen but are coherent with what is found in salt lakes. A microbial system could be the source of the hydrogen but would also be linked to the soil behaviour, climatic parameters, and agricultural practices. This study underlines the need to monitor surface features over few weeks to better understand the evolution of the gas mix seeping above a structure and determine if the periodicity and variability of the leakage can be correlated with bacterial activity or a geogenic hydrogen source.
1 Introduction
Phasing out oil and gas-based energy is a necessity to avoid severe effects of climate change in our future. In this landscape, hydrogen appears as a very promising candidate to be a part of the energy mix. However, as of today, it is mainly produced using other energy sources such as coal and hydrocarbons, defeating the purpose of a clean energy. Natural hydrogen seems like part of the solution as a green fuel, even if today hydrogen is mainly a raw material for the industry. Its exploration has started in several countries such as Brazil (Prinzhofer et al., 2019; Moretti et al., 2021a), Australia (Frery et al., 2021), United States (Zgonnik et al., 2015) or Namibia (Moretti et al., 2022), with the first natural hydrogen energy plant working in Mali (Prinzhofer et al., 2018). However, its exploration is still in its infancy and there is much to learn and understand. One of the main natural hydrogen generation processes come from the oxidation and reduction of iron contained in ferrous minerals, such as the serpentinization of the oceanic lithosphere or the alteration of Banded Iron Formation (BIF) (Geymond et al., 2022; Moretti et al., 2022).
The Australian landscape is riddled with sub circular features resembling hydrogen seeping structures known as fairy circles (Moretti et al., 2021b), historically only being thought as salt lakes (Jutson, 1917; Deckker, 1983; Boggs et al., 2006). In the current state of knowledge, a workflow to unravel the characteristic features of salt lakes and hydrogen seeps could be the key to reach the next step in the natural hydrogen exploration rush.
The goal of this study is to associate remote sensing, soil-gas sampling in the field and lab measurements of salinity levels and mineralogical composition to identify key differences between hydrogen and non-hydrogen related features.
2 Geological context
The Grass patch area is located on the South-East margin of the Yilgarn Craton, in the Albany-Fraser orogen (Figure 1A). The Biranup zone metagranitic unit is covered by post Miocene calcareous, silty and sandy eolian deposit (Myers, 1995). A few kilometres south of the area, a possible extension of the Fraser zone made of Mesoproterozoic mafic-ultramafic intrusions and Paleoproterozoic granites and orthogneisses from the Binarup zone is outcropping (State of Western Australia, 2021). Several pre-Carboniferous shear zones are also found within the area. Exploration for lignite has been done in the study zone, with an estimated 1.04 Gt of reserves, but the deposit has not been exploited as of today (Simons, 2019).
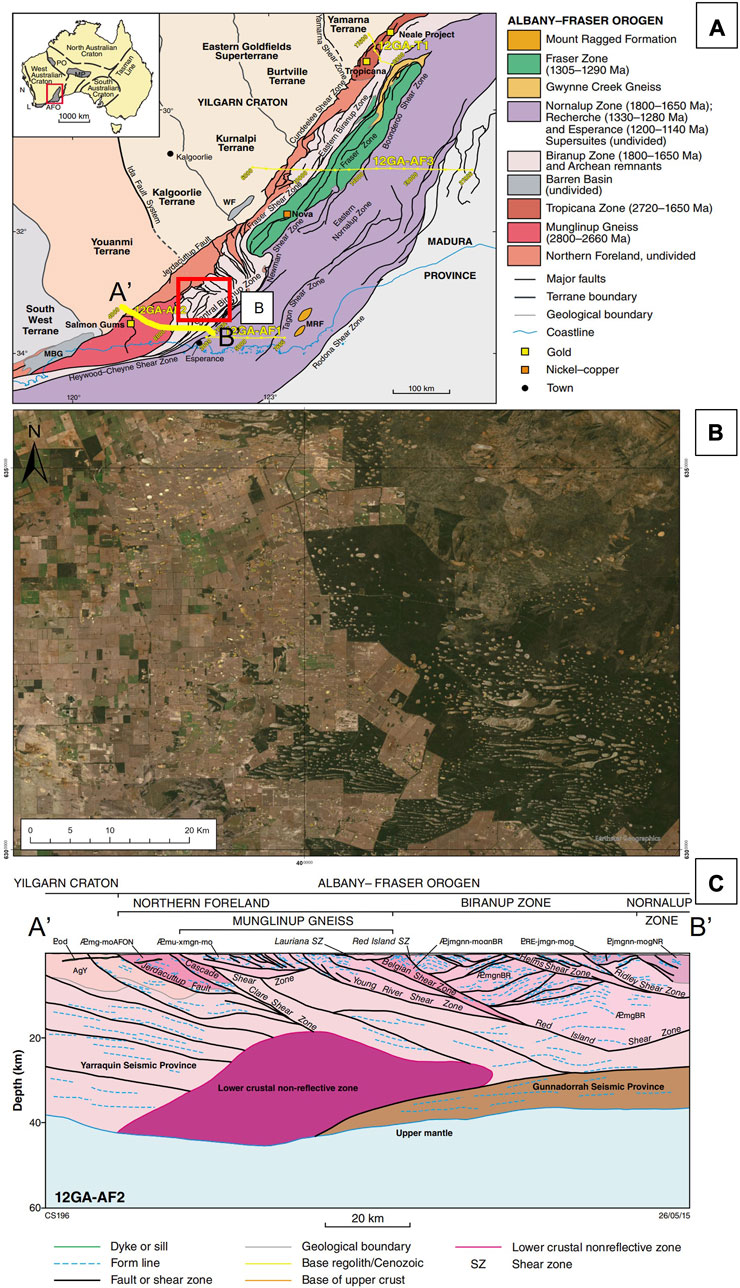
FIGURE 1. Localisation of the studied area at the south-eastern margin of the Yilgarn craton, Western Australia. (A) Geological map of south-eastern part of Western Australia, the red square indicates the studied area (B) Satellite imagery of the studied area (C) Interpreted seismic line south of the studied area (Modified from Spaggiari et al., 2014, satellite imagery from Earthstar Geographics).
One of the main geomorphic features found in the area are salt lakes (Figure 1B). These have been studied for more than a century all across Australia (Jutson, 1917; Bettenay, 1962; Degens et al., 2008), and their formation mechanism remains unclear up to today. Being in a semi-arid and geologically stable environment, these salt lakes would be old features, mainly originating from sub aerial erosion and taking place in paleochannels (Bettenay, 1962; Deckker, 1983; Salama et al., 1993) and affected by climatic conditions (Boggs et al., 2006).
Although there is a lot of these salt lakes/subcircular depression across Australia, their geometry can be very different from the hydrogen related seepages found in Russia (Larin et al., 2015), Brazil (Prinzhofer et al., 2019) and Namibia (Moretti et al., 2022). Trying to understand their geomorphological influencing factor becomes one of the key points to differentiate them. Looking at their time evolution via satellite imagery and maps can help answer the question and estimate a potential anthropological impact via agricultural activities.
3 Materials and methods
3.1 Desktop study including remote sensing
To select the seemingly most appropriate candidates for soil-gas measurements (Figure 2), a desktop study was carried out to analyse satellite images (i.e., Google Earth®), Digital Elevation Models (Figure 3), digital geological maps, and multi spectral data such as vegetation indexes (Figure 4) (Moretti et al., 2022) and distribution of surface salinity. The shape, size and distribution patterns of the sub-circular to circular surface features were investigated to select the study zone. The presence of nearby mafic rocks was also considered as a potential hydrogen generation kitchen (Boreham et al., 2021) and shear zones, as pathways for fluids and gases via the fault system (Frery et al., 2015).
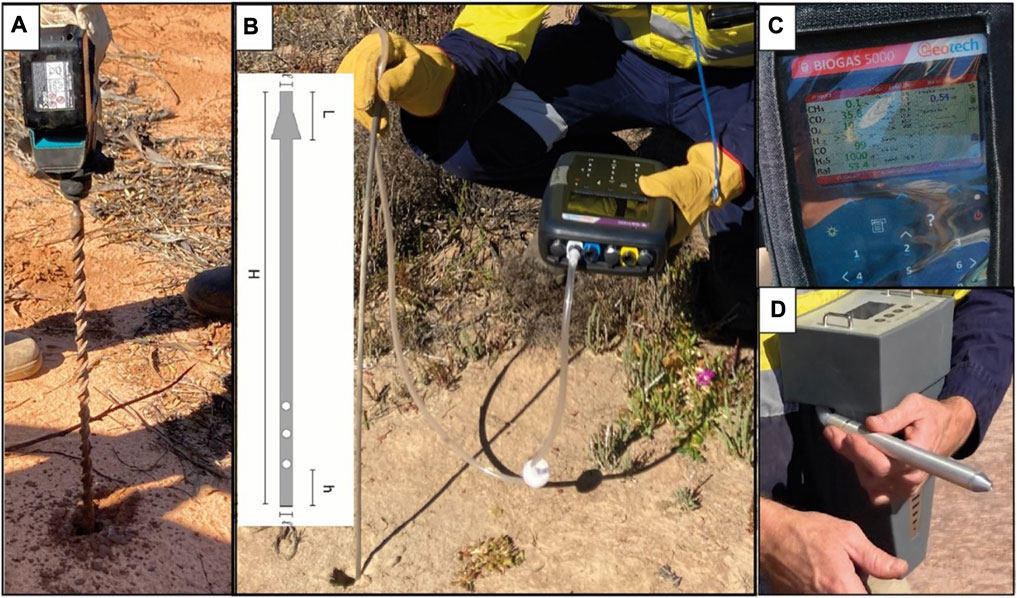
FIGURE 2. Instantaneous measurement instrumentation. (A) Hammer drill, (B) BioGas 5,000 coupled with a stainless-steel tube. (C) GA multi-gas analyser instantaneous readings, CH4, CO2, O2 in %, H2, H2S, and CO in ppm, (D) PHD-4 Portable Helium detector, detection at ppm level (Modified from Pasquet, G., 2022, Evolution des gaz associés à l'ouverture des rifts, hydrogène naturel et autres. Cas du rift est-africain, (PhD thesis), licensed under CC BY-SA 4.0).
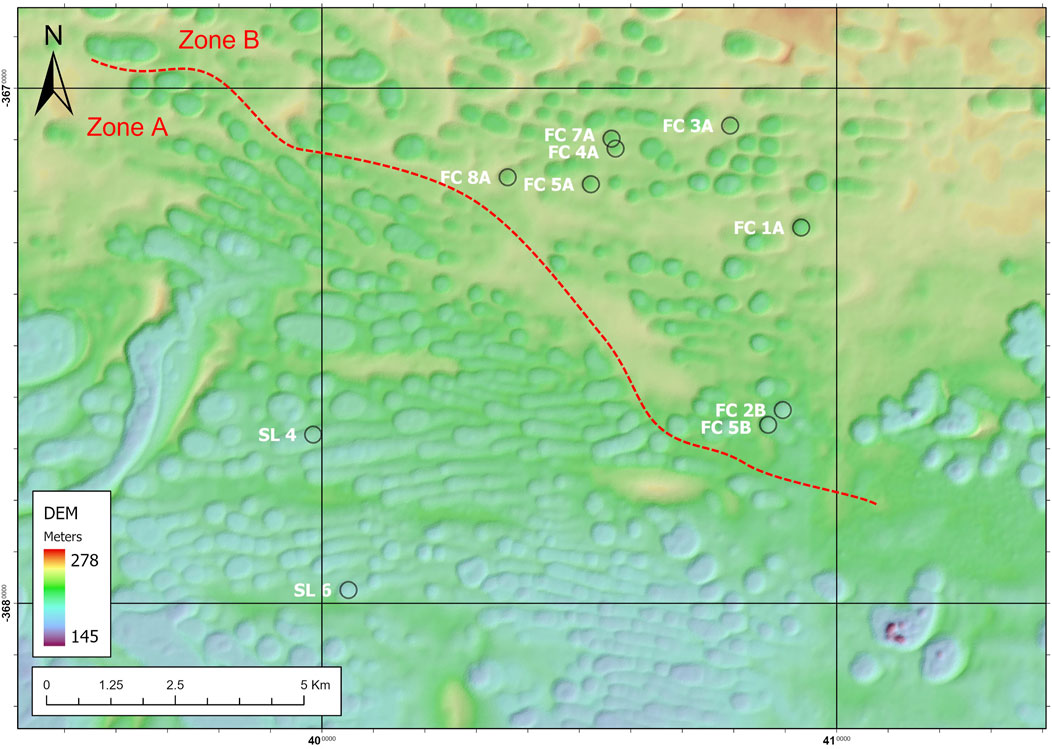
FIGURE 3. DEM of the study area. The circles indicate the location of the sampled structures. Two zones with different structure topographical alignment can be observed (Data from Caccetta et al., 2022).
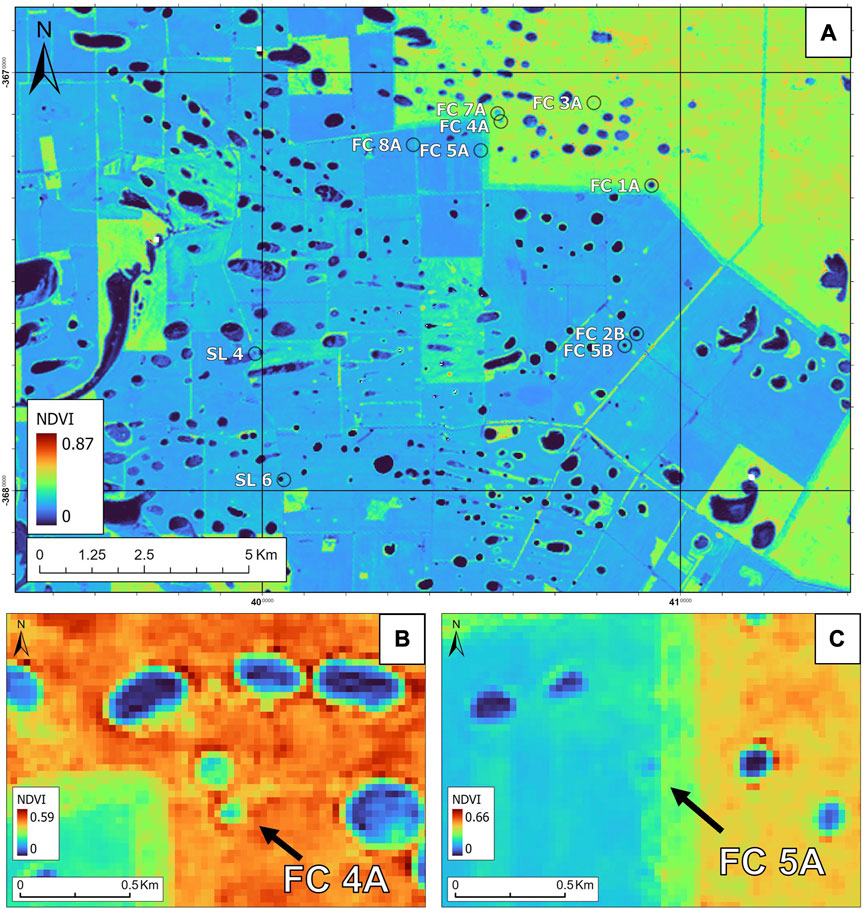
FIGURE 4. NDVI index in the studied area (A) at the scale of the whole area (B) with a smaller scale centred on the monitored structure FC 4A (C) with a smaller scale centred on the monitored structure FC 5A.
A Digital Elevation Model (DEM) has been used for the topography of the study area, provided by Caccetta et al., 2022, derived from 2017 Landgate digital photogrammetry. Its resolution is 10 m. The data has been computed using the ArcGIS Pro software.
This data has been used in conjunction with Landsat images. They are the HLS Landsat Operational Land Imager Surface Reflectance v2.0 acquired by LANDSAT 8 with the Operational Land Imager (OLI) sensor in late 2022. They all include atmospheric correction cloud and cloud-shadow masking, spatial co-registration and common gridding, illumination and view angle normalization, and spectral band-pass adjustment. They are homogenized at a spatial resolution of 30 m. The surface reflectance bands used are as follows.
- Band 4–Red–630–680 nm–30 m resolution
- Band 5–Near Infrared–845–885 nm–30 m resolution
The Landsat data has been used to compute the Normalized Difference Vegetation Index (NDVI). This index uses the Red and NIR band to assess the vegetation and its health. Its values range between −1 and 1, with 0–1 representing more or less active, healthy and dense vegetation. Values below 0 represents bodies of water, vegetation-less areas like building or dead vegetation. It is calculated as follows:
3.2 Field sampling
The soil-gas sampling method was as followed: a hole up to 1 m deep was drilled, a 0.6 cm diameter and 100 cm long stainless tube was then inserted, coupled with a portable multi-gas analyser called BioGAS5000 and a PHD-4 helium detector (Figure 2) to measure methane, carbon dioxide, oxygen concentration at percentile level and hydrogen and helium concentrations at ppm level. Sampling was done in the vicinity of the structures where no to low vegetation were observed compared to the rest of the area. If hydrogen is detected with this method, a monitoring system composed of 2 different types of probes was installed to assess if the hydrogen measured is artificial. The monitoring probes consist of a 2.1 cm diameter and 100 cm long plastic tube and the aforementioned stainless-steel tube. These were made from readily available commercial materials. Both were caped in between measurements as to decrease the ambient air contamination and potentially accumulate any hydrogen.
3.3 Salinity and X-ray diffraction
Salinity analyses were conducted on 4 soil samples, 3 of which were the residues of the 1 m drilled soil column and one being the first 10 cm. The salinity was measured with a TPS WP-81 handheld probe. A 1:1 mixture ratio was prepared with 15 g of soil and 15 mL of deionized water and measured at ambient air temperature (20.8°C) after probe calibration.
X-ray diffraction (XRD) were carried out on the same samples at the CSIRO-ARRC (Australian Resource Research Centre, Perth, Australia). The samples were ground with a mortar and pestle, and 2 g of powder was put into a back loaded sample holder. These analyses were performed using a Bruker D4 Endeavor ASX instrument operating with a Co X-ray tube and Fe filter, as well as a Lynxeye position sensitive detector. The XRD patterns were scanned over 5°–90° 2θ at a step size of 0.02° with a 1° divergence slit. Semi-quantitative analyses were performed on the XRD data using the commercial package SIROQUANT from Sietronics Pty Ltd. The results are normalised to 100%, and hence do not include estimates of unidentified or amorphous minerals.
4 Results
4.1 Remote sensing
A high density of circular to sub-circular surface features ranging from 100 m to 500 m in diameter are visible on the DEM image of the study area (Figure 3). Two main zones can be differentiated in function of the feature shapes, density and alignment. The northwestern to southern parts (zone A) presents a high density of features with about 3 topographic features per square kilometre. A north-south variation of the feature alignment and feature shape is also visible that zone. The features vary from elongated north-northwest aligned depressions to chains of circular features aligned east-west. The north central and eastern parts (Zone B) present a lower density of features, with around 1.5 topographic features per square kilometre, and no clear alignment with the structures being scattered.
The NDVI index map (Figure 4A) highlights that most of the feature’s inner part hover around a value of 0, representative of dead vegetation or body of water. Looking at the outer part of the features, we see that the NDVI index is usually lightly higher than the signal from the surrounding background area. Zooming on the monitored features, namely, FC 4A and FC 5A (Figures 4B, C), the smaller NDVI scale shows the light contrast between the outer part and the surrounding area. About 0.03 for FC 4A and 0.02 for FC 5A.
The selection of the studied features was heavily influenced by the seemingly more sporadic spatial arrangement of the zone A features (Figure 3), potentially hinting at a different formation mechanism.
Most of the sub-circular surface features observed on the current DEM (Figure 3) have been drawn on the historic geological map (Figure 5) highlighting that most of those features have been in place for at least 50 years. The historic geological map is highly detailed with an excellent match between the current alignments trends and feature density observed at present day in zone A (Figure 3). However, half of the sampled features were not drawn on the map. Looking at the pictures available on Google Earth dated to 1985 (Figure 6), in zone B, we observe that the monitored structures (FC 5A and FC 4A) were present, had a smaller footprint and that FC 7A had more or denser vegetation covering its surface (Figure 7). These features are slightly ellipsoidal, a hundred meters in diameter and no more than 5 m in depth with a very gentle slope. This morphology is coherent with already known hydrogen seeping structures (Moretti et al., 2021b).
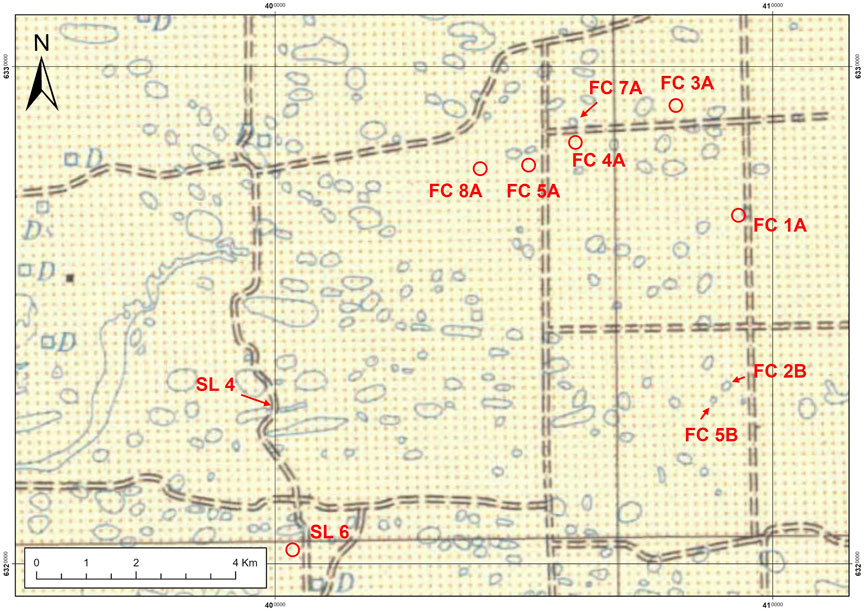
FIGURE 5. Extract of the 1:250,000 Esperance geological map from 1972. The circles indicate features that were sampled but not on the geological map. The monitored features were not present at the time on the map (Geological Survey).
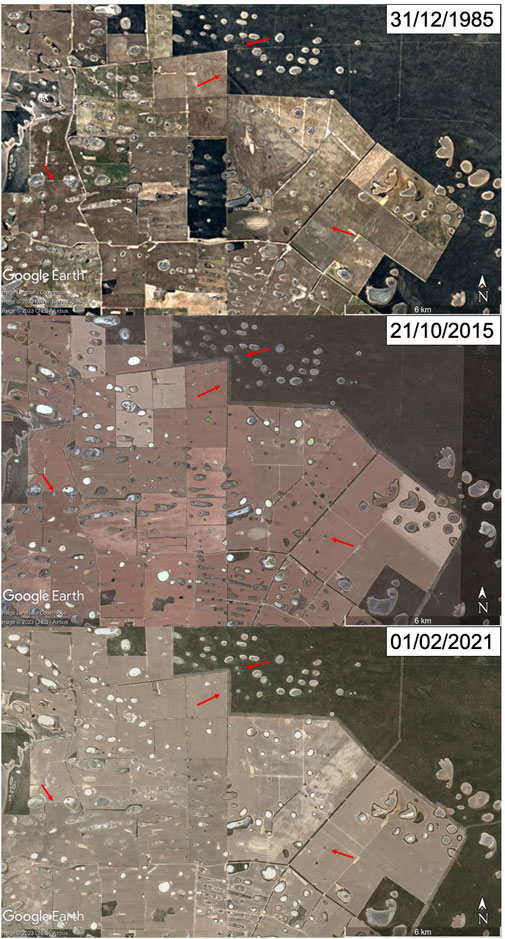
FIGURE 6. Satellite imagery of the studied area over a period of 35 years. Few features evolution can be seen, pointed with the red arrows (Images Google Earth).
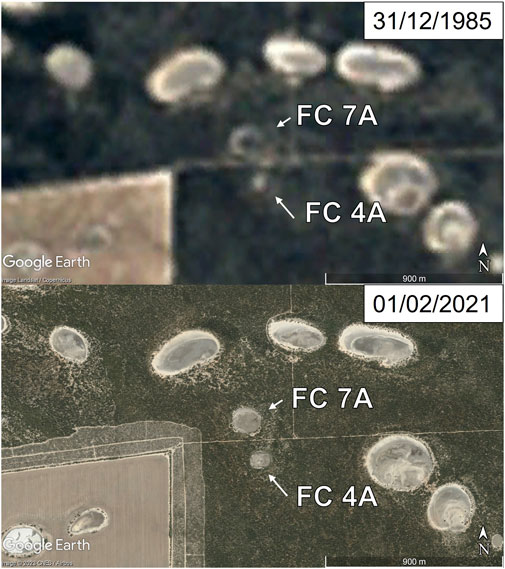
FIGURE 7. Geomorphological evolution over 35 years of 2 sampled structures. The FC 7A feature seems to have been covered by more vegetation in 1985. The FC 4A structure seems to have slightly grown in size (Images Google Earth).
Looking at zone A, the features are usually more elongated and longer in length, with an overall bigger footprint. However, their depth and slope does not significantly differ from the zone A structures.
A total of 11 structures were sampled around the Grass Patch area. More sampling points from previous field work in the same zone were added to the dataset, observable in Figure 8A. Values ranging from 0 to 48 ppm were found across the sector, the highest values around the edge of the nature reserve (Figure 8B). The features with the lowest values were the most elongated ones that were classified from the desktop study as non-hydrogen seeping structures, being “topographically aligned” (Figure 8B). The hydrogen gas values initially increased rapidly, followed by a slow but constant decrease. The other gas measurements, CH4, CO2 and O2 followed a similar trend without any correlation with the hydrogen values. No helium was found at any of the sampled location.
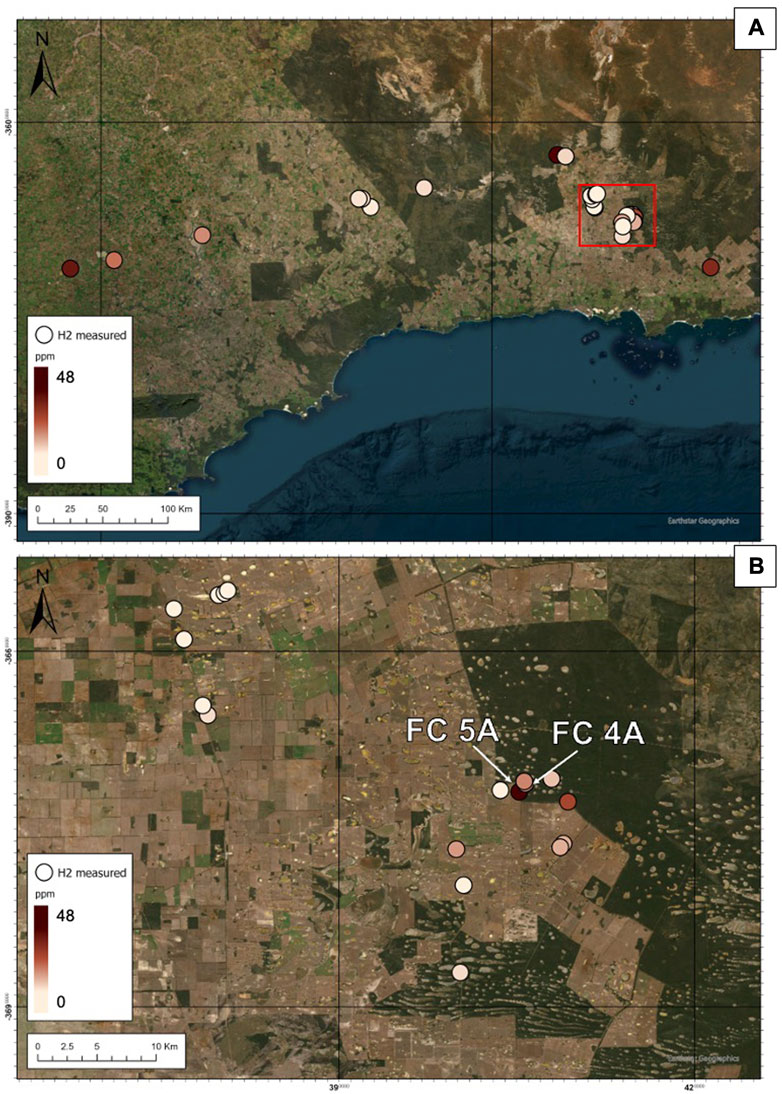
FIGURE 8. (A) Hydrogen measurements from several field missions over southern Western Australia. The red square indicates the studied area in this paper (B) Hydrogen measurements in the studied area. FC 5A and 4A are the monitored features. The measurements in the northern western part are from another field campaign (Images Earthstar Geographics).
4.2 Monitoring
Two structures were chosen for monitoring due to their ease of access and presence of hydrogen during initial sampling. Both structures were monitored over 2 days in the morning. FC 4A showed values of 25 ppm of hydrogen during initial sampling, while FC 5A had consistent values of around 10 ppm. Although FC 1A presented more interesting readings with values around 27 ppm, the ease of access of the 2 previous structures prompted us to choose them. The monitoring wells were installed to simultaneously measure 5 points of the features (Figure 9), as previous papers showed the very uneven distribution of hydrogen output in those fairy circles (Moretti et al., 2021a; Moretti et al., 2022). The wells on the FC 5A structures had to be put in the outer ring due to the presence of very wet and muddy soils in the centre, which were flooding the tubes.
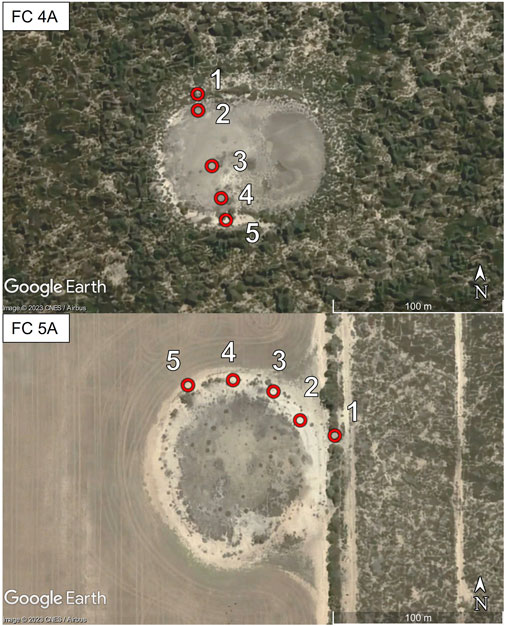
FIGURE 9. Location of the wells on the monitored features (Google Earth images).
During the first day of monitoring one well (n° 5) of FC 5A showed interesting values, reading 48 ppm during the first measurement of the plastic tube. Together with its associated stainless-steel tube, values over 10 ppm were observed with a small increase of a few ppm at 12:00 (Figure 10) decreasing afterwards. The rest of the wells read close to 0 ppm, with the exception of the steel tube n° 2 having a 20 ppm reading, going down around 5 ppm for the consecutive measurements. The second day of monitoring for the same structure delivered values that never went above 1 ppm.
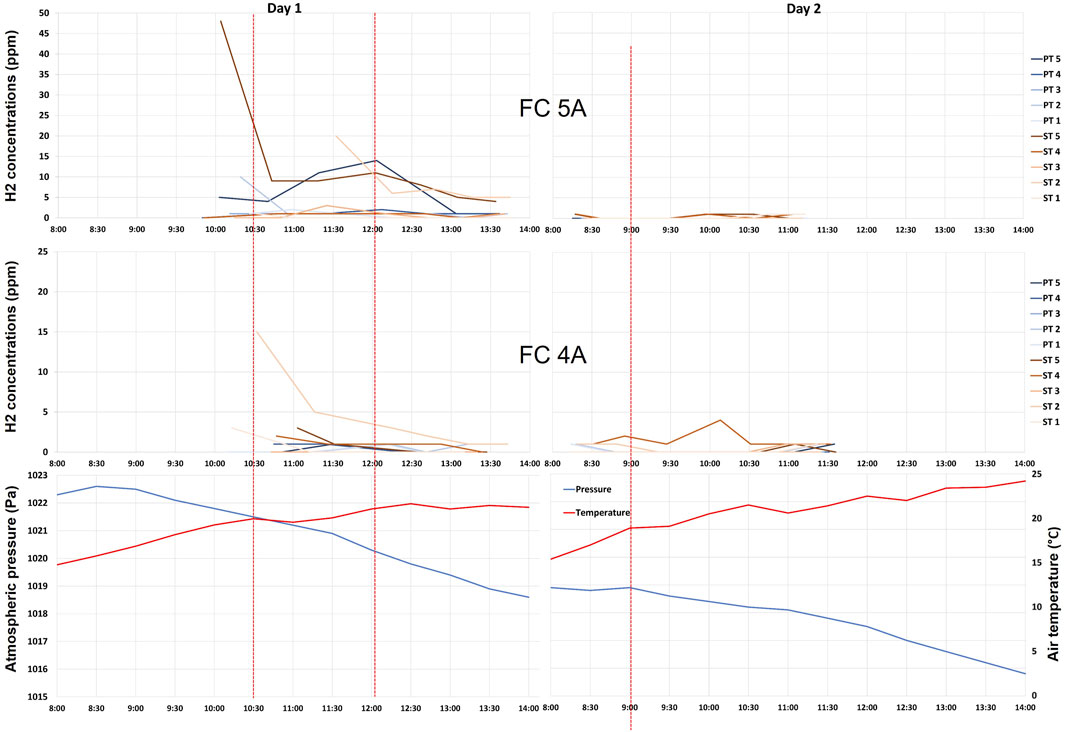
FIGURE 10. Data linked to the observed structures across the 2-day monitoring period, encapsulating information about hydrogen concentrations, ambient temperature, and atmospheric pressure (Temperature and pressure data obtained from the Bureau of Meteorology).
For the FC 4A feature, very low values, under 4 ppm, were measured on day 1 for all wells except for one inox tube (n° 2) which presented a value of 15 ppm on the first measurement and steadily decreased to 1 ppm over 3 h. On the second day, none of the wells presented values above 2 ppm, except for one well that had 4 ppm (Figure 10). The associated values of O2 and CO2 also got to very unusual numbers so this was considered an artefact, as the tube had to be reset in place at the time of the measurement and the values returned to more usual numbers after the reseating of the tube.
4.3 Salinity and X-ray diffraction
On the 4 analysed samples (Figure 11), 3 were a mixture of the sediments from the whole borehole, and one being a very shallow soil. The shallow sample yielded the most salinity which is coherent with the surface salt crust of the structure mixing with the shallow sediments. No clear trend with hydrogen amounts can be deduced from the other samples but we can observe that the monitored structures (FC 4A and 5A), which presented interesting first readings have a higher salinity than the non-monitored feature (FC 1A). They also are the ones which seemed to have a smaller footprint on the 1985 pictures (Figures 6, 7).
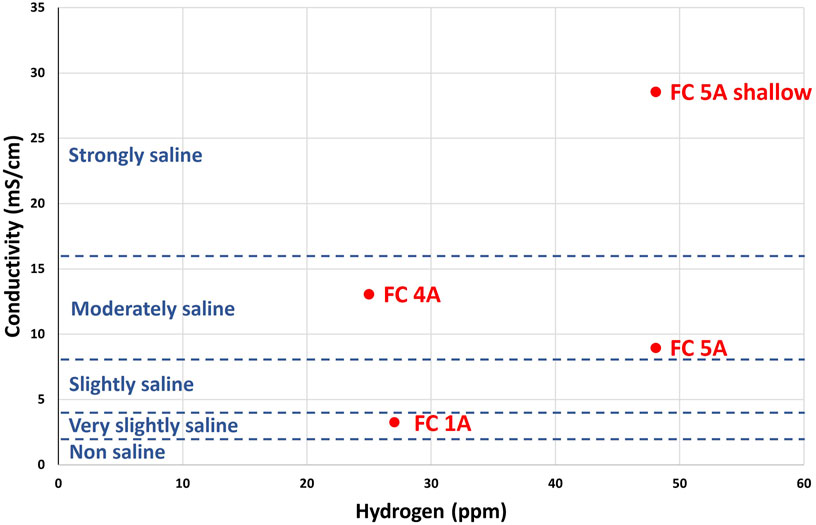
FIGURE 11. Electrical conductivity of the samples compared to the maximum amount of hydrogen measured at the feature. FC 5A shallow represents the sample from the first 10 cm. The saline classification is as defined in the U.S. National Soil Survey Handbook.
XRD results are presented in Supplementary Table S2. All the samples are mainly composed of quartz with the second biggest fraction being illite. The shallow sample at FC 5A presented the biggest quartz component at 84% but the least illite at 5%. It is also the only sample with gypsum (2%) which probably comes from the surface salt crust. Both monitored structures presented different results, with FC 5A having 79% of quartz and 13% of illite, as well as 3% of kaolin while FC 4A had less quartz with 60% but more illite and kaolin with 23% and 13% respectively. FC 1A yielded similar results to FC 5A with 75% of quartz, 15% of illite and 7% of kaolin, but is the only sample with calcite although a very low amount of 2%.
5 Discussion
5.1 Origin of the salt lakes and link with the agriculture
The salt lakes are located on the Yilgarn Craton, in a semi-arid and geologically quite stable environment. These salt lakes are ancient features, many authors consider that they mainly originate from sub aerial erosion and take place in paleochannels (Salama et al., 1993; Deckker 1983; Bettenay 1962; Deckker 1983) states that the biggest lakes are very old features, that this part of the Yilgarn Craton has not been subject to a marine transgression since the Paleogene, while the smaller ones have been morphologically affected in recent times, mostly from the climatic conditions, which are observable in the sedimentary records. For example, the rainfall distribution could impact the morphology of the salt lakes (Boggs et al., 2006).
The mineralogical analyses did not highlight any major difference in composition in the sampled structures, their composition of mainly quartz and clay being similar to salt lakes across Australia (Bettenay, 1962; Salama et al., 1993).
The link between geomorphological evolution of the salt lakes and agriculture has not been deeply investigated, however some changes in lake salinisation has been observed in zones of irrigation, as well as their chemistry and their recharge behaviour due to groundwater extraction (Timms, 2005). Even with simplistically relating intensive agriculture to the increase of salinity, one cannot say intensive agriculture created those old salt lakes, as at most the increase of salinity can slightly change their size. A detailed remote sensing study published by McFarlane et al., 2004 estimated an increase of 0.3% over 8 years in dryland salinity but this does not provide insights on the formation of new circular to sub-circular surface features over that period. Also, salt lakes can decrease in size and increase in salinity (Williams, 2002; Timms, 2005). Aside from farming, the salt origin and distribution in such features would also be explained by the impact of geological structures in relation to the alluvial systems and relict channels, modifying the groundwater flow (Salama et al., 1993).
Comparison of the 1972 geological map (Figure 5) and the 1985 Google Earth images (Figures 6, 7) highlights that some small circular to sub-circular surface features may have recently appeared. The fact that such a detailed geological map did not include 6 of the studied structures could indicate that the features monitored in this study appeared between 1972 and 1985, being less than 50 years old. The timing of their emergence resembles that of a hydrogen seeping structure as observed by Larin et al., 2015. Additionally, those potentially recent features are mostly located in zone B, with sparse and chaotic distribution (Figure 3). Those features could come from the same generation system as the more aligned structures (zone A) but would not have the time to be as geomorphologically affected by surface processes such as wind erosion (Bettenay, 1962; Boggs et al., 2006). This could also explain their smaller size, being given less time to develop.
An open fault system with associated endogenic fluids creating circular to sub-circular surface features could circulate hydrogen as well (Figure 12). In this case, the hydrogen being not soluble with water at shallow depth and with high salt concentration (Lopez-Lazaro et al., 2019), hydrogen could escape further than the salt fluid system around the main fault, and thus create different geomorphological features. However, the origin of the salt in the surface manifestations is poorly understood even though it plays a key role in hydrogen’s behaviour in the fluid system (Lopez-Lazaro et al., 2019). Consequently, the salt observed in the numerous Australian salt lakes could be a by-product of a hydrogen system, adding a new level of complexity to unravel.
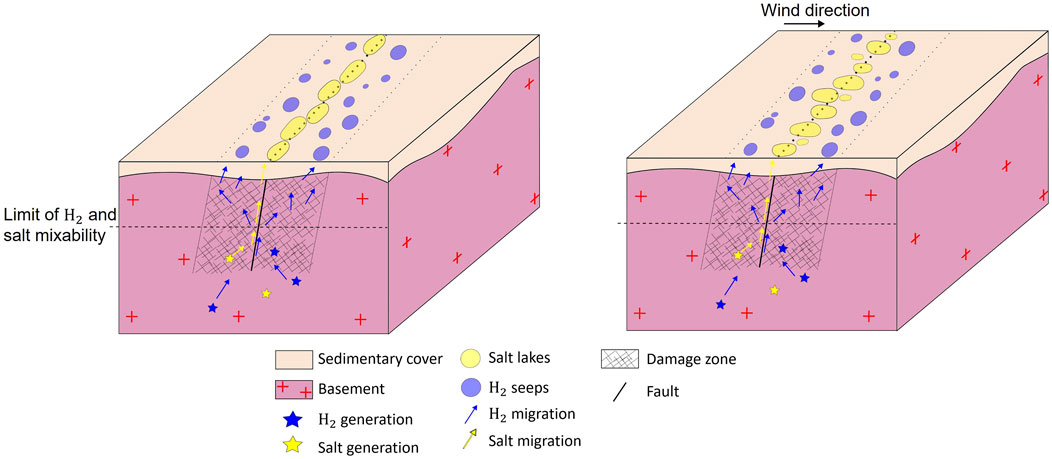
FIGURE 12. Conceptual model of a salt and hydrogen generating and circulating structure where the salt lakes are aligned with faults or with the wind direction. No scale.
The study area (Figure 8B) was defined between farmlands and natural reserves to evaluate the impact of farming on hydrogen seeping structures. We did not observe a significant difference in geomorphology, salinity, and mineralogical composition between farmland and bushy samples. However more hydrogen was found in the field feature which could be linked to farming. Indeed, fertilisers and farming techniques have an impact on the soil chemistry (Liu et al., 2010), behaviour of the gases (Kuncoro et al., 2014; Nakajima and Lal, 2014), and the water table level which is a major control factor on salt distribution in the system (Raper et al., 2014). Farming does not seem to impact new lake formation at the examined time scale (Figure 6) as we observed geomorphological changes to features in both natural and farming areas. All these parameters should be investigated further by sampling more structures combined with hydrogen findings.
5.2 Can we find hydrogen seeps with remote sensing technics in the studied area?
Natural hydrogen seeps were identified in other countries such as Namibia since a high Soil Adjusted Vegetation Index (SAVI) external ring can represent active vegetation (Moretti et al., 2022). The SAVI index is based on the NDVI index but includes a correction factor acting as an image dynamic range enhancer to account for the soil reflectance of a zone with low vegetative cover (Huete, 1988).
To do a quantitative comparison of the 2 areas, NDVI has been recalculated for the Namibian feature SCD 6 (Figure 13A), showing the same tendencies as the SAVI values in Moretti et al., 2022. Although the NDVI index is affected by the soil reflectance in the Namibian area, its use is still pertinent to show a quantitative difference between the 2 areas.
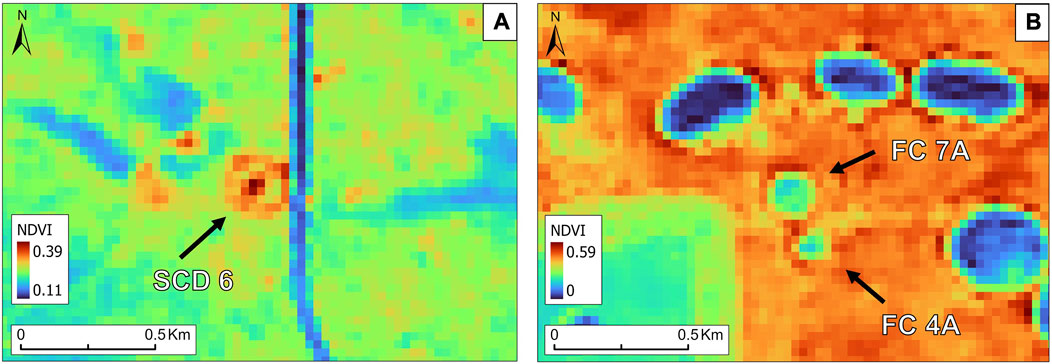
FIGURE 13. Comparison between a Namibian hydrogen seeping structure and the sampled features of this study. We can notice the higher contrast of the Namibian structure (A) NDVI index on SCD 6 in Namibia (B) NDVI Index on FC 4A and FC 7A in Australia.
Indeed, the NDVI value of the FC 4A feature (Figure 13B) does not heavily contrast with its surrounding (the difference between the outer ring and the rest of the area being around 0.03) and does not go all around it, while the FC 5A (Figure 4C) feature only has a light difference with its surrounding (around 0.02 between the crop land and the outer ring). It is however important to note that this feature being in a crop field, the vegetation health could be affected by the farming practices and the status of the crop. Observing the Namibian feature, the difference in NDVI value between the general background and the outer ring of the structure is about 0.06, showing a clear variation between both areas. The high NDVI values in the centre of the feature are explained by a dense cane patch observed in the field (Moretti et al., 2022) and could be due to the alternance of rainy versus dry season in Namibia, as these surface circular depression are underwater part of the year.
Looking at the DEM image (Figure 3), the targeted structures presented quite similar geomorphological features. The main difference being the more sporadic and nonaligned spatial organisation of the structures in zone B (Figure 3) leading us to think that the formation mechanism could be different for both areas.
Overall, the targeted features were not as unusual for the local area as the ones found in Namibia (Figure 13A), Brazil and Russia (Larin et al., 2015; Prinzhofer et al., 2019; Moretti et al., 2022), but presented characteristics worth investigating, as a previous field campaign found lesser amounts of hydrogen in the area.
5.3 Hydrogen source?
As drilling in given types of sediments in presence of water can produce artificial hydrogen via drill bit metamorphism (Halas et al., 2021), monitoring was necessary to rule out its potential impact. The use of both plastic and stainless-steel probes as monitoring wells was to assess potential artefact linked with the choice of material. The results (Figure 10) clearly shows that no artefact was observed in the stainless-steel monitoring probes. Monitoring of hydrogen seeps in Brazil showed that hydrogen flux was not constant throughout the day (Prinzhofer et al., 2019). Choosing the appropriate timing is not possible given the lack of data on all the different system and environments of hydrogen seepages. However, the 24-h basis of hydrogen emissions observed in Brazil (Prinzhofer et al., 2019) hints that the reason of some of the observed variation frequencies could be environmental factors such as atmospheric pressure, temperature, soil moisture content or even peak bacterial activity time. Cathles and Prinzhofer 2020 proposed that the diurnal pressure wave would vent out a shallow gas reservoir above the water table, fed by a deeper hydrogen source. This could potentially explain the higher hydrogen values in the middle of the day.
This study’s low amounts of hydrogen (Figure 10) could potentially origin from microbial production (like photosynthetic or fermentative organisms), as it is a well-known hydrogen producing mechanism (Debabratas and Veziroglu, 2001). However, bacterial activity can also be the source of a decrease in hydrogen concentration in the soil pores (Myagkiy et al., 2020). The same authors showed that in a diffusion dominated transport system, the bacterial activity will control the amplitude of the hydrogen flux. It’s possible to theorize that a bacterial community may form hydrogen pockets that take a long time to recharge. This could account for the hydrogen levels detected during the initial sampling, followed by the subsequent null reading during monitoring.
Looking at possible culprits, some bacteria can utilize the water-gas shift reaction where carbon monoxide and water vapor forms carbon dioxide and hydrogen as follows:
Rhodospirillum rubrum, for example, is a bacterium that can live in a wide variety of conditions such as natural aquatic environments like ponds, lakes or standing water (Reslewic et al., 2005) but can also be found in mud (Madigan et al., 2000) which fits with known hydrogen seeping structures.
Another generation mechanism to consider is soil respiration and its link to hydrogen cycling, these processes being potentially affected by the same external factors. Soil respiration has been defined as an “ecosystem process that releases carbon dioxide from soil via root respiration, microbial decomposition of litter and soil organic matter, and fauna respiration” (Luo and Zhou, 2006).
Soil respiration was correlated with multiple factors such as temperature (Lloyd and Taylor, 1994), moisture content, soil texture and soil pH (Luo and Zhou, 2006). Salinity is also a potential factor in controlling soil respiration (Mavi and Marschner, 2017). All these mechanisms can interact together, adding difficulty to understand their effect on both soil respiration and the microbial hydrogen system. Simulations showed that the changes in atmospheric pressure can induce “fresh” air intrusion into the vadose zone, and thus changing the gas fluxes (Massmann and Farrier, 1992). One can think that these intrusions could disturb the gas content of the soil especially for low amounts of hydrogen in the very top part of the vadose zone, as in this study.
Without microbial analysis, it is impossible to conclude if the hydrogen found was of biologic origin. It is however interesting to note that abiotic or biogenic methane is often found in natural hydrogen seeps and can be linked with the transformation of hydrogen (Etiope et al., 2011) and low amounts of methane were sometimes found with hydrogen in this study.
The NDVI index combined with the low and inconsistent gas measurements do not allow to draw a definitive conclusion, but points towards the features not being traditional hydrogen-seeping structures.
6 Conclusion
All salt lakes are not hydrogen seeps and hydrogen seeps are not inevitably salt lakes. Salt lakes in Western Australia are old features, and intensive farming is not responsible for the entire salt system associated with those lakes. This study is a first stone in the understanding of the link between the salt and the hydrogen systems. Conclusive remarks from this study include.
• Although presenting similar geomorphological features, the signal of the vegetation index and the low amounts of hydrogen found in this study show a different pattern than the hydrogen seeps identified in Namibia (Moretti et al., 2022).
• Intensive agriculture increases the propagation of dryland salinity and salt lakes, however formation of new circular to sub circular features seems to be independent of human activity.
• The sampling method was reviewed to implement monitoring wells compatible with time series measurements via a portable gas analyser, removing the presence of artificial hydrogen.
• Low amounts of hydrogen were measured and were not consistent throughout the area and the days.
• The origin of the measured hydrogen is still uncertain but could be from bacterial activity.
• Bacterial induced hydrogen could be sensitive to daily climatic change such as atmospheric pressure, temperature, and humidity, thus having inconstant hydrogen fluxes.
• The local geology constitutes a potential hydrogen generation and migration system.
• Agricultural activities as a potential hydrogen source need to be investigated
The next step in natural hydrogen exploration in Australia is long term monitoring, as done in Brazil (Prinzhofer et al., 2019).
Data availability statement
The original contributions presented in the study are included in the article/Supplementary Material, further inquiries can be directed to the corresponding authors.
Author contributions
LA wrote the paper. EF participated in the writing and designed this project. All authors contributed to the article and approved the submitted version.
Conflict of interest
The authors declare that the research was conducted in the absence of any commercial or financial relationships that could be construed as a potential conflict of interest.
Publisher’s note
All claims expressed in this article are solely those of the authors and do not necessarily represent those of their affiliated organizations, or those of the publisher, the editors and the reviewers. Any product that may be evaluated in this article, or claim that may be made by its manufacturer, is not guaranteed or endorsed by the publisher.
Supplementary material
The Supplementary Material for this article can be found online at: https://www.frontiersin.org/articles/10.3389/feart.2023.1236673/full#supplementary-material
References
Bettenay, E. (1962). The salt lake systems and their associated aeolian features in the semi-arid regions of Western Australia. J. Soil Sci. 13 (1), 10–17. doi:10.1111/j.1365-2389.1962.tb00675.x
Boggs, D. A., Boggs, G. S., Eliot, I., and Knott, B. (2006). Regional patterns of salt lake morphology in the lower Yarra Yarra drainage system of Western Australia. J. Arid Environ. 64 (1), 97–115. doi:10.1016/j.jaridenv.2005.04.010
Boreham, C. J., Sohn, J. H., Cox, N., Williams, J., Hong, Z., and Kendrick, M. A. (2021). Hydrogen and hydrocarbons associated with the neoarchean frog’s leg gold camp, Yilgarn craton, western Australia. Chem. Geol. 575, 120098. doi:10.1016/j.chemgeo.2021.120098
Caccetta, P. A., Simons, J., Furby, S., Wright, N., and George, R. (2022). CSIRO Report Number EP2022-0724. Australia: CSIRO Mapping salt-affected land in the South-West of Western Australia using satellite remote sensing.
Cathles, L., and Prinzhofer, A. (2020). What pulsating h2 emissions suggest about the h2 resource in the Sao francisco basin of Brazil. Geosciences 10 (4), 149. doi:10.3390/geosciences10040149
Das, D., and Veziroglu, N. (2001). Hydrogen production by biological processes: a survey of literature. Int. J. Hydrogen Energy 26 (1), 13–28. doi:10.1016/S0360-3199(00)00058-6
De Deckker, P. (1983). Australian salt lakes: their history, chemistry, and biota — A review. Hydrobiologia 105 (1), 231–244. doi:10.1007/BF00025191
Degens, B., Fitzpatrick, R., and Hicks, W. (2008). Avon Basin, WA wheatbelt: acidification and formation of inland ASS materials in salt lakes by acid drainage and regional groundwater discharge. Inland Acid. Sulfate Soil Syst. Across Aust., 176–188.
Etiope, G., Schoell, M., and Hosgoormez, H. (2011). Abiotic methane flux from the Chimaera seep and Tekirova ophiolites (Turkey): understanding gas exhalation from low temperature serpentinization and implications for Mars. Earth Planet. Sci. Lett. 310 (1–2), 96–104. doi:10.1016/j.epsl.2011.08.001
Frery, E., Gratier, J.-P., Ellouz-Zimmerman, N., Loiselet, C., Braun, J., Deschamps, P., et al. (2015). Evolution of fault permeability during episodic fluid circulation: evidence for the effects of fluid–rock interactions from travertine studies (Utah–usa). Tectonophysics 651–652, 121–137. doi:10.1016/j.tecto.2015.03.018
Frery, E., Langhi, L., Maison, M., and Moretti, I. (2021). Natural hydrogen seeps identified in the north Perth basin, western Australia. Int. J. Hydrogen Energy 46 (61), 31158–31173. doi:10.1016/j.ijhydene.2021.07.023
Geymond, U., Ramanaidou, E., Lévy, D., Ouaya, A., and Moretti, I. (2022). Can weathering of banded iron formations generate natural hydrogen? Evidence from Australia, Brazil and South Africa. Minerals 12 (2), 163. doi:10.3390/min12020163
Halas, P., Dupuy, A., Franceschi, M., Bordmann, V., Fleury, J.-M., and Duclerc, D. (2021). Hydrogen gas in circular depressions in South Gironde, France: flux, stock, or artefact? Appl. Geochem. 127, 104928. doi:10.1016/j.apgeochem.2021.104928
Huete, A. R. (1988). A soil-adjusted vegetation index (Savi). Remote Sens. Environ. 25 (3), 295–309. doi:10.1016/0034-4257(88)90106-X
Jutson, J. T. (1917). Erosion and the resulting land forms in sub-arid western Australia, including the origin and growth of the dry lakes. Geogr. J. 50 (6), 418. doi:10.2307/1780374
Kuncoro, P. H., Koga, K., Satta, N., and Muto, Y. (2014). A study on the effect of compaction on transport properties of soil gas and water I: relative gas diffusivity, air permeability, and saturated hydraulic conductivity. Soil Tillage Res. 143, 172–179. doi:10.1016/j.still.2014.02.006
Larin, N., Zgonnik, V., Rodina, S., Deville, E., Prinzhofer, A., and Larin, V. N. (2015). Natural molecular hydrogen seepage associated with surficial, rounded depressions on the european craton in Russia. Nat. Resour. Res. 24 (3), 369–383. doi:10.1007/s11053-014-9257-5
Liu, E., Yan, C., Mei, X., He, W., Bing, S. H., Ding, L., et al. (2010). Long-term effect of chemical fertilizer, straw, and manure on soil chemical and biological properties in northwest China. Geoderma 158 (3–4), 173–180. doi:10.1016/j.geoderma.2010.04.029
Lloyd, J., and Taylor, J. A. (1994). On the temperature dependence of soil respiration. Functional Ecology 8 (3), 315. doi:10.2307/2389824
Lopez-Lazaro, C., Bachaud, P., Moretti, I., and Ferrando, N. (2019). Predicting the phase behavior of hydrogen in NaCl brines by molecular simulation for geological applications. BSGF - Earth Sci. Bull. 190, 7. doi:10.1051/bsgf/2019008
Luo, Y., and Zhou, X. (2006). “Controlling factors,” in Soil respiration and the environment (Amsterdam, Netherlands: Elsevier), 79–105. doi:10.1016/B978-012088782-8/50005-X
Madigan, M. T., Martinko, J. M., and Parker, J. (2000). Brock biology of microorganisms. 9. Upper Saddle River (N.J.): Prentice-Hall.
Massmann, J., and Farrier, D. F. (1992). Effects of atmospheric pressures on gas transport in the vadose zone. Water Resour. Res. 28 (3), 777–791. doi:10.1029/91WR02766
Mavi, M. S., and Marschner, P. (2017). Impact of salinity on respiration and organic matter dynamics in soils is more closely related to osmotic potential than to electrical conductivity. Pedosphere 27 (5), 949–956. doi:10.1016/S1002-0160(17)60418-1
McFarlane, D., George, R., and Caccetta, P. (2004). “The extent and potential area of salt-affected land in Western Australia estimated using remote sensing and digital terrain models,” in Presented at the 1st National Salinity Engineering Conference, Perth, WA, April 2004.
Moretti, I., Brouilly, E., Loiseau, K., Prinzhofer, A., and Deville, E. (2021b). Hydrogen emanations in intracratonic areas: new guidelines for early exploration basin screening. Geosciences 11 (3), 145. doi:10.3390/geosciences11030145
Moretti, I., Geymond, U., Pasquet, G., Aimar, L., and Rabaute, A. (2022). Natural hydrogen emanations in Namibia: field acquisition and vegetation indexes from multispectral satellite image analysis. Int. J. Hydrogen Energy 47 (84), 35588–35607. doi:10.1016/j.ijhydene.2022.08.135
Moretti, I., Prinzhofer, A., Françolin, J., Pacheco, C., Rosanne, M., Rupin, F., et al. (2021a). Long-term monitoring of natural hydrogen superficial emissions in a brazilian cratonic environment. Sporadic large pulses versus daily periodic emissions. Int. J. Hydrogen Energy 46 (5), 3615–3628. doi:10.1016/j.ijhydene.2020.11.026
Myagkiy, A., Brunet, F., Popov, C., Krüger, R., Guimarães, H., Sousa, R. S., et al. (2020). H2 dynamics in the soil of a H2-emitting zone (São francisco basin, Brazil): microbial uptake quantification and reactive transport modelling. Appl. Geochem. 112, 104474. doi:10.1016/j.apgeochem.2019.104474
Myers, J. S. (1995). Geology of the esperance 1:1 000 000 sheet: Western Australia geological Survey, 1:1 000 000. Western Australia, Australia: Geological Series Explanatory Notes, 10.
Nakajima, T., and Lal, R. (2014). Tillage and drainage management effect on soil gas diffusivity. Soil Tillage Res. 135, 71–78. doi:10.1016/j.still.2013.09.003
Pasquet, G. (2022). Évolution des gaz associés à l'ouverture des rifts, hydrogène naturel et autres. Cas du rift est-africain. PhD thesis. UPPA, 306.
Prinzhofer, A., Moretti, I., Françolin, J., Pacheco, C., D’Agostino, A., Werly, J., et al. (2019). Natural hydrogen continuous emission from sedimentary basins: the example of a Brazilian H2-emitting structure. Int. J. Hydrogen Energy 44 (12), 5676–5685. doi:10.1016/j.ijhydene.2019.01.119
Prinzhofer, A., Tahara Cissé, C. S., and Diallo, A. B. (2018). Discovery of a large accumulation of natural hydrogen in Bourakebougou (Mali). Int. J. Hydrogen Energy 43 (42), 19315–19326. doi:10.1016/j.ijhydene.2018.08.193
Raper, G. P., Speed, R. J., Simons, J. A., Killen, A. L., Blake, A. I., Ryder, A. T., et al. (2014). Groundwater trend analysis for south-westWestern Australia 2007–12, Resource management technical report 388. Western Australia, Perth: Department of Agriculture and Food.
Reslewic, S., Zhou, S., Place, M., Zhang, Y., Briska, A., Goldstein, S., et al. (2005). Whole-genome shotgun optical mapping of rhodospirillum rubrum. Appl. Environ. Microbiol. 71 (9), 5511–5522. doi:10.1128/AEM.71.9.5511-5522.2005
Salama, R. B., Farrington, P., Bartle, G. A., and Watson, G. D. (1993). The role of geological structures and relict channels in the development of dryland salinity in the wheatbelt of Western Australia. Aust. J. Earth Sci. 40 (1), 45–56. doi:10.1080/08120099308728062
Simons, S. L. (2019). Cenozoic coal resources of southern western Australia: Exploration and evaluation history: Geological Survey of western Australia, record 2019/6. Western Australia: Department of Commerce, 30.
Spaggiari, C. V., Occhipinti, S. A., Korsch, R. J., Doublier, M. P., Clark, D. J., Dentith, M. C., et al. (2014). “Interpretation of albany-fraser seismic lines 12ga-AF1, 12ga-AF2 and12GA-AF3: implications for crustal architecture,” in Albany-fraser orogen seismic and magnetotelluric (MT) workshop 2014: Extended abstracts geological Survey of western Australia; 2014, 28–43. Record 2014/6.
State of Western Australia (Department of Mines, Industry Regulation and Safety), (2021). East albany-fraser orogen GIS. Western Australia: Department of Mines,Industry Regulation and Safety.
Timms, B. V. (2005). Salt lakes in Australia: present problems and prognosis for the future. Hydrobiologia 552 (1), 1–15. doi:10.1007/s10750-005-1501-x
Williams, W. D. (2002). Environmental threats to salt lakes and the likely status of inland saline ecosystems in 2025. Environ. Conserv. 29 (2), 154–167. doi:10.1017/S0376892902000103
Zgonnik, V., Beaumont, V., Deville, E., Larin, N., Pillot, D., and Farrell, K. M. (2015). Evidence for natural molecular hydrogen seepage associated with Carolina bays (Surficial, ovoid depressions on the atlantic coastal plain, province of the USA). Prog. Earth Planet. Sci. 2 (1), 31. doi:10.1186/s40645-015-0062-5
Keywords: natural hydrogen, Australia, remote sensing, salt lakes, monitoring, Albany-Fraser orogen
Citation: Aimar L, Frery E, Strand J, Heath C, Khan S, Moretti I and Ong C (2023) Natural hydrogen seeps or salt lakes: how to make a difference? Grass Patch example, Western Australia. Front. Earth Sci. 11:1236673. doi: 10.3389/feart.2023.1236673
Received: 08 June 2023; Accepted: 31 July 2023;
Published: 14 August 2023.
Edited by:
Ali Abedini, Urmia University, IranReviewed by:
Julie K. Pearce, The University of Queensland, AustraliaOlivier Sissmann, IFP Energies nouvelles, France
Copyright © 2023 Aimar, Frery, Strand, Heath, Khan, Moretti and Ong. This is an open-access article distributed under the terms of the Creative Commons Attribution License (CC BY). The use, distribution or reproduction in other forums is permitted, provided the original author(s) and the copyright owner(s) are credited and that the original publication in this journal is cited, in accordance with accepted academic practice. No use, distribution or reproduction is permitted which does not comply with these terms.
*Correspondence: Léo Aimar, bGVvLmFpbWFyOTVAZ21haWwuY29t; Emanuelle Frery, ZW1hbnVlbGxlLmZyZXJ5QGNzaXJvLmF1