 Kou-Cheng Chen
 Kwang-Hee Kim
 Jeen-Hwa Wang1,3
- 1Institute of Earth Sciences, Academia Sinica, Taipei, Nangang, Taiwan
- 2Department of Geological Sciences, Pusan National University, Pusan, Republic of Korea
- 3Department of Earth Sciences, National Central University, Taoyuan, Taiwan
We collected a data set of mainshocks and their respective largest foreshocks of 38 earthquake sequences in Taiwan. The plot of local magnitude, ML, of a mainshock (denoted by MLm) versus ML of its largest foreshock (denoted by MLf) shows an increase in MLm with MLf. This indicates that for Taiwan’s earthquakes the bigger the largest foreshock is, the larger the mainshock is. The plot of the epicentral distance, Δ (in km), from the largest foreshock to the mainshock versus ML of the mainshock exhibits a weak increase in Δ with MLm as Δ<10 km. The plot of the focal depth of the largest foreshock and that of the mainshock shows a linear increase in the former along with the latter for most event-pairs. Let T be the interval between the occurrence time of the largest foreshock and the mainshock. The plot of T versus MLm exhibits that the mainshock will occur within 5 days, with the highest probability of 1 day, after the occurrence of the largest foreshock. Let H be the hypocentral distance between the largest foreshock and the mainshock. The plot of T versus H reveals a slight increase in T with H when T>1 day.
1 Introduction
Prior to earthquake rupture, there is a complex nucleation stage where physical and chemical phenomena might happen. Foreshock activities are a type of preseismic phenomena involved in numerous forthcoming earthquakes (e.g., Papadopoulos et al., 2018; and cited references therein) and thus may be considered as a tool to aid in the prediction of earthquakes (e.g., Papazachos, 1975; Jones and Molnar, 1979; Knopoff et al., 1982; Jones et al., 1982; Jones, 1984; Jones, 1985; Agnew and Jones, 1991; Molchan et al., 1999; McGuire et al., 2005; Ogata, 2011; Ogata and Katsura, 2012; Ogata and Katsura, 2014; Wang et al., 2015; Wang et al., 2016; Wang, 2016; Papadopoulos and Minadakisf, 2016; Riga and Balocchi, 2017; Papadopoulos et al., 2018; Seit et al., 2019; Wang, 2021a; Wang, 2021b). Foreshocks may accurately pinpoint the time and location of the mainshock. For example, foreshocks were an important factor in the successful prediction of the 4 February 1975, M7.3 Haicheng, PRC, earthquake (e.g., Wu et al., 1976; Jones et al., 1982; Xu et al., 1982; Wang et al., 2006). Of course, in addition, numerous authors (e.g., Dodge et al., 1996; Brodsky and Lay, 2014; Kato et al., 2016) have shown some evidence of foreshocks migrating towards the location of the mainshock.
We assume that Taiwan is a good region for studying the above-mentioned problem due to the following reasons: 1) seismic observations have been carried out there for a long time, 2) there are excellent seismic observation networks, and 3) there are abundant earthquake data. Several authors (e.g., Hsu, 1971; Tsai et al., 1977; Wu, 1978; Tsai, 1986) proposed that Taiwan is located at an oblique collision zone between the Eurasian plate (EP) and the Philippine Sea plate (PSP). The collision boundary between the two plates is almost along the Longitudinal Valley (LV), marked with ‘LV’ in Figure 1. The PSP has been moving northwestward at a speed of ∼80 mm/year (Yu et al., 1997) to collide with the EP. In northern Taiwan, the subduction zone of the PSP is beneath the EP. In southern Taiwan, the EP moves from west to east and the subduction zone of the EP is beneath the PSP. Active orogeny due to the collision of these two plates causes complex tectonics and geological features in the region (119.5–122.5 °E and 21.5–25.5 °N). The complex tectonics have resulted in a non-uniform spatial earthquake distribution (Hsu, 1961; Hsu, 1966; Hsu, 1971; Wang, 1988; 1998). High and heterogeneous seismicity means Taiwan is one of the best natural laboratories for earthquakes. Seismological studies have been conducted in Taiwan for more than a century (Wang, 1988; 1998; Wang et al., 1994).
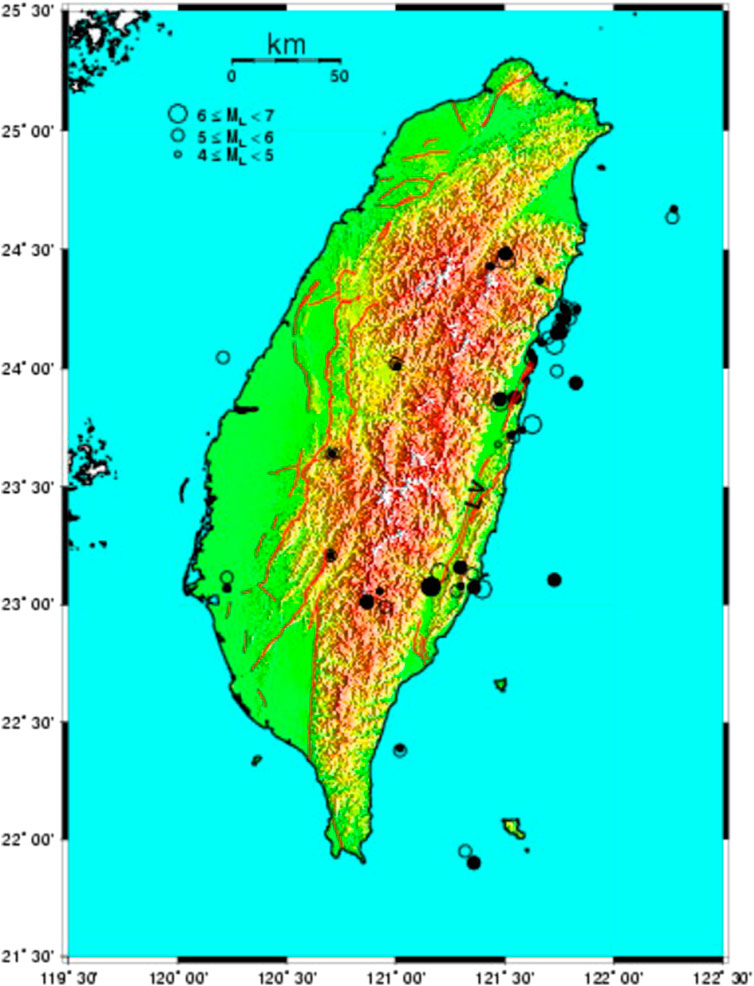
FIGURE 1. Epicentral distribution of 38 event-pairs of the mainshocks (open circle) and the largest foreshocks (solid circle). ‘LV’ denotes the Longitudinal Valley in eastern Taiwan.
In Taiwan, numerous earthquakes, including the 20 April 1935, Ms7.2 Hsinchu- Taichung earthquake (e.g., Hsu, 1971; Miyamura, 1985) and the 20 September 1999 ML7.3 (or Mw7.6) Chi-Chi earthquake (e.g., Ma et al., 1999; Chen et al., 2001; Chen et al., 2002; Shin and Teng, 2001; Wang et al., 2005; Wang, 2019), caused severe damage in the region. To reduce seismic hazards, the research on forecasting forthcoming earthquakes is hence quite important in the region for both academic interest and public need. The possibility to use foreshocks as a precursor in Taiwan has long been considered (cf. Wang, 2021a; Wang, 2021b; and cited references therein). Since foreshocks are usually identified after the mainshock occurs, it is not easy to use them as a useful precursor to predict the forthcoming mainshock. Nevertheless, seismologists still assess the occurrence of a forthcoming mainshock from a group of events that could be foreshocks and occur alongside other possible precursors. In order to investigate the possible role of foreshocks in the assessment of a forthcoming mainshock, it is necessary to study the correlations between the mainshock and the largest foreshock that is a significant representative of foreshocks. In this study, we consider five sorts of correlations between the mainshock and its largest foreshock: 1) the correlation between the magnitude of the former and that of the latter, 2) the correlation between the epicentral distance from the former to the latter and the mainshock magnitude, 3) the correlation between the focal depth of the largest foreshock and that of the related mainshock, 4) the correlation between the time interval that is measured from the occurrence time of the former to that of the latter and the mainshock magnitude, and 5) the correlation between the time interval and the hypocentral distance from the former to the latter.
A detailed description of seismological observations, especially the Taiwan Telemetered Seismographic Network (TTSN) operated by the Institute of Earth Sciences, Academia Sinica, before 1991 can be seen in Wang (1989), Wang (1998) and Yeh et al. (1989). Since 1991, a new seismic network, named the Taiwan Seismic Network (TSN), operated by the Central Weather Bureau (CWB), has been upgraded from the old CWB seismic network. In 1992, the TTSN was merged into the TSN. Since then, numerous new stations have been constructed. A detailed description of the TSN can be seen in Shin (1992) and Shin and Chang (2005). Currently, the TSN is composed of 72 stations, each equipped with three-component, digital velocity seismometers. The seismograms are recorded in both high- and low-gain forms. This network provides high-quality digital earthquake data.
Several magnitude scales have been taken to quantify the earthquakes in Taiwan (e.g., Hsu, 1971; Wang and Miyamura, 1990; Shin, 1992; Wang, 1992; Wang, 1998; Chen et al., 2007). The magnitude scales are Hsu’s magnitude (MH), duration magnitude (MD), surface-wave magnitude (Ms), moment magnitude (Mw), and local magnitude (ML) which were used in different periods of seismological observations. In the following, the magnitudes of earthquakes in use are unified to be the local magnitude, ML, determined by the CWB (Shin, 1992). Chen et al. (2007) have inferred the correlations between ML and other magnitude scales.
The selection of a foreshock area that is based on the value of epicentral distance, Δ, between the mainshock and the farthest foreshock in consideration is a not yet clearly defined problem. Different authors often use different upper-bound values of Δ. Several examples are 30 km for M≥7.0 mainshocks by Jones and Molnar (1979), 70 km for M≥3.0 mainshocks by Knopoff et al. (1982), 15 km for M≥5 mainshocks by Lin (2009), 200 km for M≥8.1 mainshocks by Papadopoulos and Minadakisf (2016), 1,000 km for M≥5.8 mainshocks by Riga and Balocchi (2017), 10 km by Trugman and Ross (2019), 2 km by Wu and McLaskey (2022), and 3 km by Peng and Mori, (2022) and Wetzler et al. (2023). Clearly, the spectrum is quite wide. In addition, numerous authors studied the correlation between foreshocks and mainshocks and the criteria for selecting the foreshocks and their mainshocks (e.g., Rhoades and Evison, 2004; De Santis et al., 2015; Gulia and Wiemer, 2019; Cianchini et al., 2020; Console et al., 2020). Gulia and Wiemer (2019) studied the possible discrimination between foreshocks and mainshocks. De Santis et al. (2015) and Cianchini et al. (2020) applied the revised accelerated moment release to foreshocks revealing an acceleration pointing to the mainshock. Console et al. (2020) found that ten out of 14 earthquake sequences in Italy were characterized by multiple mainshocks of a similar magnitude. Their studies will be helpful for understanding the correlation between foreshocks and mainshocks and for the criteria of selecting the foreshocks and related mainshocks.
From the measurements of the aftershock areas of seven of Taiwan’s earthquakes with 6≤M≤7.5, Hsu (1971) concluded that the dimension of the aftershock area somewhat increases with the magnitude of the mainshock, even though he did not infer a formula to correlate the two parameters. Since the aftershock areas measured by Hsu (1971) range from 9.9 × 10² to 8.9 × 10³ km2, the linear dimension of the aftershock area varies from 30 km to 100 km, with an average of ∼65 km. In Taiwan, the foreshock area is usually smaller than the aftershock area (e.g., Chen and Wang, 1984; Chen et al., 1990; Chan et al., 2019). Hence, we consider the upper-bound value of Δ to be 15 km for Taiwan’s earthquakes in this study.
In this study, we will compile the data of ML≥5 mainshocks and their respective largest foreshocks. The earthquake magnitudes of the mainshock and the largest foreshock are denoted by MLm and MLf, respectively, hereafter. The focal depth of an earthquake is denoted by D (in km). In order to distinguish the focal depths of the mainshock and the largest foreshock, they are denoted by Dm and Df, respectively, hereafter. The time interval (in day) between the occurrence time of the largest foreshock and that of the mainshock is denoted as T. The epicentral distance (in km) between the epicenter of the largest foreshock and that of the mainshock is denoted as Δ. The hypocentral distance (in km) between the hypocenter of the largest foreshock and that of the mainshock is denoted as H. Therefore, this study will focus on five correlations as mentioned above: MLm versus MLf; Δ versus MLm; Df versus Dm; T versus MLm; and T versus H. The five issues that have included the correlations in size, spatial distribution, and time window between the largest foreshocks and mainshocks will thus provide basic information for studying earthquake physics of earthquake sequences in advance. We hope our studies will be valuable for the studies about the foreshock-mainshock trigger, which is an important problem in earthquake physics, for example, the cascade model for foreshock generation (Ellsworth and Bulut, 2018; McLaskey, 2019; Yoon et al., 2019; Wu and McLaskey, 2022). Of course, we have to emphasize the point that the existence of relationships between foreshocks and mainshocks is meaningful only if the mainshock is preceded by a foreshock sequence.
2 Data
Some authors studied the foreshocks and mainshocks of several of Taiwan’s earthquake sequences. We first compiled the data of those studies from the literature. Chen and Wang (1984) and Chen et al. (1990) observed the occurrences of foreshocks before the 10 May 1983 ML6.4 (or MD5.7) Taipingshan earthquake. The foreshocks that first happened on May 7 and continued for about 2 days before the mainshock were located within the source area. The mainshock occurred in the southern part of the foreshock area. The largest foreshock with ML=5.5 occurred about 3 days before the mainshock.
Lin (2009) studied the foreshock activities of 10 ML≥5 earthquake sequences with significantly felt foreshocks having ML≥4.0 in Taiwan during 1990–2004. The largest foreshock whose focal mechanism is similar to its mainshock occurred 5 days before and at a distance of 15 km from the mainshock. Lin (2010) studied the foreshock activities of the 4 March 2008, ML5.2 Taoyuan earthquake in southern Taiwan. He found that the earthquake was preceded by two groups (A and B) of foreshocks that clustered along the major fault plane and dipped to the southeast. Group A, consisting of 29 micro-earthquakes with 0.6≤ML≤2.2, occurred several hours before the mainshock. Group B, including 35 events with the largest one having ML=4.0, started about 20 min (or 0.3 h) before the mainshock. These events are listed in Table 1 with event numbers from 01 to 09.
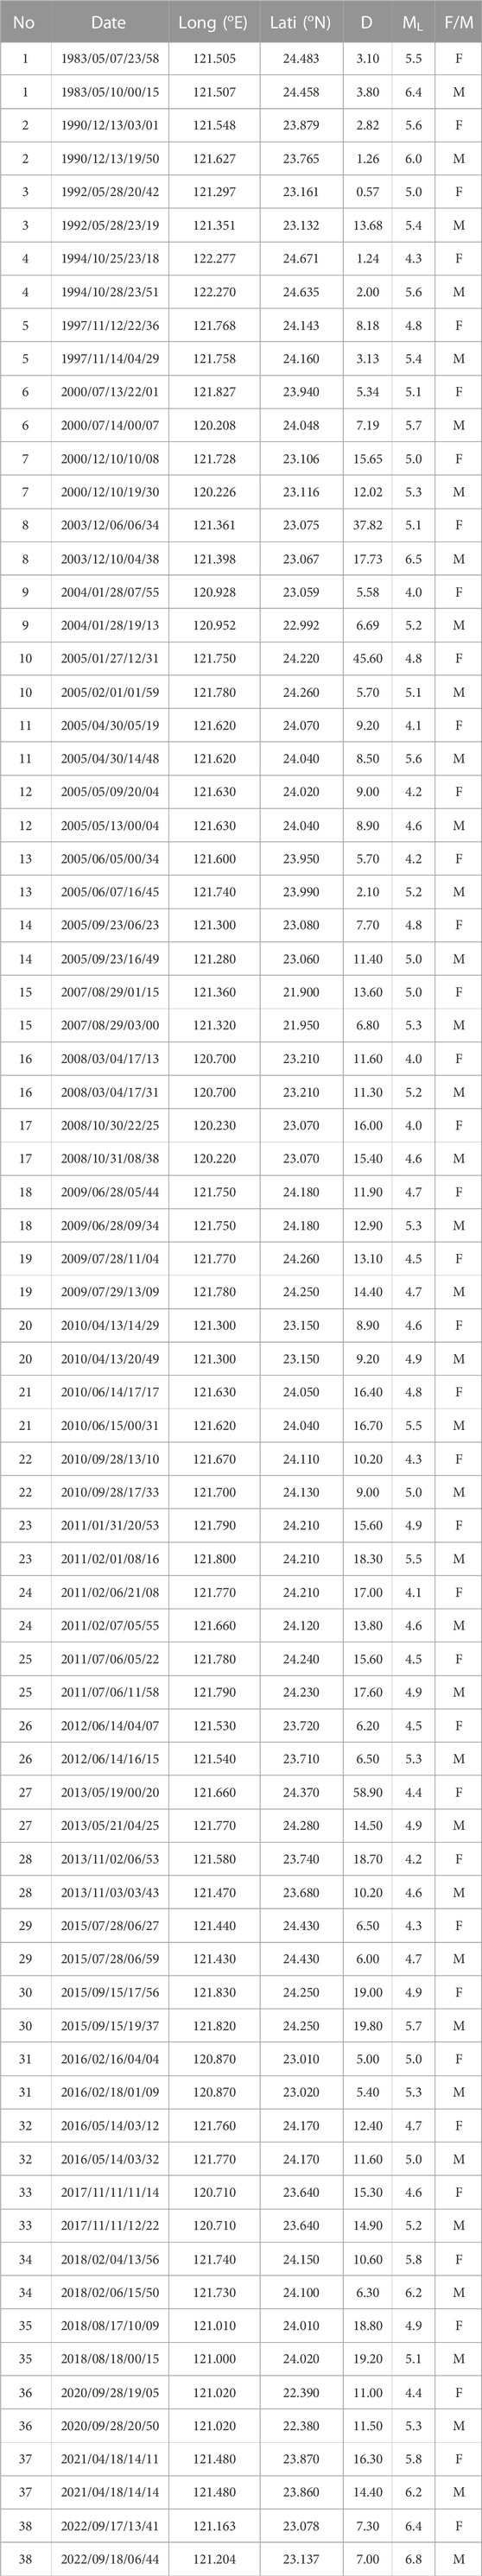
TABLE 1. The event-pair number (No), date, longitude, latitude, focal depth (D, in km), and local magnitude (ML) of 38 pairs of the largest foreshocks and mainshocks. In the last column, “F” and “M” denote the largest foreshock and mainshock, respectively.
Since the number of events obtained by the above-mentioned three groups of researchers is too small to make a comprehensive study, we compiled a large data set from the CWB’s earthquake catalogs from 2005 to 2022 (CWB, 2022). The time interval between two mainshocks is longer than 5 days. This makes it easy to distinguish two mainshocks. Considering the previous studies, the criteria selection of the mainshock and its largest foreshock are Δ ≤15 km for epicentral distance and T≤5 days for the time difference between the largest foreshock and the mainshock. In order to avoid the possibility of multiple events, the event-pairs with δML=MLm-MLf<0.2 are not taken into account. In total, there are 38 mainshocks with 4.6≤MLm≤6.8 (during 1983–2022) together with their respective largest foreshocks with 4.0≤MLf≤6.4. The focal depths are 1.26 km≤Dm≤19.8 km for the mainshocks and 0.57 km≤Df≤58.9 km for the foreshocks. From the Central Weather Bureau, Taiwan, the uncertainties in epicenter and focal depth are, respectively, about 2 km and 5 km. The earthquake data in use are listed in Table 1. The epicentral distribution is displayed in Figure 1 in which an open circle and a solid circle represent, respectively, the epicenter of a mainshock and that of its largest foreshock. Figure 2 displays the depth distribution of the mainshocks and that of the largest foreshocks. The number above each bar is the number of events in the relative depth range. Clearly, most of the event pairs are located in a focal depth range from 0 to 20 km.
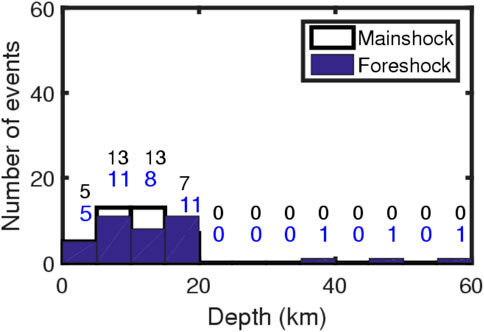
FIGURE 2. Depth distribution of the number of mainshocks and the largest foreshocks in a depth unit of 5 km. The upper and lower numbers above each bar are the number of mainshocks and foreshocks, respectively, in the relative depth range.
Numerous authors (e.g., Rau and Wu, 1995; Ma et al., 1996; Kim et al., 2005) inversed the three-dimensional velocity structures in the Taiwan region from the earthquake data. They inferred that the crust-upper mantle boundary with vp=7.5 km/s is almost in the range of 35–45 km. Hence, a depth of 40 km is here considered as a boundary to classify the events: the crustal events with D≤40 km and the upper-mantle or subduction-zone events with D>40 km. From Table 1 and Figure 2, it can be seen that all mainshocks are crustal events with D≤20 km. Two foreshocks are mantle events with D>40 km and the rest are crustal events with D≤40 km.
3 Results
3.1 The correlation between MLm versus MLf
In order to explore the correlation between the ML of a mainshock (denoted by MLm) and ML of its largest foreshock (denoted by MLf), the plot of MLm versus MLf for the 38 event-pairs is shown in Figure 3. Although the data points are somewhat scattered, results still show an increase in MLm with MLf and may be described by the following relationship:
FIGURE 3. Plot of MLm (ML for mainshocks) versus MLf (ML for the largest foreshocks). The solid line represents the linear regression equation and the parameter γ is the correlation coefficient.
The correlation coefficient of the linear regression equation between MLm and MLf is evaluated to be 0.8. This reveals that the regression equation, Eq. 1, is good enough to represent the correlation between MLm and MLf. Equation 1 indicates that for Taiwan earthquake sequences the bigger the largest foreshock is, the larger the mainshock is.
3.2 The correlation of Δ versus MLm
In order to explore the correlation between the epicentral distance, Δ (in km), from the largest foreshock to the mainshock with MLm, the plot of Δ versus MLm for the 38 event-pairs is shown in Figure 4. Since the data points are quite scattered, we cannot recognize a relationship between Δ versus MLm. Nevertheless, considering only the data points with Δ<10 km, we can still see that Δ slightly increases with MLm.
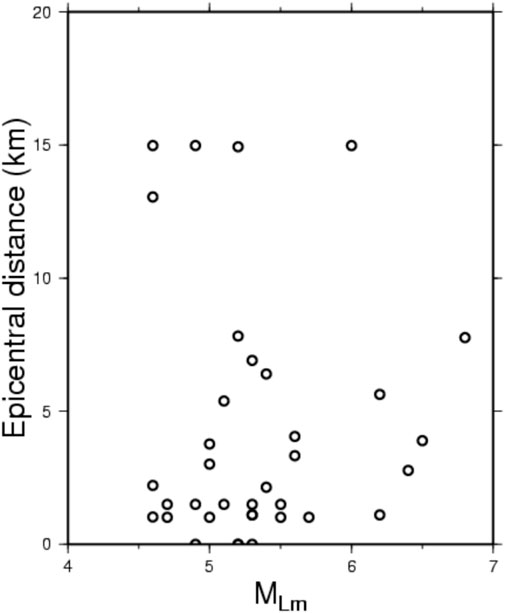
FIGURE 4. Plot of the epicentral distance (in km), Δ, from the largest foreshock to the mainshock versus the mainshock magnitude, MLm.
3.3 The correlation of Df versus Dm
The plot of the focal depth (in km) of the largest foreshock, i.e., Df, versus that of the mainshock, i.e., Dm, for the 38 event-pairs is displayed in Figure 5. Except for four event-pairs, the data points are distributed almost around the bi-section line as shown in Figure 5 with a dashed line, thus indicating a linear increase in Df with Dm.
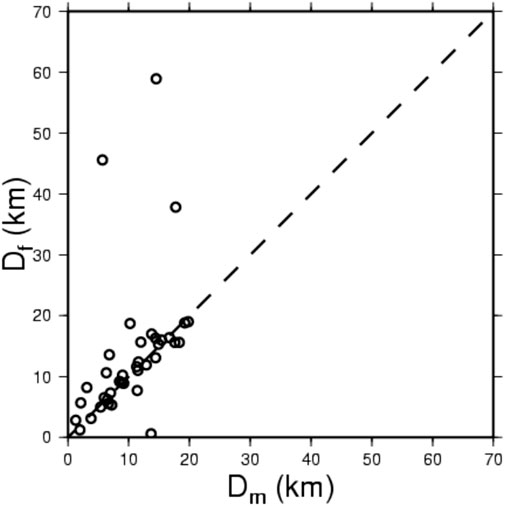
FIGURE 5. Plot of Df (the focal depth of the largest foreshock in km) versus Dm (the focal depth of the mainshock in km).
3.4 The correlation of T versus MLm
The time interval between the occurrence of the largest foreshock to that of the mainshock is denoted by T (in day). The plot of T versus MLm for the 38 event-pairs is displayed in Figure 6A. Since the data points are scattered, a relationship between T and MLm cannot be recognized. Figure 6B exhibits the time interval distribution of the number of mainshocks in a time unit of 1 day. The value of T varies from 0 to 5 days. The number of event-pairs for which the largest foreshocks occurred within 1 day before the mainshocks is 27, accounting for 71% of the total number of event-pairs. The number of event-pairs rapidly decreases with increasing T as T>1 day.
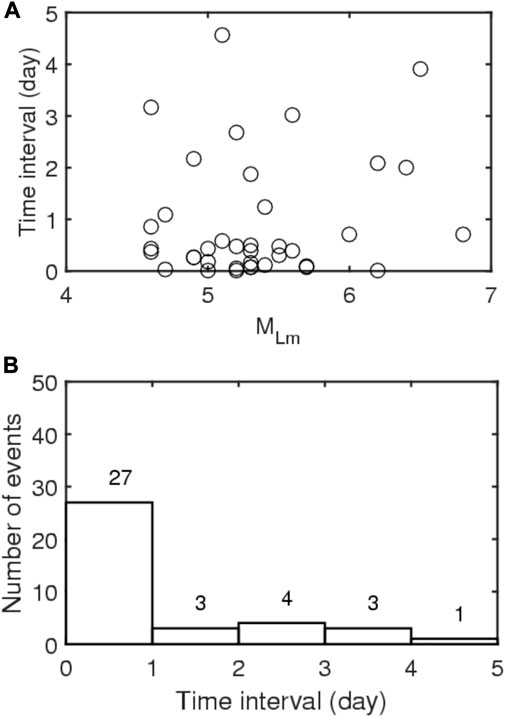
FIGURE 6. (A) Plot of T (the time interval between the occurrence time of a mainshock and that of its largest foreshock) versus MLm and (B) The time interval distribution of the number of mainshocks in a time unit of 1 day. The number above each bar is the number of events.
3.5 The correlation of T versus H
Figure 7 shows the plot of T versus H for the 38 event-pairs. Although the data points are quite scattered, we can still observe two interesting phenomena: 1) For T<1 day, there are three clusters of data points: a large one distributing from H=0 km to H=5 km, with an average of 2.5 km, a moderate one around an average hypocentral distance of 15 km, and a small one around an average hypocentral distance of 9 km; and 2) For T>1 day, T slightly increases with H.
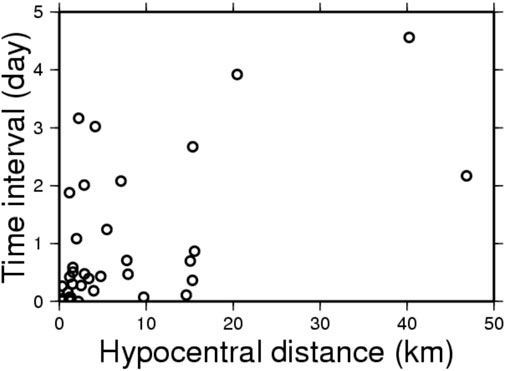
FIGURE 7. The plot of T versus H (i.e., the hypocentral distance between the largest foreshock and the mainshock).
4 Discussion
4.1 The correlation between MLm versus MLf
Figure 3 shows an increase in MLm with MLf that may be described by Eq. 1, MLm=1.59+0.79MLf, as displayed by a solid line in Figure 3. This implies that MLm may be estimated with some uncertainty when MLf is known.
Papazachos (1974), Papazachos (1975) plotted Msf and Msm for Greek earthquakes and Wu et al. (1976) did the same for Chinese events. Although a high-degree scatter of data points is present in the plots, the two groups of authors still suggested that there is a linear relationship between the two magnitudes. On the other hand, Jones and Molnar (1979) also made the plot of Msf and Msm from a large data set of world-wide earthquakes. From the plot, they claimed that even allowing for an error of 0.5 units in magnitude, no relationship between the two magnitudes can be seen. They argued that the crude relationships proposed by Papazachos (1974), Papazachos (1975) and Wu et al. (1976) are due to the limited magnitude range of their respective data. Hence, they concluded that foreshocks cannot be used to reliably estimate the magnitude of an impending earthquake. The correlation between the two magnitudes does not exist is either because the area that slips or the amount of slip during a foreshock is not a constant fraction of the fault area or displacement caused by the mainshock. For numerous world-wide mainshock-foreshock sequences with Mwm≥7, Jones and Molnar (1979) recognize a straight line to exhibit the upper bound magnitudes of the largest foreshocks and such a line increases with the mainshock magnitude. But they could not find a positive correlation between Mwf and Mwm. For seven mainshock-foreshock sequences with Mwm≥5 during 1966–1980 in the San Andreas fault system, California, United States, Jones (1984) did not find a positive correlation between Mwf and Mwm. On the other hand, from 156 worldwide mainshocks with 3≤Mwm≤8 (Mw=the moment magnitude), Riga and Balocchi (2017) inferred the relationships between Mwf and Mwm. The relationships are Mwm=0.695+1.048Mwf for the worldwide earthquake and Mwm= 0.610+1.147Mwf for 32 Italian events. The present result shown in Figure 3 is similar to those obtained by Papazachos (1974), Papazachos (1975), Wu et al. (1976), and Riga and Balocchi (2017) and different from that done by Jones and Molnar (1979). Peng and Mori, (2022) found no clear trend between foreshock size and mainshock size. From laboratory data, numerous authors (Scholz, 2015; Riviere, 2018) found that the b-value decreases as failure approaches and scales inversely with the effective normal stress. The present result of the correlation between foreshock size and mainshock size is consistent with their experimental ones.
Richter (1942, 1956) established the energy-magnitude law of earthquakes as follows:
in which Es and Ms are the seismic-wave energy (in ergs) and the surface-wave magnitude, respectively. In Eq. 1, we use the local magnitude, ML. Hence, we must transfer ML to Ms. Chen et al. (2007) inferred the following relationship, Ms=−(0.53 ± 0.36)+ (1.03 ± 0.06)ML, for Taiwan’s earthquakes. Inserting this relationship into Eq. 1 leads to
where Esf/Esm is the ratio of seismic-wave energy of the largest foreshock to that of the mainshock. Equation 4 exhibits an increase in Esf/Esm with the magnitude of the largest foreshock. Table 1 and Figure 3 show that the maximum value of MLf in use is 6.4. This yields the maximum values of Msf and Esf/Esm are 6.1 and 0.72, respectively.
4.2 The correlation of Δ versus MLm
Figure 4 exhibits the data points of Δ versus MLm. Since the data points are in general quite scattered, we cannot recognize a relationship between Δ versus MLm.
4.3 The correlation of Df versus Dm
The plot of the focal depth of the largest foreshock, Df, versus that of the mainshock, Dm, for the 38 event-pairs is displayed in Figure 5. This figure exhibits that, except for four event-pairs, the former almost linearly increases with the latter because the data points distribute almost around the bi-section line. This means that for most event-pairs in use, the largest foreshock and the mainshock occur almost at the same depth. This implies that we may estimate the focal depth of the mainshock with a high possibility after the largest foreshock occurred. Note that although this correlation exists for Taiwan’s earthquakes, we are not sure if it works for the events in other regions.
As mentioned above, an average depth of 40 km is taken as a boundary to classify the events: a crustal event with D≤40 km and an upper-mantle or subduction-zone event with D>40 km. Obviously, all mainshocks are crustal events with D≤20 km. On the other hand, two foreshocks that are the mantle events with D>40 km are followed by their respective mainshocks that occurred in the crust. Consequently, most of the event-pairs in the study occurred in the crust, especially in the upper crust.
4.4 The correlation of T versus MLm
Figure 6A reveals the plot of T versus MLm for 38 event-pairs in the study. The data points are somewhat scattered, and thus we cannot infer the relationship between T and MLm. This phenomenon also occurs with earthquakes in other regions. For seven mainshock-foreshock sequences with Mwm≥5 that occurred in the San Andreas fault system, California, United States, during 1966–1980, Jones (1984) could not find a positive correlation between log(T) versus MLm. Nevertheless, Figure 6A exhibits that the mainshock will occur within 5 days after the largest foreshock happened. Riga and Balocchi (2017) obtained T=0–3,000 days for 128 world-wide earthquakes with 3≤Mwm≤8 and T=0–1,400 days for 16 Italy events. They did not infer any relationship between T and the foreshock magnitude.
Figure 6B exhibits the time interval distribution of the number of mainshocks in a time unit of 1 day. Obviously, about 71 percent of mainshocks occurred within 1 day after their respective largest foreshocks happened.
4.5 The correlation of T versus H
Figure 7 shows the plot of T versus H for the 38 event-pairs. As mentioned above, for T<1 day, the data points form two clusters: the large one with H ranging from 0 km to 5 km, with an average of 2.5 km, and the small one with H ranging from 15 km to 17 km with an average of 16 km. On the other hand, for T>1, day T slightly increases with H. Results suggest the two possibilities for assessing the forthcoming mainshock: 1) If the mainshock occurs within 1 day after the occurrence of the largest foreshock, the most possible hypocenter of the former would have a hypocentral distance of 2.5 km from the latter or the possible one has a hypocentral distance of 15 km from the latter; 2) If the mainshock does not occur within 1 day after the occurrence of the largest foreshock, the hypocentral distance from the former to the latter will increase with the hypocentral distance.
Seif et al. (2019) constructed the plot of T versus Δ for the earthquakes occurring in California, United States. They showed that Δ varies from 0 to 80 km for all events in use, from 0 to 50 km for most of the events and from 50 km to 80 km for three events; while T is in the range from 0 to 10 days for all events. From their plot of T versus Δ, no positive correlation between T versus Δ can be recognized.
4.6 Implications of these correlations
The results from this study are positive. Nevertheless, foreshocks are not always robust features of all mainshocks, as pointed out by Wetzler et al. (2023). This means that it is not easy to assess a forthcoming mainshock just based on the largest foreshock. The present results will potentially help Taiwan’s seismologists estimate the magnitude, focal depth, epicentral distance from the largest foreshock, and occurrence time of the forthcoming mainshock after the largest foreshock of a group of events accompanied by other reliable precursors occurred. From Figure 3 for the correlation of MLm versus MLf, the mainshock magnitude may be estimated from MLm=1.59+0.79MLf. From Figure 4 for the correlation of Δ versus MLm, the epicentral distance of the mainshock from the largest foreshock is in general shorter than 15 km. From Figure 5 for the correlation of Df versus Dm, the focal depth of the forthcoming mainshock is almost the same as that of the foreshocks for most of the mainshocks. From Figures 6A, B for the correlation of T versus MLm, the forthcoming mainshock will occur within 5 days, with the highest probability of 71% for 1 day, after the largest foreshock happened. Of course, there is the issue that this kind of assessment cannot work for numerous mainshocks, such as the 1999 ML7.3 Chi-Chi earthquake, because no foreshock happened before them.
5 Summary
In this study, we collected mainshocks and their respective largest foreshocks of 38 earthquake sequences in Taiwan from the CWB database. The plot of local magnitude, ML, of a mainshock (denoted by MLm) versus ML of its largest foreshock (denoted by MLf) for the 38 event-pairs shows an increase MLm with MLf following Eq. 1. This indicates that the bigger the largest foreshock is, the larger the mainshock is. The plot of the epicentral distance, Δ (in km), from the largest foreshock to the mainshock versus MLm exhibits that, although the data points are in general quite scattered, there is a weak increase in Δ with MLm as considering only the data points with Δ<5 km. The plot of the focal depth of the largest foreshock versus that of the mainshock shows an increase in the former with the latter, with a linear correlation for most of the event-pairs in the study. The plot of T versus MLm exhibits that the data points are somewhat scattered. Nevertheless, T slightly increases with MLm. The plot of T versus H shows that the data points are somewhat scattered. For T>1 day, the plot of T versus H reveals a slight increase in T with H.
After the occurrence of the largest foreshock, we may estimate the values of four earthquake parameters, with some uncertainties, of the forthcoming mainshock: 1) the mainshock magnitude can be evaluated from Eq. 1, MLm=1.59+0.79MLf; 2) the epicentral distance of the mainshock from the largest foreshock is shorter than 15 km; 3) the focal depth of the mainshock is almost the same as that of the foreshock; and 4) the mainshock will occur within 5 days, with the highest probability of 1 day, after the respective largest foreshock happened. Note that, of course, these results cannot work for mainshocks without foreshocks.
Data availability statement
The datasets presented in this study can be found in online repositories. The names of the repository/repositories and accession number(s) can be found below: CWB (2022). Earthquake Information, https://scweb.cwb.gov.tw/en-us/earthquake/data.
Author contributions
K-CC carried out the calculations and drafted the manuscript. J-HW improved the manuscript and interpretation. K-HK discussed the physical meaning of the results and corrected numerous typo errors. All authors contributed to the article and approved the submitted version.
Funding
This study was supported by the Institute of Earth Sciences, Academia Sinica, Taiwan, and partially by the Korean Meteorological Administration Research Development Program (KMI 2022-00610).
Acknowledgments
The authors would like to express their gratitude to the three reviewers and the editor for their valuable comments and suggestions for the substantial improvement of the article. We also thank the Central Weather Bureau for providing the earthquake data.
Conflict of interest
The authors declare that the research was conducted in the absence of any commercial or financial relationships that could be construed as a potential conflict of interest.
Publisher’s note
All claims expressed in this article are solely those of the authors and do not necessarily represent those of their affiliated organizations, or those of the publisher, the editors and the reviewers. Any product that may be evaluated in this article, or claim that may be made by its manufacturer, is not guaranteed or endorsed by the publisher.
References
Agnew, D. C., and Jones, L. M. (1991). Prediction probabilities from foreshocks. J. Geophys. Res. 96, 11959–11971. doi:10.1029/91JB00191
Chan, C. H., Ma, K. F., Lee, Y. T., and Wang, Y. J. (2019). Rethinking seismic source model of probabilistic hazard assessment in Taiwan after the 2018 Hualien, Taiwan, earthquake sequence. Seismol. Res. Lett. 90, 88–96. doi:10.1785/0220180225
Chen, K. C., Huang, B. S., Wang, J. H., Huang, W. G., Chang, T. M., Hwang, R. D., et al. (2001). An observation of rupture pulses of the September 20, 1999, Chi-Chi, Taiwan earthquake from near-field Seismograms. Bull. Seism. Soc. Am. 91, 1247–1254. doi:10.1785/0120000716
Chen, K. C., Huang, B. S., Wang, J. H., and Yen, H. Y. (2002). Conjugate thrust faulting associated with the 1999 Chi-Chi, Taiwan, earthquake sequence. Geophys. Res. Lett. 29, 118-1–118-4. doi:10.1029/2001GL014250
Chen, K. C., Huang, W. G., and Wang, J. H. (2007). Relationships among magnitudes and seismic moment of earthquakes in the Taiwan region. Terr. Atmos. Ocean. Sci. 18 (5), 951–974. doi:10.3319/tao.2007.18.5.951(t)
Chen, K. C., and Wang, J. H. (1984). On the study of 10 May, 1983 Taipingshan, Taiwan, earthquake sequence. Bull. Inst. Earth Sci. Acad. Sin. ROC 4, 1–28. doi:10.1016/0040-1951(91)90019-O
Chen, K. C., Wang, J. H., and Yeh, Y. L. (1990). Premonitory phenomena of a moderate Taiwan earthquake. Terr. Atmos. Ocean. Sci. 1, 001–021. doi:10.3319/tao.1990.1.1.1(t)
Cianchini, G., De Santis, A., Di Giovambattista, R., Abbattista, C., Amoruso, L., Campuzano, S. A., et al. (2020). Revised accelerated moment release under test: Fourteen worldwide real case studies in 2014–2018 and simulations. Pure Appl. Geophys. 177, 4057–4087. doi:10.1007/s00024-020-02461-9
Console, R., Murru, M., Vannoli, P., Carluccio, R., Taroni, M., and Falcone, G. (2020). Physics-based simulation of sequences with multiple main shocks in Central Italy. Geophys. J. Int. 223, 526–542. doi:10.1093/gji/ggaa300
CWB, (2022). Earthquake information. https://scweb.cwb.gov.tw/en-us/earthquake/data.
De Santis, A., Cianchini, G., and Di Giovambattista, R. (2015). Accelerating moment release revisited: Examples of application to Italian seismic sequences. Tectonophys 639, 82–98. doi:10.1016/j.tecto.2014.11.015
Dodge, D. A., Beroza, G. C., and Ellsworth, W. L. (1996). Detailed observations of California foreshock sequences: Implications for the earthquake initiation process. J. Geophys. Res., 101(10), 371–22392. doi:10.1029/96JB02269
Ellsworth, W. L., and Bulut, F. (2018). Nucleation of the 1999 Izmit earthquake by a triggered cascade of foreshocks. Nat. Geosci. 11, 531–535. doi:10.1038/s41561-018-0145-1
Gulia, L., and Wiemer, S. (2019). Real-time discrimination of earthquake foreshocks and aftershocks. Nature 574, 193–199. doi:10.1038/s41586-019-1606-4
Gutenberg, B., and Richter, C. F. (1942). Earthquake magnitude, intensity, energy and acceleration. Bull. Seism. Soc. Am. 32, 163–191. doi:10.1785/bssa0320030163
Hsu, M. T. (1971). Seismicity in Taiwan and some related problems. Bull. Intern. Inst. Seismo. Earthq. Engin. 8, 41–160.
Hsu, M. T. (1961). Seismicity of taiwan (formosa). Bull. Earthq. Res. Inst. Tokyo Univ. 39, 831–847.
Jones, L. M. (1984). Foreshocks (1966–1980) in the san Andreas system, California. Bull. Seism. Soc. Am. 74 (4), 1361–1380.doi:10.1785/BSSA0740041361
Jones, L. M. (1985). Foreshocks and time-dependent earthquake hazard assessment in southern California. Bull. Seism. Soc. Am. 7, 1669–1679. doi:10.1785/BSSA0750061669
Jones, L. M., and Molnar, P. (1979). Some characteristics of foreshocks and their possible relationship to earthquake prediction and premonitory slip on faults. J. Geophys. Res. 84, 3596–3608. doi:10.1029/JB084iB07p03596
Jones, L. M., Wang, B., Xu, S., and Fitch, T. J. (1982). The foreshock sequence of the February 4, 1975, Haicheng earthquake (M=7.3). J. Geophys. Res. 87, 4575–4584. doi:10.1029/jb087ib06p04575
Kato, A., Fukuda, J., Nakagawa, S., and Obara, K. (2016). Foreshock migration preceding the 2016Mw7.0 kumamoto earthquake, Japan: Foreshock migration. Geophys. Res. Lett. 43 (17), 8945–8953. doi:10.1002/2016GL070079
Kim, K. H., Chiu, J. M., Pujol, J., Chen, K. C., Huang, B. S., Yeh, Y. H., et al. (2005). Three-dimensional VP and VS structural models associated with the active subduction and collision tectonics in the Taiwan region. Geophys. J. Int. 162, 204–220. doi:10.1111/j.1365-246x.2005.02657.x
Knopoff, L., Kagan, Y. Y., and Knopoff, R. (1982). b-values for foreshocks and aftershocks in real and simulated earthquake sequences. Bull. Seism. Soc. Am. 72, 1663–1676. doi:10.1785/bssa0720051663
Lin, C. H. (2009). Foreshock characteristics in Taiwan: Potential earthquake warning. J. Asian Earth Sci. 34, 655–662. doi:10.1016/j.jseaes.2008.09.006
Lin, C. H. (2010). Temporal b-value variations throughout a seismic faulting process: The 2008 taoyuan earthquake in taiwan. Terr. Atmos. Ocean. Sci. 21 (2), 229–234. doi:10.3319/TAO.2009.02.09.01(T)
Ma, K. F., Lee, C. T., Tsai, Y. B., Shin, T. C., and Mori, J. (1999). The Chi-Chi, Taiwan earthquake: Large surface displacements on an inland thrust fault. Eos, Trans. AGU 80, 605–611. doi:10.1029/99eo00405
Ma, K. F., Wang, J. H., and Zhao, D. (1996). Three-dimensional seismic velocity structure of the crust and uppermost mantle beneath taiwan. J. Phys. Earth 44, 85–105. doi:10.4294/jpe1952.44.85
McGuire, J. J., Boettcher, M. S., and Jordan, T. H. (2005). Foreshock sequences and short-term earthquake predictability on East Pacific Rise transform faults. Nature 434, 457–461. doi:10.1038/nature03377
McLaskey, G. C. (2019). Earthquake initiation from laboratory observations and implications for foreshocks. J. Geophysi. Res. 124, 12882–12904. doi:10.1029/2019JB018363
Miyamura, S. (1985). The hsinchu-taichung earthquake of April 20, 1935. Proc. Commen. 50th Anniv. Hsinchu-Taichung Earthq. 1935, 18–44.
Molchan, G. M., Kronrod, T. L., and Nekrasova, A. K. (1999). Immediate foreshocks: Time variation of the b-value. Phys. Earth Planet. Inter. 111, 229–240. doi:10.1016/s0031-9201(98)00163-0
Ogata, Y., and Katsura, K. (2014). Comparing foreshock characteristics and foreshock forecasting in observed and simulated earthquake catalogs. J. Geophys. Res. Solid Earth 119, 8457–8477. doi:10.1002/2014JB011250
Ogata, Y., and Katsura, K. (2012). Prospective foreshock forecast experiment during the last 17 years. Geophys. J. Int. 191, 1237–1244. doi:10.1111/j.1365-246x.2012.05645.x
Ogata, Y. (2011). Pre-seismic anomalies in seismicity and crustal deformation: Case studies of the 2007 Noto Hanto earthquake of M6.9 and the 2007 Chuetsu-oki earthquake of M6.8 after the 2004 Chuetsu earthquake of M6.8. Geophys. J. Int. 186, 331–348. doi:10.1111/j.1365-246X.2011.05033.x
Papadopoulos, G. A., Minadakis, G., and Orfanogiannaki, K. (2018). “Short-term foreshocks and earthquake prediction,” in Pre-earthquake processes: A multidisciplinary approach to earthquake prediction studies, geophy. Editors D. Ouzounov, S. Pulinets, K. Hattori, and P. Taylor (American Geophysical Union), 234, 125–147. doi:10.1002/9781119156949.ch8
Papadopoulos, G. A., and Minadakisf, G. (2016). Foreshock patterns preceding great earthquakes in the subduction zone of Chile. Pure Appl. Geophys. 173, 3247–3271. doi:10.1007/s00024-016-1337-5
Papazachos, B. C. (1975). Foreshocks and earthquake prediction. Tectonophys 28, 213–226. doi:10.1016/0040-1951(75)90038-4
Papazachos, B. C. (1974). On certain aftershock and foreshock parameters in the area of Greece. Ann. Geofis. 27, 497–515. doi:10.1007/BF00877298
Peng, H., and Mori, J. (2022). Characteristics of the foreshock occurrence for Mj3.0 to 7.2 shallow onshore earthquakes in Japan. Earth, Planets Space 74, 40. doi:10.1186/s40623-021-01567-1
Rau, R. J., and Wu, F. T. (1995). Tomographic imaging of lithospheric structures under Taiwan. Earth Planet. Sci. Letts. 133, 517–532. doi:10.1016/0012-821X(95).00076-O
Rhoades, D. A., and Evison, F. F. (2004). Long-range earthquake forecasting with every earthquake a precursor according to scale. Pure Appl. Geophys. 161, 47–72. doi:10.1007/s00024-003-2434-9
Riga, G., and Balocchi, P. (2017). How to identify foreshocks in seismic sequences to predict strong earthquakes. Open J. Earthq. Res. 6, 55–71. doi:10.4236/ojer.2017.61003
Rivière, J., Lv, Z., Johnson, P. A., and Marone, C. (2018). Evolution of b-value during the seismic cycle: Insights from laboratory experiments on simulated faults. Earth Planet. Sci. Lett. 482, 407–413. doi:10.1016/j.epsl.2017.11.036
Shin, T. C. (1992). The calculation of local magnitude from the simulated Wood-Anderson seismograms of the short-period seismograms in the Taiwan area. Terr. Atmos. Ocean. Sci. 4 (2), 155–170. doi:10.3319/tao.1993.4.2.155(t)
Scholz, C. H. (2015). On the stress dependence of the earthquake b value. Geophys. Res. Lett. 42, 1399–1402. doi:10.1002/2014GL062863
Seif, S., Zechar, J. D., Mignan, A., Nandan, S., and Wiemer, S. (2019). Foreshocks and their potential deviation from general seismicity. Bull. Seism. Soc. Am. 109 (1), 1–18. doi:10.1785/0120170188
Shin, T. C., and Chang, C. H. (2005). “Taiwan’s seismic observational system,” in The 921 chi-chi major earthquake, office of inter-ministry S&T Program for earthquake and active-fault research. Editors J. H. Wang, C. Y. Wang, Q. C. Sung, T. C. Shin, S. B. Yu, C. F. Shiehet al. (National Savings Certificate, New Delhi, India, 60–82.
Shin, T. C., and Teng, T. L. (2001). An overview of the 1999 Chi-Chi, Taiwan, earthquake. Bull. Seism. Soc. Am. 91, 895–913. doi:10.1785/0120000738
Tsai, Y. B. (1986). Seismotectonics of taiwan. Tectonophys 125, 17–37. doi:10.1016/0040-1951(86)90005-3
Tsai, Y. B., Teng, T. L., Chiu, J. M., and Liu, H. L. (1977). Tectonic implications of the seismicity in the Taiwan region. Mem. Geol. Soc. China 2, 13–41. doi:10.12691/jgg-5-4-1
Wang, J. H. (1998). Studies of earthquake seismology in Taiwan during the 1897−1996 period. J. Geol. Soc. China 41, 291–336.
Wang, J. H. (2021b). A compilation of precursor times of earthquakes in Taiwan. Terr. Atmos. Ocean. Sci. 32 (4), 411–441. doi:10.3319/TAO.2021.07.12.01
Wang, J. H. (2016). A mechanism causing b-value anomalies prior to a mainshock. Bull. Seism. Soc. Am. 106 (1), 1663–1671. doi:10.1785/0120150335
Wang, J. H. (2021a). A review on precursors of the 1999 Mw7.6 Chi-Chi, Taiwan, earthquake. Terr. Atmos. Ocean. Sci. 32 (3), 275–304. doi:10.3319/tao.2021.03.24.01
Wang, J. H. (2019). A review on studies of the 1999 Chi-Chi earthquake for resolving the debatable problems in earthquake physics. Terr. Atmos. Ocean. Sci. 30 (6), 739–756. doi:10.3319/tao.2019.03.26.01
Wang, J. H., Chen, K. C., Leu, P. L., and Chang, C. H. (2015). B-values observations in taiwan: A review. Terr. Atmos. Ocean. Sci. 26 (5), 475–492. doi:10.3319/TAO.2015.04.28.01(T)
Wang, J. H., Chen, K. C., and Lee, T. Q. (1994). Depth distribution of shallow earthquakes in Taiwan. J. Geol. Soc. China 37, 125–142.
Wang, J. H., Chen, K. C., Leu, P. L., and Chang, C. H. (2016). Precursor times of abnormal b-values prior to mainshocks. J. Seismol. 20 (3), 905–919. doi:10.1007/s10950-016-9567-7
Wang, J. H. (1992). Magnitude scales and their relations for taiwan earthquakes: A review. Terr. Atmos. Ocean. Sci. 3, 449–468. doi:10.3319/tao.1992.3.4.449(t)
Wang, J. H., and Miyamura, S. (1990). Comparison of several instrumentally determined magnitude scales for Taiwan earthquakes (1900−1978). Proc. Geol. Soc. China 33, 89–109.
Wang, J. H. (1989). The taiwan telemetered seismographic network. Phys. Earth Planet. Inter. 58, 9–18. doi:10.1016/0031-9201(89)90090-3
Wang, J. H. (1988). b values of shallow earthquakes in Taiwan. Bull. Seismol. Soc. Am. 78, 1243–1254. doi:10.1785/BSSA0780031243
Wang, J. H., Wang, C. Y., Song, Q. C., Shin, T. C., Yu, S. B., Shieh, C. F., et al. (2005). “The 921 chi-chi major earthquake,” in Office of inter-ministry science & technology Program for earthquake and active-fault research (Taipei, Taiwan: National Science Council), 582.
Wang, K., Chen, Q. F., Sun, S., and Wang, A. (2006). Predicting the 1975 haicheng earthquake. Bull. Seism. Soc. Am. 96 (3), 757–795. doi:10.1785/0120050191
Wetzler, N., Lay, T., and Brodsky, E. E. (2023). Global characteristics of observable foreshocks for large earthquakes. Seismol. Res. Lett. 1, 1–13. doi:10.1785/0220220397
Wu, B. S., and McLaskey, G. C. (2022). Testing earthquake nucleation length scale with pawnee aftershocks. Seismol. Res. Lett. 93, 2147–2160. doi:10.1785/0220210184
Wu, F. T. (1978). Recent tectonics of taiwan. J. Phys. Earth (Suppl.) 26, S265–S299. doi:10.4294/jpe1952.26.supplement_s265
Wu, K., Yue, M., Wu, H., Cao, X., Chen, H., Huang, W., et al. (1976). Certain characteristics of Haicheng earthquake (M=7.3) sequence. Acta geophys. Sin. 19, 109–117.
Xu, S. X., Wang, B. Q., Jones, L. M., Ma, X. M., and Shen, P. W. (1982). The foreshock sequence of haicheng earthquake and earthquake swarm—The use of foreshock sequences in earthquake prediction. Tectonophys 85, 91–105. doi:10.1016/0040-1951(82)90079-8
Yeh, Y. T., Liu, C. C., and Wang, J. H. (1989). Seismic networks in taiwan. Proc. Natl. Sci. Coun., ROC 13, 23–31.
Yoon, C. E., Yoshimitsu, N., Ellsworth, W. L., and Beroza, G. C. (2019). Foreshocks and mainshock nucleation of the 1999Mw7.1 hector mine, California, earthquake. J. Geophys. Res. 124, 1569–1582. doi:10.1029/2018JB016383
Keywords: mainshock, foreshock, earthquake magnitude, epicentral distance, hypocentral distance, focal depth, time interval
Citation: Chen K-C, Kim K-H and Wang J-H (2023) On the correlations between the largest foreshocks and mainshocks of earthquake sequences in Taiwan. Front. Earth Sci. 11:1233487. doi: 10.3389/feart.2023.1233487
Received: 02 June 2023; Accepted: 24 July 2023;
Published: 04 August 2023.
Edited by:
Nicola Alessandro Pino, National Institute of Geophysics and Volcanology (INGV), ItalyReviewed by:
Angelo De Santis, National Institute of Geophysics and Volcanology (INGV), ItalyChas Bolton, The University of Texas at Austin, United States
Copyright © 2023 Chen, Kim and Wang. This is an open-access article distributed under the terms of the Creative Commons Attribution License (CC BY). The use, distribution or reproduction in other forums is permitted, provided the original author(s) and the copyright owner(s) are credited and that the original publication in this journal is cited, in accordance with accepted academic practice. No use, distribution or reproduction is permitted which does not comply with these terms.
*Correspondence: Kou-Cheng Chen, Y2hlbmtjQGVhcnRoLnNpbmljYS5lZHUudHc=