 Ines Bruns
 Alexander Bartholomä2
 Francine Menjua
- 1Department of Geosciences, University of Bremen, Bremen, Germany
- 2Department of Marine Research, Senckenberg am Meer, Wilhelmshaven, Germany
- 3MARUM-Center for Marine Environmental Sciences, University of Bremen, Bremen, Germany
Bottom trawling is a well-known global phenomenon and has significant physical impact on the seabed habitat, such as compression, displacement and mobilization of the sediment. Thus, it is necessary to examine how it alters the seabed, e.g., in order to support strategies in marine spatial planning and nature conservation. Numerous studies aim at quantifying the physical impact of bottom trawling on the seabed based on laboratory experiments and/or modeling approaches but, to our knowledge, none of them include in-situ techniques. The North Sea is heavily influenced by bottom trawling and thus, an area in the southern North Sea was selected where side scan sonar data identified areas showing the physical impact of bottom trawling by means of trawl marks. Here, the dynamic penetrometer Nimrod was deployed in order to determine the changes in sediment strength (quasi-static bearing capacity) compared to the reference sites (absent trawl marks). The results attest a higher penetration depth of Nimrod and a lower sediment strength in the trawled area compared to the un-trawled reference sites. This is likely related to an increase in water content and a decrease in bulk density of the sediment that was re-worked by bottom trawling.
1 Introduction
Bottom trawling is one of the most widespread human impacts on the seabed and relevant on a global scale (Oberle et al., 2016a; Amoroso et al., 2018). Besides reduced populations of target species due to overexploitation, intensive bottom trawling can increase the damage and mortality of non-target benthic fauna caused by the bypassing trawling gear (e.g., Lindeboom and de Groot, 1998; Buhl-Mortensen et al., 2016; Mérillet et al., 2017). The gear itself may weigh up to several tons (Eigaard et al., 2016). The impact on the soft, porous seabed surface and subsurface induced by the trawling gear represents an additional, severe disturbance to the natural forcing by waves and currents on benthic species, in particular species with a long-life span that require longer recovery times (Sciberras et al., 2018). For species in the southern North Sea (Frisian Front), it was found that fragile, small-bodied infauna like the white furrow shell (Abra alba) and epifauna are more vulnerable to the impact of bottom trawling than large-bodied infauna, e.g., the burrowing mud shrimp Upogebia deltaura (Tiano et al., 2020). Moreover, bottom trawling can alter the seabed in terms of removal of bedforms such as ripples as well as displacement, compression and re-suspension of the sediment (e.g., Ivanović and O'Neill, 2015; Lindholm et al., 2015; Depestele et al., 2016; Arjona-Camas et al., 2019). Sediment with reduced stability, e.g., due to bioturbation, is more likely to get re-suspended by bottom trawling (O'Neill and Ivanović, 2015), and hence may hamper benthic habitability for several populations (Lindeboom and de Groot, 1998; Depestele et al., 2016).
The alteration of the seabed is visible as linear morphological depressions (trawl marks) in side scan sonar (SSS) and multibeam echo sounder (MBES) data as well as in under-water video footage (e.g., Friedlander et al., 1999; Smith et al., 2007; Mérillet et al., 2018; Bruns et al., 2020; Schönke et al., 2022). Trawl marks have widths of a few decimeters up to several meters and the gear can penetrate <10 cm up to 35 cm into the seabed (e.g., Krost et al., 1990; Friedlander et al., 1999; Eigaard et al., 2016; Bruns et al., 2020). The dimensions of trawl marks depend on the gear type (e.g., beam trawl, otter trawl) and the sediment type. Larger gears produce wider marks, for instance, the width of beam trawls usually is between 4 and 12 m, which is reflected by trawl marks of the same width (e.g., Eigaard et al., 2016; Bruns et al., 2020). In contrast, the two otter boards of otter trawls create narrow furrows (approximately 30 cm to 3 m) separated according to the distance between the otter boards, which can be up to 250 m (e.g., Eigaard et al., 2016; Bruns et al., 2020). Due to a higher weight also the penetration depth increases (Eigaard et al., 2016) and, for example, a 4 m wide beam trawl would penetrate less deep compared to a 12 m wide gear. In muddy sediments the penetration depth is usually higher than in coarser sediments such as fine sand (Ivanović et al., 2011; Eigaard et al., 2016). The backscatter signature of trawl marks shows that reworking of the sediment (displacement, compression, re-suspension) can lead to an increased roughness of the seabed compared to the surrounding, depending on the sediment type and the state of degradation of the trawl marks (Bruns et al., 2020).
For other areas, it has been shown that intensive bottom trawling can influence erosion and sedimentation rates. For the Western Irish Sea Mud Belt, Coughlan et al. (2015) showed that the upper 20–50 cm of the sedimentary record (approximately the last 20 years) were eroded due to high bottom trawling activity. In two submarine canyons off the Italian south coast where the material that was re-suspended by bottom trawling is deposited, an increased sedimentation up to one order of magnitude was observed (Paradis et al., 2021).
Moreover, bottom trawling may alter the integrity of the near surface sediment layers (O'Neill and Ivanović, 2015), by destroying biogenic structures such as tubes or mounds (Schwinghammer et al., 1998). The upper layers are more likely to be mobilized or eroded, respectively, which in turn could lead to the mobilization of deeper layers (O'Neill and Ivanović, 2015). Long term bottom trawling and the related re-suspension of the seabed sediment can cause significant changes in the grain size distribution: The sediment consisting of fine and coarser fractions is re-suspended and if a significant sediment transport (e.g., due to waves and currents) is absent, the fine grained material settles directly within the trawled area on top of the coarser fraction, which was deposited first. Thus, the vertical grain size distribution changes in terms of a relative increase of the fine fraction on the seabed surface (Trimmer et al., 2005). If tides and currents are strong the fine grained re-suspended material is transported into adjacent areas, which leads to a decrease of the fine-grained fraction in the trawled area (Palanques et al., 2014; Mengual et al., 2016).
If bottom trawling was relevant for sediment re-mobilization and changes in the physical properties of the sediment (e.g., grain size) this would also be reflected by geotechnical properties such as sediment strength and its resistance to mobilization. Studies that investigated the influence of bottom trawling on geotechnical properties, and therefore the physical impact with the help of experimental and modeled data, are available (e.g., Paschen et al., 2000; Ivanović et al., 2011; Ivanović and O’Neill, 2015), but there is a lack of in-situ data for the support of those findings. Stark et al. (2011b) detected sediment mobilization by using the dynamic penetrometer Nimrod, where mobilization is manifested by a layer with lower sediment strength above a stronger layer in the penetrometer data. Following this, the question arises if the physical impact of bottom trawling can be described, and even quantified, by means of vertical and lateral variations in the sediment strength using in-situ techniques such as Nimrod deployments.
Along this line of reasoning, geotechnical in-situ measurements of the sediment strength were performed in the southwestern German North Sea using the dynamic free-fall penetrometer Nimrod, which was developed at MARUM, University of Bremen (Stark, Hanff, 2011a; Stark et al., 2011b; Stark et al., 2012). At the time of the survey, the spatial trawl mark density (abundance) in the north western part of the survey area was relatively high, i.e., up to 20 marks per km2 and very recent trawling activity was detected (Bruns et al., 2020). With the experiences of the former studies, it was assumed that sediment mobilization triggered by the high trawl mark activity can be demonstrated by means of the dynamic free-fall penetrometer Nimrod. For comparison, an area without trawl marks was sampled as well. In the past, Stark et al. (2011b) used the dynamic penetrometer Nimrod to show sediment mobilization due to tides and currents in the German Bight. However, it is a completely new approach to connect in-situ sediment strength data to bottom trawling impact, as will be demonstrated in this manuscript.
2 Material and methods
2.1 Study site
The study site (hereafter referred to as HE544 site, named after the expedition number of R/V Heincke, a 55 m-long research vessel operated by AWI Bremerhaven; https://www.portal-forschungsschiffe.de/en/vessels-heincke.html) is located in the southern North Sea and the western German Exclusive Economic Zone (EEZ, Figure 1). Surface sediments in the German EEZ predominantly consist of Pleistocene glacial and periglacial deposits, which were reworked during the Holocene after the area was flooded around 9,000–8,000 BP (Eisma et al., 1981; Zeiler et al., 2008). Sediment types are mainly fine to medium sand and muddy sand to sandy mud occurs south of the island Heligoland or in the western German Bight (Laurer et al., 2014). The survey HE544 was conducted in 2019 approximately 50 nautical miles north of the German coast where the water depth ranged around 39–42 m (Figure 1). Hydrodynamics are mainly tide driven in the coastal areas, but rather wave driven in offshore areas (Aldridge et al., 2015). HE544 site is located in the wave driven area and the kinetic energy at the seabed is approximately 40–60 Nm2/s (EMODnet, 2019). The sediment type at HE544 was classified as “muddy sand to fine sand” (Holler et al., 2020). It is homogeneously distributed across the HE544 site (Holler et al., 2020). Surface sediment samples are devoid of gravel with a small proportion of shell fragments (<2%). The mud content ranges from 3%–10% in the northern and western part of the site and up to 20% in the remaining area (Bruns et al., 2020; Holler and Bruns, 2020).
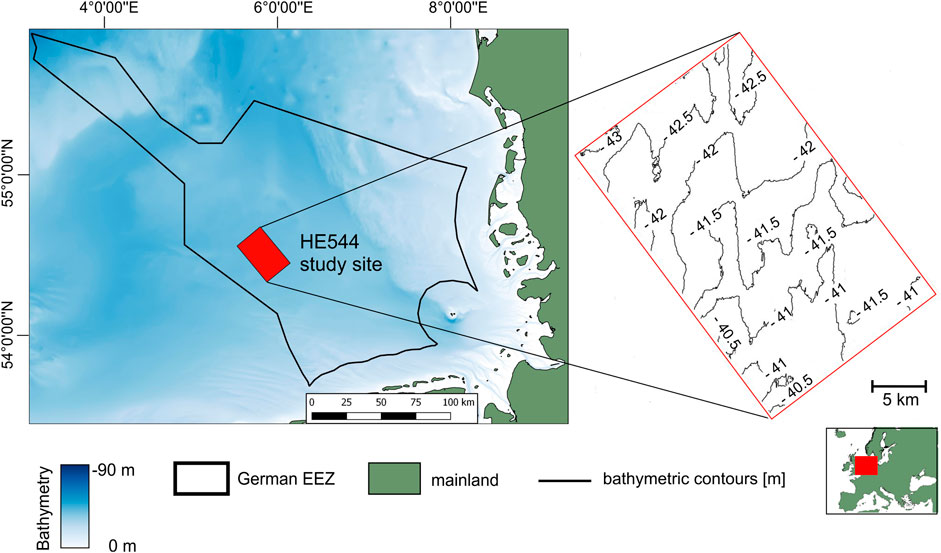
FIGURE 1. The HE544 study site in the German Exclusive Economic Zone (EEZ), North Sea. The site is approximately 60 nautical miles off the coast of Lower Saxony, Germany. Bathymetry is provided by EMODnet-Bathymetry-Consortium (2018).
The fine sediments are colonized by large populations of benthic organisms such as the brown shrimp (Crangon crangon) or flatfish, such as sole (Solea solea). Bottom trawling in the German EEZ (North Sea) is mostly related to smaller vessels operating in coastal areas to catch, e.g., the brown shrimp (Schulze, 2018). The fishing effort made by larger trawlers, targeting flat-fish such as sole (S. solea) or plaice (Pleuronectes platessa) is less in comparison and takes place farther offshore, i.e., outside the 12-nautial-mile-zone (Schulze, 2018). These trawlers commonly use beam trawls and otter trawls (Schulze, 2018). The corresponding trawl marks were observed in SSS and MBES data on the seabed of HE544 site (Bruns et al., 2020). Marks created by the individual beam trawls had mean widths of approximately 11 m, and because they are towed in pairs the total width was approximately 40 m [Figure 2A; see also Bruns et al. (2020)]. In contrast, otter trawls have no fixed width over the course of one haul as they have no rigid beam to open the net. Instead, they have otter doors attached to the trawl rig, which are diverging according to towing speed (Figure 2B). As seen, mouth sizes of otter trawls ranged between 30 and 280 m and the marks created by the otter boards were ca. 3 m wide (Bruns et al., 2020).
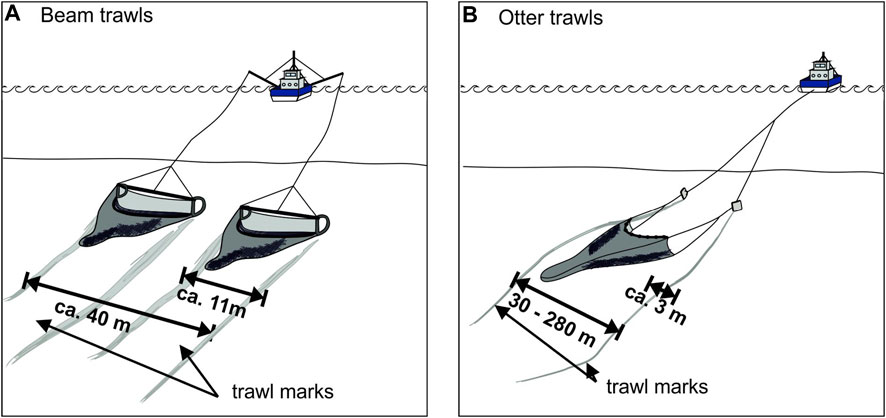
FIGURE 2. Schematic sketch of the trawl gear and the corresponding trawl marks, which were observed in the side scan sonar data of the study site [modified after Bruns et al. (2020)]. (A) Beam trawls are towed in pairs and the trawl marks have an individual width of 11 m and a total width of 40 m on average (Bruns et al., 2020). (B) Otter trawls produce individual trawl marks of approximately 3 m width and the total width ranges from 30 to 280 m because the distance between the two otter boards is variable (Bruns et al., 2020).
2.2 Data acquisition
The survey for this study was conducted with R/V Heincke from 14th to 30th October 2019 in the southern North Sea (Figure 1). The overall aim of the cruise was to extend the mapping in the course of the German national mapping program “SedAWZ” and to examine anthropogenic seabed features by means of trawl marks (Holler and Bruns, 2020).
2.2.1 Sediment samples
During expedition HE544, 15 surface sediment samples were obtained (Figure 3A). A Shipek grab was used, and the samples were analyzed for grain size distribution. GRADISTAT was used to calculate the sorting, skewness and kurtosis of the sediments (Blott and Pye, 2001). The following procedure was applied to the samples (see also Bruns et al., 2020): (i) decalcification with hydrochloric acid, (ii) removal of organic carbon with hydrogen peroxide, (iii) separation of the mud and sand fraction via wet sieving, (iv) the grain sizes of the dried sand fraction were determined from settling velocities by means of a settling tube, (v) for the mud fraction X-ray transmission time series were measured using a Micrometrics Sedigraph particle analyzer.
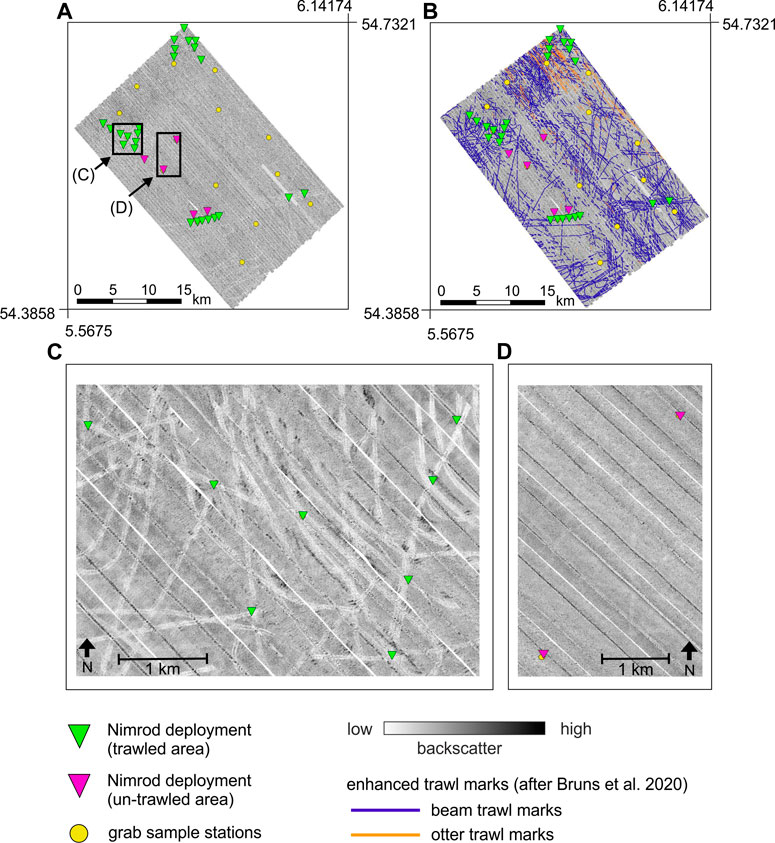
FIGURE 3. (A) Side scan sonar (SSS) mosaic of the HE544 study site with the grab sample stations (yellow circles) and the Nimrod deployment stations on trawled (green triangles) and un-trawled (pink triangles) areas. The trawled areas are characterized by multiple linear features, i.e., trawl marks, which appear with a lower backscatter intensity compared to the background. (B) The same SSS mosaic with enhanced (manually mapped) trawl marks (beam trawls and otter trawls). For details concerning the mapping of trawl marks see Bruns et al. (2020). (C) Zoom-in of a trawled area as an example. Nimrod penetrated the seabed directly within trawl marks. (D) Zoom into an un-trawled area as an example. Trawl marks are mostly absent; however, some trawl marks are still indistinctly visible in between the deployment stations.
2.2.2 Hydroacoustic survey
The SSS mosaics that were acquired during the survey HE544 were used to map the sediment type as well as the trawl marks (Bruns et al., 2020). On the basis of these existing mosaics, the sample locations for the in-situ measurements with the dynamic free-fall penetrometer Nimrod were identified. The respective SSS data were recorded from 15th to 18th and 20th to 24th October 2019. The towed SSS dual frequency system KLEIN4000 (100 and 400 kHz) was operated with 400 m swath (100% coverage of the area without overlap) and approximately 5 knots towing speed (ca. 2.5 m/s), resulting in an across-track resolution of 9.6 and 2.4 cm, respectively. Data acquisition was performed with SonarPro14 and data processing with SonarWiz7.01. The post-processing included the following steps: (i) slant range correction, (ii) empirical gain normalization, (iii) de-stripe filtering, (iv) layback-correction and the resulting mosaic has a resolution of 1 m as described by Bruns et al. (2020).
At the HE544 site, trawl marks were abundant: Bruns et al. (2020) calculated them to be up to 20 marks per km2 and described the trawl marks as distinctly visible in the SSS mosaic, indicating recent bottom trawling activity. Since this measure neglects the length and width of the trawl marks, it does not reflect the area that was affected by trawling but is used as an estimate of the abundance of trawl mark and thus fishing activity in this study. Beam trawl marks were distributed across the whole study site, while otter trawl marks were present only in the northeastern part of the site (Bruns et al., 2020). Moreover, Bruns et al. (2020) observed fishing vessels operating simultaneously to the SSS survey operations. Thus, it is very likely that sediment mobilization took place recently and/or at the time of the HE544 data acquisition. The trawl marks form a mesh-like pattern (Figures 3A, B) and due to their clarity in the georeferenced SSS-mosaic, this data were suitable to serve as a base to select stations for Nimrod deployments in the trawled areas (Figure 3C) and the un-trawled areas (Figure 3D).
2.2.3 Nimrod dynamic free-fall penetrometer
2.2.3.1 General description and sampling set up
With the dynamic free-fall penetrometer Nimrod, the deceleration of the device during the shallow sub-seabed is measured together with pore pressure and tilt variations during profiling. From these parameters the quasi-static bearing capacity can be derived, which is a measure for sediment strength (e.g., Stark et al., 2011b). SSS backscatter data were combined with the penetrometer data to examine if trawling causes alteration of the seabed in terms of differences in sediment strength. The dynamic free-fall penetrometer Nimrod was developed at the research center “MARUM—Center for Marine Environmental Sciences” (University of Bremen). It is operated under free-fall conditions as its speed is not limited to the speed of the winch and the weight of the cable as with conventional penetrometers (e.g., cone penetration testing, CPT). Nimrod is attached to a tether and can be deployed manually in shallow water environments of up to 200 m water depth (Stark et al., 2011a; Stark et al., 2011b; Stark et al., 2012). The main body consists of a cylindrical aluminum case housing the sensors and memory card. Fins are attached to the tail (Figure 4) and the relation of the center of mass to the center of volume allows a stabilized deployment of the device even if waves and currents are present. The diameter of the device is 0.11 m and the sampling rate is 1 kHz (Stark et al., 2011a; Stark et al., 2011b; Stark et al., 2012). The weight of Nimrod is 13–16.6 kg and depends on which frontal end is used; hemispheric or conical tips with different opening angles are available (Stark et al., 2011a; Stark et al., 2011b; Stark et al., 2012). Stark et al. (2011b) achieved penetration depths of ca. 10 cm and below in sandy North Sea sediments using the conical tip with 60° opening angle. The estimated penetration depth of the trawl gear is ≥10 cm (Eigaard et al., 2016; Bruns et al., 2020) and therefore, a conical tip with a narrower opening angle of 25° (0.2 m length and 16.6 kg total weight of Nimrod) was manufactured for this study in order to achieve higher penetration.
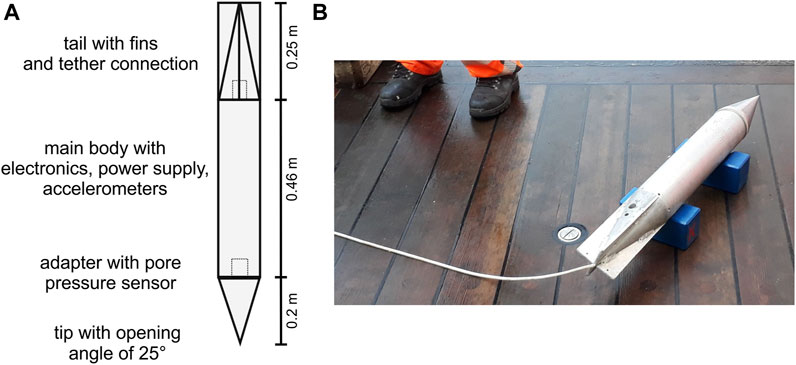
FIGURE 4. (A) Schematic drawing of Nimrods design [modified after Stark et al. (2009)]. Four tip geometries are available and for this study, a conical tip with 25° opening angle was used. (B) Nimrod onboard R/V Heincke. A tether with small buoyancy was attached to Nimrod in order to prevent disturbances during the free fall.
For this study, the Nimrod deployments were carried out on the 18th, 20th, and 24th October 2019 during expedition HE544 and 24 Nimrod deployments were successfully performed on beam trawl marks that were identified from SSS data (Figures 3A, C). For comparison, 5 deployments were conducted in an area that showed no trawl marks in the SSS data (Figures 3B, D) and therefore was classified as un-trawled. However, due to the high spatial density of trawl marks it was challenging to position the deployments outside of trawl marks. Thus, a smaller number of reference deployments were preferred over including those that strike edges of trawl marks. Because of the small dimensions (approximately 3 m) of the otter board marks (Bruns et al., 2020), it was decided not to directly target them with Nimrod. In contrast, beam trawl marks have a mean width of 11 m (Bruns et al., 2020) and are therefore less difficult to target. However, the impact of otter trawls might contribute to signals the Nimrod data in areas where both kinds of trawl marks were present (northernmost part of the study site, Figure 3B). Otter trawl marks had a lower spatial density (abundance) of 5 marks per km2 maximum compared to beam trawl marks with up to 20 marks per km2 in that area (Bruns et al., 2020). In order to ensure that Nimrod penetrates the beam trawl marks, deployments were profiled across parts of HE544 site where they appeared in dense mesh-like patterns (Figure 3B). The sample locations were determined by means of a high accuracy DGPS.
2.2.3.2 Data processing
In contrast to conventional CPT probes, which have strain gauges to measure sleeve friction and cone resistance, Nimrod measures deceleration, tilt and pore pressure from which the sediment strength expressed as quasi-static bearing capacity is derived. The quasi-static bearing capacity varies over the penetration depth of each individual deployment. It increases with depth until the maximum is reached and Nimrod is not able to penetrate further into the sediment. The data processing was performed following the procedure presented by Stark et al. (2011a), Stark et al. (2011b), and Stark et al. (2012).
The bearing capacity
This includes cohesion
The bearing capacity is expressed by the sediment resisting force, because it describes the maximum resistance force of the sediment (or a sediment layer), which it can bear until it fails and the probe continues penetrating (Terzaghi, 1943; Das, 1990; Aubeny and Shi, 2006).
A is the horizontal area on which the load is applied and
In this case, the mass of Nimrod
The dynamic penetrometer Nimrod decelerates during penetration, which leads to a strain dependency and therefore the strain-rate factor
It includes the actual velocity of penetration v and the reference velocity
The dynamic sediment resistance force
The optimization of the strain rate correction for high velocity impact penetrometers is still a subject of research (Lucking et al., 2017; Roskoden, 2020). For further details on the dynamic penetrometer Nimrod and the respective data processing and calculations, see Stark et al. (2011a), Stark et al. (2011b), and Stark et al. (2012).
3 Results
3.1 Grain size analysis
For this study, the grain size distribution of the samples obtained by Bruns et al. (2020) was examined further by means of statistics. All samples show an unimodal distribution with modes between 2.5 and 3 ϕ (Figure 5A). The mud content (>4 ϕ) ranges between 3% and 20%. The statistical analysis shows that the samples are well to very poorly sorted (σ1 between 0.4 and 2.4 ϕ), very fine skewed (Sk1 between 0.2 and 0.8) and extremely leptokurtic (KG > 3). The classifications are based on Folk and Ward (1957). The Nimrod deployments were carried out in areas where the mud content was below 15% (Figure 5B) and thus, the sediment there is well to moderately sorted.
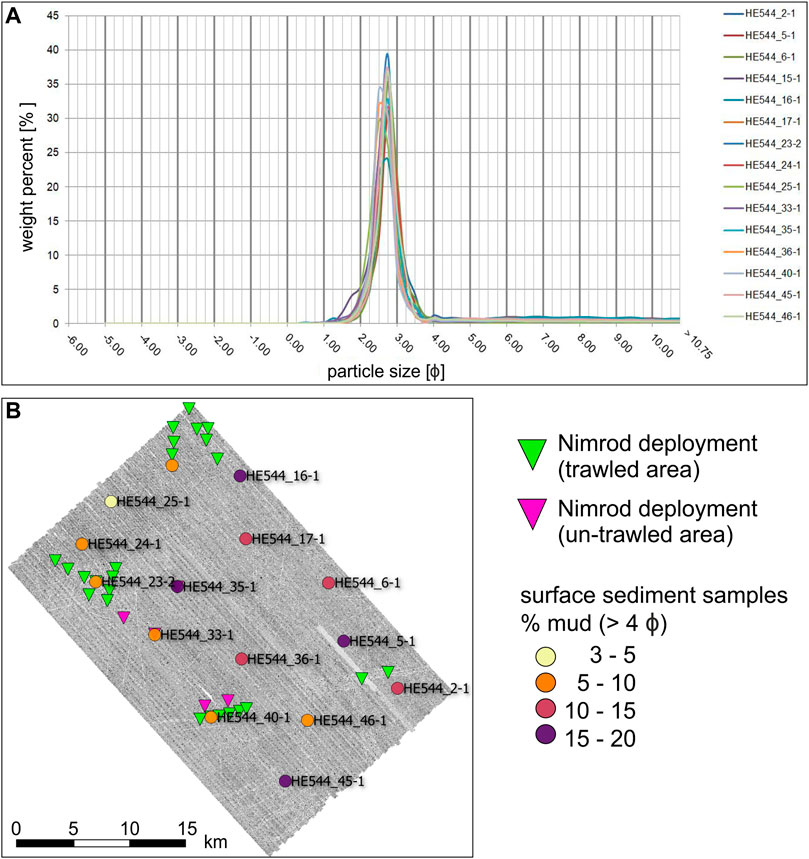
FIGURE 5. The grain size distribution at HE544 site. (A) The samples show an unimodal distribution with modes between 2.5 and 3 ϕ. The mud content (>4 ϕ) ranges between 3% and 20%. The statistical analysis shows that the samples are well to very poorly sorted (σ1 between 0.4 and 2.4 ϕ), very fine skewed (Sk1 between 0.2 and 0.8) and extremely leptokurtic (KG > 3). (B) The Nimrod deployments were carried out in areas where the mud content was below 15%.
3.2 Penetrometer data
The maximum penetration depth (penmax) and the maximum quasi-static bearing capacity (qsbcmax) were determined for each Nimrod deployment. From penmax and qsbcmax, the mean values (penmaxM and qsbcmaxM) were calculated for each area (trawled and un-trawled) at HE544 site: for the un-trawled area (Figure 6A; Table 1) qsbcmax ranges between 58.92 ± 8.84 and 127.3 ± 19.1 kPa (qsbcmaxM = 77.7 ± 11.67 kPa). For the trawled area (Figure 6B; Table 1) qsbcmax is between 7.89 ± 1.18 and 109.1 ± 16.4 kPa (qsbcmaxM = 58.6 ± 8.8 kPa). The value penmax varies between 0.04 mbsf (meters below seafloor) and 0.39 mbsf (mean 0.18 mbsf) regarding the un-trawled area (Figure 6A; Table 1). The trawled area (Figure 6B; Table 1) shows a range in penmax of 0.02 mbsf up to 0.72 mbsf (penmaxM 0.31 mbsf). At un-trawled stations, qsbcmaxM is higher compared to trawled stations, which corresponds to the lower penmaxM.
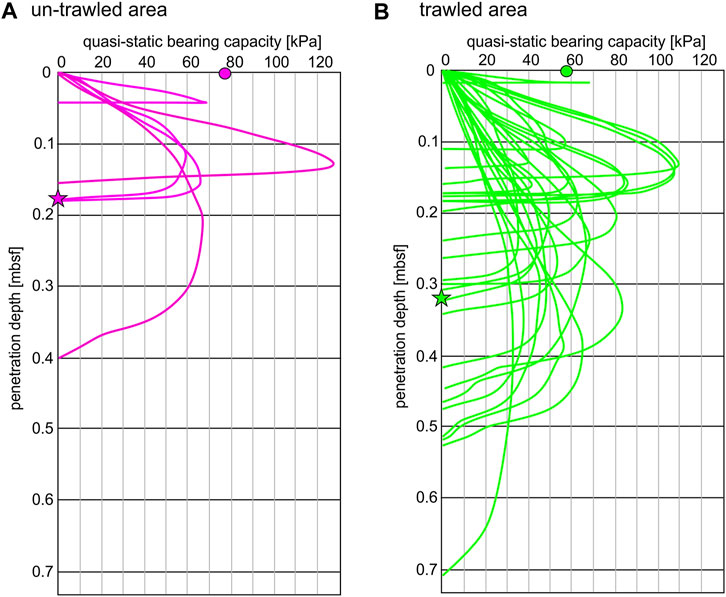
FIGURE 6. Penetration depth (mbsf = meters below seafloor) plotted against the quasi-static bearing capacity (kPa) derived from Nimrod measurements. In general, the quasi-static bearing capacity increases with depth until the maximum is reached and the penetrometer is not able to penetrate further into the seabed. (A) In the un-trawled area, lower penetration depths and higher quasi-static bearing capacities were obtained compared to the trawled area (B). The mean maximum penetration depth of un-trawled stations [(A), pink star, 0.18 mbsf] is roughly half as low as the mean maximum penetration depth observed at trawled stations [(B), green star, 0.31 mbsf]. The mean maximum quasi-static bearing capacities are 77.7 ± 5.8 kPa [(A), pink circle] and 58.6 ± 4.4 kPa [(B), green circle].
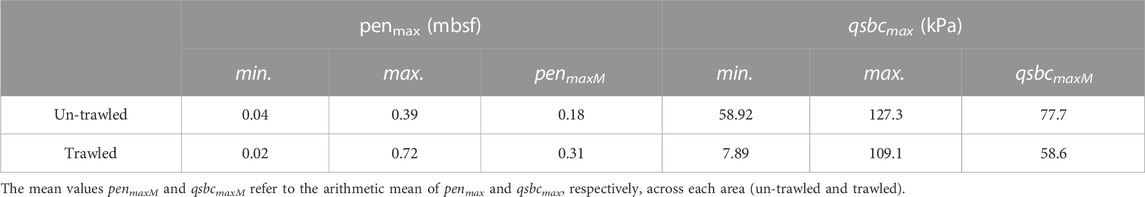
TABLE 1. Maximum penetration depth penmax in mbsf (meters below seafloor) and the maximum quasi-static bearing capacity qsbcmax in kPa (please note an uncertainty of 15%) measured with the dynamic free-fall penetrometer Nimrod in the un-trawled and the trawled area of the HE544 site.
The individual Nimrod deployments can be divided into three clusters (I-III) and two isolated deployments (Figure 7A). The values penmax and qsbcmax were averaged (arithmetic mean) over each cluster (Figures 7B–D). In cluster I, the mean penmax of 0.38 mbsf and the mean qsbcmax of 63.63 ± 9.54 kPa were the highest (Figure 7B). The mean penmax in cluster I is similar to penmaxM of the trawled area (Table 1) and the mean qsbcmax in cluster I is slightly higher than qsbcmaxM in the trawled area (Table 1). Cluster II shows a lower mean penmax of 0.22 mbsf and a similar mean qsbcmax of 60.15 ± 9.02 kPa like cluster I (Figure 7C). The mean penmax of cluster II is rather in the range of penmaxM of the un-trawled area (Table 1), but the mean qsbcmax observed in cluster II is still comparable to qsbcmaxM of the trawled stations (Table 1). The southern cluster III shows a similar mean penmax of 0.36 mbsf like cluster I, but an even lower mean qsbcmax of only 41.86 ± 6.28 kPa (Figure 7D). The mud content derived from surface sediment samples is between 6.5% and 9% across the clusters (Figures 7B–D).
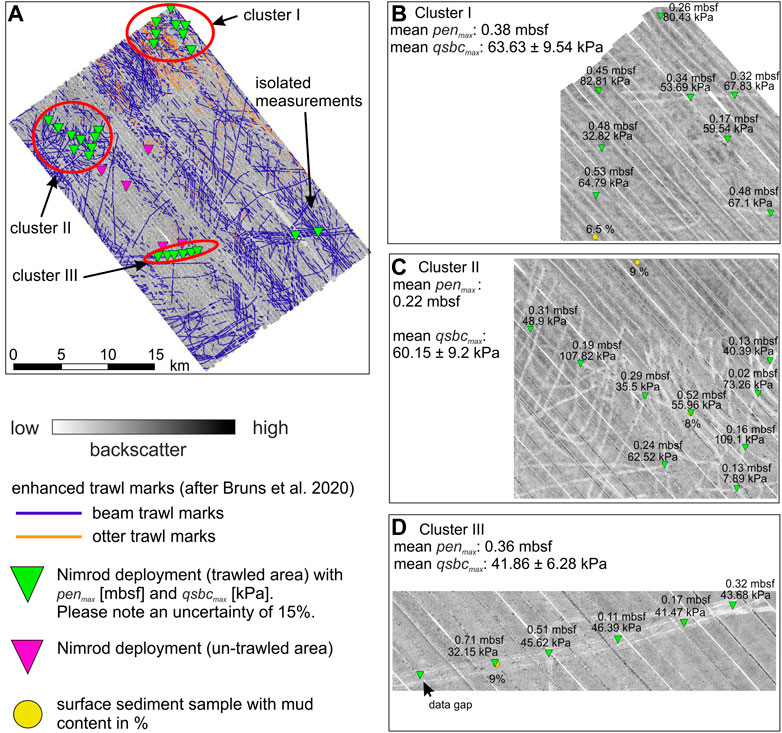
FIGURE 7. (A) The Nimrod deployments in the un-trawled (pink triangles) and in the trawled area (green triangles) can be divided into three clusters. (B–D) The values penmax (in meters below seafloor, mbsf) and qsbcmax (kPa) of each individual deployment are shown as well as the mean penmax (cluster I: 0.38 mbsf, cluster II: 0.22 mbsf and cluster II: 0.36 mbsf) and mean qsbcmax (cluster I: 63.63 ± 9.54 kPa, cluster II: 60.15 ± 9.02 kPa, cluster II: 41.86 ± 6.28 kPa) of each cluster. The mud content is between 6 .5% and 9% (yellow circles) throughout the three clusters.
4 Discussion
The quasi-static bearing capacity of the sediment denotes the maximum load per unit area that the soil can bear prior to failure and is an expression for sediment strength. In the un-trawled area, qsbcmaxM is 77.7 ± 11.67 kPa and penmaxM is 0.18 mbsf, whereas it is 58.6 ± 8.8 kPa and 0.31 mbsf, respectively, in the trawled area (Table 1). Thus, there is a difference of roughly 20 kPa and 0.2 m between what is assumed to be unaffected sediment (un-trawled) and what is considered as recently mobilized sediment (trawled). Using the Nimrod penetrometer, Stark et al. (2009) identified mobilized sediment in a tidal channel in northern Germany, and Stark and Kopf (2011) documented mobile sediment at a wind turbine test site (Alpha Ventus site), approximately 40 nautical miles south of HE544 site. However, in both studies, the authors used a different tip for Nimrod (60° opening angle) and thus, only the relative quasi-static bearing capacity values are compared here: Sediments that are more consolidated have values that are around 10–40 kPa higher than more consolidated sediments, which is in agreement with the data presented in this study.
The very high values of qsbcmax >100 kPa observed at three deployment stations at HE544 (Figure 6) site may reflect shelly layers or other resistant materials with high sediment strength which are possibly located a few centimeters to a decimeter below the seabed surface and hindered the probe to penetrate deeper. This would also explain the rather low penetration depths (penmax) of 0.1–0.2 mbsf at the three stations. However, this is a speculative assumption because the sediment sampling by means of a Shipek grab was not suitable for certainly determining stratification of the sediment. For such investigations, a box-corer may be more adequate. From the Shipek samples no obstacles or shelly layers were retrieved at stations proximal to the Nimrod deployments. Shell fragments were present, however, only with a low proportion (<2%) and not in the form of layers.
The HE544 results shown here suggest, that the penetration depth is higher, and the quasi-static bearing capacity is lower in areas where bottom trawling took place shortly before and/or parallel to the survey compared to areas where trawl marks were absent, i.e., trawling never happened or took place further in the past. However, reduced sediment strength (=quasi-static bearing capacity) of natural origin such as reworking by currents and waves, lateral changes in sediment type or bioturbation have to be considered: The water depth at the HE544 site ranges between 39 m and 42 m and morphological change is absent (Figure 1). This is also reflected by the uniform distribution of the sediment type inferred from the sediment samples and the SSS data, which was also described by Holler et al. (2020) and Holler and Bruns (2020). Reworking by waves is therefore evenly distributed across the study area, whereas the influence of tidal currents appears limited in extend compared to wave driven reworking (Aldridge et al., 2015). At HE544 site, modelled mean shear stress by currents is below 0.12 Nm−2 and mean shear stress by waves is smaller than 0.25 Nm−2 (Bockelmann et al., 2018). Thus, sediment transport and reworking occurs only under heavy weather conditions when the effective wave-base reaches the seabed. According to Son et al. (2012) and Flemming (2005), the effective wave-base reaches a seabed at a few tens of meters water depth only under stormy conditions (e.g., at 28 m during a storm with a significant wave height of 2.4 m and a wave period of T = 6 s). According to the FINO1 wave observation platform, During the SSS survey and the subsequent Nimrod deployments, the significant wave height was ≤1.5 m and barely exceeded 2.5 m (wave periods between 5 and 6 s) only on the 19th of October 2019 (BSH, 2023). Considering the water depth of 39–42 m at the study site, it is unlikely that the effective wave base reached the seabed under such conditions. In the week before the survey, the significant wave height was between 2.5 and 3.5 m on 10th and 11th October (BSH, 2023). However, if sediment would have been mobilized during this period, it is assumed that it would have occurred uniformly across the study site. The SSS backscatter data presented here (Figure 3A) do not show any bedforms, which agrees with Aldridge et al. (2015), who concluded that a disturbance of the seabed in the upper 5 cm by waves may occur a few days per year in the sea area of HE544 site. Therefore, it is assumed that re-working by currents and waves has played (and plays) a minor role throughout the HE544 site.
The analysis of the grain size distribution shows that the main sediment component is fine sand, and that the mud content as a secondary component varies across the study area (Figure 5B). However, it is evenly distributed in the trawled areas (6%–9%). In the un-trawled areas, similar quasi-static bearing capacities are measured at sediment sample stations with different mud content. For example, Nimrod stations 34-1 (16% mud, sediment sample 35-1) and 32-1 (7% mud, sediment sample 33-1) both show a quasi-static bearing capacity of roughly 65–70 kPa. Therefore, it is assumed that natural changes in the bulk density and the void ratio, which influence the sediment strength or quasi-static bearing capacity as well (Stark et al., 2011b) play a minor role in determining the quasi-static bearing capacity at the HE544 study site. Due to the small number of samples, data from the un-trawled area and thus from areas with different proportions of the mud fraction is highly limited. Therefore, the assumption on the natural variability of bulk density and void ratio is speculative and would need further research in order to make robust statements. The quasi-static bearing capacity, moreover, depends on particle shape and the friction angle of the sediment (Stark et al., 2011b). It is very unlikely that these factors vary across the HE544 site, because the sedimentary and current conditions are stable. Stark, et al. (2011b) showed that the quasi-static bearing capacity depends also on the material of the individual grains; carbonate sand had higher quasi-static bearing capacities compared to siliciclastic sand. At the HE544 site, the sediment can be described as siliciclastic sand throughout and thus, a change in material composition as an explanation for the differing quasi-static bearing capacity can be ruled out. Following these assumptions, the differences in quasi-static bearing capacity and penetration depth between the two areas (trawled and un-trawled) are probably not related to lateral changes in sediment type. However, to consider bulk density, void ratio and particle shape as similar across the study site only based on the grain size distribution and the knowledge of the predominant transport mechanisms is just a rough estimation, especially given the fact that the data set in areas with varying mud content is highly limited.
The occurrence of benthic organisms may decrease sediment strength due to bioturbation (e.g., Krantzberg, 1985; Dairain et al., 2020). The epibenthic biomass as an indicator for the biological productivity is relatively high at the HE544 site and common benthic species are, for example, bivalves, brittle stars and amphipods (e.g., Pesch et al., 2008; Neumann et al., 2017). However, Dairain et al. (2020) found that the bivalve Cerastoderma edule as well as microphytobenthos have a minor contribution to sediment stability in non-cohesive sediments, which applies to the northern and westernmost parts of the HE544 site, where the mud content is below 10% and where the majority of Nimrod samples of were taken (Figure 5B). Some species may decrease the sediment stability, i.e., the structural fabric, in cohesive sediments by grazing on microflora (Grant and Daborn, 1994) or by moving within the upper centimeters of the sediment (Winterwerp et al., 2012). However, it is difficult to determine the exact contributions of bioturbation to sediment stability (e.g., Winterwerp et al., 2012; Dairain et al., 2020) and to distinguish the influence of bioturbation on sediment disturbance from that of bottom trawling (Oberle et al., 2016b). Thus, it is a rough estimation based on the knowledge of the predominant benthic species that bioturbation plays a minor role in sediment strength at the HE544 site.
The spatial analysis of the trawled areas shows similar mean qbscmax values in the northern part of the HE544 site (63.63 ± 9.54 kPa in cluster I and 60.15 ± 9.02 kPa in cluster II (Figures 7B, C). The southern cluster III has a lower mean qbscmax of 41.86 ± 6.28 kPa (Figure 7D). The mud content in the sediment grab samples of the three clusters ranges between 6.5% and 9% and thus, it is considered unlikely that the grain size distribution has a major influence on the quasi-static bearing capacity. Bruns et al. (2020) found that the overall spatial density (abundance) of 6–13 trawl marks per km2 (beam trawl marks and otter trawl marks cumulated) at cluster I was higher compared to the area of cluster II, which showed a spatial trawl mark density of 6–8 marks per km2 (only beam trawl marks, otter trawl marks were absent). The area of cluster III has the lowest quasi-static bearing capacity (Figure 7D) and lowest spatial trawl mark density of 2–3 marks per km2 (only beam trawl marks, otter trawl marks were absent) as calculated by Bruns et al. (2020). The deployments of cluster III are orientated along the center of a single, prominent trawl mark (Figure 7D). Its good visibility in the SSS data indicates recent trawling activity and thus recent sediment mobilization as well. Good visibility here refers to a higher mean grey value (>180) over a cross section of a trawl mark compared to the mean grey value of a cross section of the same length (ca. 50 m) in un-trawled seabed areas (<160). Less good visibility of trawl marks is indicated by mean gray values of 160–180 over a cross section. However, it must be noted that, based on SSS data, the recency of trawl marks can only be roughly estimated. The detection of trawl marks and thus their appearance in the backscatter data depend on the survey setup, i.e., the height of the SSS tow fish above the seabed as well as environmental factors such as seabed roughness or disturbances in the water column (e.g., Gournia et al., 2019; Bruns et al., 2020). The deployments of the other clusters are distributed across areas where a mesh-like pattern of trawl marks was observed in SSS data (Figures 7B, C), which is reflected by the higher trawl mark density. Here, the variety of trawl marks with good visibility (recent trawling activity) and less good visibility (less recent trawling activity) is higher. Therefore, it is likely that the mean qbscmax and mean penmax values of clusters I and II also reflect this mix of highly impacted sea floor (recent trawling activity) and less impacted seafloor (less recent trawling activity). It is unknown how much time passed between the single, recent trawling event in cluster III and the multiple, less recent trawling events (clusters I and II). However, the results suggest that the single trawling event in cluster III can be considered as more recent because it shows the lowest sediment strength compared to clusters I and II.
Considering all the points discussed above, the data presented in this study unambiguously shows that bottom trawling alters the seabed by means of a decreased quasi-static bearing capacity, i.e., sediment strength. A possible explanation may be a decrease in bulk density due to sediment amalgamation after bottom trawling occurred, as described by Aspden et al. (2004). Another explanation for the decreased quasi-static bearing capacity could be an increased accumulation of soft or less dense, silty material as observed by Stark and Kopf (2011) related to scouring at a wind farm test site. The accumulation of fine-grained sediment may be induced by trawling as well. For example, Trimmer et al. (2005) and Gilkinson et al. (2015) showed that in areas where disturbances due to currents and waves are low, chronic trawling causes sorting and thus a relative increase of the fine fraction on the seabed surface because the fine grained material is re-suspended by trawling and settles back directly in the area that was touched by the trawling gear after the coarser fraction has deposited. However, in order to make robust statements about the sediment sorting related to bottom trawling at HE544 site, high resolution vertical and lateral sediment sampling would be necessary to investigate selective transport in-depth.
From the change of quasi-static bearing capacity with depth, Stark et al. (2009) and Stark et al. (2011b) derived that sediment mobilization on the seabed surface results in a less consolidated layer with a thickness of a few centimeters on top of a more consolidated layer. Within the top layer, the quasi-static bearing capacity increases more slowly with depth compared to the underlying, more consolidated layer (Stark et al., 2009; Stark and Kopf, 2011). Such a layering is not confirmed in this study; neither in the quasi-static bearing capacity data nor in the sediment samples. The increase of quasi-static bearing capacity with depth at HE544 site is rather comparable with the data obtained by Stark et al. (2009) and Stark et al. (2011b) at the Alpha Ventus study site, which they classified as homogenous, i.e., absent or very low sediment mobilization. Considering a penetration depth of the trawl gear of ≥10 cm in mixed sediments (Eigaard et al., 2016; Bruns et al., 2020), about 90% of the Nimrod samples in the trawled area should have penetrated as deep as the trawl gear. Geochemical analyses, however, showed that bottom trawling may alter the sediment structure up to 35 cm deep into the subsurface (e.g., Oberle et al., 2016a; Bunke et al., 2019). Hence, only 8 Nimrod samples may have reached the undisturbed subsurface at the HE544 site and a sampling setup with higher penetration depths is needed in order to make even more robust statements concerning a possible layering.
5 Conclusion
This study documents a difference in sediment strength comparing a trawled and an un-trawled area of seabed in the German North Sea: The quasi-static bearing capacity and the penetration depth were roughly 20 kPa lower and 0.13 m higher, respectively, in trawled areas compared to un-trawled ones. The changes in sediment strength (i.e., quasi-static bearing capacity) likely reflect sediment, which was re-suspended by bottom trawling and re-settled within the trawl marks or in close vicinity and thus, also a decrease in bulk density of the surface sediments due to sediment amalgamation within the trawled region. The identification of different layers (less consolidated above more consolidated sediment) indicating mobilized sediment as observed by Stark et al. (2009) and Stark et al. (2011b), was not made in this study. This is probably related to a limited overall penetration depth of the dynamic penetrometer and therefore the pristine subsurface (i.e., not influenced by bottom trawling) was not be reached.
The differences in sediment strength measured in this study were attributed to trawling. Reworking by currents and waves, lateral heterogeneity in sediment type and bioturbation may contribute to changes in sediment strength but were estimated to be of minor importance at the study site. The stronger impact is inferred from the trawling, as attested by lower strength in the trawl marks, which is most likely a consequence of fluid entrainment when the fishing gear ploughs through the seabed sediment.
If the strength of the surface sediment is decreased due to bottom trawling, as this suggested, it is more likely to be mobilized, both by recurring bottom trawling as well as natural events such as storm waves. This may alter the general sediment budget in the area (Paradis et al., 2021) and therefore the benthic habitat. The loss of organic carbon induced by bottom trawling and a following loss of fauna may be the consequence (De Borger et al., 2021). Not only nutrients can be remobilized more easily but contaminants as well, which may be taken up by benthic species (Bradshaw et al., 2012). Therefore, it is highly recommended to further assess the decrease of sediment strength as a result of bottom trawling in order to enable sustainable management strategies on bottom trawling.
Data availability statement
The raw data supporting the conclusion of this article will be made available by the authors, without undue reservation.
Author contributions
The funding for this study was acquired by AB and the study design was created by IB and AB with support by AK. IB and FM did the field work, processed the raw data and interpreted the data supported by AK and AB. IB prepared the original draft of the manuscript and all figures and tables. All authors contributed to the article and approved the submitted version.
Funding
This research was conducted in the framework of the ASKAWZ project, which is a research and development cooperation between Senckenberg am Meer (SaM) and the German Federal Maritime and Hydrographic Agency (BSH, Bundesamt für Seeschifffahrt und Hydrographie, ASKAWZ III Contract-No. 10038520). ASKAWZ is part of the SedAWZ project, which is coordinated by BSH and funded by German Federal Agency for Nature Conservation (BfN, Bundesamt für Naturschutz). The funding for open access publication was granted by Staats-und Universitätsbibliothek, University of Bremen.
Acknowledgments
The authors like to thank the Captain and Crew of R/V Heincke for the professional support onboard. We are grateful to our deceased colleague Dr. Peter Holler, who was the chief scientist during the survey HE544 and provided fruitful feedback towards the interpretation of the SSS data set. Moreover, we appreciate the help of Christian Zöllner (MARUM) when designing and providing the customized tip for the Nimrod deployments during HE544, and the outstanding and continued advices by Dr. Robert Roskoden concerning the Nimrod data processing. Acknowledgements also go to our lab staff Astrid Raschke (SaM) for supporting the work on the grain size samples as well as to all our student assistants contributing to survey HE544.
Conflict of interest
The authors declare that the research was conducted in the absence of any commercial or financial relationships that could be construed as a potential conflict of interest.
Publisher’s note
All claims expressed in this article are solely those of the authors and do not necessarily represent those of their affiliated organizations, or those of the publisher, the editors and the reviewers. Any product that may be evaluated in this article, or claim that may be made by its manufacturer, is not guaranteed or endorsed by the publisher.
References
Aldridge, J. N., Parker, E. R., Bricheno, L. M., Green, S. L., and van der Mole, J. (2015). Assessment of the physical disturbance of the northern European Continental shelf seabed by waves and currents. Cont. Shelf Res. 108, 121–140. doi:10.1016/j.csr.2015.03.004
Amoroso, R. O., Pitcher, C. R., Rijnsdorp, A. D., McConnaughey, R. A., Parma, A. M., Suuronen, P., et al. (2018). Bottom trawl fishing footprints on the world’s continental shelves. Proc. Natl. Acad. Sci. 115 (43), E10275–E10282. doi:10.1073/pnas.1802379115
Arjona-Camas, M., Puig, P., Palanques, A., Emelianov, M., and Durán, R. (2019). Evidence of trawling-induced resuspension events in the generation of nepheloid layers in the Foix submarine canyon (NW Mediterranean). J. Mar. Syst. 196, 86–96. doi:10.1016/j.jmarsys.2019.05.003
Aspden, R. J., Vardy, S., Perkins, R. G., Davidson, I. R., Bates, R., and Paterson, D. M. (2004). The effects of clam fishing on the properties of surface sediments in the lagoon of Venice, Italy. Hydrol. Earth Syst. Sci. 8 (2), 160–169. doi:10.5194/hess-8-160-2004
Aubeny, C. P., and Shi, H. (2006). Interpretation of impact penetration measurements in soft clays. J. Geotechnical Geoenvironmental Eng. 132 (6), 770–777. doi:10.1061/(ASCE)1090-0241(2006)132:6(770)
Blott, S. J., and Pye, K. (2001). GRADISTAT: a grain size distribution and statistics package for the analysis of unconsolidated sediments. Earth Surf. Process. Landforms 26 (11), 1237–1248. doi:10.1002/esp.261
Bockelmann, F.-D., Puls, W., Kleeberg, U., Müller, D., and Emeis, K.-C. (2018). Mapping mud content and median grain-size of North Sea sediments – a geostatistical approach. Mar. Geol. 397, 60–71. doi:10.1016/j.margeo.2017.11.003
Bradshaw, C., Tjensvoll, I., Sköld, M., Allan, I. J., Molvaer, J., Magnusson, J., et al. (2012). Bottom trawling resuspends sediment and releases bioavailable contaminants in a polluted fjord. Environ. Pollut. 170, 232–241. doi:10.1016/j.envpol.2012.06.019
Bruns, I., Holler, P., Capperucci, R. M., Papenmeier, S., and Bartholomä, A. (2020). Identifying trawl marks in North Sea sediments. Geosciences 10 (11), 422. doi:10.3390/geosciences10110422
BSH (2023). FINO Database. Data was made available by the FINO (Forschungsplattformen in Nord-und Ostsee) initiative, which was funded by the German Federal Ministry of Economic Affairs and Energy (BMWi) on the basis of a decision by the German Bundestag, organised by the Projekttraeger Juelich (PTJ) and coordinated by the German Federal Maritime and Hydrographic Agency (BSH). 2020. Available at: http://fino.bsh.de (accessed on July 21, 2023).
Buhl-Mortensen, L., Ellingsen, K. E., Buhl-Mortensen, P., Skaar, K. L., and Gonzales-Mirelis, G. (2016). Trawling disturbance on megabenthos and sediment in the Barents Sea: chronic effects on density, diversity, and composition. ICES J. Mar. Sci. 73 (1), i98–i114. doi:10.1093/icesjms/fsv200
Bunke, D., Leipe, T., Moros, M., Morys, C., Tauber, F., Virtasalo, J. J., et al. (2019). Natural and anthropogenic sediment mixing processes in the south-western baltic sea. Front. Mar. Sci. 6. doi:10.3389/fmars.2019.00677
Cai, G., Liu, S., Tong, L., and Du, G. (2009). Assessment of direct CPT and CPTU methods for predicting the ultimate bearing capacity of single piles. Eng. Geol. 104 (3), 211–222. doi:10.1016/j.enggeo.2008.10.010
Coughlan, M., Wheeler, A. J., Dorschel, B., Lordan, C., Boer, W., Gaever, P. v., et al. (2015). Record of anthropogenic impact on the Western Irish Sea mud belt. Anthropocene 9, 56–69. doi:10.1016/j.ancene.2015.06.001
Dairain, A., Maire, O., Meynard, G., Richard, A., Rodolfo-Damiano, T., and Orvain, F. (2020). Sediment stability: can we disentangle the effect of bioturbating species on sediment erodibility from their impact on sediment roughness? Mar. Environ. Res. 162, 105147. doi:10.1016/j.marenvres.2020.105147
Das, B. M. (1990). Principles of geotechnical engineering. Vol. 2nd edn. Boston: PWS-Kent Publishing Company.
De Borger, E., Tiano, J., Braeckman, U., Rijnsdorp, A. D., and Soetaert, K. (2021). Impact of bottom trawling on sediment biogeochemistry: a modelling approach. Biogeosciences 18 (8), 2539–2557. doi:10.5194/bg-18-2539-2021
Depestele, J., Ivanović, A., Degrendele, K., Esmaeili, M., Polet, H., Roche, M., et al. (2016). Measuring and assessing the physical impact of beam trawling. ICES J. Mar. Sci. 73 (1), i15–i26. doi:10.1093/icesjms/fsv056
Eigaard, O. R., Bastardie, F., Breen, M., Dinesen, G. E., Hintzen, N. T., Laffargue, P., et al. (2016). Estimating seabed pressure from demersal trawls, seines, and dredges based on gear design and dimensions. ICES J. Mar. Sci. 73 (1), i27–i43. doi:10.1093/icesjms/fsv099
Eisma, D., Mook, W. G., and Laban, C. (1981). “An early Holocene tidal flat in the southern Bight,” in Holocene marine sedimentation in the north Sea basin (Wiley), 229–237.
Emodnet, (2019). Kinetic energy from waves in the greater North Sea and celtic seas (2000-2005) for the EMODnet seabed habitats project. Available at: http://data.europa.eu/88u/dataset/kinetic-energy-from-waves-in-the-greater-north-sea-and-celtic-seas-2000-2005-for-the-emodnet-se (Accessed May 29, 2023).
EMODnet-Bathymetry-Consortium (2018). EMODnet digital bathymetry (DTM). Available at: https://www.emodnet-bathymetry.eu/ (Accessed May 29, 2023).
Flemming, B. W. (2005). The concept of wave base: fact and fiction. Gwatt, Lake Thun, Swizerland: Paper presented at the Sediment 2005.
Folk, R. L., and Ward, W. C. (1957). Brazos River bar [Texas]; a study in the significance of grain size parameters. J. Sediment. Petrology 27, 23–26. doi:10.1306/74D70646-2B21-11D7-8648000102C1865D
Friedlander, A. M., Boehlert, G. W., Field, M. E., Mason, J. E., Gardner, J. V., and Dartnell, P. (1999). Sidescan-sonar mapping of benthic trawl marks on the shelf and slope off Eureka, California. Fish. Bull. 97 (4), 15.
Gilkinson, K., King, E. L., Li, M. Z., Roddick, D., Kenchington, E., and Han, G. (2015). Processes of physical change to the seabed and bivalve recruitment over a10-year period following experimental hydraulic clam dredging on Banquereau, Scotian Shelf. Cont. Shelf Res. 92, 72–86. doi:10.1016/j.csr.2014.11.006
Gournia, C., Fakiris, E., Geraga, M., Williams, D. P., and Papatheodorou, G. (2019). Automatic detection of trawl-marks in sidescan sonar images through spatial domain filtering, employing haar-like features and morphological operations. Geosciences 9, 214. doi:10.3390/geosciences9050214
Grant, J., and Daborn, G. (1994). The effects of bioturbation on sediment transport on an intertidal mudflat. Neth. J. Sea Res. 32 (1), 63–72. doi:10.1016/0077-7579(94)90028-0
Holler, P., Bartholomä, A., Valerius, J., Thiesen, M., and Mulckau, A. (2020). Map of sediment distribution in the German EEZ (1:10.000). Available at: www.geoseaportal.de (Accessed May 29, 2023).
Holler, P., and Bruns, I. (2020). Acoustic Seafloor Classification of the German EEZ- Impact of sediment types, bioturbation, and natural and man-made seabed features on hydroacoustic images, Cruise No. HE544, 14.10.2019 - 30.10.2019, Bremerhaven (Germany) - Bremerhaven (Germany). Bonn: Gutachterpanel Forschungsschiffe. doi:10.2312/cr_he544
Ivanović, A., Neilson, R. D., and O'Neill, F. G. (2011). Modelling the physical impact of trawl components on the seabed and comparison with sea trials. Ocean. Eng. 38, 9. doi:10.1016/j.oceaneng.2010.09.011
Ivanović, A., and O'Neill, F. G. O. (2015). Towing cylindrical fishing gear components on cohesive soils. Comput. Geotechnics 65, 8. doi:10.1016/j.compgeo.2014.12.003
Krantzberg, G. (1985). The influence of bioturbation on physical, chemical and biological parameters in aquatic environments: a review. Environ. Pollut. Ser. A, Ecol. Biol. 39 (2), 99–122. doi:10.1016/0143-1471(85)90009-1
Krost, P., Bernhard, M., Werner, F., and Hukriede, W. (1990). Otter trawl tracks in Kiel Bay (Western Baltic) mapped by side-scan sonar. Meeresforschung 32, 10.
Laurer, W.-U., Naumann, M., and Zeiler, M. (2014). Erstellung der Karte zur Sedimentverteilung auf dem Meeresboden in der deutschen Nordsee nach der Klassifikation von FIGGE (1981). Available at: https://www.gpdn.de/wilma.aspx?pgId=179 (accessed on May 29, 2023).
Lindeboom, H. J., and de Groot, S. J. (1998). The effects of different types of fisheries on the north Sea and Irish sea benthic ecosystem. IMACT -II. (RAPPORT; No. C003/98). Available at: https://edepot.wur.nl/340566.
Lindholm, J., Gleason, M., Kline, D., Clary, L., Rienecke, S., Cramer, A., et al. (2015). Ecological effects of bottom trawling on the structural attributes of fish habitat in unconsolidated sediments along the central California outer continental shelf. Fish. Bull. 113, 82–96. doi:10.7755/FB.113.1.8
Lucking, G., Stark, N., Lippmann, T., and Smyth, S. (2017). Variability of in situ sediment strength and pore pressure behavior of tidal estuary surface sediments. Geo-Marine Lett. 37 (5), 441–456. doi:10.1007/s00367-017-0494-6
Mengual, B., Cayocca, F., Le Hir, P., Draye, R., Laffargue, P., Vincent, B., et al. (2016). Influence of bottom trawling on sediment resuspension in the ‘Grande-Vasière’ area (Bay of Biscay, France). Ocean. Dyn. 66 (9), 1181–1207. doi:10.1007/s10236-016-0974-7
Mérillet, L., Kopp, D., Robert, M., Salaün, M., Méhault, S., Bourillet, J.-F., et al. (2018). Are trawl marks a good indicator of trawling pressure in muddy sand fishing grounds? Ecol. Indic. 85, 570–574. doi:10.1016/j.ecolind.2017.11.016
Mérillet, L., Mouchet, M., Robert, M., Salaün, M., Schuck, L., Vaz, S., et al. (2017). Using underwater video to assess megabenthic community vulnerability to trawling in the Grande Vasière (Bay of Biscay). Environ. Conserv. 45 (2), 163–172. doi:10.1017/S0376892917000480
Neumann, H., Diekmann, R., Emeis, K.-C., Kleeberg, U., Moll, A., and Kröncke, I. (2017). Full-coverage spatial distribution of epibenthic communities in the south-eastern North Sea in relation to habitat characteristics and fishing effort. Mar. Environ. Res. 130, 11. doi:10.1016/j.marenvres.2017.07.010
Oberle, F. K. J., Storlazzi, C. D., and Hanebuth, T. J. J. (2016a). What a drag: quantifying the global impact of chronic bottom trawling on continental shelf sediment. J. Mar. Syst. 159, 109–119. doi:10.1016/j.jmarsys.2015.12.007
Oberle, F. K. J., Swarzenski, P. W., Reddy, C. M., Nelson, R. K., Baasch, B., and Hanebuth, T. J. J. (2016b). Deciphering the lithological consequences of bottom trawling to sedimentary habitats on the shelf. J. Mar. Syst. 159, 120–131. doi:10.1016/j.jmarsys.2015.12.008
O'Neill, F. G., and Ivanović, A. (2015). The physical impact of towed demersal fishing gears on soft sediments. ICES J. Mar. Sci. 73 (1), i5–i14. doi:10.1093/icesjms/fsv125
Palanques, A., Puig, P., Guillén, J., Demestre, M., and Martín, J. (2014). Effects of bottom trawling on the Ebro continental shelf sedimentary system (NW Mediterranean). Cont. Shelf Res. 72, 83–98. doi:10.1016/j.csr.2013.10.008
Paradis, S., Lo Iacono, C., Masqué, P., Puig, P., Palanques, A., and Russo, T. (2021). Evidence of large increases in sedimentation rates due to fish trawling in submarine canyons of the Gulf of Palermo (SW Mediterranean). Mar. Pollut. Bull. 172, 112861. doi:10.1016/j.marpolbul.2021.112861
Paschen, M., Richter, U., and Köpnick, W. (2000). Trawl penetration in the seabed (TRAPESE) final report EC-study Contract (vol. Nr. 96-006, pp. 150).
Pesch, R., Pehlke, H., Jerosch, K., Schröder, W., and Schlüter, M. (2008). Using decision trees to predict benthic communities within and near the German Exclusive Economic Zone (EEZ) of the North Sea. Environ. Monit. Assess. 136 (1), 313–325. doi:10.1007/s10661-007-9687-1
Roskoden, R. R. (2020). Processing advancements of free fall penetrometer data and their ground proving in regional studies in New Zealand. Bremen. doi:10.26092/elib/74
Schönke, M., Clemens, D., and Feldens, P. (2022). Quantifying the physical impact of bottom trawling based on high-resolution bathymetric data. Remote Sens. 14 (12), 2782. doi:10.3390/rs14122782
Schulze, T. (2018). International fishing activities (2012-2016) in German waters in relation to the designated Natura 2000 areas and proposed management within. Hamburg: Johann Heinrich von Thünen-Institute Federal Research Institute for Rural Areas, Forestry and Fisheries Institute of Sea Fisheries.
Schwinghammer, P., Gordon, J., Rowell, T. W., Prena, J., McKeown, D. L., Sonnichsen, G., et al. (1998). Effects of experimental otter trawling on surficial sediment properties of a sandy-bottom ecosystem on the grand banks of newfoundland. Conserv. Biol. 12 (6), 8. doi:10.1046/j.1523-1739.1998.0120061215.x
Sciberras, M., Hiddink, J. G., Jennings, S., Szostek, C. L., Hughes, K. M., Kneafsey, B., et al. (2018). Response of benthic fauna to experimental bottom fishing: a global meta-analysis. Fish Fish. 19 (4), 698–715. doi:10.1111/faf.12283
Smith, C. J., Banks, A. C., and Papadopoulou, K.-N. (2007). Improving the quantitative estimation of trawling impacts from sidescan-sonar and underwater-video imagery. ICES J. Mar. Sci. 64, 1692–1701. doi:10.1093/icesjms/fsm165
Son, C. S., Flemming, B. W., and Chang, T. S. (2012). Sedimentary facies of shoreface-connected sand ridges off the East Frisian barrier-island coast, southern North Sea: climatic controls and preservation potential. Int. Assoc. Sedimentol. Spec. Publ. 44, 143–158. doi:10.1002/9781118311172.ch7
Stark, N., Coco, G., Bryan, K. R., and Kopf, A. (2012). In-situ geotechnical characterization of mixed-grain-size bedforms using A dynamic penetrometer. J. Sediment. Res. 82 (7), 540–544. doi:10.2110/jsr.2012.45
Stark, N., Hanff, H., Svenson, C., Ernstsen, V., Lefebvre, A., Winter, C., et al. (2011a). Coupled penetrometer, MBES and ADCP assessments of tidal variations in surface sediment layer characteristics along active subaqueous dunes, Danish Wadden Sea. Geo-Marine Lett. 31 (4), 249–258. doi:10.1007/s00367-011-0230-6
Stark, N., and Kopf, A. (2011). “Detection and quantification of sediment remobilization processes using a dynamic penetrometer,” in Paper presented at the OCEANS'11 MTS/IEEE KONA, Waikoloa, HI, USA, 19-22 September 2011 (IEEE).
Stark, N., Kopf, A., Hanff, H., Stegmann, S., and Wilkens, R. (2009). “Geotechnical investigations of sandy seafloors using dynamic penetrometers,” in Paper presented at the OCEANS 2009, Biloxi, MS, USA, 26-29 October 2009 (IEEE).
Stark, N., Wilkens, R., Ernstsen, V. B., Lambers-Huesmann, M., Stegmann, S., and Kopf, A. (2011b). Geotechnical properties of sandy seafloors and the consequences for dynamic penetrometer interpretations: quartz sand versus carbonate sand. Geotechnical Geol. Eng. 30 (1), 1–14. doi:10.1007/s10706-011-9444-7
Stoll, R. D., Sun, Y. F., and Bitte, I. (2007). Seafloor properties from penetrometer tests. IEEE J. Ocean. Eng. 32 (1), 57–63. doi:10.1109/JOE.2007.890943
Tiano, J. C., van der Reijden, K. J., O'Flynn, S., Beauchard, O., van der Ree, S., van der Wees, J., et al. (2020). Experimental bottom trawling finds resilience in large-bodied infauna but vulnerability for epifauna and juveniles in the Frisian Front. Mar. Environ. Res. 159, 104964. doi:10.1016/j.marenvres.2020.104964
Trimmer, M., Petersen, J., Sivyer, D. B., Mills, C., Young, E., and Parker, E. R. (2005). Impact of long-term benthic trawl disturbance on sediment sorting and biogeochemistry in the southern North Sea. Mar. Ecol. Prog. Ser. 298, 79–94. doi:10.3354/meps298079
Winterwerp, J. C., van Kesteren, W. G. M., van Prooijen, B., and Jacobs, W. (2012). A conceptual framework for shear flow–induced erosion of soft cohesive sediment beds. J. Geophys. Res. Oceans 117 (C10). doi:10.1029/2012JC008072
Zeiler, M., Schwarzer, K., Bartholomä, A., and Ricklefs, K. (2008). Seabed morphology and sediment dynamics. Die Küste 74, 13. Available at: https://hdl.handle.net/20.500.11970/101592.
Keywords: anthropogenic impact, side scan sonar, dynamic penetrometer, hydroacoustic mapping, trawl fishing
Citation: Bruns I, Bartholomä A, Menjua F and Kopf A (2023) Physical impact of bottom trawling on seafloor sediments in the German North Sea. Front. Earth Sci. 11:1233163. doi: 10.3389/feart.2023.1233163
Received: 01 June 2023; Accepted: 16 October 2023;
Published: 09 November 2023.
Edited by:
Kyungsik Choi, Seoul National University, Republic of KoreaReviewed by:
Dimitris Sakellariou, Hellenic Centre for Marine Research (HCMR), GreeceAdam Skarke, Mississippi State University, United States
Copyright © 2023 Bruns, Bartholomä, Menjua and Kopf. This is an open-access article distributed under the terms of the Creative Commons Attribution License (CC BY). The use, distribution or reproduction in other forums is permitted, provided the original author(s) and the copyright owner(s) are credited and that the original publication in this journal is cited, in accordance with accepted academic practice. No use, distribution or reproduction is permitted which does not comply with these terms.
*Correspondence: Ines Bruns, aW5lcy1icnVuc0B3ZWIuZGU=