 Xiangjun Pei
 Tao Jiang
 Shenghua Cui
 Bin Guo
 Jing Liang
- State Key Laboratory of Geohazard Prevention and Geoenvironment Protection, Chengdu University of Technology, Chengdu, China
The 2017 Jiuzhaigou earthquake caused numerous landslide masses in the Jiuzhaigou cultural heritage site, leading to frequent surface mass movements and affecting the hydrological landscape. This was the first time a strong earthquake hit the heritage site in China, making it an important area for ecological geological environment protection and restoration research. To understand the influence of slope runoff erosion on the activation of landslide accumulations, this study examined remote sensing images from 2017 to 2020 to investigate the geological disaster, while field scour tests were conducted to study the rainfall seepage, mass erosion, and migration.The results indicated that the steep-sloped landslide deposits in the heritage site contain a high content of fine grains and good permeability.
1 Introduction
The Jiuzhaigou cultural heritage site located in Sichuan Province, China, is known for its beautiful calcified lakes, beaches, waterfalls, and karst water systems. It is the first nature reserve in China, established primarily for the protection of natural scenery. Jiuzhaigou is one of the 25 global hotspots of biodiversity and a core distribution area for the panda population in the Minshan Mountains. It is also a typical fusion area of the Tibetan and Han culture zones. In 2017, an Ms 7.0 earthquake hit Jiuzhaigou, resulting in 89 new geological hazards, 132 square kilometers of vegetation damage, and 55 square kilometers of soil erosion.
Strong earthquakes in mountainous areas can trigger a large number of landslides, resulting in loose and unstable rockslide deposits. These deposits are easily reactivated due to a low rainfall threshold (Yang et al., 2021; Li et al., 2016; Huang et al., 2020a) and evolve into a debris flow (Lin et al., 2006; Hovius et al., 2011; Zhang et al., 2014; Fan et al., 2021). Within 3 years after the Jiuzhaigou earthquake, at least 83 debris flows occurred in the core area, posing a serious threat to the opening and operation of the Jiuzhaigou scenic area, natural landscapes, and geological safety (Lei et al., 2018; Hu et al., 2019). Through remote sensing interpretation and field investigation, a significant increase in the post-earthquake debris flow has been revealed (Fan et al., 2018; Wang and Mao, 2022), which is mainly caused by rainfall (Zhang et al., 2019; Zhang et al., 2022), as the post-earthquake threshold is lower than the pre-earthquake threshold (Liu et al., 2021). It is necessary to understand the mechanisms of rainfall infiltration and runoff generation to trigger shallow slope failure in loose landslide deposits before triggering a debris flow (Cui et al., 2014).
Physical model experiments, numerical simulations, and field experiments are the main methods to study the triggering mechanism of slope instability. Field experiments can better reproduce actual conditions than physical model experiments and numerical simulations. Hu et al. (2014) proposed that a gradient is the main factor controlling the scale of the debris flow by using flume experiments. Cui et al. (2014) analyzed the hydraulic response of landslide deposits under rainfall conditions and proposed surface runoff, interflow, and fine particle migration effects to explain the shallow failure process. A frictional resistance model based on the limit equilibrium and unsaturated theory is established to study the triggering mechanism of landslide deposits (Travis et al., 2010). Zhou et al. (2013) identified that the increase in surface water runoff and decrease in the saturated deposit shear strength are the main causes of the debris flow under heavy rainfall conditions. Hu et al. (2018) believed that erodible small particles play an important role in triggering failure and fluidization and causing particle coarsening. The initiation of loose deposits is actually a process of increasing the soil pore pressure and reducing frictional resistance (Terajima et al., 2014; Sidle and Bogaard, 2016). Torres et al. (1998) pointed out that rainfall-induced slope instability is related to the formation height of stable unsaturated flow fields. The pressure wave caused by rainfall infiltration results in a relatively rapid response of the pressure head inside the soil during rainfall. Teeca et al. (2003) measured the soil pore pressure in a shallow slope layer located in the starting area of a debris flow and found an instantaneous and upward increase in the pore pressure during a debris flow. Jiuzhaigou possesses the richest and most typical ecological and hydrological landscape in the western region of China, making it an experimental field for studying the science of ecological geological environment systems. A debris flow causes damage to the water quality at the Jiuzhaigou cultural heritage site; however, there is still a lack of experimental data supporting this process.
This study takes landslide deposits in the core area of Jiuzhaigou as the research object to reveal the impact of runoff erosion on landslide deposits and improves the understanding of the transformation of post-earthquake deposits. Based on remote sensing image interpretation from 2017 to 2020, this study investigates the seepage response, erosion and transport processes, and the erosion initiation mechanism of the deposit through field erosion experiments. The aim of this study is to provide a theoretical reference for geohazard mitigation of the Jiuzhaigou cultural heritage site.
2 Study area
The uplift of the Tibet Plateau plays a significant role in the evolution of Chinese landforms, changes in the climate and environment, formation of ecological barriers, and the proliferation of nomadic cultures. It has also given rise to extremely complex geological conditions and frequent strong seismic environments, making the ecological and geological environment extremely fragile. The Jiuzhaigou earthquake occurred on 8 August 2017, in Jiuzhaigou County, Sichuan Province, China, and caused damage to more than 73,000 buildings and resulted in 25 fatalities, six missing people, and 525 injuries (Fan et al., 2018). The Jiuzhaigou earthquake ruptured a strike-slip fault to the northwest of the Huya fault (Li et al., 2018; Yi et al., 2018; Zhang et al., 2018; Ling et al., 2020). The epicenter and focal mechanism of the Jiuzhaigou earthquake did not seem sufficiently correlated with any of the already known active faults in the area. The seismogenic fault of the Jiuzhaigou earthquake was first hypothesized by Li et al. (2017) to be an unknown blind strike-slip fault, based on the combination of fault mechanism solutions, field-inferred signs of rupture, and radon anomalies. However, since the inferred fault slip was rather slight, the location of the Jiuzhaigou earthquake’s seismogenic fault has been debated.
The area belongs to the Minshan range in the Bayankala block of the eastern Tibet Plateau and is characterized by a Paleozoic–Mesozoic sequence composed of a marine platform, shallow-water siliciclastic rocks, and reef-bearing limestone or dolomite (Kirby et al., 2000). The regional geology of the study area features Devonian to Triassic outcrops, mostly consisting of limestone, dolomite, slate, and metamorphic sandstone and also including the Neogene conglomerate to a lesser extent. Under the effect of the plateau cold and sub-cold monsoon climate, the annual average precipitation was 704.3 mm, while precipitation from April to October contributes the most (89.61%) to the total precipitation throughout the year. Figure 1 shows that the epicenter of the earthquake is located in Bisang Village, 5 km west of the core scenic area, and the maximum intensity can reach IX degrees, resulting in the Jiuzhaigou earthquake having the characteristics of a large magnitude, deep epicenter, wide impact range, and serious secondary geological disasters. The use of field investigation and remote sensing image interpretation is becoming increasingly frequent in natural hazard studies (Huang et al., 2020b; Chang et al., 2020; Huang et al., 2020c). The data mainly contain satellite images, topographic data, and high-definition photographs in this study. Remote sensing images and high-definition photographs are used to interpret geohazards by manual annotation. The data information used in this study is shown in Table 1.
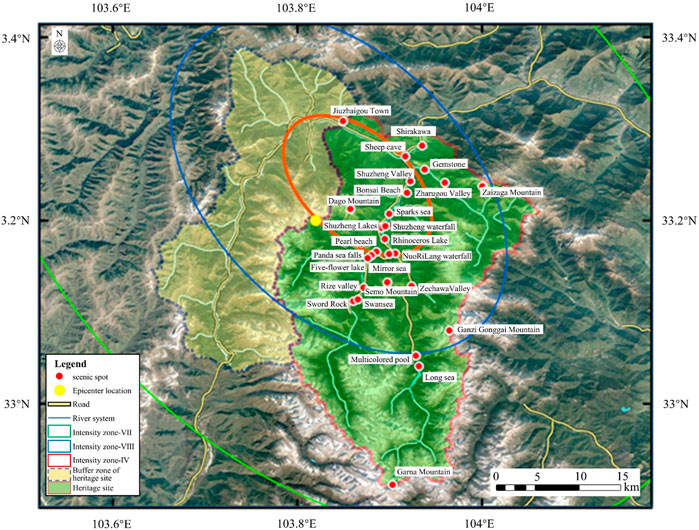
FIGURE 1. Earthquake intensity map of the Jiuzhaigou scenic area.
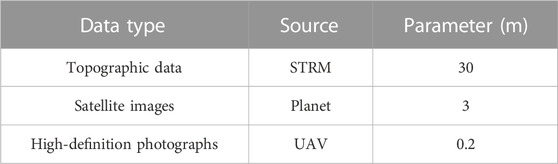
TABLE 1. Data information used in this study.
We interpreted the pre-earthquake (5 August 2017), co-seismic (6 September 2017), and post-earthquake (22 August 2018, 16 August 2019, and 28 August 2020) remote sensing images in an area of 655 km2. There are 180, 1,344, 1,582, 1,638, and 1,757 landslides with the disaster areas of 2.52 km2, 8.34 km2, 9.87 km2, 10.16 km2, and 10.97 km2, respectively. It should be noted that both the number and area of landslides increased gradually in the 3 years after the earthquake (Figure 2). Figure 3 shows that the collapse was significantly distributed in the steep slope section with an elevation of 2,800–3,400 m and 30°–55° before and after the earthquake; this is basically the same as the conclusion Tian et al. (2019) reached. Figure 4 shows that rainfall gradually increased from May to August after the 2017 earthquake, especially in 2020. It can be reasonably inferred that rainfall is an important triggering factor for the increase in post-seismic landslides in Jiuzhaigou.
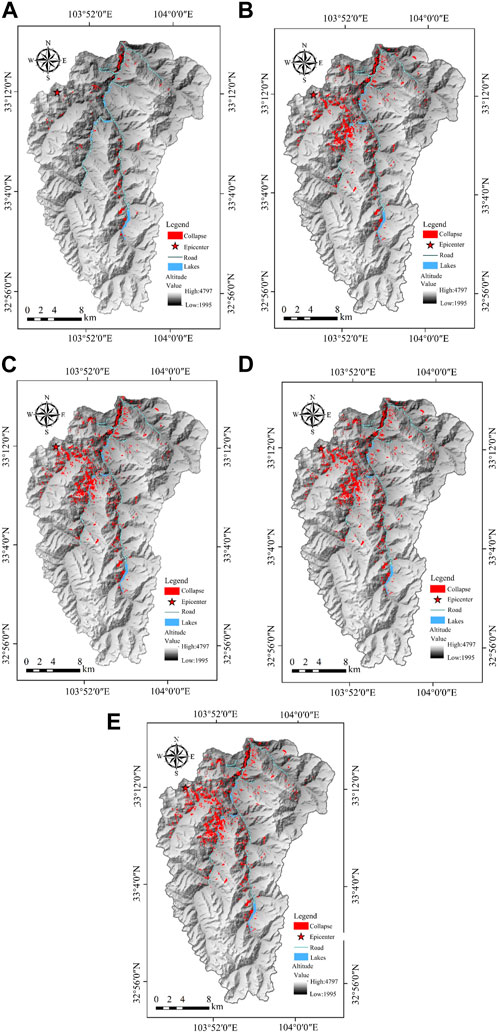
FIGURE 2. Interpretation results of the pre-earthquake (5 August 2017), co-seismic (6 September 2017), and post-earthquake (22 August 2018, 16 August 2019, and 28 August 2020) images. (A) 2017.8.5, (B) 2017.9.6, (C) 2018.8.22, (D) 2019.8.16, and (E) 2020.8.28.
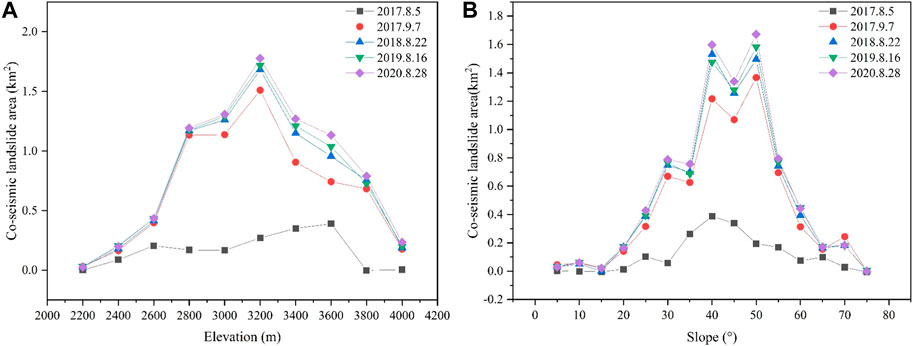
FIGURE 3. Distribution of the earthquake-induced landslide area with respect to the (A) elevation and (B) slope classes.
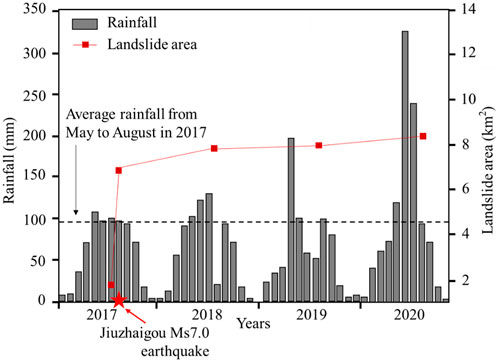
FIGURE 4. Impact of rainfall on landslides in the Jiuzhaigou area after the 2017 Ms 7.0 earthquake.
Field investigation showed that the sediment composition of most of the earthquake-induced landslide deposits gradually became coarse, with fine particles (smaller than 0.075 mm) on the top and large blocks at the bottom. Horizontally, the particles in the middle are larger than those on both sides, which is favorable for the erosion and migration of fine particle matters. A total of 76 deposits are developed along the road in scenic areas. The slope angles of the deposits are within the range of 35°–42°, and approximately 31.5% of them are at the gradient of 40° (Figure 5). Compared with deposits formed under gravity, the deposits induced by earthquakes contain fewer fine grains and are steeper. An investigation showed that soil loss and the debris flow are generally caused by rainfall after an earthquake. These result in the turbidity of lake water and damage to the infrastructure (Figure 6), extremely threatening the natural landscape and scenic spot security in the study area.
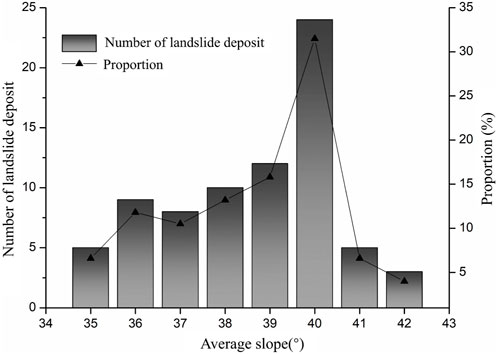
FIGURE 5. Slope angle of the deposit.
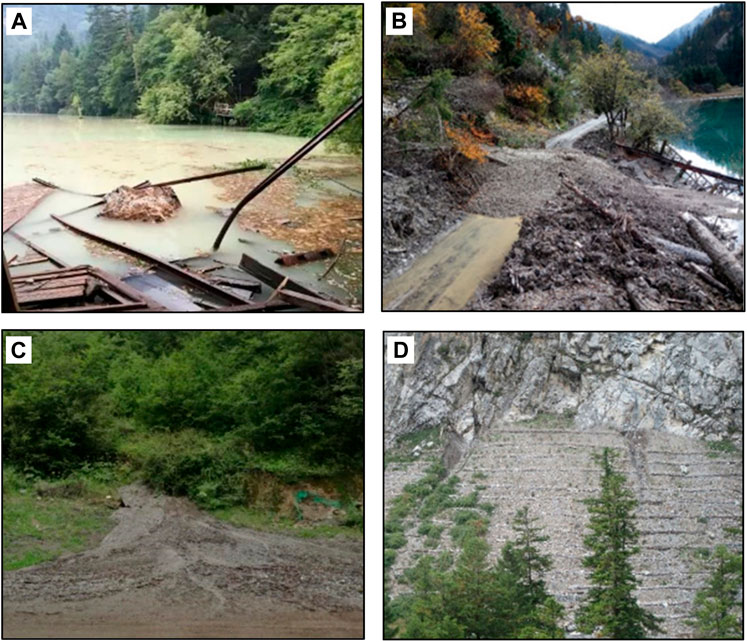
FIGURE 6. Deposit activity under heavy rainfall after the earthquake. (A) Heavy rainfall caused turbidity to the water in 2017; (B) landslide accumulation rushed into the sea of arrows and bamboos in 2018; (C) debris flows block roads in 2019; (D) rainfall washes away the accumulation to form gullies in 2020.
The Xiajijiehai landslide deposit triggered by the Jiuzhaigou earthquake is taken as a geological prototype in this study (Figure 7). The deposit here has an average gradient of approximately 40°, a slope length of approximately 17 m, a maximum bottom width of approximately 9 m, and a maximum top width of approximately 1.2 m. The deposit is made of loose gravel soil and blocks. The surface is covered by sandy soil and silty clay (Figure 8) (Table 2). The measurement errors arising from equipment, procedural operators, and random testing effects during soil testing are generally unavoidable (Jiang et al., 2018). Interested readers can refer to Phoon and Kulhawy (1999a); Phoon and Kulhawy (1999b) for a detailed explanation about the measurement errors. Serious water and soil loss situations during rainfall occur here after an earthquake.
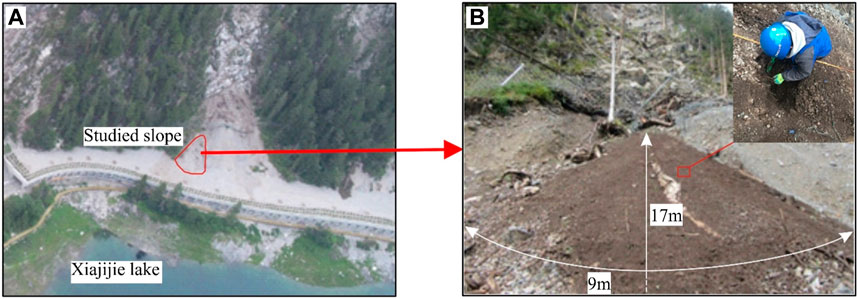
FIGURE 7. Studied slope. (A) Location of the studied slope; (B) enlarged view of the studied slope.
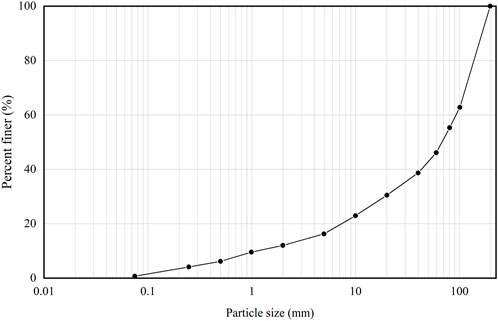
FIGURE 8. Particle size analysis of the deposit.
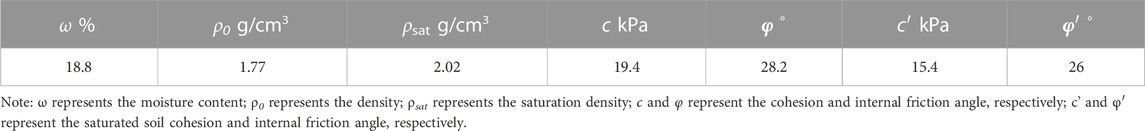
TABLE 2. Basic properties of a deposit.
3 Methods
According to the precipitation data from 2018 to 2020 from the Scientific Research Department of Jiuzhaigou Administration, the daily average rainfall of the 3 years after the earthquake is approximately 4.3 mm, while the rainfall of July and August in 2020 is 326.3 and 239.2 mm, respectively, having reached a “once-in-a-century” rainfall level. The corresponding scouring flows of the return periods of “once-in-20-years”, “once-in-50 years,” and “once-in-a-century” extreme rainfall conditions are planned to be set for our tests. Based on the peak flow method (Eqs 1 and 2), peak discharges at different rainfall frequencies in the test area and test flows are derived from the following (Table. 3):
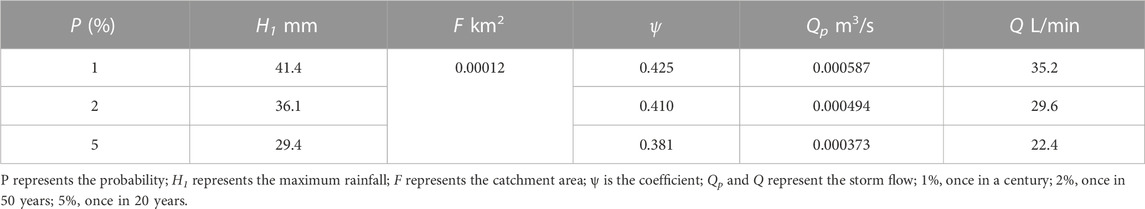
TABLE 3. Peak discharge under different rainfall frequencies.
wherein H1 (mm) represents the maximum precipitation. Kp is the modulus ratio coefficient of the Pearson type III curve, and
To obtain the internal seepage process of the slope under different conditions, including the change of moisture content, matrix suction, and pore water pressure, the flow meter, 20 sensors, and acquisition instrument are used in this study. The layout of the sensors in the test is mainly based on the overall size of the accumulation and related literature (Liu et al., 2021; Zhang et al., 2022). The sensor arrangement, including volumetric moisture content sensors, pore water pressure sensors, and matric suction sensors, is divided into three layers in total, each spaced 15 cm apart in the direction of the vertical slope, and the interval is 2, 2, 3, 3, and 4 m in the parallel slope direction. Moreover, a Polaris 3D laser scanner is set in front of the deposit to get the slope scouring pattern and deposit migration conditions. Monitoring instruments are set at three levels on the middle profile section of the deposits, 15, 30, and 45 cm from the surface of the deposits, respectively. The first layer is set with a volumetric moisture content sensor, pore water pressure sensor, and matric suction sensor; the second layer with a volumetric moisture content sensor and pore-water pressure sensor, which are vertically 2, 4, 7, and 10 m from the deposit top; and the third layer with volumetric moisture content sensors are vertically 2 and 4 m from the deposit top. The parameters of all the instruments and sensors are shown in Table 4 and Figure 9, respectively.
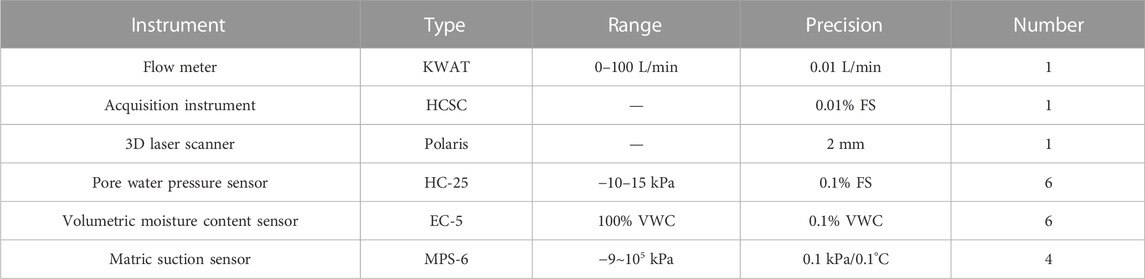
TABLE 4. Summary of the instruments.
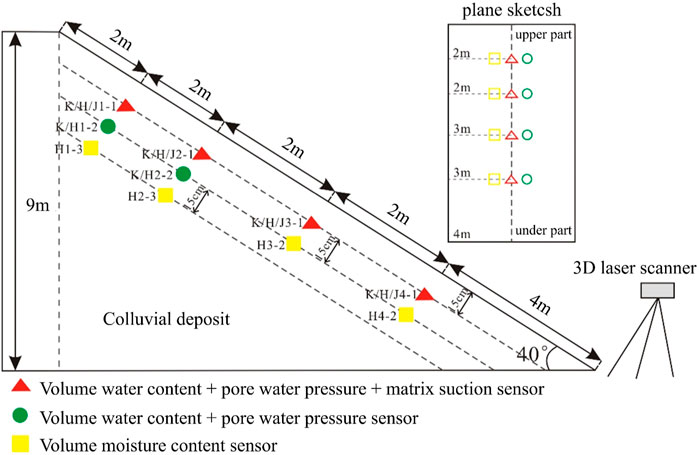
FIGURE 9. Layout of sensors for tests.
Landslide deposit instability is the co-effect of early rainfall and short-term heavy rainfall. Early rainfall changes the saturation degree of the deposit, playing a supplementary role in deposit migration later. It could be found that short-term heavy rainfall triggers the deposit instability and debris flow, so the test is designed by suddenly increasing the scouring flow after pre-wetting to get the concentrated runoff erosion effect. After repeated tests on the deposits in the study area, it has been discovered that the large-scale migration of matters under runoff erosion usually happens in the first 30 min (Hu et al., 2011). This study sets the duration of pre-wetting and scouring as 30 min and 60 min, respectively.
After 3D laser scanning the deposit slope, we pre-wet the deposit for 30 min with the flow of 2.6 L/min first and then scan the deposit slope again. We then increase the flow to 22.4, 29.6, and 35.2 L/min (three tests). The rainfall time duration is 60 min for each rainfall level. We keep recording the situation of the slope under scouring and gully characteristics by using a 3D laser scanner during tests.
4 Results
4.1 Mass migration
Figure 10 shows that the three tests have formed shallow gullies during their pre-wetting stages (duration time: 30 min), which are 0.07–0.1 m wide, 0.02–0.09 m deep, and approximately 7 m long. When the scouring flow is 22.4 L/min (Figure 10A), the soil on the surface is quickly eroded and flows. It is mainly presented by an erosion gully on the top and multiple thin gullies in the middle. As time goes on, the finer and smaller particles on the surface are taken away by the flow, and the gully mainly plays a role in progressive erosion to a width of 0.3 m and a depth of 0.12 m, with a maximum migration distance of 11.7 m. When the scouring flow rate increases to 29.6 L/min (Figure 10B), downcutting and surface erosion decrease at the beginning of this stage compared to a scouring flow of 22.4 L/min. Scouring is mainly presented in modes of downcutting and lateral erosion with weak migration power. In this period, the erosion gully is approximately 0.32 m wide, 0.22 m deep, and 14 m long. The eroded deposits are made of gravel stones, sandy soil, and silty clay at first and fine and small sand particles later. When the flow rate reaches 35.2 L/min (Figure 10C), the superficial matter is quickly carried down by a strong hydrodynamic force; gravel stones accumulate along both the sides of the eroded channel. The eroded gully takes shape in a short time with a width of approximately 0.33 m and a depth of approximately 0.2 m. Scouring in this stage is dominated by lateral erosion and downcutting. The eroded deposits mainly accumulate in the middle-upper and -lower parts of the slope. It should be noted that a flow of 29.6 L/min produces the maximum scouring depth of approximately 0.22 m and the largest migration distance of approximately 15.5 m, which has greater effects than the flow of 35.2 L/min (Figure 10D).
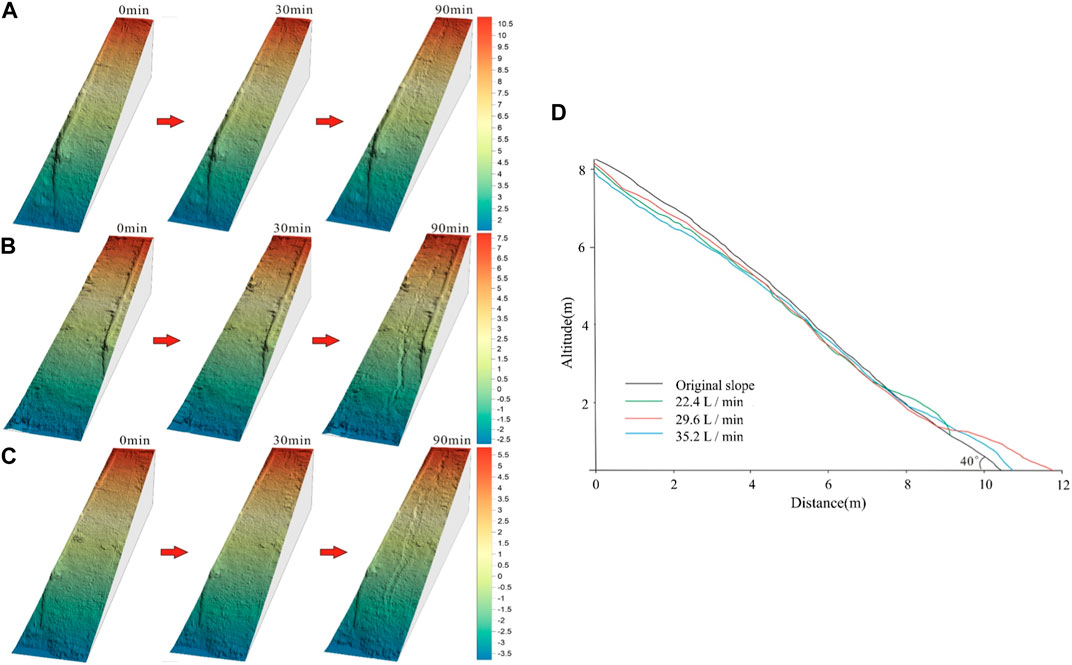
FIGURE 10. Response of material migration characteristics (unit: m). (A) 22.4 L/min; (B) 29.6 L/min; (C) 35.2 L/min; (D) sections.
4.2 Seepage characteristic
The volumetric water content responses of deposits are shown in Figure 11. The initial water content of the deposit is in the range of 14.5%–20.5%, which changes in the form of “increasing slowly—increasing quickly—high fluctuation of the water content—decreasing slowly” throughout the process of scouring. In the stage of pre-wetting, the volumetric water content of the points at 2 m and 4 m on the surface of the slope change. Sensors in the upper layers (at the depth of 15 cm) respond quickly within 10 min, while points at 7 m and 10 m almost have no response at this stage.
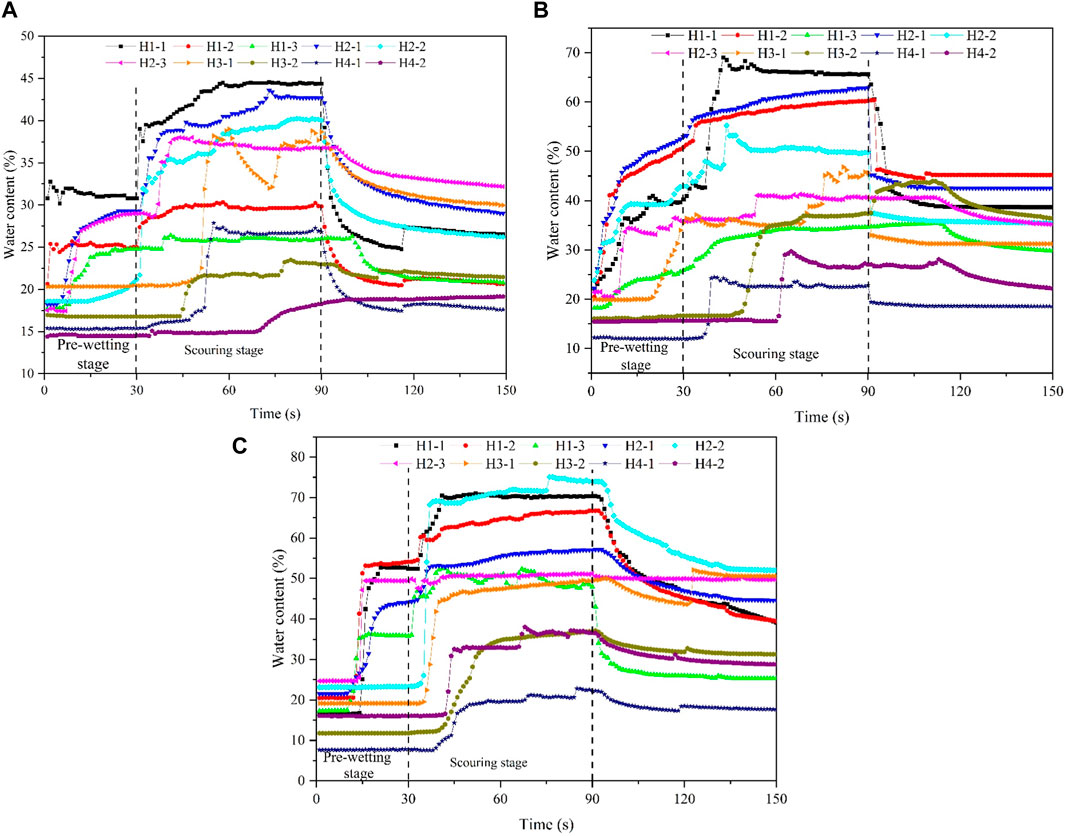
FIGURE 11. Response of the volumetric water content under different flushing flows. (A) 22.4 L/min; (B) 29.6 L/min; (C) 35.2 L/min.
At the scouring rate of 22.4 L/min, the sensor in the upper shallow layer starts to respond at the time of 40 min. The volumetric water content at point H1-1 increases sharply to 40.2%, while the volumetric water content at points H3-1 and H4-1 below change notably in a matter of 52 min. Points H3-2 and H4-2 deep under the ground fluctuate in a narrow range as the wetting front moves down to the monitoring level at the depth of 30 cm (Figure 11A). At the flow rate of 29.6 L/min, points H1-1, H1-2, H2-1, H2-2, and H3-1 are the first to respond to the runoff as their volumetric water contents increase quickly and stop at 65.6%, 60.1%, 62.8%, 49.7%, and 45.7%, respectively. Points H4-1 and H4-2 in the lower part and points H1-3 and H2-3 in the middle-upper part of the deposit respond first, with an increase in a relatively small amplitude (Figure 11B). When the flow rate increases to 35.2 L/min, points at different levels respond more quickly. At last, the volumetric water contents of points H1-1, H2-1, H3-1, and H4-1 stabilize at 70.3%, 57%, 49.5%, and 22.5%, respectively (Figure 11C).
Pore water pressure responses are shown in Figure 12. The pore water pressure of natural deposits is within the range of −100–0 Pa, suggesting that there is capillary water in the soil of the slope surface. The pore water pressure generally changes in slightly in a short time, increases quickly, fluctuates, and drops quickly. In the period of slope pre-wetting, monitoring points in the upper part have a notable response. Points K1-1 and K2-1 increase relatively faster. Points K3 and K4 in Figure 10B and K3 in Figure 10C also show an intensity response. When the flow rate is at 22.4 L/min at the beginning of scouring, points K1-1, K1-2, and K2-1 increase sharply in a short time with pore water pressures, while point K4 almost has no change during the whole course (Figure 12A). When the flow rate increases to 29.6 L/min, the monitoring points on the surface respond violently, with the frequent volatility of the monitoring curve for a short-term channel blockage (Figure 12B). During the period when the flow rate is 35.2 L/min, points K1 and K2 respond with large fluctuation amplitudes, while points K3 and K4 respond with smaller amplitudes (Figure 12C).
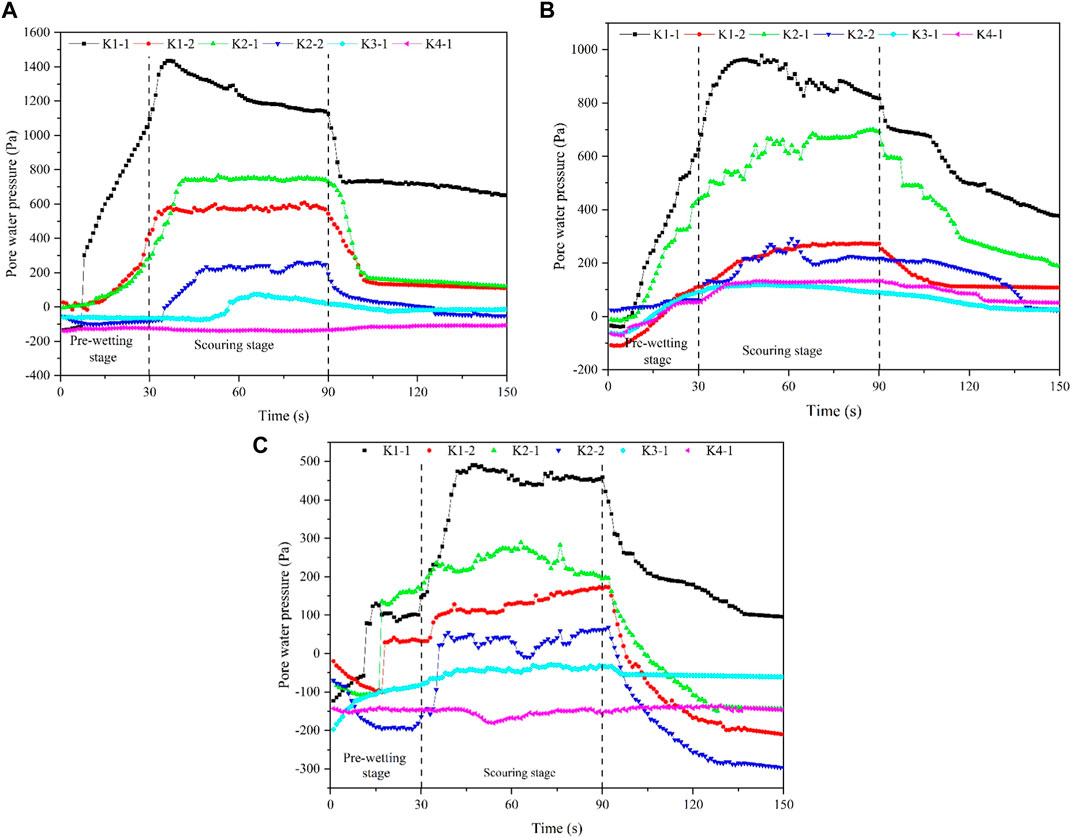
FIGURE 12. Response of the pore water pressure under different flushing flows. (A) 22.4 L/min; (B) 29.6 L/min; (C) 35.2 L/min.
The changes in the matric suction of deposits are shown in Figure 13. At the beginning of scouring, when the flow rate is at 22.4 L/min, points J1 and J2 change quickly. J1 drops from 11.6 kPa to 9.3 kPa in 41 min, and J2 drops to 9.7 kPa in 34 min but is almost maintained at 9.9 kPa later, while J3 and J4 only show a small change (Figure 13A). At the flow rate of 29.6 L/min, all monitoring points respond quickly under the effect of runoff seepage (Figure 13B). When the flow rate increases to 35.2 L/min (Figure 13C), the matric suction of J1 and J2 starts to decrease sharply in 43 min. The two points are presented with a longer response time in this stage than in the last two stages (22.4 L/min and 29.6 L/min); the possible reason might be that a large flow rate results in a slower seepage process, which lags the response speed. It should be noted that J3 and J4 have already responded in the pre-wetting period, but no surface runoff was observed.
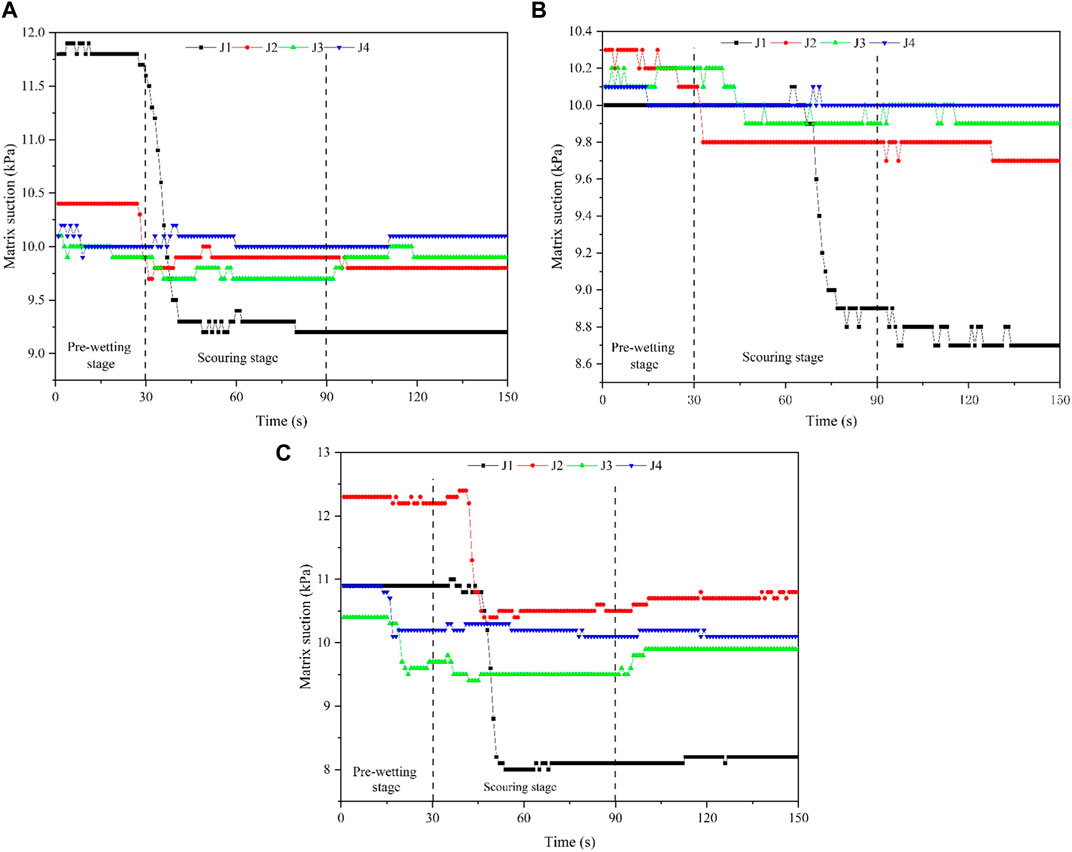
FIGURE 13. Response of matrix suction under different flushing flows. (A) 22.4 L/min; (B) 29.6 L/min; (C) 35.2 L/min.
5 Discussion
As Jiuzhaigou is located in a high relief area, landslide deposits generally take place at the gradient of 35°–42° in the study area (Figure 3), which meets the gradient for the debris flow (Chen et al., 2011; Ni et al., 2012; Ni et al., 2014; Zhang et al., 2019; Guo et al., 2021). So Jiuzhaigou provided the gradient conditions for developing surface erosion and the debris flow (Ling et al., 2020). The terrain slope leading to the debris flow disaster is mainly 29° ± 6° (Brayshaw and Hassan, 2009; Kang et al., 2017). Similarly, rainfall is an important excitation condition for a debris flow, and Harry (2007) found that heavy rainfall is necessary to generate surface runoff and induce a slope debris flow, with the combination of the debris flow rainfall intensity and cumulative precipitation (Tu et al., 2019) The tests in this study show that scouring is presented as runoff downcutting and surface erosion. As the event develops, large particles on the surface start to migrate first and keep colliding with different types of matter along the path in a high-speed flow, and then stop and accumulate on both sides of the channel under the effect of energy conversion and dissipation. In the mid-to-late stage, the deposit is mainly subject to headward erosion and lateral erosion, accompanied by a small scouring flow only carrying small particles (Figure 10).
In the 3-year flood season after the earthquake, the research area has more than twice the monthly precipitation of over 20 mm/d. However, in July and August 2020, the maximum daily precipitation values are up to 102 and 75.6 mm/d, respectively. Rainfall water infiltration constantly replaces gases in the deposit with water. As the wetting front slowly moves down, the pore water pressure keeps increasing, during which gases in the soil dissipate out from the ground, and matric suction first simultaneously shows a tendency of fluctuating within a narrow range and then dropping sharply at a certain depth. Water infiltration reduces the inner matric suction of the slope. However, with the increasing scouring flow, the decrease in matric suction is delayed, which means that the scouring flow has a negative relationship with the infiltration speed to some degree. From another point of view, it also suggests that the greater the rainfall intensity in a short time, the higher the scouring flow rate of the runoff (Figure 12).
The process of development from the deposit start-up to the slope debris flow is a complex evolution. According to Howard et al. (1988), the essence of developing the debris flow is all about the increasing soil pore water pressure, causing shear strength reduction and shallow layer landslides, in turn leading to the debris flow. The tests in this paper simulate how the deposits develop into the slope debris flow under rainfall runoff erosion. Based on previous studies (Lu et al., 2011; Zhuang et al., 2013; Lyu and Xu, 2019), the initiating process is divided into the early rainfall infiltration stage and the surface runoff erosion start-up stage (Figure 14). In natural conditions, the deposits contain low volumetric water content, so pre-wetting water infiltrates quickly. As pre-wetting develops into an alternation of blockage and strong currents in the short term, large amounts of fine particles are carried away by water, which greatly changes the soil structure and results in the frequent fluctuation of the volumetric water content in the scouring stage. At 3–10 min after runoff infiltration, the wetting front reaches the monitoring point, and the volumetric water content rises sharply and stays at a stable level after reaching the peak (Figure 11). With the increasing scouring flow, surface runoff takes form gradually, the progress of infiltration slows down, and the large-scale migration of matter on the surface of the deposit is easy to be initiated via scouring erosion.
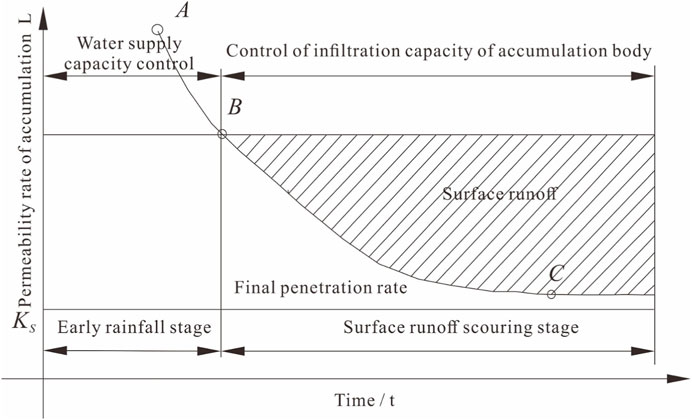
FIGURE 14. Runoff infiltration process.
The entire instability and evolution process of deposits under runoff erosion conditions could be divided into four stages (Figure 15). The early infiltration stage: the small flow of water quickly infiltrates deep down from the surface of the natural deposit and moistens the soil into an unsaturated state. The pore water pressure increases slowly, and fine particles on the surface migrate a short distance. A rill with mild erosion effects is developed (Figure 15A). Debris flow stage: the soil water content grows gradually under the early seepage effect of water. Fine particle aggregations deep in the wet areas make up a water-resisting layer. The surface soil strength decreases at the same time. In case of strong runoff erosion, water cannot infiltrate quickly and massive amounts of water carry away the loose matter on the surface of deposits. The loose matter keeps colliding and scraping with the others, while the flow in this stage develops into cascade slipstreams (Figure 15B). Depositing stage: the debris flow moving at a high speed under the coupling effect of water and gravity keeps eroding the loose matter on the way and the solid matter content keeps increasing. However, for the distinct property difference between the flow and matter on both sides, the kinetic energy is gradually used up and the matter finally accumulates on both sides of the gully and the foot of the slope (Figure 15C). Local erosion stage: the local soil gets infiltrated with water and reaches a saturated state, the pore water pressure increases to a peak, and matric suction decreases remarkably. The gully is subject to tension and shear deformations, lateral erosion, and headward erosion (Figure 15D). The deposit is now in the alternative mode between locally eroded and stable states.
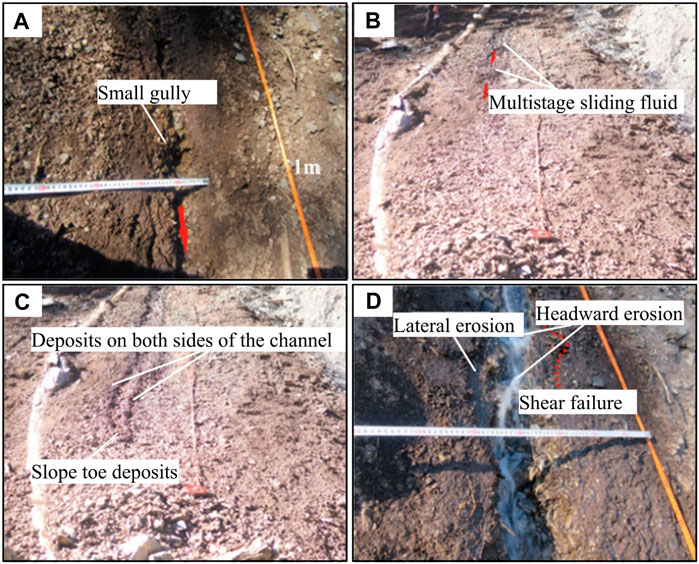
FIGURE 15. Start-up process of deposits under runoff erosion. (A) Early infiltration stage; (B) debris flow stage; (C) depositing stage; (D) local erosion stage.
Variations in the volumetric water content, pore water pressure, matric suction, and matter migration distance under different runoff erosion scenarios are shown in Figure 16, which are collected from the surface monitoring points (15 cm from the surface) of the middle-upper part of the slope having the most significant response in the test. Under the scouring rate of 22.4 L/min, the volumetric water content of the deposit gradually increases to 42%. Although the soil is unsaturated now, its start-up force is strengthened by the seepage force of the runoff. Meanwhile, the surge of the pore water pressure and rapid reduction of matric suction weaken the start-up resistance of the deposit. So the deposit loses its stability locally and develops with the erosive gully. However, the matter migration distance is short. When the scouring rate grows to 29.6 L/min, the volumetric water content quickly increases to 62.8%, the pore water pressure increases in waves (Figure 16A), and matric suction has a small reduction (Figure 16B). As water infiltrates the surface soil until it is full, the shear strength decreases sharply; the saturated soil loses its stability and moves to the farthest distance of 17 m as a start-up is much greater than the start-up resistance. When the scouring rate reaches 35.2 L/min, the soil is not saturated at the beginning, and both pore water pressure and matric suction show a small range of changes according to Figure 16. However, the large runoff intensity imposes a large draw force on the surface soil, which is much greater than the start-up resistance, so fine particles on the surface of the deposit initiate soon and move 15 m away.
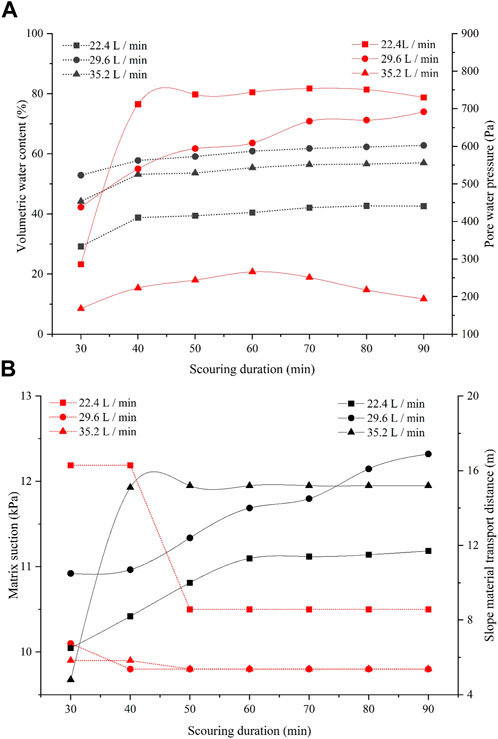
FIGURE 16. Changes of the parameters under different runoff erosions. (A) Volumetric water content and pore; (B) matrix suction (kPa) and slope material transport distance (m) water pressure.
6 Conclusion
Through scour tests, the initiation conditions and process of the deposit flow are analyzed. The geohazards deposit in the Jiuzhaigou earthquake area has the characteristics of a steep slope, large number of fine grains in soil pores, good permeability, strong hydrodynamic force, and weak scouring resistance. The initiation process of the deposit is divided into four parts: the early infiltration, debris flow, deposition, and locally erosion stage. On account of the large slope angle of the deposit, the particles of the deposit grow larger and coarser from the top to the bottom and from the sides to the middle. Under the effect of rainfall, the deposits which are easily developed into a slope surface debris flow 3 years after the earthquake is a long-term threat to the study area.
The matter on the surface of the slope is subject to downcutting, surface erosion, headward erosion, and lateral erosion during scouring. The volumetric water content increases slowly at first, then increases quickly, changes into waves, and decreases slowly in the end; the pore water pressure shows no change at first. Then, it soon increases quickly, changes into waves, and decreases at last, while matric suction decreases after a period of fluctuation at a certain depth. Simply speaking, the increase in the soil water content, a surge of pore water pressure, a rapid drop of matric suction, and a change in the runoff intensity would lead to the start of a deposit. The results of this study are of great significance for the prediction of long-term effects and for the ecological governance of post-earthquake debris flow activities.
Data availability statement
The original contributions presented in the study are included in the article/Supplementary Material; further inquiries can be directed to the corresponding authors.
Author contributions
SC and XP conceived and designed the test. TJ and JL participated in the experimental steps. XP and TJ wrote the main manuscript text. SC and TJ prepared all the figures. XP obtained financial support for the project. SC revised the manuscript. All authors contributed to the article and approved the submitted version.
Funding
This research is funded by the National Science Foundation of China (No. 41931296), the State Key Laboratory of Geohazard Prevention and Geoenvironment Protection Independent Research Project (No. SKLGP2021Z014), and the Natural Science Foundation of Sichuan Province, China (No. 2023NSFSC0789).
Conflict of interest
The authors declare that the research was conducted in the absence of any commercial or financial relationships that could be construed as a potential conflict of interest.
Publisher’s note
All claims expressed in this article are solely those of the authors and do not necessarily represent those of their affiliated organizations, or those of the publisher, the editors, and the reviewers. Any product that may be evaluated in this article, or claim that may be made by its manufacturer, is not guaranteed or endorsed by the publisher.
References
Brayshaw, D., and Hassan, M. A. (2009). Debris flow initiation and sediment recharge in gullies. Geomorphology 109 (3-4), 122–131. doi:10.1016/j.geomorph.2009.02.021
Chang, Z., Du, Z., Zhang, F., Huang, F., Chen, J., Li, W., et al. (2020). Landslide susceptibility prediction based on remote sensing images and GIS: Comparisons of supervised and unsupervised machine learning models. Remote Sens. 12, 502. doi:10.3390/rs12030502
Chen, N. S., Hu, G. S., Deng, M. F., Zhou, W., Yang, C. L., Han, D., et al. (2011). Impact of earthquake on debris flows — a case study on the wenchuan earthquake. J. Earthq. Tsunami 5 (5), 493–508. doi:10.1142/s1793431111001212
Chen, N., Li, J., Liu, L., Yang, C., and Liu, M. (2018). Post-earthquake denudation and its impacts on ancient civilizations in the Chengdu Longmenshan region, China. Geomorphology 309, 51–59. doi:10.1016/j.geomorph.2018.02.007
Choi, Y., Hwan, H., Lee, H., et al. (2017). Estimation of magnitude of debris flow and correlation analysis between influencing factors. J. Korean Geosynth. Soc. 16 (2), 79–82. doi:10.4166/kjg.2017.69.1.79
Cui, P., Guo, C. X., Zhou, J. W., Hao, M. h., and Xu, F. g. (2014). The mechanisms behind shallow failures in slopes comprised of landslide deposits. Eng. Geol. 180, 34–44. doi:10.1016/j.enggeo.2014.04.009
Fan, X. M., Domenech, G., Scaringi, G., Huang, R., Xu, Q., Hales, T. C., et al. (2018). Spatio-temporal evolution of mass wasting after the 2008 M-w 7.9 Wenchuan earthquake revealed by a detailed multi-temporal inventory. Landslides 15 (12), 2325–2341. doi:10.1007/s10346-018-1054-5
Fan, X. M., Yunus, A. P., Scaringi, G., Catani, F., Siva Subramanian, S., Xu, Q., et al. (2021). Rapidly evolving controls of landslides after a strong earthquake and implications for hazard assessments. Geophys. Res. Lett. 48 (1). doi:10.1029/2020gl090509
Guo, X., Chen, X., Song, G., Zhuang, J., and Fan, J. (2021). Debris flows in the lushan earthquake area: Formation characteristics, rainfall conditions, and evolutionary tendency. Nat. Hazards 106 (3), 2663–2687. doi:10.1007/s11069-021-04559-2
Harry, M. B. (2007). Application of physical modelling of debris flow triggering to field conditions: Limitations posed by boundary conditions. Eng. Geol. 91, 25–33. doi:10.1016/j.enggeo.2006.12.010
Hovius, N., Meunier, P., Lin, C. W., Chen, H., Chen, Y. G., Dadson, S., et al. (2011). Prolonged seismically induced erosion and the mass balance of a large earthquake. Earth Planet. Sci. Lett. 304 (3-4), 347–355. doi:10.1016/j.epsl.2011.02.005
Howard, T. R., Baldwin, J. E., and Donley, H. F. (1988). “Landslides in Pacifica, California, caused by the storm,” in Landslides, Floods,and marine effects of the storm of january 3-5,1982. Editors S. D. Ellen, and G. F. Wieczorek (San Francisco Bay Region, California: U. S. Geological Survey), 163–184.
Hu, M. J., Wang, R., and Shen, J. H. (2011). Rainfall, landslide and debris flow intergrowth relationship in Jiangjia Ravine. J. Mt. Sci. 8 (4), 603–610. doi:10.1007/s11629-011-2131-6
Hu, W., Xu, Q., van Asch, T., and Zhu, X. (2014). Flume tests to study the initiation of huge debris flows after the Wenchuan earthquake in S-W China. Eng. Geol. 182, 121–129. doi:10.1016/j.enggeo.2014.04.006
Hu, W., Scaringi, G., Xu, Q., and Huang, R. (2018). Internal erosion controls failure and runout of loose granular deposits: Evidence from flume tests and implications for postseismic slope healing. Geophys. Res. Lett. 45 (11), 5518–5527. doi:10.1029/2018gl078030
Hu, X. D., Hu, K. H., Tang, J. B., et al. (2019). Quantitative assessment of the impact of earthquake induced geohazards on natural landscapes in Jiuzhaigou Valley. J. Mt. Sci. 16 (2), 202–213.
Huang, F. M., Cao, Z. S., Guo, J. F., and Jiang, S. H. (2020a). Comparisons of heuristic, general statistical and machine learning models for landslide susceptibility prediction and mapping. CATENA 191, 104580. doi:10.1016/j.catena.2020.104580
Huang, F. M., Zhang, J., Zhou, C. B., et al. (2020b). A deep learning algorithm using a fully connected sparse autoencoder neural network for landslide susceptibility prediction. Landslides 17 (01), 217–229.
Huang, F. M., Cao, Z. S., Jiang, S. H., Zhou, C., Huang, J., and Guo, Z. (2020c). Landslide susceptibility prediction based on a semi-supervised multiple-layer perceptron model. Landslides 17, 2919–2930. doi:10.1007/s10346-020-01473-9
Iverson, R. M. (2000). Landslide triggering by rain infiltration. Water Resour. Res. 36 (7), 1897–1910. doi:10.1029/2000wr900090
Jiang, S. H., Huang, J., Huang, F. M., et al. (2018). Modelling of spatial variability of soil undrained shear strength by conditional random fields for slope reliability analysis [J]. Appl. Math. Model. 63, 374∼389.
Kang, S., Lee, S., Vasu, N. N., Park, J. Y., and Lee, D. H. (2017). Development of an initiation criterion for debris flows based on local topographic properties and applicability assessment at a regional scale. Eng. Geol. 230, 64–76. doi:10.1016/j.enggeo.2017.09.017
Kirby, E., Whipple, K. X., Burchfiel, B. C, Tang, W., Berger, G., Sun, Z., et al. (2000). Neotectonics of the Min Shan, China: Implications for mechanisms driving Quaternary deformation along the eastern margin of the Tibetan Plateau. GSA Bull. 112 (3), 375–393.
Lei, H., Wang, X. L., Hou, H., Su, L., and Yu, D. (2018). The earthquake in Jiuzhaigou county of northern sichuan, China on August 8, 2017. Nat. Hazards 90 (2), 1021–1030. doi:10.1007/s11069-017-3064-3 021–
Li, T. T., Huang, R. Q., and Pei, X. J. (2016). Variability in rainfall threshold for debris flow after Wenchuan earthquake in Gaochuan River watershed, Southwest China. Nat. Hazards 82 (3), 1967–1980. doi:10.1007/s11069-016-2280-6
Li, Y., Huang, C., Yi, S., and Wu, C. (2017). Study on seismic fault and source rupture tectonic dynamic mechanism of Jiuzhaigou Ms7.0 earthquake. J. Eng. Geol. 25 (4), 1141–1150.
Li, Z., Han, Q., Lu, J., and Long, W. (2018). Structural characteristics and faults around the Jiuzhaigou earthquake area. J. Chengdu Univ. Technol. (Nat. Sci. Ed.) 45 (6), 649–658.
Li, D., Ding, Z., Zhan, Y., Wu, P., Chang, L., and Sun, X. (2021). Upper crustal velocity and seismogenic environment of the M7.0 Jiuzhaigou earthquake region in Sichuan, China. Earth Planet. Phys. 5 (4), 348–361. doi:10.26464/epp2021038
Lin, J. C., Petley, D., Jen, C. H., Koh, A., and Hsu, M. L. (2006). Slope movements in a dynamic environment-A case study of Tachia River, Central Taiwan. Quat. Int. 147 (1), 103–112. doi:10.1016/j.quaint.2005.09.011
Ling, S. X., Sun, C. W., Li, X. N., Ren, Y., Xu, J., and Huang, T. (2020). Characterizing the distribution pattern and geologic and geomorphic controls on earthquake-triggered landslide occurrence during the 2017 Ms 7.0 Jiuzhaigou earthquake, Sichuan, China. Landslides 18, 1275–1291. doi:10.1007/s10346-020-01549-6
Liu, S., Hu, K. H., Zhang, Q., Zhang, S., Hu, X., and Tang, D. (2021). Quantitative analysis of the effects of an earthquake on rainfall thresholds for triggering debris-flow events. Front. Earth Sci. 9. doi:10.3389/feart.2021.676470
Lu, X., Ye, T., Cui, P., Hu, K., and Chen, X. (2011). Numerical investigation on the initiation mechanism of debris-flow under rainfall. J. Mt. Sci. 8 (4), 619–628. doi:10.1007/s11629-011-2129-0
Lyu, Y., and Xu, B. (2019). Research on movement process and characteristics of debris flow under different slope conditions based on numerical simulation. Fresenius Environ. Bull. 28 (12), 9593–9601.
Ni, H. Y., Zheng, W. M., Tie, Y. B., Su, P. C., Tang, Y. Q., Xu, R. G., et al. (2012). Formation and characteristics of post-earthquake debris flow: A case study from wenjia gully in mianzhu, sichuan, SW China. Nat. Hazards 61 (2), 317–335. doi:10.1007/s11069-011-9914-5
Ni, H., Tang, C., Zheng, W., Xu, R., Tian, K., and Xu, W. (2014). An overview of formation mechanism and disaster characteristics of post-seismic debris flows triggered by subsequent rainstorms in wenchuan earthquake extremely stricken areas. Acta Geol. Sinica-English Ed. 88 (4), 1310–1328. doi:10.1111/1755-6724.12290
Park, H. J., Lee, J. H., and Woo, I. (2013). Assessment of rainfall-induced shallow landslide susceptibility using a GIS-based probabilistic approach. Eng. Geol. 161, 1–15. doi:10.1016/j.enggeo.2013.04.011
Phoon, K. K., and Kulhawy, F. H. (1999a). Characterization of geotechnical variability. Can. Geotech. J. 36 (4), 612–624.
Phoon, K. K., and Kulhawy, F. H. (1999b). Evaluation of geotechnical property variability. Can. Geotech. J. 36 (4), 625–639.
Sidle, R. C., and Bogaard, T. A. (2016). Dynamic Earth system and ecological controls of rainfall-initiated landslides. Earth-Science Rev. 159, 275–291. doi:10.1016/j.earscirev.2016.05.013
Take, W. A., Bolton, M. D., Wong, P. C. P., and Yeung, F. J. (2004). Evaluation of landslide triggering mechanisms in model fill slopes. Landslides 1 (3), 173–184. doi:10.1007/s10346-004-0025-1
Teeca, P. R., Galgaro, A., Genevois, R., and Deganutti, A. M. (2003). Development of a remotely controlled debris flow monitoring system in the Dolomites (Acquabona, Italy). Hydrol. Process. 17 (9), 1771–1784. doi:10.1002/hyp.1212
Terajima, T., Miyahira, E. I., Miyajima, H., Ochiai, H., and Hattori, K. (2014). How hydrological factors initiate instability in a model sandy slope. Hydrol. Process. 28 (23), 5711–5724. doi:10.1002/hyp.10048
Tian, Y., Xu, C., Ma, S., Xu, X., Wang, S., and Zhang, H. (2019). Inventory and spatial distribution of landslides triggered by the 8th August 2017 MW 6.5 Jiuzhaigou earthquake, China. J. Earth Sci. 30 (1), 206–217. doi:10.1007/s12583-018-0869-2
Torres, R., Dietrich, W. E., Montgomery, D. R., Anderson, S. P., and Loague, K. (1998). Unsaturated zone processes and the hydrologic response of a steep, unchanneled catchment. Water Resour. Res. 34 (8), 1865–1879. doi:10.1029/98wr01140
Travis, Q. B., Houston, S. L., Marinho, F. A. M., and Schmeeckle, M. (2010). Unsaturated infinite slope stability considering surface flux conditions. J. Geotechnical Geoenvironmental Eng. 136 (7), 963–974. doi:10.1061/(asce)gt.1943-5606.0000301
Tu, G. X., Huang, D., Huang, R. Q., and Deng, H. (2019). Effect of locally accumulated crushed stone soil on the infiltration of intense rainfall: A case study on the reactivation of an old deep landslide deposit. Bull. Eng. Geol. Environ. 78 (7), 4833–4849. doi:10.1007/s10064-019-01460-y
Wang, X. M., and Mao, H. (2022). Spatio-temporal evolution of post-seismic landslides and debris flows: 2017 Ms 7.0 Jiuzhaigou earthquake. Environ. Sci. Pollut. Res. 29 (11), 15681–15702. doi:10.1007/s11356-021-16789-9
Yang, J., Chen, X., Wang, H., et al. (2016). An experimental study of relationship between fine grain content and permeability coefficient of debris flow deposits. Rock Soil Mech. 37 (11), 3184–3190.
Yang, F., Fan, X. M., Subramanian, S. S., Dou, X., Xiong, J., Xia, B., et al. (2021). Catastrophic debris flows triggered by the 20 August 2019 rainfall, a decade since the Wenchuan earthquake, China. Landslides 18 (9), 3197–3212. doi:10.1007/s10346-021-01713-6
Yi, S., Wu, C., Li, Y., and Huang, C. (2018). Source tectonic dynamics features of Jiuzhaigou M-s 7.0 earthquake in Sichuan Province, China. J. Mt. Sci. 15 (10), 2266–2275. doi:10.1007/s11629-017-4703-6
Yinglan, A., Wang, G., Sun, W., Xue, B., and Kiem, A. (2018). Stratification response of soil water content during rainfall events under different rainfall patterns. Hydrol. Process. 32 (20), 3128–3139. doi:10.1002/hyp.13250
Zhang, S., and Zhang, L. M. (2017). Impact of the 2008 Wenchuan earthquake in China on subsequent long-term debris flow activities in the epicentral area. Geomorphology 276, 86–103. doi:10.1016/j.geomorph.2016.10.009
Zhang, S., Zhang, L. M., and Chen, H. X. (2014). Relationships among three repeated large-scale debris flows at Pubugou Ravine in the Wenchuan earthquake zone. Can. Geotechnical J. 51 (9), 951–965. doi:10.1139/cgj-2013-0368
Zhang, Y., Zhang, G., Hetland, E. A., Shan, X., Zhang, H., Zhao, D., et al. (2018). Source Fault and slip distribution of the 2017 M-w 6.5 Jiuzhaigou, China, earthquake and its tectonic implications. Seismol. Res. Lett. 89 (4), 1345–1353. doi:10.1785/0220170255
Zhang, Z., Xie, J., Yu, D., and Wen, Z. J. (2019). Analysis of a debris flow after wenchuan earthquake and discussion on preventive measures. Therm. Sci. 23 (3), 1563–1570. doi:10.2298/tsci180811224z
Zhang, Y. Y., Huang, C., Huang, C., and Li, M. (2022). Spatio-temporal evolution characteristics of typical debris flow sources after an earthquake. Landslides 19 (9), 2263–2275. doi:10.1007/s10346-022-01883-x
Zhou, J. W., Cui, P., Yang, X. G., Su, Z. m., and Guo, X. j. (2013). Debris flows introduced in landslide deposits under rainfall conditions: The case of Wenjiagou gully. J. Mt. Sci. 10 (2), 249–260. doi:10.1007/s11629-013-2492-0
Zhuang, J., Cui, P., Peng, J., Hu, K. h., and Iqbal, J. (2013). Initiation process of debris flows on different slopes due to surface flow and trigger-specific strategies for mitigating post-earthquake in old Beichuan County, China. Environ. Earth Sci. 68 (5), 1391–1403. doi:10.1007/s12665-012-1837-2
Keywords: Jiuzhaigou cultural heritage site, landslide, ecological geological environment, debris flow, site scour test
Citation: Pei X, Jiang T, Cui S, Guo B and Liang J (2023) In-situ testing for characterizing the landslide deposit in Jiuzhaigou cultural heritage site after the 2017 earthquake. Front. Earth Sci. 11:1232278. doi: 10.3389/feart.2023.1232278
Received: 31 May 2023; Accepted: 17 July 2023;
Published: 07 August 2023.
Edited by:
Faming Huang, Nanchang University, ChinaReviewed by:
Chong Xu, Ministry of Emergency Management, ChinaGaetano Pecoraro, University of Salerno, Italy
Copyright © 2023 Pei, Jiang, Cui, Guo and Liang. This is an open-access article distributed under the terms of the Creative Commons Attribution License (CC BY). The use, distribution or reproduction in other forums is permitted, provided the original author(s) and the copyright owner(s) are credited and that the original publication in this journal is cited, in accordance with accepted academic practice. No use, distribution or reproduction is permitted which does not comply with these terms.
*Correspondence: Tao Jiang, amlhbmdfdGFvQHN0dS5jZHV0LmVkdS5jbg==; Shenghua Cui, Y3Vpc2hlbmdodWExOEBjZHV0LmVkdS5jbg==