 Zhengyi Yuan
 Jing Zhao
 Yuan Huang
 Huaizhong Yu
 Anfu Niu
 Haiping Ma3
95% of researchers rate our articles as excellent or good
Learn more about the work of our research integrity team to safeguard the quality of each article we publish.
Find out more
ORIGINAL RESEARCH article
Front. Earth Sci. , 17 October 2023
Sec. Solid Earth Geophysics
Volume 11 - 2023 | https://doi.org/10.3389/feart.2023.1232205
This article is part of the Research Topic Pre-, Co-, and Post-Seismic Processes of Recent Earthquakes in Mainland China View all 9 articles
A MS6.8 earthquake struck Luding Country in Ganzi Prefecture, Sichuan Province on 5 September 2022. The earthquake occurred on the Moxi segment of Xianshuihe fault zone (XFZ), one of the most seismically active faults in the Chinese mainland. In this study, multiple periods of the Global Positioning System (GPS) velocity field and continuous observational data are collected to analysis the tectonic deformation and evolution characteristics before the Luding earthquake, from the perspectives of the kinematic behavior of seismogenic fault, the multi-scale strain features around the study region, and the variation of GPS baselines across the epicenter area. Then the following conclusions are obtained: 1) The accelerated compression of baselines SCGZ-SCXJ (Ganzi to Xiaojin in Sichuan province) and SCLH-SCXJ (Luhuo to Xiaojin in Sichuan province) in Bayan Har block indicate that under the influence of the coseismic rupture of Maduo MS7.4 earthquake, the boundary faults decoupled and accelerated the push southward and eastward, leading to the acceleration of strain accumulation and the increase of seismic risk in the divergence area bounded by the southeastern XFZ and the southwestern Longmenshan fault zone (LFZ). 2) Luding earthquake located in the weakened region around the edge of the large strike-slip fault zone with high shear strain rate, and the tensile zone of the strain perpendicular to the fault direction, denoting that the reduction of the normal strain in the locked background is strongly related to fault rupture and earthquake nucleation.
Since the Cenozoic era (∼55 Ma), the collision between the Indian and Eurasian plates has caused strong deformation and uplift of the Tibet Plateau (Molnar and Tapponnier, 1975). As an important site for the southeast extrusion of plateau materials under plate collision and convergence, the deformation characteristics and dynamic processes of the southeastern Tibet Plateau are crucial for understanding the tectonic evolution of the Tibet Plateau. In the past decades, extensive GPS observations showed that the region deformation is mainly featured by clockwise rotation and flow-slide around the eastern Himalayan syntaxis (Wang and Shen, 2020). There are two main hypotheses about the deformation mode of the southeastern Tibet Plateau: one is the block model, where deformation is mainly absorbed by the sliding of the main boundary faults (Tapponnier et al., 2001; Gan et al., 2007; Zheng et al., 2017); The another one is a continuous deformation model, which means that the deformation exhibits continuous and dispersed deformation characteristics (Molnar and Tapponnier, 1975; Flesch et al., 2001; Zhang et al., 2004). In addition, the dynamic mechanism of lithospheric deformation in the southeastern Tibet Plateau has always been one of the hot spots of interest to seismologists. In recent years, end-member models such as the tectonic extrusion model (Tapponnier et al., 1982), gravitational spreading model (England and Houseman, 1988; Liu and Yang, 2003), and the lower crustal flow model (Clark and Royden, 2000; Bischoff and Flesch, 2018) have been proposed, then combined with numerical simulation and other methods, the present deformation and strain distribution characteristics of the region were explained (Li et al., 2019).
Xianshuihe fault zone (XFZ) located in the southeastern margin of the Tibetan Plateau. This fault zone starts from the northern Ganzi in the west, passes through Zhuwo, Luhuo, Daofu, Laoqianning and Kangding in the southeast, and intersects with Longmenshan and Anninghe fault zones near Shimian city, with a total length beyond 350 km. As the southwestern boundary of the Bayan Har block and the northeastern boundary of the Sichuan-Yunnan block, the XFZ plays an extremely import role in regulating the collision and extrusion of the Indian and Eurasian plates (Sun et al., 2021). Because of the strong dynamic action and tectonic deformation, the XFZ has been the most seismically active sinistral-slip fault zone in the Chinese mainland (Molnar and Deng, 1984; Allen et al., 1991; Pan et al., 2020). The statistical results of historical and instrumental seismic records show that since 1700, the XFZ has experienced two active periods of large earthquakes from 1700 to 1816, 1893 to the present. The first active period caused the rupture of the entire fault zone, while the second ones, when we are now in, only caused the rupture of most part of the faults in the northwest section and a small part of the faults in the southeast section. Six earthquakes above MS6.7 occurred successively in the northwest section. Before the Luding MS6.8 earthquake, only the Zheduotang MS7.5 earthquake occurred in the southeast section in 1955, which caused about 30∼35 km fault rupture. No earthquakes above MS6.7 occurred in many parts of the southeast sections (Papadimitriou et al., 2004; Wen et al., 2008; Xu et al., 2013; Zhao et al., 2015).
Earthquake is a series of processes about local stress-strain accumulation, release and adjustment caused by crustal movement, and crustal deformation is the direct response of seismic activities on the earth surface (Jin et al., 2021). The research results on the deformation characteristics and seismic risk assessment of the XFZ show that the fault presents overall sinistral compression movement. Due to the differences in the geometric characteristics of the fault, the activity intensity and mechanical properties are different from section to section, and the tectonic deformation has the localized feature (Zhao et al., 2018; Bai et al., 2022). Based on geodesy observation, the study of the spatio-temporal evolution characteristics of the tectonic deformation about the active blocks and the XFZ in southeastern Tibetan Plateau, is helpful to deepen the understanding of the seismogenic and geodynamic mechanism of the Luding earthquake, and further promote the practice of operable earthquake forecasting (OEF).
We calculated the multi-scale strain parameters of the Luding earthquake and its surroundings using GPS velocity field during 2017–2020 (272 stations, Figure 1), and quantitatively analyzed the evolution. The GPS velocity field was processed using the GAMIT/GLOBK software (Herring et al., 2006), and the computation process refers to Wang (2009). As shown by the green arrow in Figure 1, the GPS velocity field on the International Terrestrial Reference Frame (ITRF 2005) shows remarkable southeastern movement trend in the study area. In order to obtain the differential crustal movement characteristics between different blocks and faults, the regional Euler vector method with three parameters is used to simulate the crustal movement trend term, then the residual velocity field is used to solve strain parameters (Niu et al., 2002; Gao et al., 2018). Due to the small internal deformation of the South China block (SCB), which located in the east of the Sichuan-Yunnan block, it seems as a rigid block to fit the Euler rotation vector. After deducting overall rotations, the velocity field relative to the South China block is obtained (as shown by the red arrow in Figure 1). The result shows that the sinistral-slip movement along the eastern boundary of the Sichuan-Yunnan block is significant, while the movement of the LFZ along the southeastern boundary of Bayan Har is blocked and characterized by extrusion and dextral-slip movement.
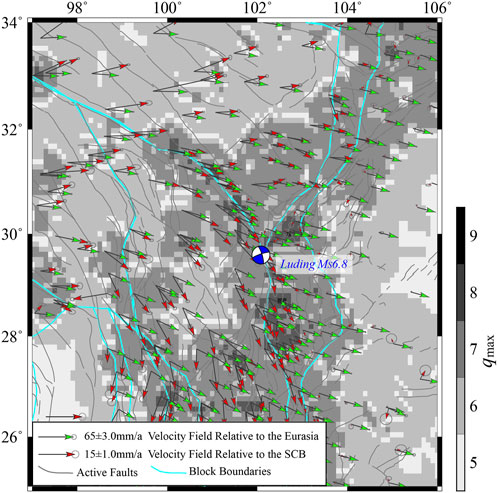
FIGURE 1. The GPS velocity field of the study region during 2017–2020 and the spatial distribution of the maximum decomposition scale of spherical wavelet. The green and red arrows denote the velocity relative to the Eurasia and South China Block, respectively. The gray ellipses represent the errors of GPS velocity, with the 67% confidence. The blue beachball shows the focal mechanism of the Luding MS6.8 earthquake.
The continuous GPS data used in the study are based on station time series that was based on the ITRF 2014, and were processed with the GAMIT, GLOBK and QOCA software packages (Herring et al., 2006). GPS single time series are subject to the influences of reference frame, ionosphere, troposphere, etc., and these influences are correlated to a certain extent. Therefore, it is necessary to find some parameters with physical significance that are less affected by common errors to describe crustal deformation information (Dong et al., 2002). The time series results for the baseline between two GPS stations for any given station pair, and the strain parameters calculated by spherical wavelet-based method are used for the analysis of deformation characteristics in our study.
The secondary blocks within the plate boundaries undergo rigid rotation and elastoplastic deformation under the action of the surrounding blocks. Therefore, after deducting the regional global rotation component fitted by the Euler motion model and velocity field, the spatial distribution of the residual velocity component can highlight the local deformation characteristics, thus reflecting the differentiated movements of different tectonic units. The calculation method of the Euler pole of the block is shown in following formula:
Where (VE, VN) is the velocity in eastern and northern direction, (λ, ϕ) is the longitude and latitude of the points inside the block, r is the mean curvature radius, (ωx, ωy, ωz) is the Euler vector of the block motion.
The methods for calculating the strain parameters according to GPS velocity field can be roughly divided into two types: physical and mathematical methods. The physical method is mainly based on dislocation theory or block kinematic model, and the strain parameter inversion is carried out with the velocity field as the constraint (Zhang et al., 2005; Zhao et al., 2013). The mathematical method is to solve the strain parameters directly from the velocity field according to the displacement-velocity differential relation. The least-squares collocation method (Jiang and Liu, 2010; Wu et al., 2011), spherical wavelet-based method (Tape et al., 2009) and Gussian weighting interpolation method (Shen et al., 2015) are commonly used. Different from deformation of plate edges, the seismogenic and dynamic environment in Chinese mainland is more complex under the combined action of the collision, subduction and extrusion around multiple plates, thus the tectonic deformation presents multi-scale spatial characteristics (Xu and Wu, 2016). In addition, related studies have shown that seismic deformation and strain accumulation within plates are usually concentrated in a narrow range of several kilometers to tens of meters near the fault zone (Du et al., 2010). Due to the localized multi-resolution analysis ability in spatial and frequency domain, spherical wavelet-based method can be applied to calculate the strain parameters, which can highlight the irregularly spaced characteristics of GPS stations and obtain the information of crustal movement and deformation at different spatial scales (Su et al., 2016; Jin et al., 2021).
The basic principle of spherical wavelet-based multiscale approach is to make use of the attenuation characteristics difference of wavelet function at different scales (the larger the scale factor q is, the faster the attenuation will be, and the smaller the range of influence will be), then match the smallest resolved process to the local spatial density of observations. The large scale mainly represents the main information of the velocity field, and the small scale describes the details. The above method reflects the process of constant approximation to the velocity field, so as to realize the calculation of strain parameters with multi-resolution (Cheng et al., 2015). The principle of determining the decomposition scale is as follows: Where stations are dense, wavelets with large scale are available, where stations are sparse, wavelets only with small scale are available. If the equilateral triangle is selected as a graphic unit to represent the whole sphere, the condition for establishing basis function is that there are at least three GPS observation points in the area covered by the graphic unit. The average side lengths of triangles at different scales are shown in Table 1 (Wang and Dahlen, 1995). The scale factor corresponding to the smallest graphic unit containing only three GPS points is the maximum decomposition scale qmax. While the minimum decomposition scale qmin is determined by the distribution range of observation points in study area. The specific approach for calculating qmin is as follows: Firstly, the spherical area S of the region surrounded by four points determined by the maximum and minimum latitude and longitude of all the GPS points is calculated, then the radius L (
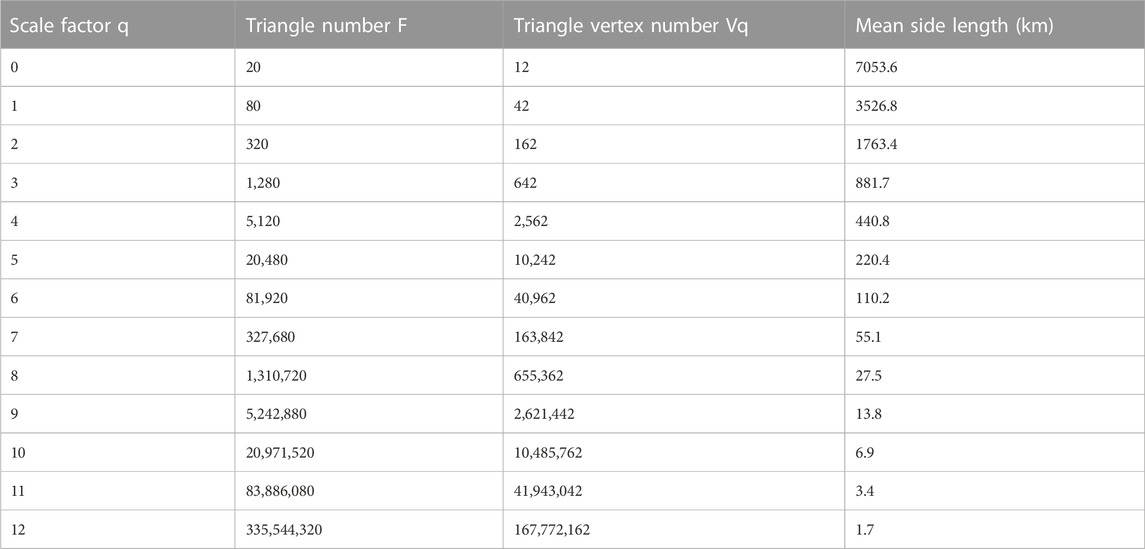
TABLE 1. Geometric property of the spherical-triangular grids (Wang and Dahlen, 1995).
GPS baselines are usually expressed as geodetic lines between two GPS points, which is independent of the reference frame compared to single point timeseries (Dong et al., 2002; Zhan et al., 2011; Liu et al., 2015). Because it can indicate the extension or contraction of the crust between two station sites, the tension, compression, and strike-slip activity of fault zones are often quantitatively studied by analyzing the baseline timeseries orthogonal or oblique to faults (Guo et al., 2009; Wu et al., 2018; Ma et al., 2022). The baseline distance increases when the slope is positive, whereas it decreases when the slope is negative. In this study, continuous observational data collected by CMONOC GPS stations since 2014 is adopted to analyze the various characteristics in the motion rates of nine GPS baselines across the XFZ.
In order to reduce the influence of baseline length on the analysis of deformation characteristics, the annual rate of change per unit length (ARCPL) of each baseline over the years are calculated. Figure 2A shows the baselines SCGZ-SCLT, SCGZ-SCJL, SCLH-SCJL express tensile changes, with ARCPL values of around 1.0 × 10⁻⁸/a, the baselines SCGZ-SCXJ and SCLH-SCXJ manifest compressive changes, with the ARCPL values of −4.0∼−4.2 × 10⁻⁸/a, indicating that the Ganzi-Luhuo segment of the northwestern XZF was dominated by sinistral-slip movement. The baseline SCLT-SCXJ nearly orthogonal to the XZF shows tensile variation, which indicates that this section has certain tensile strain characteristics. The baseline SCJL-SCXJ oblique crossing the southern section of the XFZ and passes through the northernmost aftershock sequence of the Luding earthquake, which shows tensile changes, with the ARCPL value of about 4.6 × 10⁻⁸/a and significant sinistral shear strain. The baseline QHBM-SCXJ inside the Bayan Har block shows compressive change, indicating the existence of extrusion strain in the block. The baseline SCJL-SCTQ expresses nearly orthogonal to the southern section of the XFZ, and passes through the Luding epicenter manifest tensile variation, with the ARCPL value of approximately 2.0 × 10⁻⁸/a.
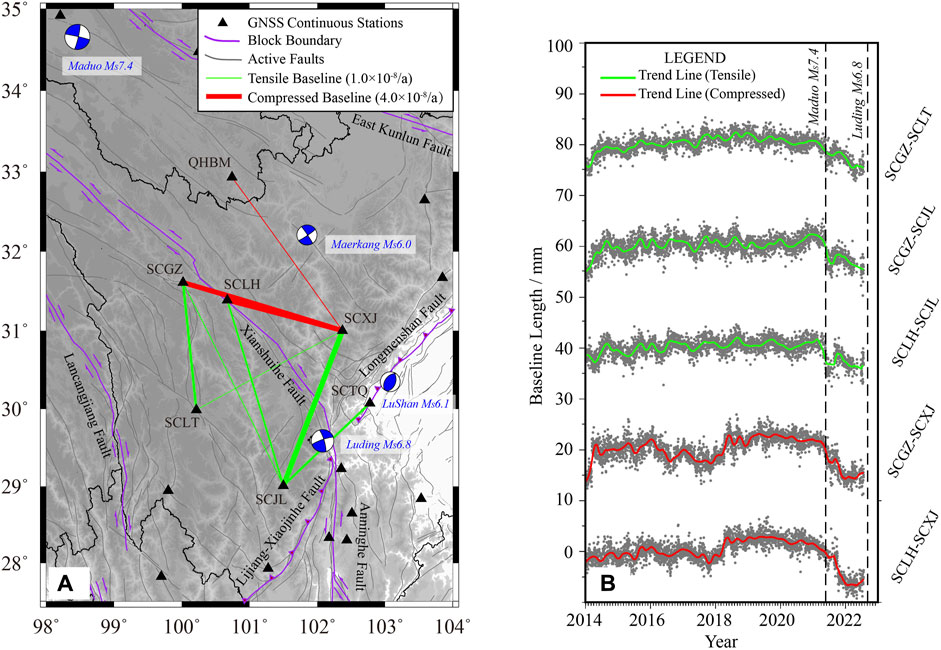
FIGURE 2. (A) Spatial distribution of GPS baselines across the Xianshuihe fault zone. The black triangles represent GPS continuous stations, the purple lines indicate block boundaries, the gray lines express active faults, the green lines denote tensile baselines, the red lines denote compressed baselines, the thickness of a line corresponds to the annual rate of change per unit length (ARCPL) of the baseline extension or contraction, the blue beachballs represent three earthquakes with magnitudes beyond MS6.0 since 1 January 2022 in the study region. (B) The timeseries of partial GPS baselines removed the linear motion trend. The gray dotted lines show the Maduo MS7.4 and Luding MS6.8 earthquake, respectively.
As is shown in Figure 2B, between the Maduo MS7.4 earthquake on 22 May 2021 and the Luding MS6.8 earthquake on 5 September 2022, the baselines SCGZ-SCXJ, SCLH-SCXJ within the Bayan Har block accelerated compression, and the tension rate of the baselines SCGZ-SCLT, SCGZ-SCJL, SCLH-SCJL within the Sichuan-Yunnan block slowed down, indicating that the northern boundary faults of the Bayan Har block were affected by the coseismic rupture of Maduo earthquake, then the block accelerated eastward movement after decoupling. As a result, the strain accumulation in the divergence area bounded by the southern section of XFZ and the southwestern section of the LFZ is accelerated, which may be related to the preparation of the Lushan MS6.1, Maerkang MS6.0 and Luding MS6.8 earthquakes since 2022.
Based on the GPS velocity fields from 1991 to 2016 (Wang and Shen, 2020) and 2017 to 2020, the spherical wavelet-based multiscale approach is applied to analyze the tectonic deformation at different scales and its spatio-temporal evolution characteristics around the Luding earthquake. As is shown in Figure 1, the green arrows represent the velocity field during 2017–2020 on the ITRF 2005, from which we can see that the southeastern movement trend in the whole study area is quite significant. In this study, the South China block is assumed to be rigid and used to fit the Euler rotation vector. The residual velocity field after subtracting the Euler rotation is the motion vector relative to the South China block, which is used as the input data for spherical wavelet-based approach. The above result shows that the sinistral-slip along the eastern boundary of the Sichuan-Yunnan block is remarkable, while the movement of the LFZ along the southeastern boundary of the Bayan Har block is blocked, indicating the characteristics of compression and dextral-slip.
According to the location of the GPS observation stations, the spatial distribution of the maximum decomposition scale in the study area is obtained by using the spatial scanning method. Figure 1 shows that the maximum decomposition scale of the whole study area is above 5, that is, the whole station spacing is less than 220.4 km. Only a few regions with the scale qmax = 9 and the station spacing less than 13.8 km. The regions with the scale qmax = 8 and the station spacing less than 27.5 km is concentrated in the eastern boundary of Sichuan-Yunnan block and the southwestern section of the LFZ. The scale qmax near the epicenter of the Luding earthquake is 7. Therefore, the maximum decomposition scale of the study area is determined to be 6∼8. 2L = 727 km is obtained from the spatial distribution range of the stations, and the minimum scale can be determined to be 3 refers to Table 1.
When the decomposition scale q is 3∼6, the overall deformation characteristics of the study area can be obtained. The positive value of the area strain rate represents tension, and the negative value represents compression. The calculation results in Figure 3A show that compression regions concentrate around the LFZ, and have a high consistency with the spatial distribution of thrust earthquakes in the region (represented by red beachballs). While extension regions concentrate in the interior of the Sichuan-Yunnan block and the eastern boundary of the Qiangtang block, which have a high consistency with the spatial distribution of the normal-fault earthquakes (represented by green beachballs). The maximum shear strain in Figure 3B reveals that the high value areas are distributed in the vicinity of the block boundary, especially the eastern boundary of the Sichuan-Yunnan block and the middle to southwest segment of the LFZ, which have a high consistency with the spatial distribution of strike-slip earthquakes (represented by blue beachballs). The large-scale strain characteristics obtained by the spherical wavelet-based method are in good agreement with the regional tectonic stress field reflected by the focal mechanism solution of historical earthquakes, which illustrates that the method is feasible to solve the crustal strain parameters. Although the results calculated by different methods vary in details, the overall strain distribution features between our and previous research are consistent (Pan and Shen, 2017; Li et al., 2019; Wang and Shen, 2020; Zhang et al., 2022).
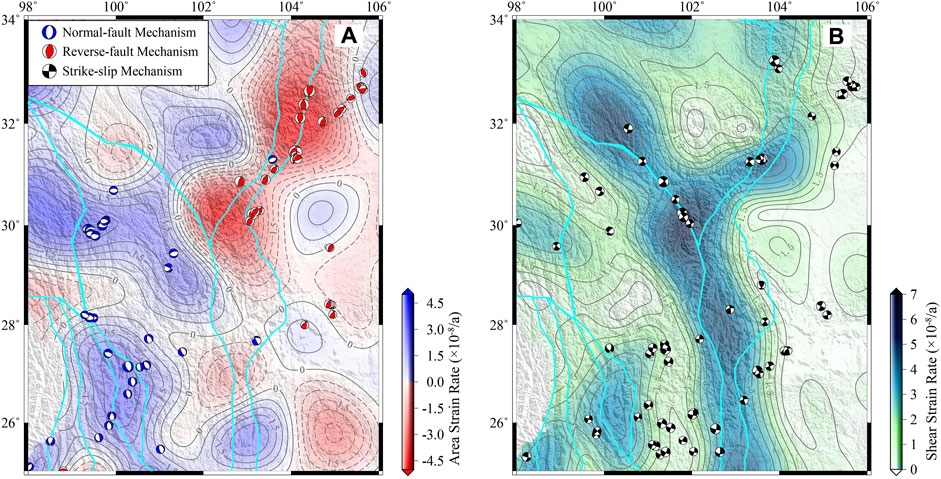
FIGURE 3. (A) The area strain rate calculated by spherical wavelet-based method and the historical focal mechanisms (q = 3∼6). The blue beachballs represent normal-fault mechanisms, the red beachballs indicate reverse-fault mechanisms. (B) The shear strain rate calculated by spherical wavelet-based method and the historical focal mechanisms (q = 3∼6). The black beachballs show strike-slip mechanisms. All historical focal mechanisms range from 1976 to 2019 with the magnitude beyond Mw5.0, and are derived from Global CMT Web Page (https://www.globalcmt.org/CMTsearch.html).
The maximum decomposition scales calculated by the GPS velocity fields during 1991–2016 and 2017–2020 reveal that qmax near the Luding epicenter approximate to 7. Therefore, the decomposition scale is set to 3∼7 to calculate the crustal strain parameters of the epicenter and its vicinity, then the spatio-temporal evolution characteristics of regional strain are analyzed and studied. Compared with the results in Figure 3, the strain field with increased decomposition scale has higher spatial resolution and can reflect the local strain accumulation characteristics in a small area. Figures 4A, B show that the epicenter is in the transition zone between compression and extension regions, and the principal strain rate of the fault surrounding the earthquake is manifested as NNE-trending tension and NWW-trending compression. The area strain rate of different sections on the XFZ shows segmentation characteristics, while the LFZ has a high consistency, showing strong compressive strain. The evolution process of the maximum shear strain rate shown in Figures 4C, D indicate that the epicenter is located at the edge of high value region of the maximum shear strain rate during 1991–2016 and 2017–2020, and the shear deformation is stronger in the northern section. The local weakening of shear strain at the block boundary fault reveals that the fault movement near the epicenter is blocked and there is the possibility of fault locking and strain accumulation, which is basically consistent with the understanding that “strike-slip earthquakes mostly occur at the intersection zone between the edge of high maximum shear strain rate and the large strike-slip fault zone” (Wu et al., 2020).

FIGURE 4. The area strain rate calculated by spherical wavelet-based method (q = 3∼7) during (A) 1991–2016 and (B) 2017–2020. The light blue lines represent the block boundaries and the gray lines represent contour lines. The maximum shear strain rate calculated by spherical wavelet-based method (q = 3∼7) during (C) 1991–2016 and (D) 2017–2020. The red arrow represents Principal strain rate.
Crustal deformation under the influence of different spatial ranges can be reflected in the strain field of corresponding scale, and the small-scale strain field has the advantage of detecting the local crustal deformation (Xu and Wu, 2016). Accordingly, the spatial distribution of the NE strain rate (nearly perpendicular to the XFZ) and the maximum shear strain rate with a decomposition scale q = 7 is calculated separately. The spatial range corresponding to this scale is about 55 km, which is roughly equivalent to the co-seismic rupture scale of 51 km of the Luring MS6.8 earthquake obtained from source process inversion (http://www.itpcas.cas.cn/new_kycg/new_kyjz/202209/t20220906_6509485.html). Figure 5A indicates that the strain characteristics perpendicular to the fault direction near the Luding epicenter shows weak extension in recent years, which is consistent with the extension changes revealed in the GPS baseline SCJL-SCTQ across this region. Figure 5B show that the epicenter is still in the edge of the high shear strain region, and the local shear weakening phenomenon still exists. It is concluded that weakening zones at the edge of high shear strain region around large strike-slip faults may suffer the phenomenon of motion blocked and accelerated accumulation of strain energy, while the strain perpendicular to the fault shows the extension change, indicating that the normal stress of the fault trends to decrease. The fault is prone to rupture under the combined action of the above factors, and thus has a high seismic risk.
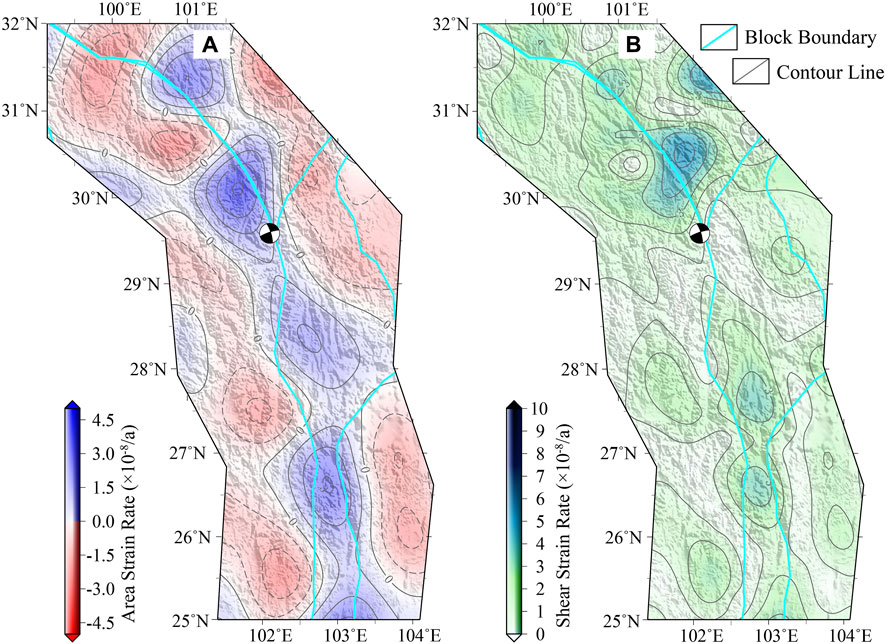
FIGURE 5. (A) The area strain rate in the northeast direction calculated by spherical wavelet-based method (q = 7) during 2017–2020. The light blue lines represent the block boundaries and the gray lines represent contour lines. (B) The max shear strain rate calculated by spherical wavelet-based method (q = 7) during 2017–2020. The black beachball indicates Luding MS6.8 earthquake.
Luding MS6.8 earthquake occurred in the southern section of the XFZ at the boundary of Bayan Har block and Sichuan-Yunnan block. The analysis of the tectonic motion evolution characteristics of the two blocks is of great significance for deepening the understanding of the relationship between crustal deformation and earthquakes, and the regional adjustment movement process after major earthquakes. For this reason, GPS velocity fields of the study region during 1999–2007, 2009–2013, 2013–2018 were collected and uniformly converted to the velocity fields with respect to the South China block (As is shown in Figure 6A). In order to quantitatively research the differential characteristics of tectonic motion evolution between blocks, the northern and eastern velocity components of GPS stations within the southeastern Bayan Har block (east of 93°E) and the Sichuan-Yunnan block were statistically analyzed. The purple represents the east-west velocity VE, the blue represents the north-south velocity VN, and the positive value of VE represents the eastward motion, while the negative value represents the westward motion; The positive value of VN represents northward motion, while the negative value represents southward motion. The “peaks” in each layer of Figures 6B, C denote the fitted distribution density of velocity components at various observation stations within the block, which can characterize the overall motion features of the block along the north-south or east-west directions.
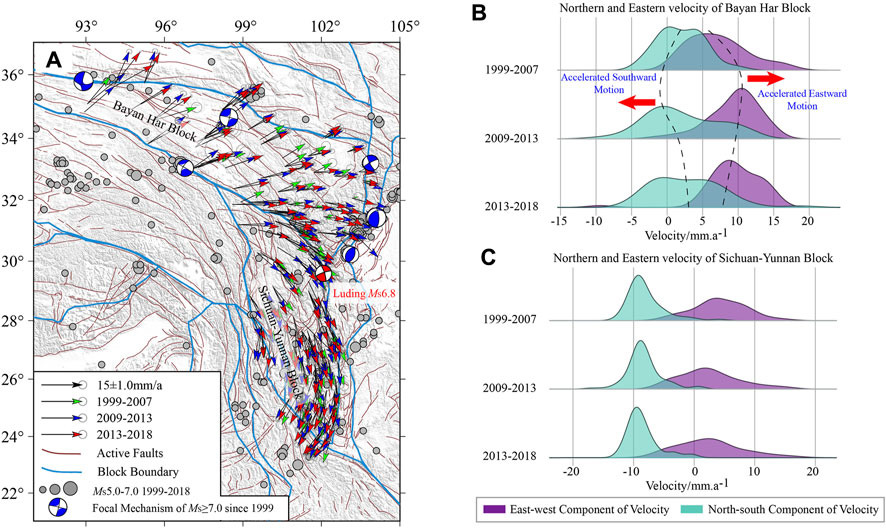
FIGURE 6. (A) GPS velocity fields of study region, relative to the South China block during 1999–2007, 2009–2013, and 2013–2018. The gray ellipses represent the errors of GPS velocity fields, with the 67% confidence. Blue beachballs represent focal mechanisms of MS ≥ 7.0 since 1999. The red beachball represents Luding earthquake. All focal mechanisms are derived from Global CMT Web Page (https://www.globalcmt.org/CMTsearch.html). (B) The northern and eastern velocity of the Bayan Har block. (C) The northern and eastern velocity of the Sichuan-Yunnan Block.
The Sichuan Yunnan block located on the southeast edge of the lateral extrusion deformation of the Tibetan Plateau, and is the main strong earthquake activity area in the Sichuan Yunnan region (Huang et al., 2007). The overall movement of the block is mainly clockwise rotation. As is shown in the three periods across the past 20 years, the southward movement rate of the block is relatively stable. After the Wenchuan earthquake, the eastward movement rate of the Sichuan Yunnan block slightly slowed down, and the overall motion along the east and south directions did little change, indicating that it was less affected by the Wenchuan earthquake than the Bayan Har block. In combination with seismic activity, moderate and strong seismic activity is frequent inside the block, and the accumulated strain is released in the form of earthquake, and the overall tectonic movement evolution is not obvious.
The comparison between the results during 2009–2013 and 1999–2007 shows that after the 2008 Wenchuan MS 8.0 earthquake, the eastward and southward movements of the Bayan Har block were significantly enhanced due to the decoupling influence of the LFZ. The distribution density of motion components during 2013–2018 reveals that the eastward and southward motion rates have weakened, which may be related to the rapid healing of the LFZ after the earthquake (Zhao et al., 2020). From the perspective of seismicity, after the 2008 Wenchuan earthquake, the moderately strong earthquakes within the Bayan Har block gradually migrated to the southeast with the accelerated eastward and southward motion (see Figure 7A). Figure 7B manifests that before and after Wenchuan earthquake, the cumulative Benioff strain rate in the Bayan Har block increases significantly, while the Sichuan-Yunnan block, which is less affected by the post-seismic effect, has little change. The relationship among post-seismic effect, block motion state and regional seismicity is further proved quantitatively. It shows that the decoupling of boundary fault zone caused by large earthquake will accelerate block motion, thus speeding up the stress accumulation of the existing locked fault, and strengthening regional seismicity.
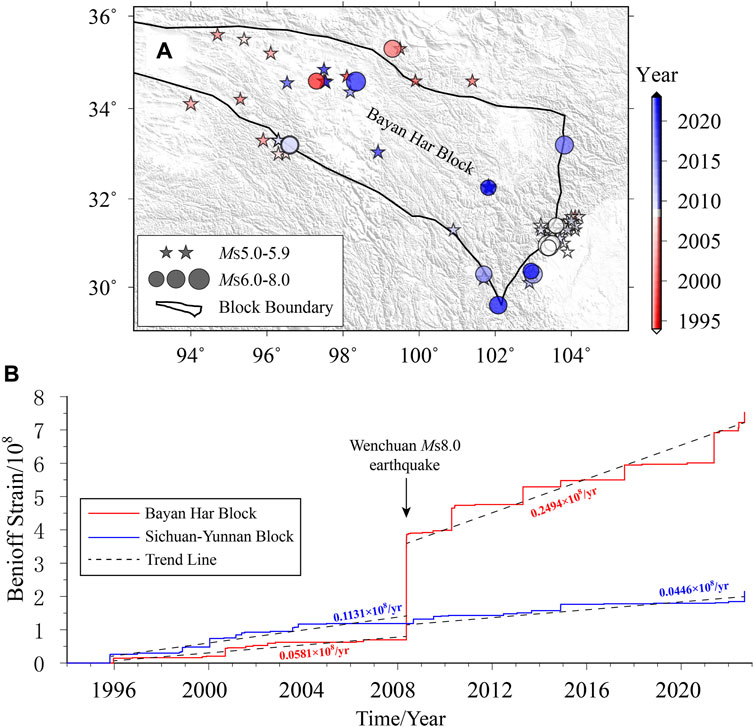
FIGURE 7. (A) The spatio-temporal evolution characteristics of moderate and strong earthquakes in and around Bayan Har Block before and after Wenchuan earthquake. Earthquakes with magnitude MS5.0-5.9 and MS6.0-8.0 are indicated by star and circle, respectively. The black line denotes boundary of Bayan Har block. (B) Cumulative Benioff strain of Bayan Har block and Sichuan-Yunnan block.
When talking about the dynamic causes of moderate and strong earthquakes, the kinematic slip evolution, the deep structure, and the cumulative Coulomb stress change of the seismogenic fault are usually considered. Based on the long-term GPS observations, Guo et al. (2023) investigated the rate of interseismic loading and surface creeping along the Moxi segment, and the elastic dislocation model suggests that the slip rate of the Moxi fault is ∼9.7 mm/yr, implying that the seismogenic fault underwent energy accumulation at a fast-loading rate. Besides, the interseismic shallow creeping is too small to make up for the preseismic shallow slip deficit. A detailed 3-D crustal S-wave velocity structure by Song et al. (2023) revealed that the Luding earthquake and its aftershocks are mainly distributed at depth of 1–15 km, and these earthquakes occurred at the boundary of high-value anomalies, indicating that the relatively high-value anomalies reflecting hard materials in the southern XFZ are easy to accumulate energy and generate earthquakes. Based on the elastic dislocation theory and the stratified viscoelastic model, Li et al. (2020) calculated the cumulative Coulomb stress change on the main boundary faults and in inner blocks in Sichuan-Yunnan region, by combining the influence of coseismic dislocations of the M ≥ 7.0 historical strong earthquakes since 1515, M ≥ 8.0 events in and around this region, and the postseismic viscoelastic relaxation effect of the lower crust and upper mantle. The results showed that the Coulomb stress change increases significantly in the southern XFZ, in which the cumulative Coulomb stress change exceeds 0.1 MPa, resulting in the increase of regional seismic hazard.
Furthermore, our research has shown that large-scale crustal movement and changes in the dynamic environment have a promoting effect on the occurrence of strong earthquakes in the context of strong strain accumulation (Jiang et al., 2009). The 2021 Maduo MS7.4 was the largest earthquake that occurred in the Bayan Har block since 2008. The baseline timeseries across the faults in the southeast part of XFZ expressed that the southeast margin of Bayan Har block accelerated motion under the influence of post-seismic adjustment. Then accelerated the rate of strain accumulation in this area against the background of strong fault locking, and finally caused fault rupture and triggered the Luding earthquake.
In order to study the tectonic deformation and evolution characteristics before the Luding earthquake, the multiple periods of GPS velocity filed and continuous observation data are collected, then the kinematic behavior of seismogenic fault, the multi-scale strain features around the study area, and the variation of GPS baseline across the epicenter are analyzed. We found that the epicenter of the Luding earthquake has been in a weakening region around the edge of the large strike-slip fault zone with high shear strain rate, accompanied with a strong locking background and high seismic risk. After the Maduo MS7.4 earthquake in 2021, some faults around Luding accelerated movement due to the influence of post-seismic adjustment, while the blocking fault accelerated strain accumulation due to movement obstruction, which may have played a certain role in triggering the Lushan MS6.1, Markang MS6.0, and Luding MS6.8 earthquakes around the region since 2022.
Publicly available datasets were analyzed in this study. This data can be found here: eXVhbnpoZW5neWkwMDFAMTYzLmNvbQ==.
ZY designed the research and wrote the manuscript. JZ created some figures. HY performed data interpretation and edited the manuscript. YH, AN, HM, and LM analyzed the results and edited the manuscript. All authors contributed to the article and approved the submitted version.
This work was supported by the National Key Research and Development Program of China (Grant number 2018YFE0109700) and Science for Earthquake Resilience (Grant number XH23047A).
Thanks to the First Monitoring and Application Center, CEA for providing GPS velocity field datasets, and to Dr. Xiaoning Su for providing calculation program package of spherical wavelet strain field.
The authors declare that the research was conducted in the absence of any commercial or financial relationships that could be construed as a potential conflict of interest.
All claims expressed in this article are solely those of the authors and do not necessarily represent those of their affiliated organizations, or those of the publisher, the editors and the reviewers. Any product that may be evaluated in this article, or claim that may be made by its manufacturer, is not guaranteed or endorsed by the publisher.
Allen, C. R., Zhuoli, L., Hong, Q., Xueze, W., Huawei, Z., and Weishi, H. (1991). Field study of a highly active fault zone: the xianshuihe fault of southwestern China. Geol. Soc. Am. Bull. 103 (9), 1178–1199. doi:10.1130/0016-7606(1991)103<1178:fsoaha>2.3.co;2
Bai, M. K., Marie-Luce, C., Li, H. B., Pan, J. W., Wu, Q., Wang, S. G., et al. (2022). Late Quaternary slip rate and earthquake hazard along the Qianning segment, Xianshuihe fault. Acta Geol. Sin. 96 (7), 2312–2332. doi:10.19762/j.cnki.dizhixuebao.2022144
Bischoff, S. H., and Flesch, L. M. (2018). Normal faulting and viscous buckling in the Tibetan Plateau induced by a weak lower crust. Nat. Commun. 9, 4952. doi:10.1038/s41467-018-07312-9
Cheng, P. F., Wen, H. J., Sun, L. Q., Cheng, Y. Y., Zhang, P., Mi, J. Z., et al. (2015). The spherical wavelet model and multiscale analysis of characteristics of GPS velocity fields in mainland China. Acta Geod. Cartogr. Sinica 44 (10), 1063–1070.
Clark, M. K., and Royden, L. H. (2000). Topographic ooze: building the eastern margin of tibet by lower crustal flow. Geology 28, 703–706. doi:10.1130/0091-7613(2000)028<0703:tobtem>2.3.co;2
Dong, D., Fang, P., Bock, Y., Cheng, M., and Miyazaki, S. I. (2002). Anatomy of apparent seasonal variations from GPS-derived site position time series. J. Geophys. Res. Solid Earth 107, ETG 9-1–ETG 9-16. doi:10.1029/2001JB000573
Du, F., Wen, X. Z., and Zhang, P. Z. (2010). Post-seismic slip and deformation on the Luhuo segment of the Xianshuihe fault zone. Chin. J. Geophys. 53 (10), 2355–2366. doi:10.3969/j.issn.0001-5733.2010.10.009
England, P. C., and Houseman, G. (1988). The mechanics of the Tibetan Plateau. Philos. Trans. R. Soc. Lond. Ser. A326, 301–320. doi:10.1098/rsta.1988.0089
Flesch, L. M., Haines, A. J., and Holt, W. E. (2001). Dynamics of the India-Eurasia collision zone. J. Geophys. Res. Solid Earth 106 (B8), 16435–16460. doi:10.1029/2001JB000208
Gan, W., Zhang, P., Shen, Z. K., Niu, Z., Wang, M., Wan, Y., et al. (2007). Present-day crustal motion within the Tibetan Plateau inferred from GPS measurements. J. Geophys. Res. Solid Earth 112, B08416. doi:10.1029/2005JB004120
Gao, H., Zhang, M., Qin, S. L., Shao, D. S., Hong, M., Wang, L. L., et al. (2018). Analysis the strain characteristics of Yunnan: based on multi-scale spherical wavelet. J. Geod. Geodynam. 38 (12), 1232–1237. doi:10.14075/j.jgg.2018.12.004
Guo, L. Q., Hu, X. K., Zhang, F. S., Chen, C. Y., and Sun, D. Y. (2009). Baseline variation of GPS continuous sites and current activity of Qinghai-Tibet block. J. Geod. Geodynam. 29 (04), 10–14. doi:10.3969/j.issn.1671-5942.2009.04.003
Guo, R., Li, L., Zhang, W., Zhang, Y., Tang, X., Dai, K., et al. (2023). Kinematic slip evolution during the 2022 Ms 6.8 Luding, China, earthquake: compatible with the preseismic locked patch. Geophys. Res. Lett. 50, e2023GL103164. doi:10.1029/2023GL103164
Herring, T. A., King, R. W., and McClusky, S. C. (2006). GPS analysis at MIT, release 10.3. Cambridge, UK: Massachussetts Institute of Technology.
Huang, P. G., Li, Z. H., Qin, J. Z., and Zhang, J. G. (2007). Correlation of seismicity in Sichuan-Yunnan rhombic block. J. Seismol. Res. 30 (3), 205–209. doi:10.3969/j.issn.1000-0666.2007.03.001
Jiang, Z. S., Fang, Y., Wu, Y. Q., Wang, M., Du, F., and Ping, J. J. (2009). The dynamic process of regional crustal movement and deformation before Wenchuan MS8.0 earthquake. Chin. J. Geophys. 52 (2), 505–518.
Jiang, Z. S., and Liu, J. N. (2010). The method in establishing strain field of crustal movement using least squares collocation. Chin. J. Geophys. 53 (5), 1109–1117. doi:10.3969/j.issn.0001-5733.2010.05.011
Jin, Y., Jin, H. L., Gao, Y., and Huang, X. (2021). Application of three strain calculation methods based on GNSS data in the southeastern margin of Tibet Plateau. Earthquake 41 (4), 57–67. doi:10.12196/j.issn.1000-3274.2021.04.004
Li, Y. J., Liu, M., Li, Y. H., and Chen, L. W. (2019). Active crustal deformation in southeastern Tibetan Plateau: the kinematics and dynamics. Earth Planet. Sci. Lett. 523, 115708. doi:10.1016/j.epsl.2019.07.010
Li, Y. J., Shi, F. Q., Zhang, H., Wei, W. X., Xu, J., and Shao, Z. G. (2020). Coulomb stress change on active faults in Sichuan-Yunnan region and its implications for seismic hazard. Seismol. Geol. 42 (2), 526–546. doi:10.3969/j.issn.0253-4967.2020.02.017
Liu, M., and Yang, Y. (2003). Extensional collapse of the Tibetan Plateau: results of three-dimensional finite element modeling. J. Geophys. Res. Solid Earth 108, 2361. doi:10.1029/2002JB002248
Liu, X. X., Wu, Y. Q., Jiang, Z. S., Zhan, W., Li, Q., Wei, W. X., et al. (2015). Preseismic deformation in the seismogenic zone of the Lushan MS7.0 earthquake detected by GPS observations. Sci. China Ser. D-earth Sci. 45 (08), 1592–1601. doi:10.1007/s11430-015-5128-0
Ma, H. P., Feng, J. G., Wang, Q., Zhao, J., Zou, Z. Y., Yuan, Z. Y., et al. (2022). Stress and strain characteristics before the MW7.3 Maduo earthquake and its implications for future earthquakes on the Maqin-Maqu fault. Bull. Seismol. Soc. Am. 112 (5), 2454–2467. doi:10.1785/0120210219
Molnar, P., and Deng, Q. D. (1984). Faulting associated with large earthquakes and the average rate of deformation in central and eastern Asia. J. Geophys. Res. Solid Earth 89, 6203–6227. doi:10.1029/JB089iB07p06203
Molnar, P., and Tapponnier, P. (1975). Cenozoic Tectonics of Asia: effects of a Continental Collision: features of recent continental tectonics in Asia can be interpreted as results of the India-Eurasia collision. Science 189, 419–426. doi:10.1126/science.189.4201.419
Niu, Z. J., Ma, Z. J., Chen, X. L., Zhang, Z. S., Wang, Q., You, X. Z., et al. (2002). Crustal movement observation network of China. J. Geod. Geodynam. 22 (3), 88–93. doi:10.14075/j.jgg.2002.03.023
Pan, J. W., Li, H. B., Chevalier, M.-L., Bai, M. K., Liu, F. C., Liu, D. L., et al. (2020). A newly discovered active fault on the Selaha-Kangding segment along the SE Xianshuihe fault: the South Mugecuo fault. Acta. Geol. Sin. 94 (11), 3178–3188. doi:10.19762/j.cnki.dizhixuebao.2020196
Pan, Y. J., and Shen, W. B. (2017). Contemporary crustal movement of southeastern Tibet: constraints from dense GPS measurements. Sci. Rep. 7 (1), 45348. doi:10.1038/srep45348
Papadimitriou, E., Wen, X., Karakostas, V., and Jin, X. (2004). Earthquake triggering along the Xianshuihe fault zone of western sichuan, China. Pure. Appl. Geophys. 161, 1683–1707. doi:10.1007/s00024-003-2471-4
Shen, Z. K., Wang, M., Zeng, Y., and Wang, F. (2015). Optimal interpolation of spatially discretized geodetic data. Bull. Seismol. Soc. Am. 105 (4), 2117–2127. doi:10.1785/0120140247
Song, X., Lei, J., and Zou, K. (2023). The 2022 Luding, Sichuan, China, M6.8 earthquake: a fluid-related earthquake. J. Asian Earth Sci. 105543, 105543. doi:10.1016/j.jseaes.2023.105543
Su, X. N., Meng, G. J., and Wang, Z. (2016). Methodology and application of GPS strain field estimation based on multi-scale spherical wavelet. Chin. J. Geophys. 59 (5), 1585–1595. doi:10.6038/cjg20160504
Sun, K., Meng, G. J., Hong, S. Y., Su, X. N., Huang, X., Dong Y, F., et al. (2021). Interseismic movement along the Luhuo-Daofu section of the Xianshuihe fault from InSAR and GPS observations. Chin. J. Geophys. 64 (7), 2278–2296. doi:10.6038/cjg2021O0364
Tapponnier, P., Peltzer, G., Le Dain, A., Armijo, R., and Cobbold, P. (1982). Propagating extrusion tectonics in Asia: new insights from simple experiments with plasticine. Geology 10, 611–616. doi:10.1130/0091-7613(1982)10<611:petian>2.0.co;2
Tape, C., Musé, P., Simons, M., Dong, D., and Webb, F. (2009). Multiscale estimation of GPS velocity fields. Geophys. J. Int. 179 (2), 945–971. doi:10.1111/j.1365-246X.2009.04337.x
Tapponnier, P., Xu, Z. Q., Roger, F., Meyer, B., Arnaud, N., Wittlinger, G., et al. (2001). Oblique stepwise rise and growth of the Tibet Plateau. science 294 (5547), 1671–1677. doi:10.1126/science.105978
Toda, S., Stein, R. S., Richards-Dinger, K., and Bozkurt, S. B. (2005). Forecasting the evolution of seismicity in southern California: animations built on earthquake stress transfer. J. Geophys. Res. 110 (B5), B05S16. doi:10.1029/2004JB003415
Wang, M. (2009). Analysis of GPS data with high precision and study on present-day crustal deformation in China. Beijing, China: Institute of Geology China Earthquake Administration.
Wang, M., and Shen, Z. K. (2020). Present-day crustal deformation of continental China derived from GPS and its tectonic implications. J. Geophys. Res. Solid Earth 125 (2), e2019JB018774. doi:10.1029/2019JB018774
Wang, Z., and Dahlen, F. (1995). Spherical-spline parameterization of three-dimensional earth models. Geophys. Res. Lett. 22 (22), 3099–3102. doi:10.1029/95GL03080
Wen, X. Z., Ma, S. L., Xu, X. W., and He, Y. N. (2008). Historical pattern and behavior of earthquake ruptures along the eastern boundary of the Sichuan-Yunnan faulted-block, southwestern China. Phys. Earth. Planet 168, 16–36. doi:10.1016/j.pepi.2008.04.013
Wu, Y., Jiang, Z., Yang, G., Wei, W., and Liu, X. (2011). Comparison of GPS strain rate computing methods and their reliability. Geophys. J. Int. 185, 703–717. doi:10.1111/j.1365-246X.2011.04976.x
Wu, Y. Q., Jiang, Z. J., Liang, H. B., Pang, Y. J., Zhu, S., Chang, L., et al. (2018). Deformation response of seismogenic faults to the Wenchuan MS8.0 earthquake: a case study for the southern segment of the Longmenshan fault zone. Remote Sens. 10 (6), 894. doi:10.3390/rs10060894
Wu, Y. Q., Jiang, Z. S., Zhu, S., and Zhao, J. Y. (2020). GNSS deformation characteristics and its relationship with M≥7.0. Earthq. Res. China 36 (04), 756–766. doi:10.3969/j.issn.1001-4683.2020.04.010
Xu, J., Shao, Z. G., Ma, H. S., and Zhang, L. P. (2013). Evolution of coulomb stress and stress interaction among strong earthquakes along the Xianshuihe Fault Zone. Chin. J. Geophys. 56 (4), 1146–1158. doi:10.6038/cjg20130410
Xu, K. K., and Wu, C. J. (2016). Estimation of GNSS multiscale strain field and detection of regional crustal deformation. Acta Geod. Cartogr. Sinica 45 (8), 992–1000. doi:10.11947/j.AGCS.2016.20150588
Zhan, W., Yang, B., Zhang, F. S., Liu, Z. G., and Meng, X. G. (2011). Effect of selecting GNSS frame sites on the time series of displacement. J. Geod. Geodynam. 31 (1), 91–94. doi:10.14075/j.jgg.2011.01.015
Zhang, C., Ji, L. Y., Zhu, L. Y., and Xu, J. (2022). Analysis of the crustal deformation of the Eastern Himalayan Syntaxis and its adjacent areas based on the earthquake focal stress and GPS strain. J. Seismol. Res. 45 (4), 526–534. doi:10.20015/j.cnki.ISSN1000-0666.2022.0068
Zhang, P. Z., Shen, Z., Wang, M., Gan, W., Burgmann, R., Molnar, P., et al. (2004). Continuous deformation of the Tibetan Plateau from global positioning system data. Geology 32, 809–812. doi:10.1130/G20554.1
Zhang, X., Jiang, Z. S., Wang, S. X., and Wang, Q. (2005). Negative dislocation model of elastic block boundary of horizontal crustal movement and the prediction of strong earthquake position in Sichuan-Yunnan area. J. Seismol. Res. 28 (2), 119–124. doi:10.3969/j.issn.1000-0666.2005.02.003
Zhao, J., Jiang, Z. S., Niu, A. F., Liu, J., Wu, Y. Q., Wei, W. X., et al. (2015). Study on dynamic characteristics of fault locking and fault slip deficit in the eastern boundary of the Sichuan-Yunnan rhombic block. Chin. J. Geophys. 58 (3), 872–885. doi:10.6038/cjg20150316
Zhao, J., Jiang, Z. S., Wu, Y. Q., Liu, X. X., Wei, W. X., Wang, Y. B., et al. (2013). Analysis of reliability and stability of inversion result with negative dislocation model of DEFNODE. J. Geod. Geodynam. 33 (1), 21–24. doi:10.14075/j.jgg.2013.01.004
Zhao, J., Ren, J. W., Liu, J., Jiang, Z. S., Liu, X. X., Liang, H. B., et al. (2020). Coupling fraction and relocking process of the Longmenshan Fault Zone following the 2008 MW7.9 Wenchuan earthquake. J. Geodyn. 137, 101730. doi:10.1016/j.jog.2020.101730
Zhao, J., Ren, J. W., Jiang, Z. S., Yue, C., Wang, T., Zhang, H., et al. (2018). Hepatic F-box protein FBXW7 maintains glucose homeostasis through degradation of fetuin-A. Seismol. Geol. 40 (4), 818–830. doi:10.2337/db17-1348
Keywords: Luding earthquake, Xianshuihe fault zone (XFZ), multi-scale strain parameters, tectonic deformation evolution, earthquake forecasting
Citation: Yuan Z, Zhao J, Huang Y, Yu H, Niu A, Ma H and Ma L (2023) Study on deformation characteristics and dynamic cause of the Luding MS6.8 earthquake. Front. Earth Sci. 11:1232205. doi: 10.3389/feart.2023.1232205
Received: 31 May 2023; Accepted: 29 September 2023;
Published: 17 October 2023.
Edited by:
Mourad Bezzeghoud, Universidade de Évora, PortugalReviewed by:
Vladimir G. Kossobokov, Institute of Earthquake Prediction Theory and Mathematical Geophysics (RAS), RussiaCopyright © 2023 Yuan, Zhao, Huang, Yu, Niu, Ma and Ma. This is an open-access article distributed under the terms of the Creative Commons Attribution License (CC BY). The use, distribution or reproduction in other forums is permitted, provided the original author(s) and the copyright owner(s) are credited and that the original publication in this journal is cited, in accordance with accepted academic practice. No use, distribution or reproduction is permitted which does not comply with these terms.
*Correspondence: Zhengyi Yuan, eXVhbnpoZW5neWkwMDFAMTYzLmNvbQ==
Disclaimer: All claims expressed in this article are solely those of the authors and do not necessarily represent those of their affiliated organizations, or those of the publisher, the editors and the reviewers. Any product that may be evaluated in this article or claim that may be made by its manufacturer is not guaranteed or endorsed by the publisher.
Research integrity at Frontiers
Learn more about the work of our research integrity team to safeguard the quality of each article we publish.