
95% of researchers rate our articles as excellent or good
Learn more about the work of our research integrity team to safeguard the quality of each article we publish.
Find out more
ORIGINAL RESEARCH article
Front. Earth Sci. , 17 July 2023
Sec. Environmental Informatics and Remote Sensing
Volume 11 - 2023 | https://doi.org/10.3389/feart.2023.1229946
This article is part of the Research Topic Curbing Carbon Emissions: Insight from the Ecosystem Evolution During Ancient Hyperthermal Events View all 7 articles
 Guoying Jiao1
 Feifei Fang1*Yuanyuan Zhang2Zhenkai Wu3
 Jie Zhang1Zhenchang Jiang4Yingbo Lv5Jianqi Cao1Jinmei Peng1Sijie He1Yu Wang1Qingtong Guan1
Microcracks are the main seepage channels and reservoir space for oil and gas in dense sandstone reservoirs, and the degree of development dominates the reservoir’s high and stable production capacity. A new method has been devised to address the lack of quantitative identification and characterization methods for microcrack networks. The method is based on core stress sensitivity, permeability anisotropy, and two-phase seepage rule testing. By improving upon the traditional black oil model, this method can accurately calculate the impact that microcracks of varying degrees of development have on the capacity of tight oil reservoirs. The study shows that 1) the higher the degree of microcrack development, the stronger the reservoir stress sensitivity and the greater the permeability anisotropy. As the degree of microcrack development increases, the irreducible water saturation decreases, the residual oil saturation gradually increases, and the oil–water two-phase co-infiltration zone becomes more extensive and smaller. The degree of microcrack development in tight reservoirs can be characterized based on the seepage characteristic parameters; 2) a microcrack characterization method and classification criteria have been established. It is based on stress sensitivity coefficients, permeability anisotropy parameters, and phase seepage characteristics in cores with different microcrack development degrees. For the first time, the method enables a macroscopic-level description of microcrack seepage; 3) numerical calculations show that the degree of microcrack development significantly affects the reservoir’s oil production and water production. The higher the degree of microcrack development, the higher the reservoir’s initial oil production and cumulative oil production. However, when the degree of microcrack development is too high, the microcracks are connected, thus exhibiting the nature of large fractures. This strengthens the bypassing communication effect and causes the microscopic inhomogeneity to strengthen, the oil production decreases rapidly, and water production increases quickly at the later stage. This research result enriches the reservoir microcrack characterization and evaluation system, which has essential theoretical guidance and practical significance for the rational and effective development of tight oil and tight sandstone gas.
Tight oil is an essential part of unconventional oil and gas resources and a vital replacement field for future oil and gas storage and production, and its reasonable and efficient development is an essential guarantee for the Chinese energy security strategy (Xu et al., 2018; Gao H and Li H,2016; Wang J et al., 2020). Tight oil reservoirs have low permeability and are dense, and the degree of microcrack development is crucial in determining whether it can obtain high and stable production. The presence of microcracks can, on one hand, significantly improve the matrix percolation capacity of tight reservoirs, bridge the natural fracture and artificial fracture network, and increase the improvement effect of hydraulic fracturing reservoirs. When microcracks are present in the matrix, the permeability of the reservoir will be substantially increased, and the contribution of microcracks to permeability is more than 80%. Under the same porosity, the permeability of microcrack development can be more than two orders of magnitude higher than that of undeveloped microcrack rock samples (Li X et al., 2019; Hu J et al., 2020; Li X et al., 2020). The presence of microcracks makes the fluid in tight sandstone reservoirs flow across fluidic states, and the mass flows across fluids is often calculated by apparent seepage (Pudji P et al., 2022; Wu et al., 2021; Wu Z et al., 2021). On the other hand, microcracks can be used as hydrocarbon reservoir space and increase the proportion of movable fluid in the reservoir, but it is less than the contribution rate of the reservoir matrix to porosity (Fu J et al., 2020). Therefore, identifying and characterizing microcracks are essential for predicting the “sweet spot” and establishing a high-production well model for tight oil development.
The study of natural microcracks can be traced back to the era of transmission light (TL) microscope around 1850, and then the scanning electron microscope (SEM) became a widely studied tool around 1960. Another milestone is the application of cold cathode cathodoluminescence (CL) and SEM-based cathodoluminescence in the study of sealed microcracks (Anders et al., 2014). In terms of recent research on microcracks, microcracks have mainly been identified by direct observation of microcracks in the reservoir by scanning electron microscopy and thin section identification. In addition, the transverse and longitudinal ultrasonic test method and the permeability anomaly method can indirectly determine the existence of microcracks. However, because microcracks are too small, conventional logging methods can only identify natural cracks, but not microcracks (Scholle and Ulmer-Scholle, 2003; Ougier-Simonin A et al., 2018; Ezati M et al., 2018; Li T et al., 2021).
The research on microcracks is still in the early exploration stage, and the related research work is still in the initial stage. The description of microcracks is still mainly qualitative, and the quantitative description of microcracks is relatively rare and only in the attempt stage, mainly with the help of the piezometric curve, thin section observation, and fractal technique to quantitatively characterize microcracks. The mercury pressure curve method uses the pore-throat radius corresponding to the diagonal segment in the capillary pressure curve to be equivalent to the effective pore-throat radius and studies the relationship between permeability and effective pore-throat radius to calculate the contribution of microcracks to permeability according to the cumulative permeability contribution calculation method (Zang S et al., 2012; Yu X,2009; Dong F et al., 2019). Other scholars studied coalbed methane reservoirs using the mercury pressure curve model. They judged the developmental range of microcracks by exploring the different influence rules of microcracks on mercury inlet and mercury withdrawal processes (Gu Y et al., 2017). Thin section observation describes microcracks by observing physical information such as the length, width, and orientation of microcracks (Wang R et al., 2008). There are relatively more studies using fractal techniques to characterize microcracks. It was found that the openness of microcracks has uniformity with the opening of fractures and can be fitted using regression. The fitted functions are logarithmic distribution (Hooker J et al., 2012), power rule distribution (Guerriero V et al., 2010; Hooker J et al., 2011; Le Garzic et al., 2011), exponential distribution (Deschamps A et al., 2007), normal distribution (Hooker J et al., 2014), and gamma distribution (Sornette D and Sornette A,1999). In addition, Tao (Li T et al., 2021) used numerical algorithms to construct fractured and fractured-pore porous media models. They introduced fracture network connectivity coefficients to quantitatively characterize microcrack network connectivity and strike factors to reveal the mechanism of microcrack network influence on rock permeability. Pudji P et al. (2022) first identified microcracks in carbonate reservoirs using core description and thin section observation. Then, the microcracks were characterized by geometric classification of pore space and lithological analysis data. Finally, experimental data are analyzed for inflow-type microcracks, and permeability prediction equations are developed. Some scholars also describe the essential characteristics of a single microcrack by using the length of the break, the roughness of the fracture surface, the roundaboutness of the fracture, and the inclination angle (Li Wei et al., 2017; Zhang Ge et al., 2019; Qu Guanzheng et al., 2016).
Microcracks are a crucial factor affecting the development effect of tight oil reservoirs, so establishing effective characterization methods for microcracks has important guiding significance for field development. Literature research shows that the research on quantitative characterization of microcracks in dense sandstone reservoirs is still in the early exploration stage. The description of microcracks is still mainly carried out by testing the geochemical parameters of microcracks through scanning electron microscopy and mercury compression techniques, and there needs to be more effective means to quantitatively characterize microcrack networks. Therefore, it is necessary to characterize microcracks according to the seepage characteristics of tight sandstone reservoirs to achieve a more effective reference to the tight oil development process. To this end, this study first conducted experiments to test the stress sensitivity, permeability anisotropy, and two-phase percolation rule in cores with different microcrack development degrees. Then, based on the summary of flow rules, an innovative idea of microcrack description at the seepage level is proposed, and a microcrack characterization method based on characteristic seepage parameters is established. Finally, the microcrack characterization method combines a flow, continuity, state, and boundary condition auxiliary equation; permeability anisotropy and seepage rule anisotropy are considered. By assigning values to the permeability and phase percolation curve characteristics and microcrack stress sensitivity data in different directions, the numerical simulation calculates the influence rule of microcracks with varying degrees of development on the production capacity of tight oil reservoirs.
In this paper, the experimental conditions are improved based on the previous work, and the axial stress is added on the basis of the original variable fluid pressure experimental method to realize the test of percolation capacity in the range of effective stress from compressive stress to tensile stress. The flowchart of the experiment is shown in Figure 1, which aims to more realistically approach the stress change process in the formation and realize the stress sensitivity study of the whole process.
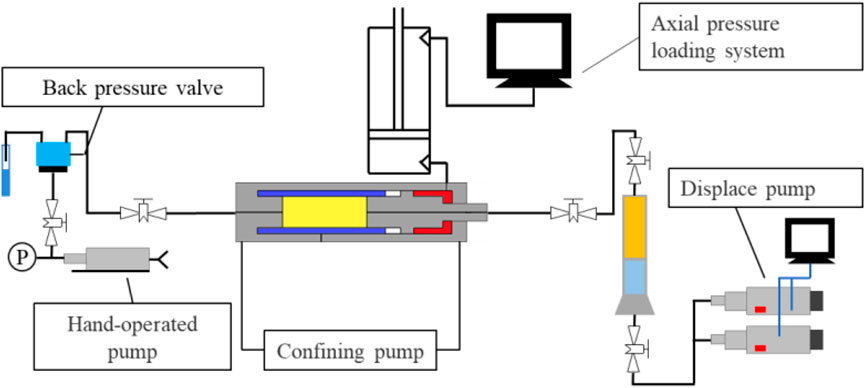
FIGURE 1. Experimental flowchart.
The cores are outcrops of the Yanchang Formation 7-layer tight sand reservoir of the Yanchang Formation in the Ordos Basin. The six cores used in the experiment are taken from the same rock to ensure their similar properties. All six cores are matrix cores. Cores 4–6 were pretreated to produce microcracks by the proposed triaxial stress shear seam-making method to obtain cores with different degrees of microcrack development. The fundamental core data of the six core samples are listed in Table 1.
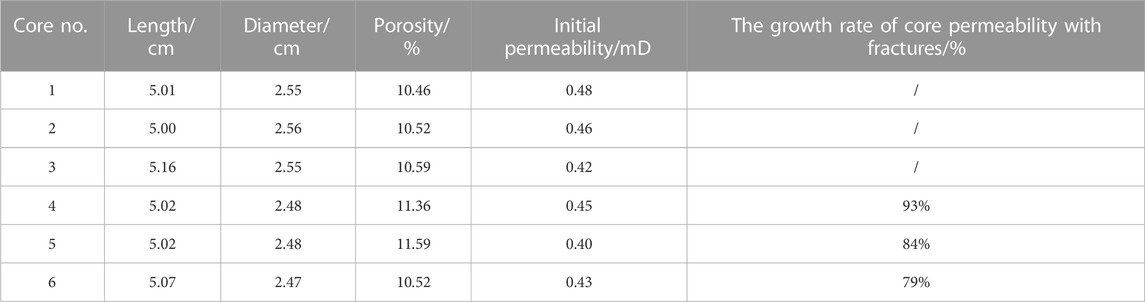
TABLE 1. Core basic data in the stress sensitivity test.
The improved variable fluid pressure experiment explores the stress sensitivity of cores with different degrees of microcrack development and the dynamic opening conditions of microcracks. In the experiment, the confining pressure was set to 15 MPa, and the axial pressure was set to 0, 10, 20, and 30 MPa.
This section investigates the effect of microcracks on permeability anisotropy. The experimental rock samples are taken from the flat outcrop cores of the Yanchang Formation 7-layer tight sand reservoir of the Extension Formation in the Ordos Basin. The experimental procedure was as follows: first, a wire cutter cuts the flat plate model into small square cores (Figure 2). Then, the square cores were seam-formed using a large triaxial compressor (Figure 3). Finally, the permeability along the direction of the microcracks and the direction perpendicular to the microcracks were tested (Figure 4) to compare the pattern of the effect of microcracks on the anisotropy of permeability.
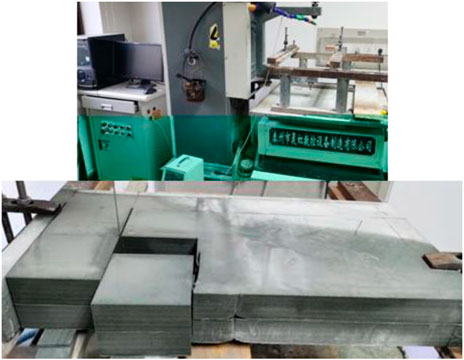
FIGURE 2. Picture of the flat plate while cutting online.
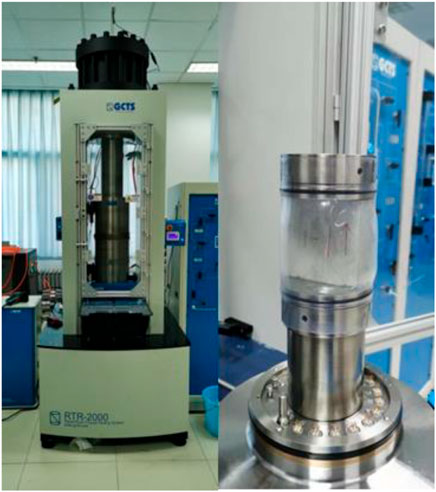
FIGURE 3. GCTS triaxial compressor (model RTRX-210-100).
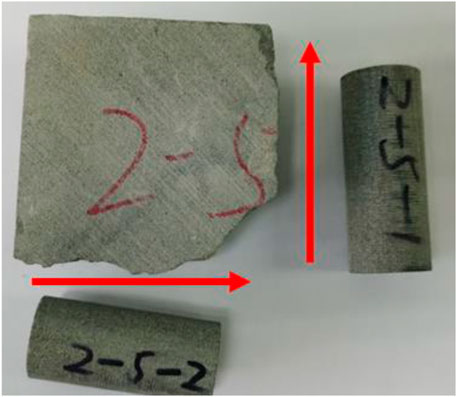
FIGURE 4. Representative pictures of rock sample coring.
This section focuses on the effect of microcracks in dense sandstone on the oil–water phase percolation curve. The six cores used in the experiment are all matrix cores. The cores were pretreated to produce microcracks by using the proposed triaxial stress shear seam-making method (Wu et al., 2021) to obtain cores with different degrees of microcrack development. The fundamental core data of the six core samples are listed in Table 2.
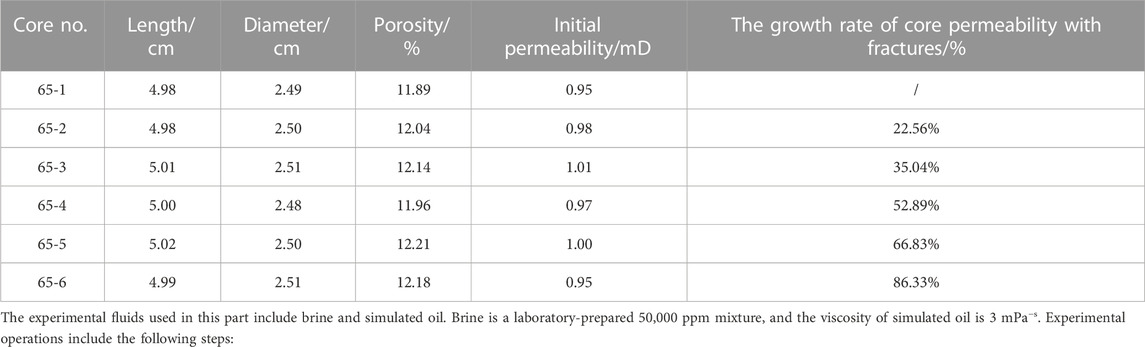
TABLE 2. Core basic data in the oil–water two-phase test.
(1) Establishing the saturation of irreducible water;
(2) Determining the oil phase permeability in the irreducible water state;
(3) Carrying out the water-driven oil experiment and recording the experimental parameters such as the time of seeping water, the accumulated oil production at the time of seeping water, the accumulated liquid production, and the repulsion pressure difference of the rock sample;
(4) At the early stage of seeping water, the record of experimental data was encrypted. With the decline of oil output, the recording time gradually increases, and the experiment is terminated when the water content reaches 99.5%.
In previous studies Wu et al. (2021), we conducted stress sensitivity experiments under different axial pressures using self-designed stress sensitivity equipment with axial compression for microcrack tight sandstone reservoirs. Furthermore, the TPHM model was introduced to describe the stress based on the properties of microcracks and pores. The research results indicate that for pure matrix cores, as the fluid pressure increases, the permeability shows a slowly increasing trend, and the maximum permeability increase rate does not exceed 20%. For cores containing microcracks, when the axial pressure is less than 30 MPa, the permeability slowly increases with the increase in fluid pressure. When the axial pressure is 30 MPa, the permeability change is divided into two stages. As shown in Figure 5, the first stage is the closure of microcracks under compressive stress, at which point the influence of microcracks on seepage capacity is limited. The permeability shows a slowly increasing trend with the increase of fluid pressure, and the second stage is the rapid increase of permeability after the microcracks are opened. The second stage is the rapid increase in permeability after the opening of microcracks, and two straight lines can describe these two stages. The higher the degree of microcrack development, the larger the slope of the straight line in the second stage and the greater the stress sensitivity. Therefore, the development degree of microcracks in tight sandstone reservoirs can be evaluated and characterized based on stress-sensitive parameters of the reservoir.
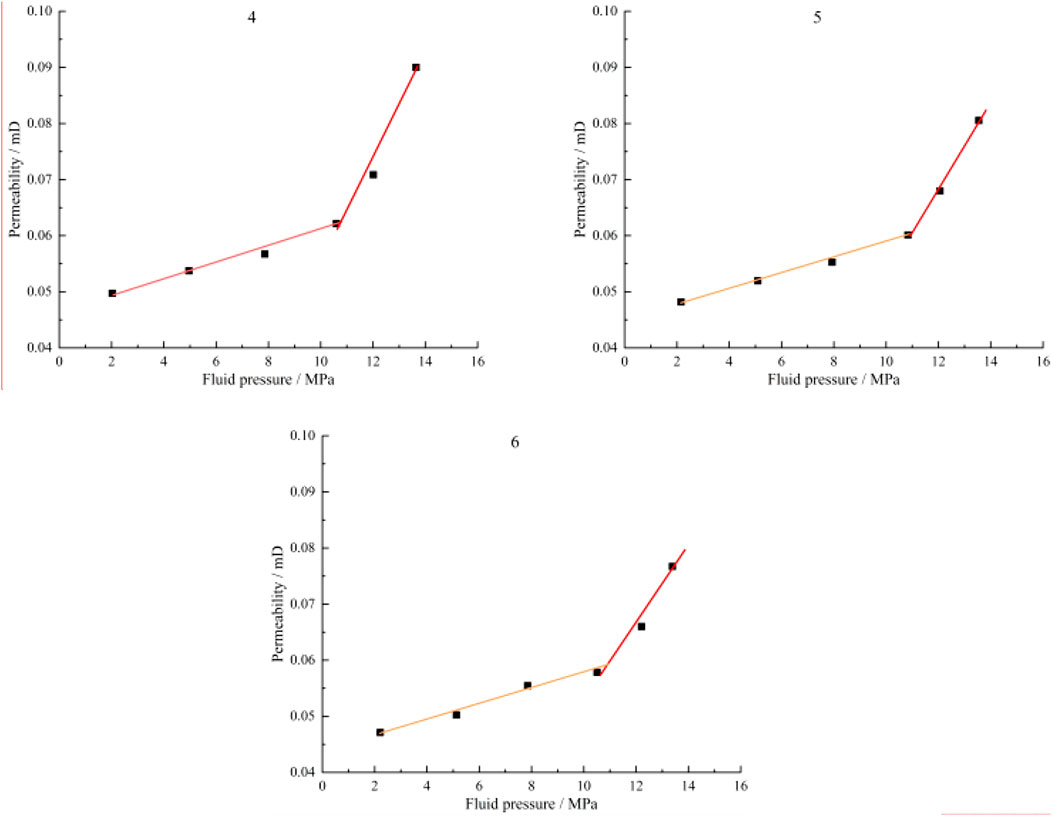
FIGURE 5. Permeability variation curve of cores with different microcrack development degrees.
According to the method shown in Figure 4, first, the fractured massive flat small core is drilled along the microcrack direction and the vertical microcrack direction to drill the small columnar core. Then, we tested the permeability of the small columnar core, and the results are shown in Figure 6 and Table 3. As can be seen from the chart, when the strain in the core fracturing process is less than 0.3%, the permeability of small columnar cores along the fracturing direction is not much different from that in the vertical fracturing direction, and the ratio is between 1.02 and 1.11. This result indicates the absence of microcrack generation during the process. When the strain in the process of core fracture is more significant than 0.3%, the permeability of the small columnar core in the fracture direction is more significant than that in the vertical direction. With the increase in the core fracture degree, the permeability in the fracture direction increases gradually. The rate of increase is rapid, while the permeability in the vertical direction changes slowly. When the ratio of the microcrack direction to the vertical direction is between 1.17 and 2.27, the directionality of reservoir permeability increases with the fracture. This result shows that microcracks in the matrix core are the main seepage channels that affect permeability. The more microcracks develop, the greater the contribution rate to the permeability along the development direction of microcracks. The contribution to the permeability perpendicular to the development direction of microcracks is minimal, and the influence is limited. It also proves that microcracks significantly increase the permeability anisotropy of tight sandstone reservoirs.
FIGURE 6. Microcrack development degree versus permeability curve.
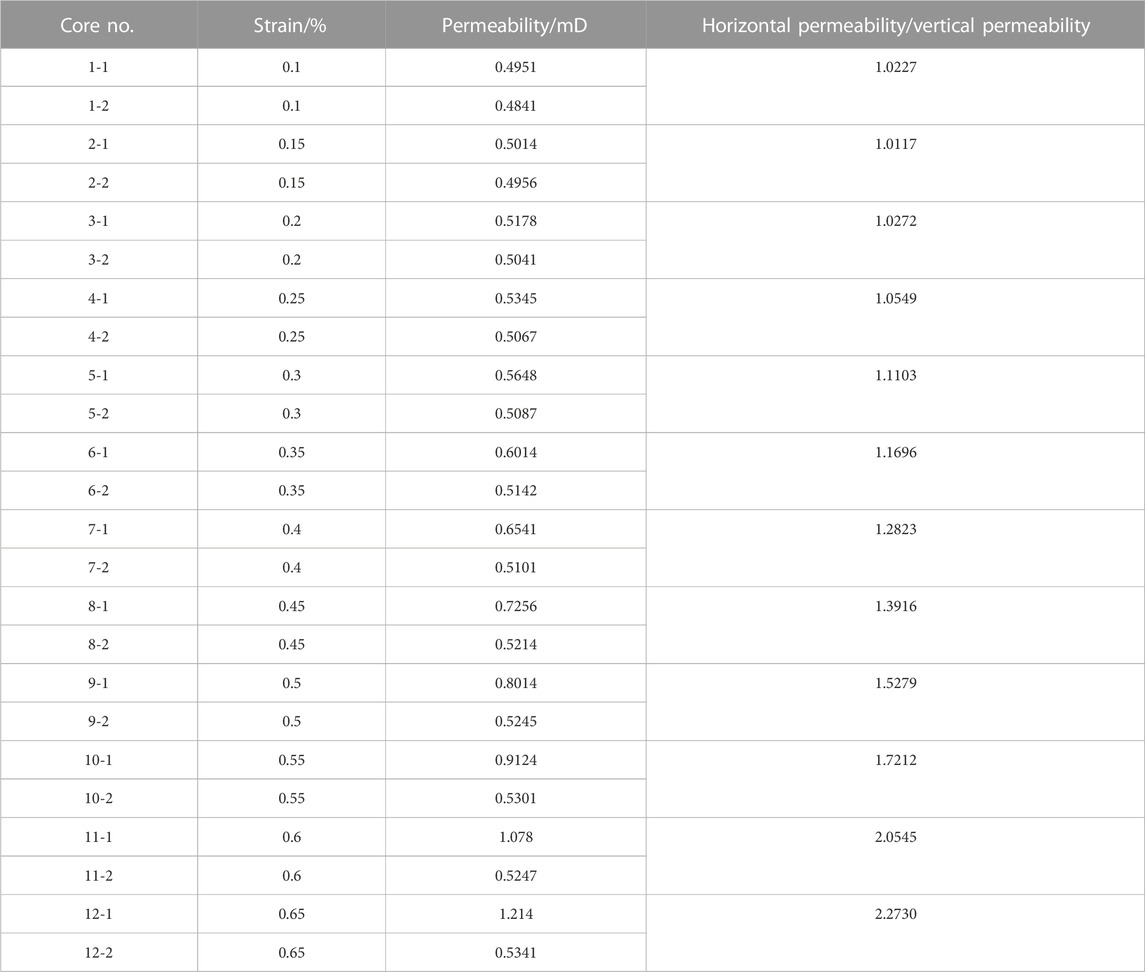
TABLE 3. Experimental core base parameters.
The experiment was carried out using the unsteady method. The experimental data were processed by the “J.B.N” method to obtain the relative permeability, and then the relationship curve between oil and water relative permeability and water saturation was drawn. See Table 4 or the statistical table of the characteristic values of relative permeability of the 6 cores.
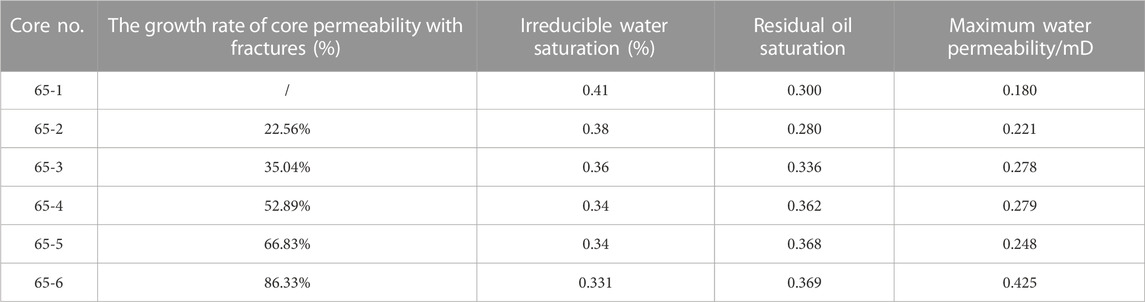
TABLE 4. Statistical table of characteristic values of the permeability curve for samples with different degrees of microcrack development.
The resulting relative permeability curves are shown in Figure 7.
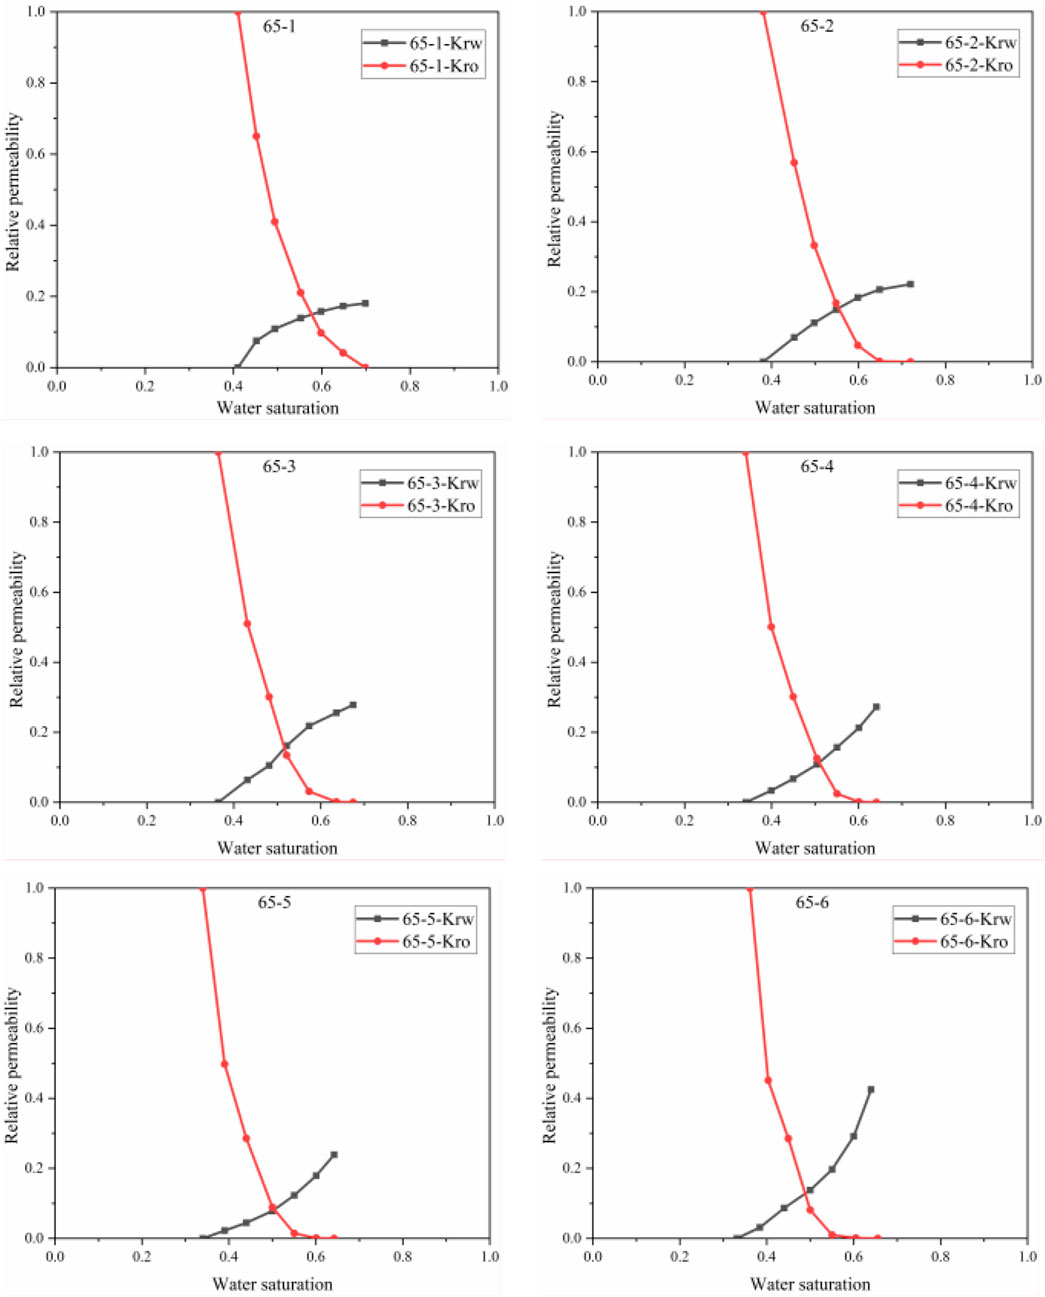
FIGURE 7. Oil–water two-phase relative permeability curves.
From the aforementioned experimental data, it can be found that the phase permeability curves comparing cores with different microcrack development degrees have the following characteristics:
(1) With the increase of the microcrack development degree of core samples, the irreducible water saturation gradually decreases and the residual oil saturation gradually increases;
(2) When the microcrack development degree of core samples is less than 66.83% in the growth rate of seam formation permeability, with the increase of microcracks development degree, the oil–water;
(3) With the increase of microcrack development, the water-phase relative permeability curve gradually changes to a down-concave type, and the absolute value of the highest water-phase relative permeability increases significantly. When there are no microcracks or the degree of microcrack development is low, the water-phase relative permeability curve is up-convex;
(4) With the increase of microcrack development in core samples, the oil-phase relative permeability decreases faster, and the water-phase saturation of the isotonic point decreases.
The aforementioned realized data phenomena are analyzed: 1) microcracks in core samples significantly reduce the seepage resistance of fluids in tight sandstone oil reservoirs and enhance the flow capacity of fluids. Under a specific repulsion pressure difference condition, the irreducible water saturation decreases with the increase of microcrack development; 2) Microcracks, as the main seepage channel of tight sandstone oil reservoirs, are a way to conventional pore seepage capacity. Therefore, it effectively improves the seepage capacity of the tight reservoir and increases the oil drive efficiency. However, when the degree of microcrack development is too large, the microcracks in the reservoir connect, thus exhibiting the nature of large fractures. This property makes the bypassing communication effect stronger and causes the microscopic inhomogeneity to strengthen, thus leading to the reduction of oil drive efficiency. This is the reason why the two-phase co-infiltration zone first becomes wider and then narrower with the degree of microcrack development; 3) the existence of microcracks effectively improves the role of capillary resistance in the repelling process, thus changing the shape of the curve and improving the flow capacity of oil and water.
In summary, microcracks, as the main seepage channel in tight sandstone oil reservoirs, can effectively increase the water-phase seepage capacity and reduce the permeability limit of reservoir water-driven oil recovery. However, the over-development of microcracks will strengthen the bypassing communication effect and cause the microscopic non-homogeneity to strengthen, thus reducing oil driving efficiency. The macroscopic level shows high initial production and a rapid decrease.
In this section, the seepage characteristics of microcracks in dense sandstone reservoirs are described by the seepage characteristic parameters such as stress sensitivity, permeability anisotropy, and phase permeability rule. The microcracks are characterized, and the characterization method can be numerically established as a corresponding mathematical model. We use the black oil model as the basis, and the specific mathematical model is as follows:
where ρo and ρw are the densities of the oil and water phases, respectively; So and Sw are the saturations of the oil and water phases, respectively; φ is the porosity; vo and vw are the seepage velocities of the oil and water phases, respectively, and the expressions for the seepage velocities of the oil and water phases are of the following forms, respectively:
where k is the permeability; kro and krw are the relative permeability of the oil and water phases, respectively; and ψ is the fluid flow potential, defined as
where q0 and qw are the source and sink terms for the oil and water phases, respectively.
In addition, to form a closed system of equations, some auxiliary equations are needed as follows:
For the above oil–water two-phase mathematical model, numerical discretization is performed to obtain the following numerical discretization format:
where λ is the flow rate and its expression is
Based on the aforementioned numerical discretization format, the corresponding residual forms are constructed as follows:
The above equations are nonlinear systems of equations, which can be solved by Newton's iterative method, corresponding to the following solution format:
where the Jacobian matrix can be obtained by performing the following equation:
The numerical simulation of oil–water two-phase flow in the reservoir can be realized by solving the previously mentioned system of equations. However, this model only applies to the numerical simulation of conventional reservoir development. However, for dense sandstone reservoirs, the matrix is denser. Microcracks are commonly developed in which specific mechanisms influence the oil–water flow. The dynamic changes of microcracks in the reservoir also have a more noticeable impact on the oil–water flow, so the aforementioned mathematical model should be modified accordingly.
It is known from the previous study that we can characterize microcracks in tight sandstone oil reservoirs using seepage characteristic parameters such as stress sensitivity, permeability anisotropy, and oil–water two-phase seepage rule. Therefore, the mathematical model can be modified by considering the influence of seepage parameters to describe microcrack characteristics and, thus, characterize microcracks using the mathematical model. This modification of the previously mentioned mathematical model is mainly for the part of the mobility equation, and the specific modified parts are as follows:
The flow equation is as follows:
The continuity equation is as follows:
The permeability in the aforementioned oil–water two-phase flow mathematical model is constant. It does not change with pressure change during development, which is more reasonable in conventional reservoirs. Due to the matrix’s compactness and microcrack development, tight sandstone reservoirs have specific stress-sensitivity characteristics, that is, the permeability of the reservoir will evolve dynamically with the development process. Because of this phenomenon, the original model is modified, that is, the permeability of the reservoir is assigned according to the two-stage rule studied previously. Before the simulation, the reservoir permeability data under different tight sandstone reservoirs must be given. In the calculation process, the permeability parameters of each grid are obtained by interpolation through the pressure level of each grid. The mathematical expression is as follows:
where kp is the reservoir permeability, mD; k0 is the initial reservoir permeability, mD; A1 is the slope of the first straight line, which is only related to the nature of the core itself and not to the degree of microcrack development; A2 is the slope of the second straight line, which is mainly related to the degree of microcrack development, and the higher the degree of microcrack development, the greater the slope of the straight line; p is the pore pressure of the reservoir, MPa; p1 is the initial reservoir pressure, MPa; pf is the pressure value of microcracks’ restart in the tight sandstone oil reservoir, MPa.
As the permeability of the microcrack dense sandstone reservoir has strong anisotropic characteristics when microcracks are developed in the reservoir, the permeability along the microcrack development direction gradually increases with the increase of the microcrack development degree. The rate of increase becomes significant, while the permeability perpendicular to the microcrack development direction does not change much. In response to this phenomenon, the original model was modified, and the specific modifications are as follows:
where
Since microcracks are more developed in tight sandstone reservoirs, especially when microcracks have a specific development direction, the flow of multiphase fluids in different directions will show different characteristics. Using the same set of phase percolation curves cannot accurately describe the influence of microcracks on the flow pattern of multiphase fluids. In order to solve this problem, the aforementioned model can be modified to realize the use of two sets of phase percolation curves in different x and y directions to describe the characteristics of microcracks.
The model considers permeability anisotropy, seepage rule anisotropy, and stress sensitivity of dynamic microcracks. Using the mathematical model, microcracks can be equivalently characterized by assigning values to permeability in different directions, phase seepage curves, and stress sensitivity data considering microcracks retensioning and brought to the aforementioned model for calculation. The aforementioned mathematical model is programmed using MATLAB software.
In calculating the model, the seepage characteristics of microcracks in tight sandstone reservoirs need to be considered. The data of stress sensitivity curves in different directions and oil-water phase seepage curves in different directions representing the characteristics of microcracks are input in the initial stage. The specific data curves are shown in Figure 8. The corresponding model parameters of tight sandstone reservoirs are shown in Table 5.
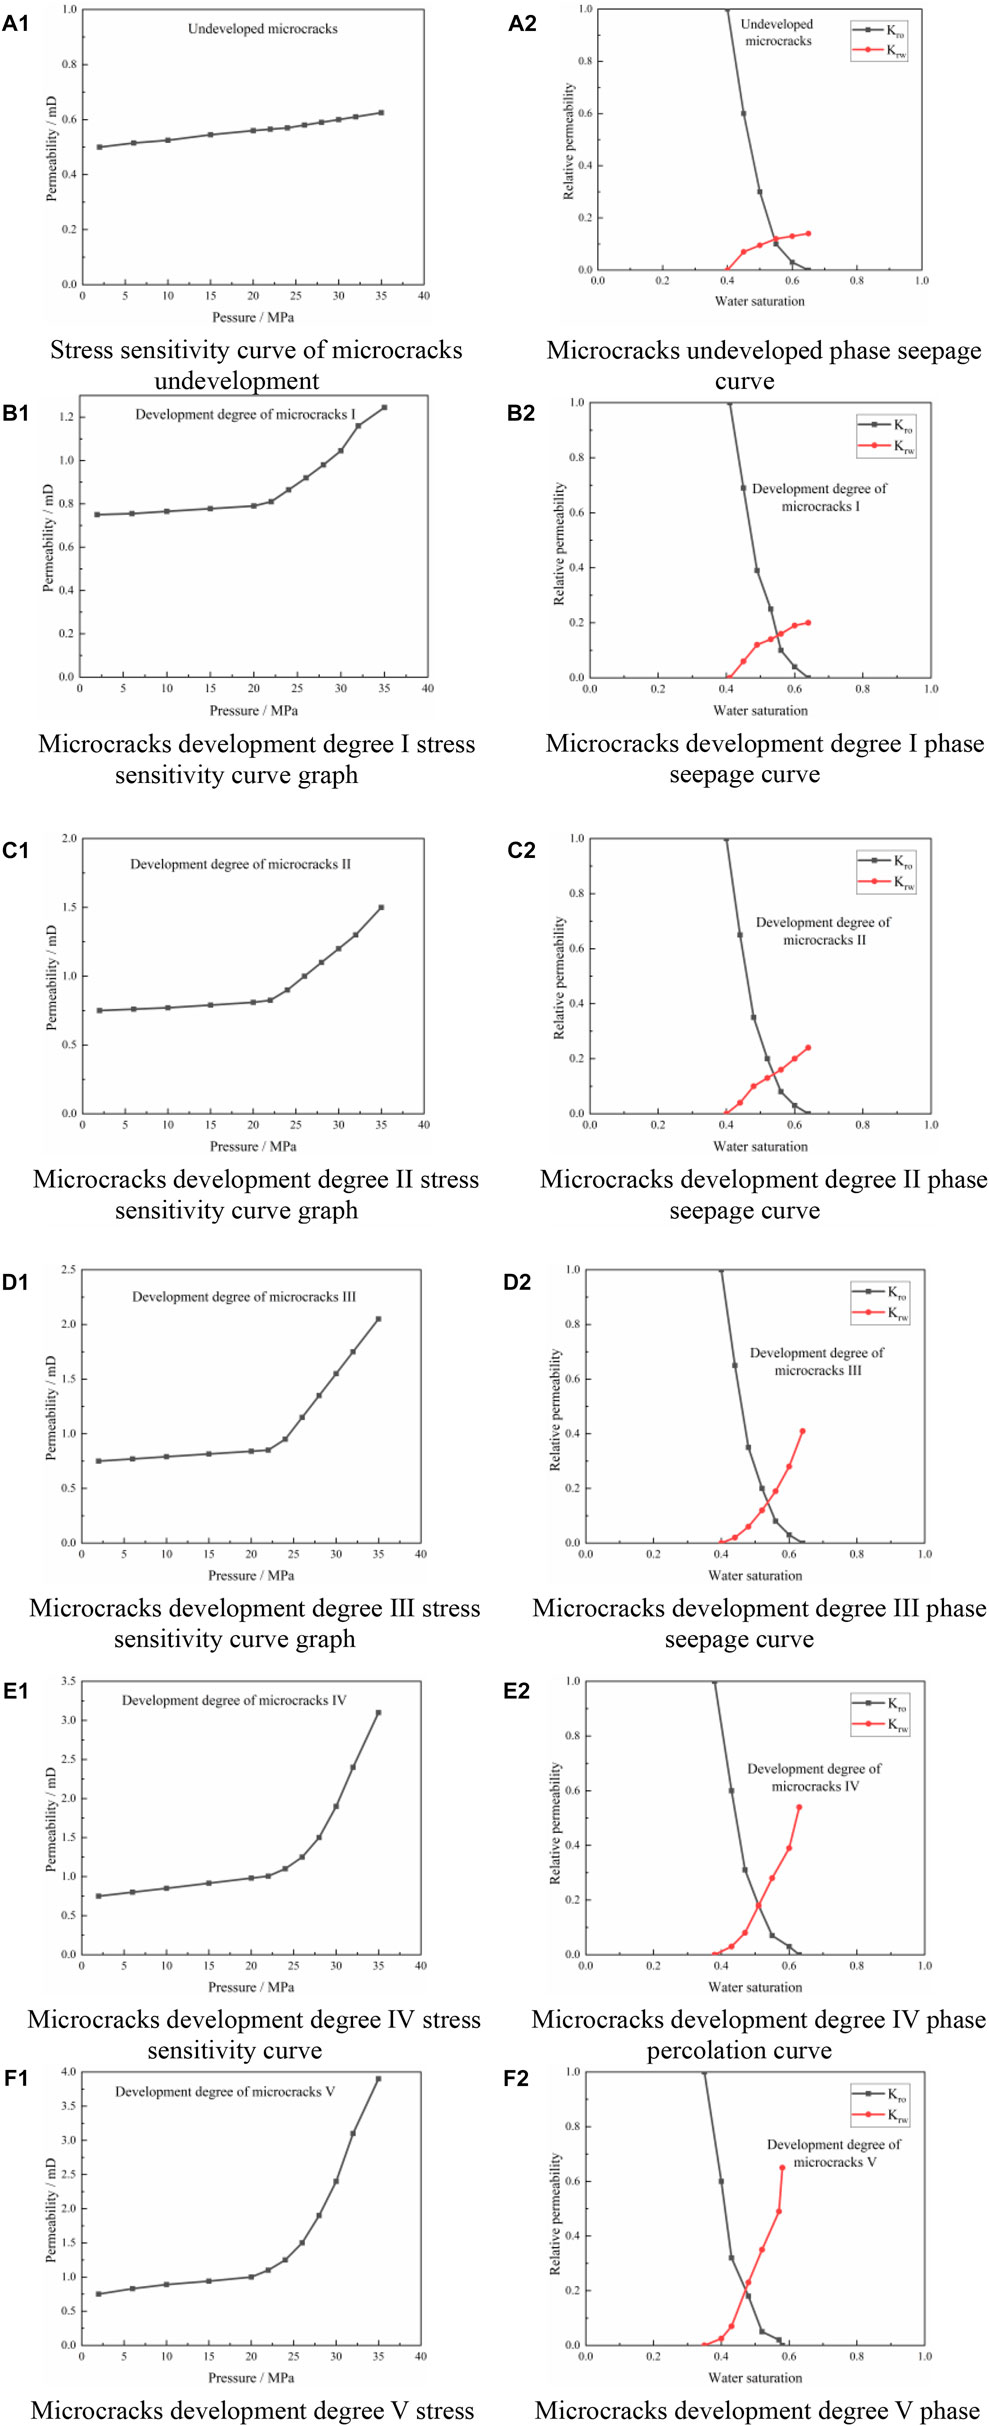
FIGURE 8. Input data graph.
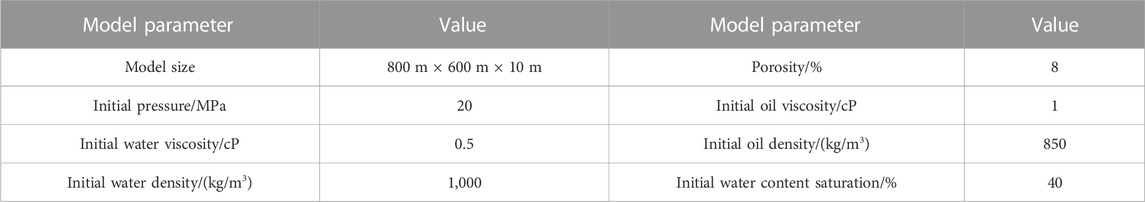
TABLE 5. Model parameters of tight sandstone reservoir.
Five datasets representing different degrees of microcrack development were calculated using the model, representing undeveloped microcracks, microcrack development degree I, microcrack development degree II, microcrack development degree III, and microcrack development degree IV. In the program calculation, the directionality of seepage can set different stress sensitivity data and phase seepage curves in the x and y directions, for example, the model data of undeveloped microcracks in the x direction and the data representing different degrees of microcrack development in the y direction. The calculation generated the daily oil production simulation, daily water production simulation, cumulative oil production simulation, and water content simulation, and the simulation results are shown in Figure 9. The figure shows that 1) the daily oil production shows a high and fast decreasing trend at the initial stage and stable production at the later stage. In the early stage of mining, the daily oil production of the microcrack developed reservoir is higher than that of the undeveloped microcrack reservoir. The daily oil production of the reservoir shows an increasing and then decreasing trend with the increase of microcrack development. With the increase of mining time, the daily oil production of the overdeveloped reservoir is gradually lower than that of the underdeveloped reservoir, and the higher the degree of microcrack development and the earlier the time, the lower the final production; 2) the daily water production of the microcrack developed reservoir is at a relatively low level at the early stage of mining and changes relatively slowly, and with the increase of time, the water production gradually increases. The greater the degree of microcrack development, the greater the degree of microcrack development, the greater the water production, and the faster the water production increases in the later stage; 3) it can be seen from the cumulative oil production graph that when the degree of microcrack development is too high, its final oil recovery is lower than that of the undeveloped microcrack reservoir. When the microcrack development is controlled within a specific range, the final oil recovery is higher than that of the undeveloped microcrack undeveloped reservoir; 4) it can be seen from the water content simulation graph that as the degree of microcrack development increases, the water content of the recovered fluid increases significantly.
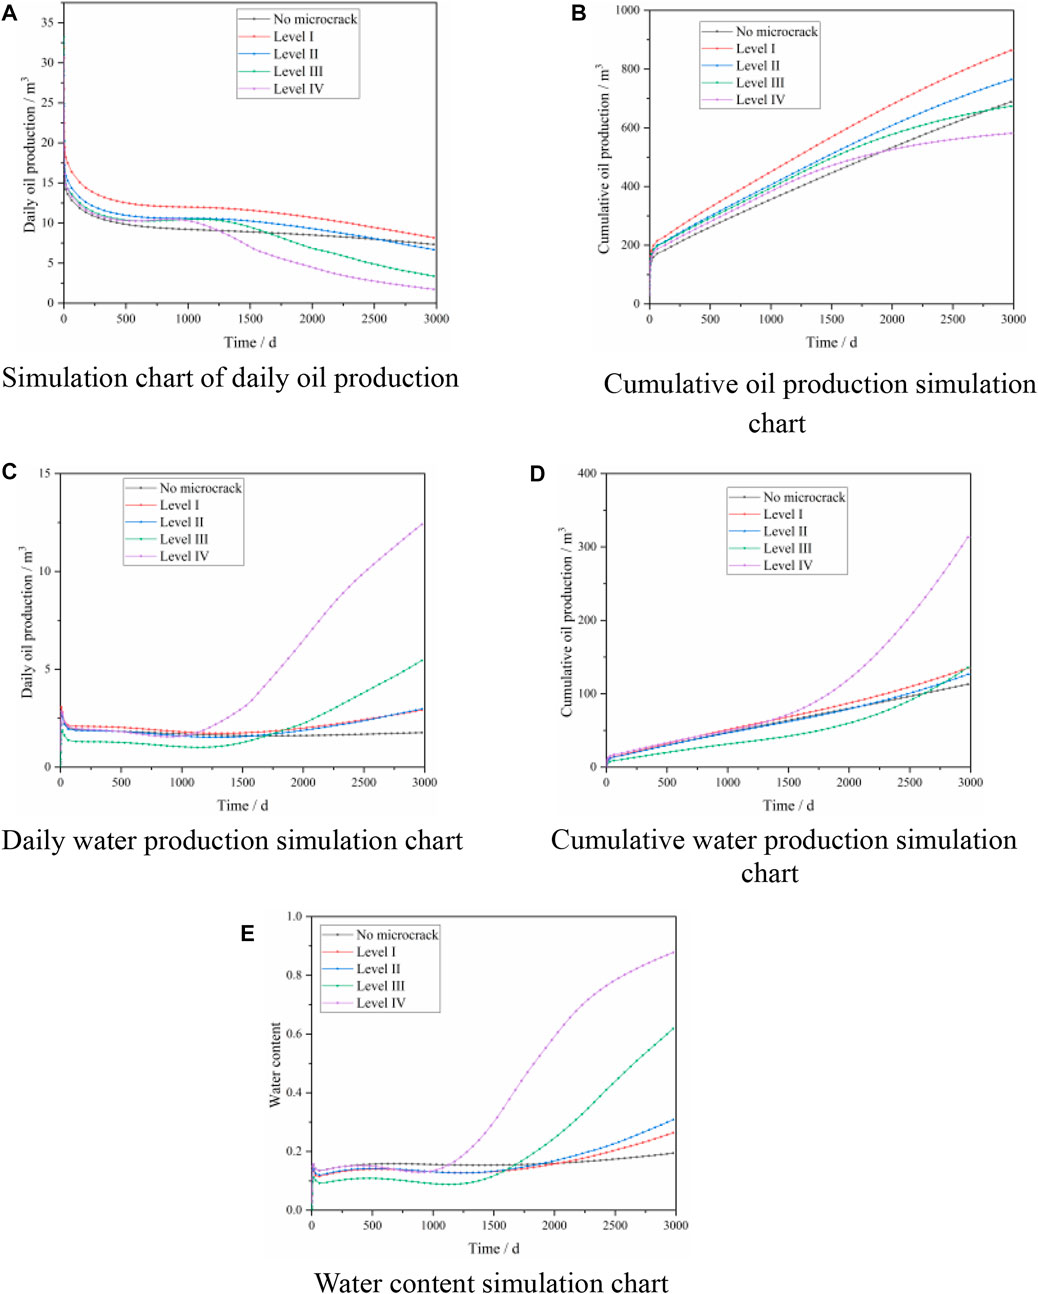
FIGURE 9. Numerical simulation result comparison chart.
Analysis of the phenomena simulated by the previously mentioned model: microcracks in dense sandstone oil reservoirs increase the space for fluid flow, reduces the capillary resistance during the flow of oil and water in both phases, and enhances the flow capacity of oil and water, which makes oil production at the early stage of extraction higher than that of the reservoir with undeveloped microcracks. The dense nature of the pore-throat structure of dense reservoirs limits the oil supply capacity of the matrix when the oil is in large fractures and microcracks in the reservoir. When the oil in the large fractures and microcracks in the reservoir is extracted, the oil in the matrix is not supplied in time due to the limited flow capacity, making daily oil production drop rapidly in the later period. While the microcracks are too developed, the microcracks are connected. The nature of large fractures is exhibited, which strengthens the communicative bypassing effect, causing the microscopic inhomogeneity to strengthen, the late oil production decreases rapidly, and the water production increases rapidly.
In summary, after considering the directionality of seepage flow and the development degree of microcracks, the initial daily and cumulative oil production is higher than the calculation scheme without considering microcracks, and the difference in water production and water content is not significant at the initial stage. However, the water production of the reservoir considering the microcrack feature in the later stage increases significantly and rapidly, and the calculation results without considering the microcrack feature. When the microcracks are significantly developed, and the microcrack characteristic of seepage is highly apparent, the production rate in the later stage will decrease, even lower than the calculation result without considering microcracks. Therefore, when the microcracks are more developed, the initial production capacity of the tight reservoir is increased. However, the later oil production decreases faster, and the later water content increases faster.
By studying the stress sensitivity of microcracks, permeability anisotropy, and oil–water two-phase seepage patterns, the rules used to describe microcracks in dense reservoirs are summarized. A method for characterizing the development degree of reservoir microcracks based on seepage characteristic parameters was innovatively established, and the quantitative evaluation of microcracks was realized. The following conclusions can be drawn:
(1) Seepage characteristic parameters were used to characterize microcracks in tight oil reservoirs for the first time. A seepage model was formed by quantifying the reservoir permeability directionality, relative permeability directionality, and stress sensitivity of fluid pressure changes. A seepage characterization method for microcrack reservoirs was established to make up for the deficiencies of the seepage characterization method for microcracks.
(2) The permeability change is divided into two stages for microcrack cores. The first stage is when the fluid pressure is slight, and the microcracks are closed under compressive stress. At this time, the microcracks have limited influence on the seepage capacity, and the permeability tends to increase slowly with fluid pressure. The second stage is when the microcracks open and the permeability increases rapidly, and these two stages can be described using two straight lines, the microcracks. The higher the degree of development, the greater the slope of the straight line in the second stage. For all cores, the permeability tends to decrease with increasing axial pressure.
(3) The degree of microcrack development increases, the saturation of irreducible water decreases, the saturation of residual oil increases, the relative permeability of the oil phase decreases faster, and the saturation of the water phase at the isotonic point decreases. The relative permeability curve of the water phase undergoes an up-convex–down-concave shape change. The absolute value of the highest relative permeability of the water phase increases significantly. When the seam formation permeability growth rate is less than 66.83%, the degree of microcrack development increases, and the two-phase co-infiltration zone increases in size. The two-phase co-infiltration zone becomes narrower when the seam formation permeability growth rate is more significant than 66.83%.
(4) Based on the modified black oil model calculation, it is shown that microcracks can increase the cumulative oil production when the development degree of microcracks is I. and II., with a production cycle of 3,000 days. When the microcrack development degree is I., the daily oil output is always higher than that of the matrix reservoir. When the microcrack development degree is II., the daily oil production begins to be lower than that of the matrix reservoir around 2,500 days. When the microcracks are highly developed, and seepage characteristics of the microcrack nature are too obvious, the production rate at the later stage decreases and is even lower than the calculation results without considering microcracks.
The original contributions presented in the study are included in the article/Supplementary Material; further inquiries can be directed to the corresponding author.
This paper is a collaborative work of all authors. JC and JZ wrote and structured the article. FF, ZW, SH, YZ, and YW cored the sandstone core and carried out the experiment. JC, JP, and QG helped with the analysis of the experimental data. ZW, ZJ, and YL developed the mathematical model and performed numerical simulation. All authors contributed to the article and approved the submitted version.
This work was supported by the General Program of Chongqing Natural Science Foundation (nos. cstc2020jcyjmsxmX0659 and CSTB2022NSCQ-MSX1423), and 2022 Chongqing Municipal College Student Innovation Training Program Project (s202211551028).
The author YZ was employed by PetroChina Changqing Oil Field Company. The author ZW was employed by PetroChina Research Institute of Petroleum Exploration and Development. The authors ZJ and YL were employed by PetroChina Jilin Oilfield Company.
The remaining authors declare that the research was conducted in the absence of any commercial or financial relationships that could be construed as a potential conflict of interest.
All claims expressed in this article are solely those of the authors and do not necessarily represent those of their affiliated organizations, or those of the publisher, the editors, and the reviewers. Any product that may be evaluated in this article, or claim that may be made by its manufacturer, is not guaranteed or endorsed by the publisher.
AndersLaubach, M. H. S. E., and Scholz, C. H. (2014). Microfractures: A review. J. Struct. Geol. 69, 377–394. doi:10.1016/j.jsg.2014.05.011
Deschamps, A., Tivey, M., Embley, R. W., and Chadwick, W. W. (2007). Quantitative study of the deformation at southern explorer ridge using high-resolution bathymetric data. Earth Planet. Sci. Lett. 259 (1-2), 1–17. doi:10.1016/j.epsl.2007.04.007
Dong, F. J., Cao, Y., Ren, D. Z., and Sun, W. (2019). Micro-fracture development impact factors analysis and its effects on well production of hua-qing area ordos basin in China. Int. J. Oil, Gas Coal Technol. 21 (1), 39–56. doi:10.1504/IJOGCT.2019.099532
Ezati, M., Mehran, A., Ali, R. M., Vahidoddin, F., and Javad, H. (2018). Characterization of micro-fractures in carbonate sarvak reservoir, using petrophysical and geological data, sw Iran. J. Petroleum ence Eng. 170, 675–695. doi:10.1016/j.petrol.2018.06.05.8
Fu, J, H., Li, S, X., Niu, X., Deng, X., and Zhou, X, P. (2020). Geological characteristics and exploration of shale oil in chang 7 member of triassic Yanchang Formation, ordos basin, NW China. Petroleum Explor. Dev. 47 (05), 931–945. doi:10.1016/s1876-3804(20)60107-0
Gao, H., and Li, H. (2016). Pore structure characterization, Permeability evaluation and enhanced gas recovery techniques of tight gas sandstones. J. Nat. Gas Sci. Eng. 28, 536–547. doi:10.1016/j.jngse.2015.12.018
Garzic, E. L., L'Hamaide, T. D., Diraison, M., Géraud, Yves, Sausse, J., Urreiztieta, M. D., et al. (2011). Scaling and geometric properties of extensional fracture systems in the proterozoic basement of Yemen. Tectonic interpretation and fluid flow implications. J. Struct. Geol. 33 (4), 519–536. doi:10.1016/j.jsg.2011.01.012
Gu, Y., Ding, W, L., Yin, S., Wang, R, Y., and Liu, J, J. (2017). Analytical modeling of mercury injection in high-rank coalbed methane reservoirs based on pores and microfractures: A case study of the upper carboniferous taiyuan Formation in the heshun block of the qinshui basin, central China. J. Geophys. Eng. 14 (2), 197–211. doi:10.1088/1742-2140/aa53c0
Guanzheng, Q., Qu, Z., Hazlett, R. D., Freed, D., and Mustafayev, R. (2016).Geometrical description and permeability calculationabout shale tensile micro-fractures. Petroleum Explora-tion Dev., 43(1),124–130. doi:10.1016/S1876-3804(16)30014-3
Guerriero, V., Iannace, A., Mazzoli, S., Parente, M., Vitale, S., and Giorgioni, M. (2010). Quantifying uncertainties in multi-scale studies of fractured reservoir analogues: Implemented statistical analysis of scan line data from carbonate rocks. J. Struct. Geol. 32 (9), 1271–1278. doi:10.1016/j.jsg.2009.04.016
Hooker, J. N., Gomez, L. A., Laubach, S. E., Gale, J. F. W., and Marrett, R. (2012). Effects of diagenesis (cement precipitation) during fracture opening on fracture aperture-size scaling in carbonate rocks. Geol. Soc. Lond. Spec. Publ. 370 (1), 187–206. doi:10.1144/sp370.9
Hooker, J. N., Laubach, S. E., Gomez, L., Marrett, R., Eichhubl, P., Diaz-Tushman, K., et al. (2011). Fracture size, frequency, and strain in the cambrian eriboll formation sandstones, NW scotland. Scott. J. Geol. 47 (1), 45–56. doi:10.1144/0036-9276/01-420
Hooker, J. N., Laubach, S. E., and Marrett, R. (2014). A universal power-law scaling exponent for fracture apertures in sandstones. Bulletin 126 (9-10), 1340–1362. doi:10.1130/B30945.1
Hu, J, H., Sun, R, F., and Zhang, Y. (2020). Investigating the horizontal well performance under the combination of micro-fractures and dynamic capillary pressure in tight oil reservoirs. Fuel 269, 117375. doi:10.1016/j.fuel.2020.117375
Li, T., Qian, L. I., Yong, H. U., Peng, X., Feng, X., Zhu, Z., et al. (2021). Quantitative characterization of irregular micro-fracture network and its effect on the permeability of porous media. Petroleum Explor. Dev. 48 (02), 368–378. doi:10.11698/PED.2021.02.13
Li, W., Sun, W., and Tang, P. (2017). A method forrock fracture network characterization based on topo-logical structure. Nat. Gas. Ind. 37 (6), 22–27. doi:10.3787/j.issn.1000-0976.2017.06.003
Li, X., Lu, D., Luo, R., Sun, Y., Gao, H., Hu, Y., et al. (2019). Quantitative criteria for identifying main flow channels in complex porous media. Petroleum Explor. Dev. 46 (05), 998–1005. doi:10.1016/S1876-3804(19)60256-9
Li, X., Luo, R., Hu, Y., Xu, X., Li, Yang., Guo, Z., et al. (2020). Main flow channel index in porous sand reservoirs and its application. Petroleum Explor. Dev. 47 (05), 1055–1061. doi:10.1016/S1876-3804(20)60116-1
Ougier-Simonin, A., Renard, F., Boehm, C., and Vidal-Gilbert, S. (2016). Microfracturing and microporosity in shales. Earth-Science Rev. 162, 198–226. doi:10.1016/j.earscirev.2016.09.006
Pudji, P., Taufan, M., and Sesilia, N. (2022). Identification and characterization of microcracks in carbonate reservoirs. Oil Explor. Dev. 49 (2), 366–376. doi:10.1016/S1876-3804(22)60035-1
Scholle, P. A., and Ulmer-Scholle, D. S. (2003). A color guide to the petrography of carbonate rocks: Grains, textures, porosity, diagenesis.
Sornette, D., and Sornette, A. (1999). General theory of the modified Gutenberg-Richter law for large seismic moments. Bull. Seismol. Soc. Am. 89 (4), 1121–1130. doi:10.1785/bssa0890041121
Wang, J., Wu, S., Li, Q., Zhang, J., and Guo, Q. (2020). Characterization of the pore-throat size of tight oil reservoirs and its control on reservoir physical properties: A case study of the triassic tight sandstone of the sediment gravity flow in the ordos basin, China. J. Petroleum Sci. Eng. 186, 106701. doi:10.1016/j.petrol.2019.106701
Wang, R., Chen, M., and Sun, W. (2008). Quantitative research on the characteristics of and parameters for micro cracks in ultra-low permeability sandstone reservoirs-taking Yan 25 and Zhuang 40 areas in the Ordos Basin for example. Acta Mineral. Sin. 28 (2), 215–220. doi:10.1016/S1872-5791(08)60056-1
Wu, Z., Li, X., Xiao, H., Liu, X., Lin, W., Rao, Y., et al. (2021a). The establishment and evaluation method of dslbartificial microcracks in rocks. Energies 14 (10), 2780. doi:10.3390/en14102780
Wu, Z., Zhang, J., Li, X., Xiao, H., Liu, X., Rao, Y., et al. (2021b). Influence of microcracks on stress sensitivity in tight sandstone. Lithosphere 2021 (4), 7073494. doi:10.2113/2021/7073494
Xu, J., Wu, K., Li, R., Li, Z., Xu, Q., Chen, Z., et al. (2018a). Real gas transport in shale matrix with fractal structures. Fuel 219, 353–363. doi:10.1016/j.fuel.2018.01.114
Zang, S., Cui, J., Zheng, Y., Xu, W., and Wei, J. (2012). Analysis of characteristics of low-permeable reservoir with micro-fracture and their origins of the neogene youshashan Formation in nanyishan Oilfield,Qaidam basin. J. Palaeogeogr. 14 (1), 133–141.
Keywords: tight oil, microcracks, seepage characterization, characterization methods, relative permeability curve tight oil, oil production, relative permeability curve
Citation: Jiao G, Fang F, Zhang Y, Wu Z, Zhang J, Jiang Z, Lv Y, Cao J, Peng J, He S, Wang Y and Guan Q (2023) A new method for the characterization of microcracks based on seepage characteristics. Front. Earth Sci. 11:1229946. doi: 10.3389/feart.2023.1229946
Received: 31 May 2023; Accepted: 16 June 2023;
Published: 17 July 2023.
Edited by:
Mingtao Li, Linyi University, ChinaReviewed by:
Jinze Xu, University of Calgary, CanadaCopyright © 2023 Jiao, Fang, Zhang, Wu, Zhang, Jiang, Lv, Cao, Peng, He, Wang and Guan. This is an open-access article distributed under the terms of the Creative Commons Attribution License (CC BY). The use, distribution or reproduction in other forums is permitted, provided the original author(s) and the copyright owner(s) are credited and that the original publication in this journal is cited, in accordance with accepted academic practice. No use, distribution or reproduction is permitted which does not comply with these terms.
*Correspondence: Feifei Fang, ZmVpZmVpZmFuZ0BjcXVzdC5lZHUuY24=
Disclaimer: All claims expressed in this article are solely those of the authors and do not necessarily represent those of their affiliated organizations, or those of the publisher, the editors and the reviewers. Any product that may be evaluated in this article or claim that may be made by its manufacturer is not guaranteed or endorsed by the publisher.
Research integrity at Frontiers
Learn more about the work of our research integrity team to safeguard the quality of each article we publish.