 J. C. Román-Herrera
 J. Delgado
 M. J. Rodríguez-Peces
 J. A. Peláez
 J. Garrido
95% of researchers rate our articles as excellent or good
Learn more about the work of our research integrity team to safeguard the quality of each article we publish.
Find out more
ORIGINAL RESEARCH article
Front. Earth Sci. , 29 August 2023
Sec. Geohazards and Georisks
Volume 11 - 2023 | https://doi.org/10.3389/feart.2023.1226894
This article is part of the Research Topic Seismic Microzonation and Risk Reduction View all 5 articles
In this work, a method for the fast evaluation of seismically-induced landslides is applied at regional scale in the Granada Basin (southern Spain). The methodology is based on the concept of rigid block but takes into account the variability in input data (geotechnical properties, failure depth and saturation state of the materials) through the use of a logical tree scheme. Input data were combined and evaluated using five different Newmark displacement empirical relations, which are automatically weighted to obtain a final co-seismic landslide susceptibility map. A Geographic Information System system was used to obtain the resulting maps considering the different branches and weights of the logic tree through an specifically developed automatic code written in Phyton. The landslides induced by the 2021 Mw 4.4 events of the Santa Fe seismic series have been used to validate the methodology. This is later used as input along with the road network to analyze the distribution of areas of different susceptibility level. The results obtained show that 1.73% of the total area is characterized by moderate to high susceptibility, being the southern and eastern sections of the Granada basin were more vulnerable slopes are found. When considering only zones around the road network (50 m buffer), it is found that 2.11% of slopes around highways and 1.33% of road slopes have moderate to high susceptibility, especially the A-92 highway and the A-338 road. These roads traverse areas with steep slopes and a combination of hard and soft materials, which increases the susceptibility of disrupted landslides. On the other hand, in more densely populated areas such as the metropolitan area of Granada, the susceptibility is lower due to their location on terrain with low to negligible slopes. The results are of interest for authorities managing slope stabilities because they allow establishing effective and locally-based seismic forecast works in order to minimize the damage of future events.
One of the main problems that arise because of earthquakes is their impact on roads (Bird and Bommer, 2004; Daniell et al., 2017). The appearance of cracks and fissures on the roads is possible even due to low to moderate magnitude events. These failures can pose a potential danger to road safety, especially if they are not detected and repaired in time, as well as the possible occurrence of ground movements that can affect their stability. This problem is particularly relevant in mountain areas, where roads are often built on unstable and earthquake-prone slopes (Martino et al., 2019).
There are different methodologies aimed at producing susceptibility maps to delimit areas prone to landslides induced by earthquakes. A first group of methodologies is based in delineating the areas where ground motion is severe enough to overcome shear strength of shallow materials found on slopes (Del Gaudio et al., 2003; Peláez et al., 2005; Marc et al., 2017). Threshold values of ground motion are usually defined to identify areas were slopes may fail due to earthquake shaking. Wilson and Keefer (1985) suggested the use of Arias Intensity values for this purpose. Later, Keefer and Wilson (1989) proposed values of 0.11 m/s as the threshold for triggering incoherent landslides (sensu Keefer, 1984), 0.32 m/s for coherent landslides and 0.54 m/s for lateral spreads and flows. These values were used by Peláez et al. (2005) in their hazard study in terms of Arias Intensity to delineate areas susceptible to suffer instabilities of different types in the Betic Cordillera (Spain). It is also frequent a combination of seismic hazard studies (in terms of Arias Intensity, peak ground acceleration, etc.) with empirical relationships to estimate the corresponding rigid block displacement across a region (Rathje and Saygili, 2009; Chousinitis et al., 2016; Jafarian et al., 2019), being this displacement a parameter that is commonly used as a guide for evaluating the performance of slopes during earthquakes (Newmark, 1965). It is widely accepted that displacements of 2 and 10 cm are threshold values for widespread occurrence of incoherent and coherent failures, respectively (Keefer and Wilson, 1983). Chousianitis et al. (2016) prepared a coseismic landslide hazard map for Greece based on these values. They mapped the spatial distribution of minimum acceleration needed to exceed fixed values of displacement (2 and 10 cm) in a 50 years period. These methodologies do not consider the strength of materials and their performance during shaking, so they are useful for delineating wide areas where the seismic part of the problem is reached (or exceeded), but not for identifying which slopes within a given area are comparatively more prone to suffer instability.
Another group of methodologies is based in the statistical analysis of predictor factors (topographical data, distance to specific features like active faults or rivers, lithology, ground motion, etc.) and the inventory of instabilities triggered by one or several earthquakes (Lee et al., 2008; Nowicki et al., 2014; Kritikos et al., 2015; Bagheri et al., 2018; Chowdhuri et al., 2022; Nath et al., 2022). Such inventories are becoming more available in the recent times (Tanyas et al., 2017) although they have very different characteristics and their level of completeness and uncertainties is very variable (Tanyas and Lombardo, 2020), so they should be used with caution. Several kinds of statistical functions have been used for this purpose (logistic, fuzzi methodologies, artificial neural networks, etc.). These models have been tested against inventories of recent earthquakes and are currently used for preparing near real-time coseismic landslide maps (Nowicki et al., 2014). The results obtained are promising but they still need further improvement for making them useful for emergency response planning, showing overpredicted landslide occurrences (Allstadt et al., 2018; Robinson et al., 2018).
However, the methodology proposed by Jibson (1993) and Jibson et al. (2000) has been the most widely used in recent times to assess seismically-induced susceptibility of slopes (Luzi et al., 2000; Niño et al., 2014; Caccavale et al., 2017). It is based on the concept of rigid block sliding model (Newmark, 1965). At the same time, Jibson et al. (2000) and Jibson and Michael (2009) also state that this methodology is useful in the study of small, shallow and disrupted landslides, which are the most common types induced by earthquakes (Keefer, 1984; Delgado et al., 2011a). Rodríguez-Peces et al. (2020) stated that the true success of this methodology lies in the quantitative combination of the main factors of the problem, such as the geometry and the geotechnical parameters of the slopes and the severity of the seismic ground motion, implemented in a Geographic Information System (GIS) environment. This allows for the fast production of maps assisting in the assessment of the seismic vulnerability of infrastructures.
However, the earliest Newmark sliding block methodology presents several limitations related to the difficulty of incorporating variability and uncertainty of the different variables used in the analyses. For instance, the size of slope instabilities can vary greatly depending on the spatial resolution of the digital elevation model used in the analysis (Rodríguez-Peces et al., 2011), being the inherent variability of the geotechnical properties of geological materials another source of uncertainty too. The problem is related to the inability to include the spatial variability of strength parameters within the same geological formation (Dreyfus et al., 2013). Different studies compared the results of susceptibility maps with inventories of seismically-induced landslides (McCrink, 2001; Dreyfus et al., 2013; Rodríguez-Peces et al., 2013; 2020) concluding that these maps only capture a portion of the observed landslides. In addition, reducing the strength parameters of materials increased the proportion of captured slope failures, but also increased the susceptibility category, making the map more pessimistic than expected. The challenge facing the scientific community is to propose a methodology whose results are as accurate as possible, that does not overestimate the susceptibility of the territory, and thus serving as support in decision-making for the construction and maintenance of infrastructures.
The Granada Basin, S Spain (Figure 1), is characterized by a low to moderate seismic hazard in a global context, although it has experienced several strong magnitude earthquakes causing extensive damage (Madarieta-Txurruka et al., 2021). More recently, in 2021, the western part of this basin suffered a long seismic series, known as the 2021 Santa Fe seismic series (Madarieta-Txurruka et al., 2022), that raised concerns among local authorities regarding its impact on the roads in the area and the safety of drivers.
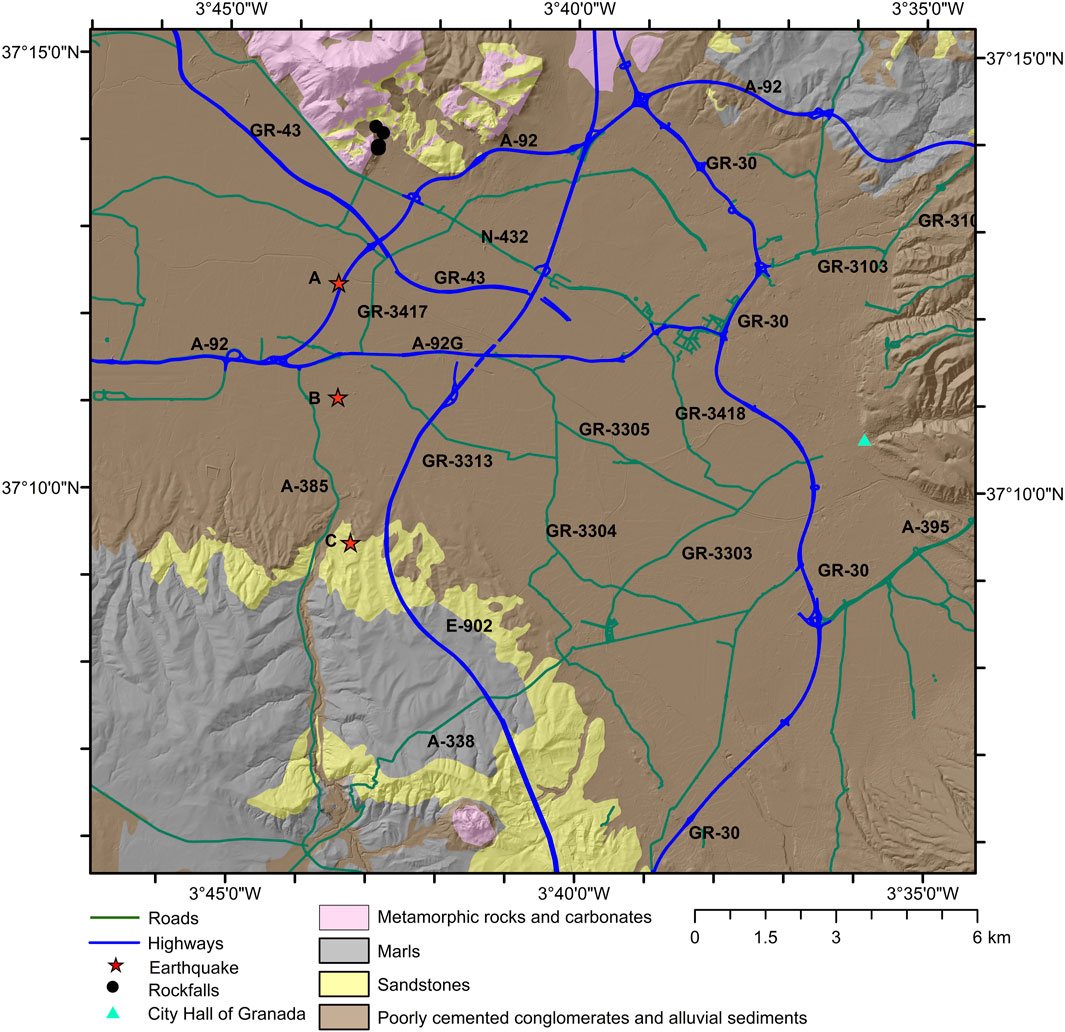
FIGURE 1. Location map of the study area. The map includes the lithological groups and roads considered in this work. Stars A, B and C correspond to January 23rd, 26th and 28th, 2021, events analyzed. Black points show rockfalls triggered by these events.
In this work, the logic-tree methodology proposed by Rodríguez-Peces et al. (2020) is implemented to evaluate seismically-induced landslide susceptibility of slopes around the road network in the Granada Basin. The aim of this work is to know the level of susceptibility (on a regional scale) of the slopes to seismic-induced landslides around the main road network, and to recognize those areas and roads in which this problem could be more important if a severe earthquake occurs in the study area. First, a study was conducted in an area near the epicenters of the largest earthquakes recorded during the 2021 Santa Fe seismic series using a deterministic approach. The results were then compared with the location of instabilities triggered by these earthquakes to assess how appropriate the obtained maps were. Later, the same methodology was used for an assessment consisting in the probabilistic expected horizontal peak ground acceleration (PGA) and Arias Intensity (AI) values for a 475 years return period. Given the scale of the work, the results show a general picture of the problem in the study area, although they cannot be considered accurate enough for detailed studies about the dynamic stability of a given specific slope.
The study zone is the Granada basin. This is a intramountain basin located in the central part of the Betic Cordillera (Sanz de Galdeano et al., 2005). The basement is constituted by Mesozoic sedimentary rocks of the External Zones of the Cordillera to the north and west borders, and by Palaeozoic to Triassic metamorphic rocks of the Internal Zones in the south and eastern borders. Basin fill comprises sedimentary rocks from Burdigalian (Miocene) up to Quaternary (Braga et al., 1990). Sedimentary fill consists mainly on conglomerates, sandstones, marls and limestones during the Miocene. Since Pliocene and Pleistocene, thick deposits of conglomerates and sandstones occurred, and alluvial sediments are found in relation to present rivers (Fernández et al., 1996).
The Granada Basin is limited on its northern and eastern edges by a set of normal faults that have been active since the Pleistocene and there also exist active faults in the central sector of the basin (Sanz de Galdeano et al., 2003; 2012; Figure 2). Seismicity generated by these faults is characterized by shallow earthquakes of moderate intensity (epicentral intensity, Io, in the range VII to VIII) and occasionally strong and damaging earthquakes (Io ≥ IX) (Martínez Solares y Mezcua, 2002; Sanz de Galdeano and Peláez, 2012).
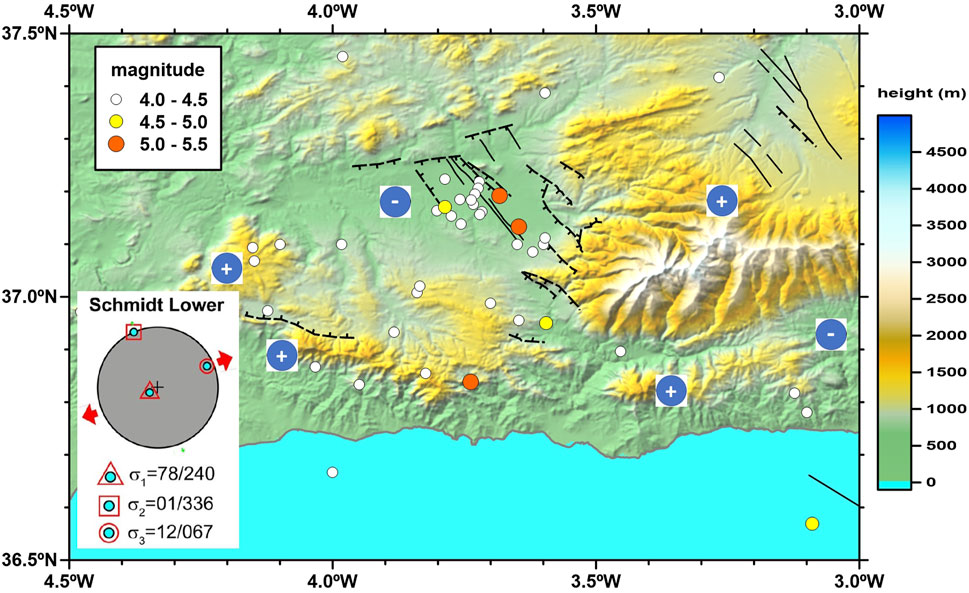
FIGURE 2. Map showing the crustal instrumental earthquakes above magnitude 4.0 (data provided by the Spanish Instituto Geográfico Nacional), the main known faults (García Mayordomo et al., 2012; Sanz de Galdeano et al., 2012), and the computed reduced stress tensor in the study area, the northeastern Granada Basin (Madarieta Txurruka et al., 2021). Relative uplifting and subsidence areas are also showed.
In 2021, a seismic series affected the study zone. It is characterized by very low to low magnitude events from January to November 2021 (Lozano et al., 2022). The series started on 23 January, reaching up to 200 events during a 3-days period (26–29 January). These earthquakes were all located at a depth of 3–5 km. This work has used the largest seismic events occurring during three different days in late January 2021 (days 23, 26 and 28), reaching a magnitude Mw 4.4.
During the 2021 Santa Fe seismic series, rockfalls involving blocks of metric volume were identified (Figure 3). These earthquake-induced landslides were located isolated in the northern part of the study zone, in an area were abandoned quarries exist (Figure 1). They occurred in areas where jointed carbonates outcrop on steep slopes. Rock blocks have clean cuts and rolled several hundred meters from their origin point. They were recognized shortly after the occurrence of main events studied. The state of slopes and debris associated to instabilities ensured they were very recent features in the slopes but most likely induced by some event of the series, although it was not possible to discern which of them.
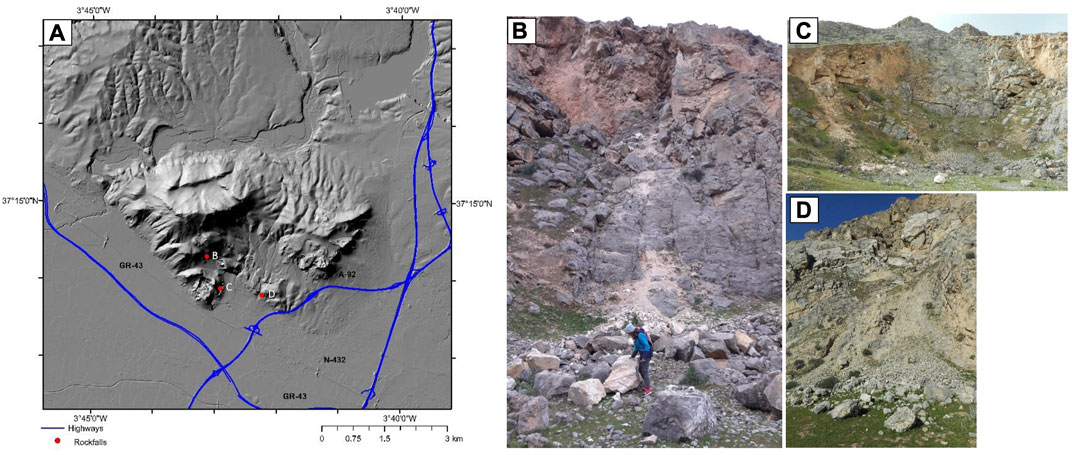
FIGURE 3. Coseismic landslides triggered by the 2021, Santa Fe, seismic series. (A) Map showing the location of instabilities; (B–D) Rockfalls triggered.
The used data come from different sources of information, which have been verified and cross-checked. Geological data came from the Spanish Instituto Geológico y Minero (Lupiani Moreno and Soria Mingorance, 1985). Geotechnical data were obtained from the projects of construction of main roads in the area (highways A92, A44, etc.), dams (Béznar and Rules reservoirs) and complemented with soil samples taken in the south-western area of the Granada Basin, where less information was available, and tested in the Laboratory for Applied Geology of the University of Alicante. Climatological data correspond to those provided by the Spanish Agencia Estatal de Meteorología (AEMET, 2023) from the closest weather station of the Granada Airport. The Digital Elevation Model (DEM) with a grid of 5 m and the digital version of the road map in shapefile format (Table 1) were also obtained from the Spanish Instituto Geográfico Nacional (IGN, 2023a). Ground motion data related to 2021 Santa Fe seismic events were recorded by the Spanish Strong Motion Network, managed by the Spanish Instituto Geográfico Nacional. Fortunately, the seismic stations located in the area where the seismically-induced landslides occurred were able to record accelerograms from which the horizontal peak ground horizontal acceleration (PGA) and Arias Intensity (AI) values were computed.
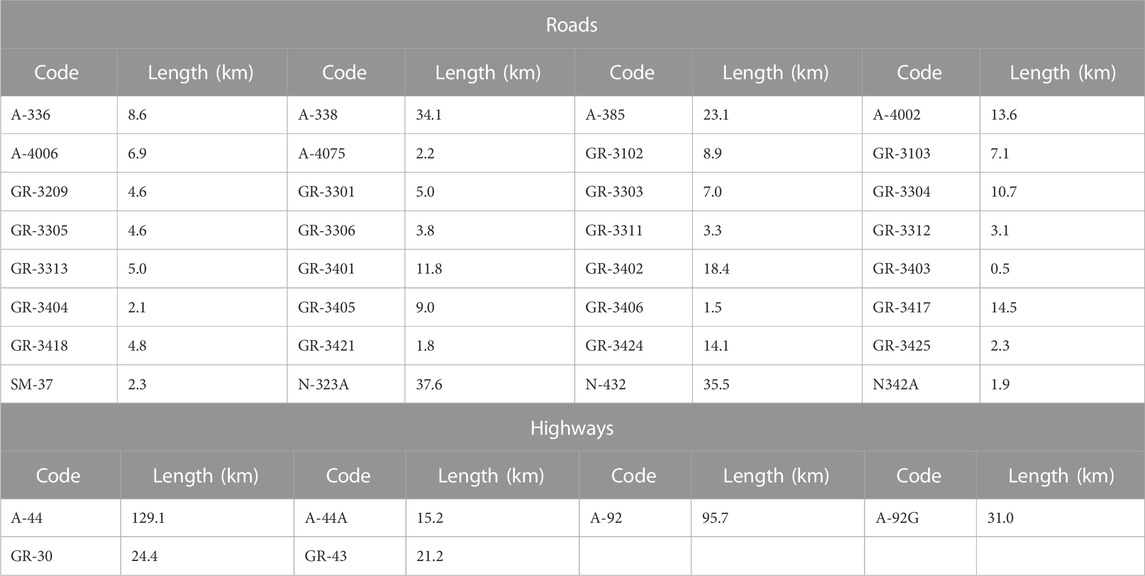
TABLE 1. Road network analyzed within the study area. The total length of roads and highways is 319.1 and 316.4 km, respectively.
According to Dreyfus et al. (2013), the ability of the methodology proposed by Jibson (1993) and Jibson et al. (2000) to accurately predict coseismic landslides depends more on the uncertainty in the strength properties assigned to materials and less in ground motion derived parameters. The procedure followed in this work try to incorporate such uncertainty based on the logic tree approach, following the procedure proposed by Wang and Rathje (2015), and used by Rodríguez-Peces et al. (2020). The probabilistic logic-tree approach is used in hazard and risk analyses and involves creating a logic tree model representing the different plausible scenarios. Each branch of the tree represents a plausible option or outcome and is assigned a weight reflecting its relative credibility. The sum of the weights of all branches that originate from a certain node is equal to one. The result of the analysis is obtained as the weighted sum of the results obtained in each branch of the model (Kulkarni et al., 1984; Bommer and Scherbaum, 2008).
In this work, the structure of the logic tree was divided into four parts: depth of the failure surface, geotechnical data (cohesion, friction angle), degree of saturation of soil column and the empirical equation of Newmark displacement. For the first branch section of the logic tree (Figure 4), the variability of the failure depth was considered. The results found by Alfaro et al. (2012) and Rodríguez-Peces et al. (2013) about depth to failure surface of seismic-induced landslides during recent earthquakes occurred in south Spain were introduced in this branch. Consequently, depth of failure surface was set to 1, 2 and 3 m. These values are in agreement with the fact we are studying only shallow landslides, which are the best suited type of failure for the used methodology.
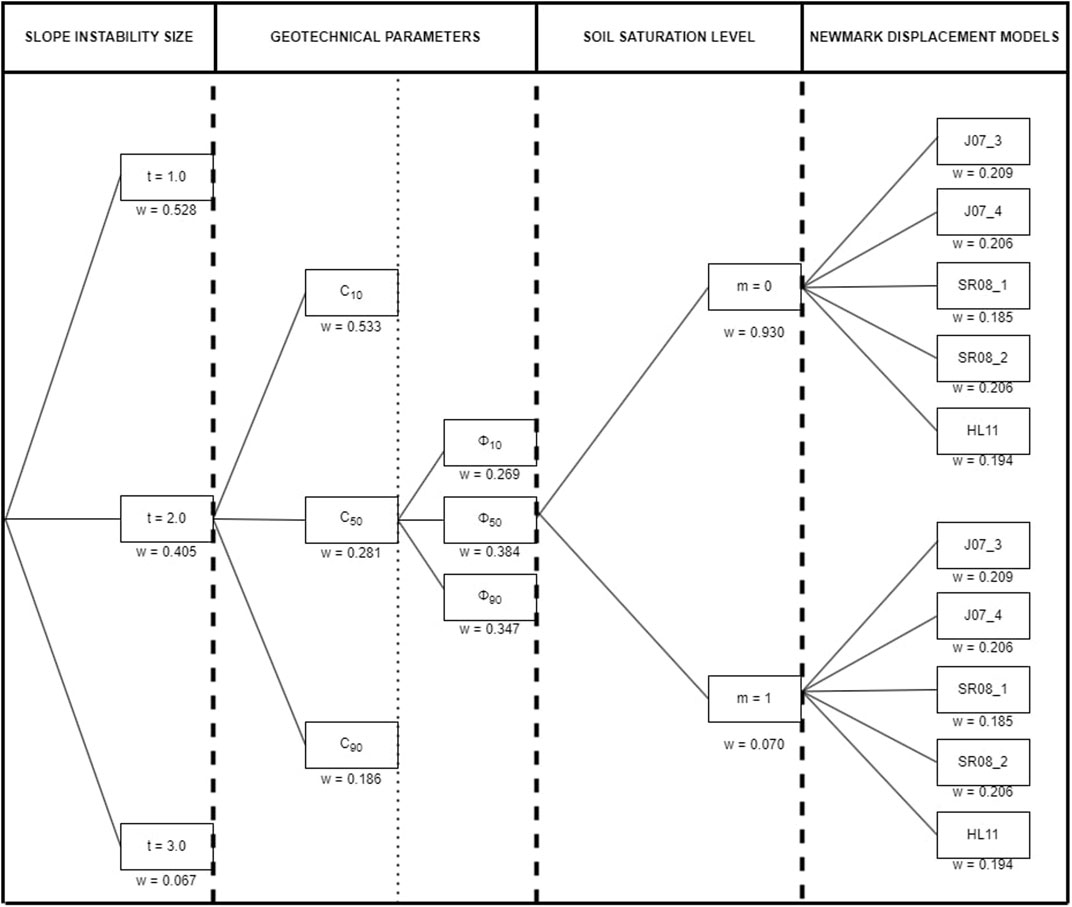
FIGURE 4. Logic tree used in the analysis for moderate to high magnitudes. The used weight (w) is below the branch: t, depth of the failure surface (m); m, soil saturation level; c, cohesion; and Φ, friction angle for the 10th, 50th, and 90th percentiles; see Table 3 for empirical relationships for computing Newmark displacements.
The second branch of the logic tree (Figure 4) corresponds to the geotechnical data of each lithological unit (Table 2). This branch is double because it includes both friction angle (one branch) and cohesion of materials (a second branch). Materials present in the study zone were grouped based on their nature and similarity of geotechnical properties. The defined groups were: a) poorly cemented conglomerates and alluvial sediments, b) marls, c) sandstones, and d) metamorphic and carbonate rocks. To include the variability of the shear strength parameters in the logic-tree procedure, Wang and Rathje (2015) used the estimation of three points of the normal distribution retaining the mean and standard deviation of the data distribution (Keefer and Bodily, 1983). In addition, these authors assumed different coefficient of variation values due to the lack of enough data for an adequate statistical analysis. In the present study, the required data to obtain the most likely values for each geotechnical parameter are available, taking the corresponding values at the 10th, 50th and 90th percentiles, which allow describing a normal distribution (Keefer and Bodily, 1983).
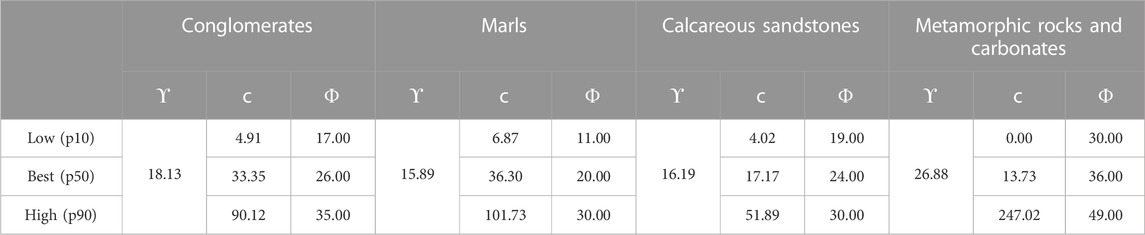
TABLE 2. Values of strength parameters for the considered lithological groups. ϒ: unit weight (kN/m3); c: cohesion (kPa); Φ: friction angle (°).
The third branch corresponds to the saturation state of materials when seismic event occurs. This parameter controls the stress acting along the failure plane, reducing the effective stress and the safety factor of slope when the soil column is completely saturated. In our study, we have considered two situations: dry materials (m = 0), representative of the state of shallow materials during warm periods with no rain, and complete saturation (m = 1), to account for days of rain that may saturate the shallow part of soil columns.
The fourth branch of the logic tree (Figure 4) corresponds to the empirical relationships used for computing the Newmark displacement (DN) from the critical acceleration of slopes (obtained in previous branches) and the seismic data of the considered scenario (peak ground acceleration, Arias intensity, etc.). For low magnitude seismic scenarios, specific empirical equations have been proposed, such as those developed by Delgado et al. (2020). This equation was obtained from events occurred in the Betic Cordillera, having magnitudes (Mw 3.5–5.5) in the range of the events here analyzed. For other scenarios considered in this work, the common equations for moderate to high magnitudes are used (Table 3). Specifically, we focused only on relationships involving horizontal peak ground acceleration and horizontal Arias Intensity as independent factors. The inclusion of different Newmark displacement regression equations is an effort to cover the widest variety of Newmark displacements.
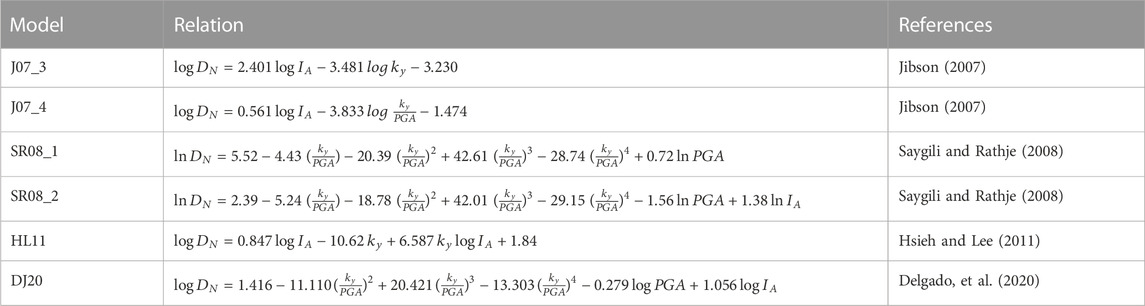
TABLE 3. Newmark displacement models used in this study. Newmark displacement (DN) is in cm, PGA and ky are in g units, AI (IA) is in m/s, and M is the moment magnitude.
The study zone is divided into pixels of 5 x 5 m in size. For each pixel, the computation of Newmark displacement is done according to the following sequence: static safety factor of slope is computed from slope steepness, depth to failure surface (branch 1) and geotechnical properties of materials existing in the pixel (friction angle–branch 2, and cohesion–branch 3), and considering that plane failure in an infinite slope occurs, as proposed by Jibson et al. (2000). After that, critical acceleration of slope is computed from safety factor following the relation proposed by these authors. The resulting value of critical acceleration is then used together with the ground motion expected in the seismic scenarios (Arias intensity or peak ground acceleration, branch 4 of logic tree) to compute the final Newmark displacement.
The weights applied to each branch (Figure 4) are based in the results obtained by Rodríguez-Peces et al. (2020) about landslides triggered by the 2011, Mw 5.1, Lorca earthquake, whose validity was verified with the data obtained from the Ossa de Montiel earthquake (Delgado et al., 2015). Regarding the weights applied to the saturation state branch, they were obtained from climatic data from the Spanish Meteorological Agency (AEMET, 2023), using the criterion of the average annual number of days with precipitation greater than 10 mm as the limit between both states. According to this agency, the whole study zone falls within the range 10–25 days (per year) of rain during the period 1981–2010. Considering the upper value in the bin, 25 days, this means that there are 340 days with insufficient rain (or simply no rain) to saturate soil column (93% of days in a year), and only 7% of days rain may saturate the shallow soil column. Consequently, these are the weights applied to this branch (0.93 and 0.07, respectively).
To obtain the seismically-induced landslide susceptibility maps in terms of Newmark displacement considering the different branches and weights of the logic tree, an automatic code was developed written in Python and using a geographic information system (ArcGIS 10.3).
The susceptibility of slopes to seismically-induced landslides is based in the final Newmark displacement computed. Sites are classified as no susceptible (DN < 1 cm), low (1–5 cm), moderate (5–15 cm) and highly susceptible (>15 cm) according to criteria set by Jibson and Michael (2009). In the analysis, a buffer of 50 m around each road was considered, and the Newmark displacement computed for each pixel within this distance was classified according to the previously described criteria. This distance was chosen because it is greater than run-up observed during instabilities triggered by 2021 events (Figure 3), a set of low magnitude events, or during the 2011 Lorca earthquake (Alfaro et al., 2012).
The deterministic study carried out, i.e., the considered seismic scenarios, aims to evaluate the susceptibility of the terrain and the vulnerability of the road infrastructure in the Granada Basin area. This is developed based on the largest magnitude events recorded during the 2021 Santa Fe seismic series (Lozano et al., 2022). Acceleration data recorded by the Strong Motion Network managed by the Spanish Instituto Geográfico Nacional, as previously quoted, were used. Through the interpolation of these data, maps of peak horizontal ground acceleration and horizontal Arias Intensity were obtained, which were used in the logic tree scheme. The maximum acceleration value was recorded during the January 28th event, with a value of 0.15 g, followed by 0.14 g on January 26th and 0.13 g on January 23rd. The horizontal Arias Intensity values ranged from 0.02 m/s (events of January 26th and 28th) to 0.01 m/s (January 23rd event).
Any probabilistic seismically-induced landslide susceptibility computation needs a previous seismic hazard analysis. Then, to develop our study, a joint and unified seismic hazard computation in terms of both peak horizontal ground acceleration and horizontal Arias Intensity values has been conducted in the region.
A decade ago, a comprehensive seismic hazard analysis focused to an update of the Spanish building code was appraised (CNIG, 2013). In this analysis, new seismicity models combined in a logic tree frame were developed and used, providing PGA values, among other outputs, for different return periods. Previously, Peláez et al. (2005) computed probabilistic AI values in this region using the spatially smoothed seismicity approach. Given that these two results, PGA and AI values, cannot be considered homogeneous because they used different databases, seismicity models and soil characteristics, they are not valid for our analysis. In addition, for the current study, specific values determined for each computation point are needed. For our goal, all data and models developed and used in the previous assessment (CNIG, 2013), the most recent ones developed in our study region, have been considered anyway. As in this previous assessment, the database of active Quaternary faults (García Mayordomo et al., 2012) has not been included either because the available information on these faults is not detailed and reliable enough to include it in a hazard analysis like this one.
The code CRISIS 2015 (Ordaz et al., 2015) has been used in the current assessment, a verified software (Aguilar et al., 2017) widely used. The computation area is that limited by the coordinates 4.5°W - 3.0°W and 36.5°N - 38.0°N, and the assessment was also conducted using a logic tree scheme (Figure 5). We have used two seismicity models considered in the CNIG (2013) analysis, called GM12 and ByA12, with the same weight. The GB12 model includes both shallow (h < 30 km), and intermediate and deep seismicity sources in the Alboran Sea and Gulf of Cádiz - Atlantic regions. On the contrary of ByA12 model only includes shallow sources (CNIG, 2013). All sources, regardless its depth, were included in our assessment. An updated seismic catalog was compiled and processed to obtain the seismicity parameters for the defined sources. This catalog was obtained from an update of the Spanish Instituto Geográfico Nacional catalog (IGN, 2023b), a review of the seismicity from data coming from other institutions and specific studies, a catalog unification to the moment magnitude, and a final declustering.
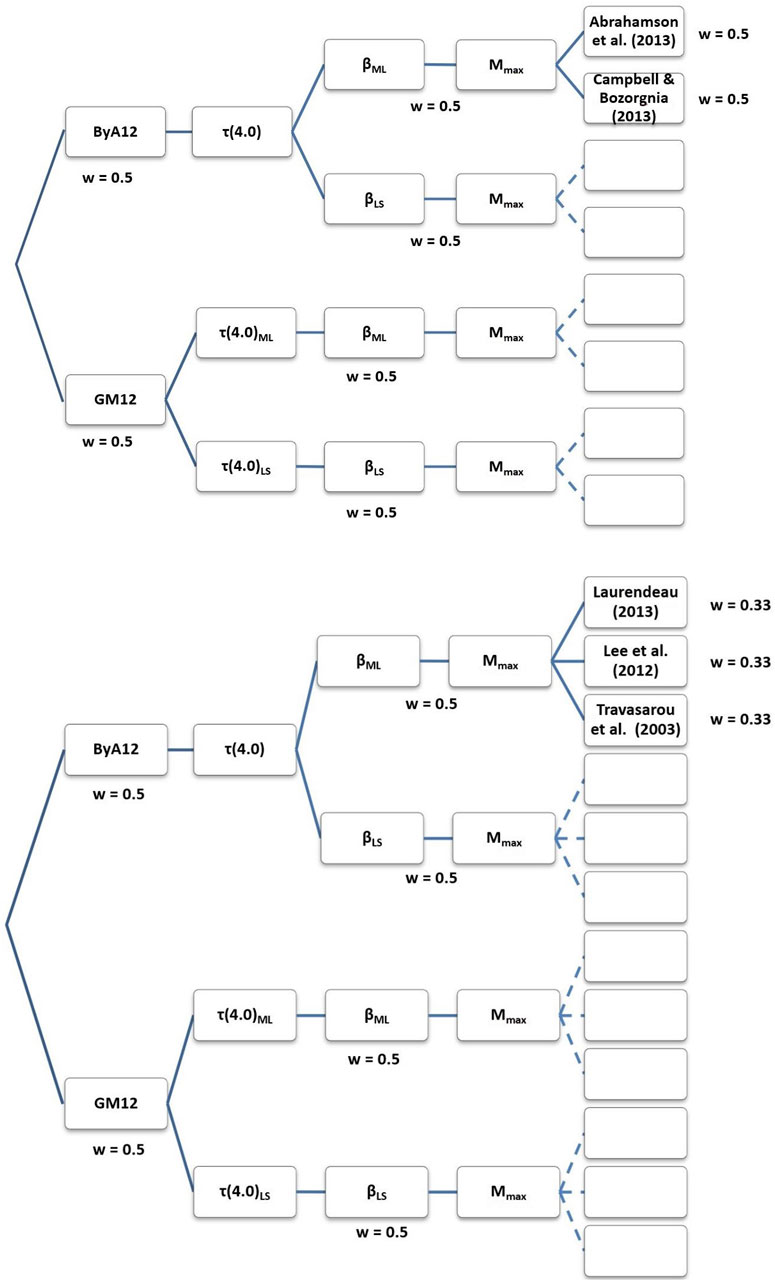
FIGURE 5. Logic tree schemes used for the assessment of the probabilistic PGA values (up) and AI values (down). Both models include two different seismicity models, seismicity parameters computed from two alternative methods, and different ground motion prediction equations.
For the GM12 model, given the big size of the defined sources, it was possible individually to compute the exceedance rate of magnitude Mw 4.0, τ(4.0), being this magnitude value the threshold magnitude in the assessment, the β value of the Gutenberg-Richter recurrence relationship (Gutenberg and Richter, 1944) and its uncertainty value σβ, and the mean value of the maximum magnitude MMmean and its uncertainty σMM, computed from both seismicity and fault data. τ(4.0), β and σβ values were obtained using two different methodologies, the least square and the maximum likelihood approaches (Aki, 1965), being included both sets of values in our logic tree scheme with the same weight (Figure 5).
For the ByA12 source model, with a lesser size of the sources, and therefore fewer earthquakes at each source, only τ(4.0) and MMmean and its uncertainty value σMM have been computed specifically for each source (CNIG, 2013). β and its uncertainty value σβ were computed for tectonic regions embracing different sources. These parameters have been also computed using the least square and the maximum likelihood methods, and both sets of results have been included in our logic tree scheme with the same weight (Figure 5).
A remaining significant question is the ground motion prediction equation (GMPE) considered in the seismic hazard assessment. Concerning the assessment in terms of PGA, the GMPE models by Abrahamson et al. (2013) and Campbell and Bozorgnia (2013) have been considered in this computation. The model by Abrahamson et al. (2013) is an update of the previous model by Abrahamson and Silva (2007). They were based on the acceleration database PEER NGA-West2 (Ancheta et al., 2013), and can be used for a magnitude range Mw 4.0–8.5, and for distances up to 300 km. Both models consider the faulting mechanism and the soil conditions via VS30 values. These two models have been included in the logic tree with the same weight (Figure 5) when computing hazard in terms of PGA.
Concerning the assessment in terms of AI, the selection process of the GMPEs is not straightforward. The smaller number of these models makes it difficult to find compatible models to be used in a logic tree scheme. In our assessment, the models by Travasarou et al. (2003), Lee et al. (2012) and Laurendeau (2013), the latter developed in Causse et al. (2014), have been considered, all of them with the same weight (Figure 5) when computing hazard in terms of AI. The three considered models used different acceleration databases. These models consider the type of soil, but in a different way, and the one of Laurendeau (2013), does not consider the faulting mechanism. None of these models are included in the CRISIS 2015 code as built-in models, then it was necessary to include them as attenuation tables developed and furnished by the user (Ordaz et al., 2015).
As quoted above, the CRISIS 2015 code was used to compute the seismic hazard results. Results were obtained using a grid of 0.05°, that is, about 5 km. Concerning seismic sources, 5 km was the considered depth for the shallow sources of the ByA12 model, and 0 km for the shallow sources and 30 km for the intermediate sources of the GM12 model. In all cases, the Wells and Coppersmith (1994) model among the rupture surface and the magnitude has been considered. Concerning GMPEs parameters, a conventional VS30 value equal to 760 m/s (B/C NEHRP boundary soil; BSSC, 2003) and an unspecific rupture type have been selected in all cases. Finally, results have been computed for a return period of 475 years, i.e., for a 10% probability of exceedance within 50 years.
When comparing the obtained results with previous results in the same area (Peláez et al., 2005; CNIG, 2013), a great agreement is observed, both in shape and value. For PGA results, maximum values of 0.28–0.30 g are obtained in our assessment (Figure 6), while values of 0.24–0.25 g are obtained in CNIG (2013) for the same return period but computed for ‘rock site’ conditions. In the current Spanish seismic building code (NCSE-02, 2002), maximum values of 0.25 g are considered in the same region for a return period of 500 years, also for rock site conditions. Concerning AI results, maximum values of 0.36–0.38 m/s are obtained in our assessment (Figure 6). Previously, only the work by Peláez et al. (2005) computed the hazard in terms of this parameter, obtaining maximum values equal to 0.38 m/s for shallow soils and 0.30 m/s for deep soils, for the same return period.
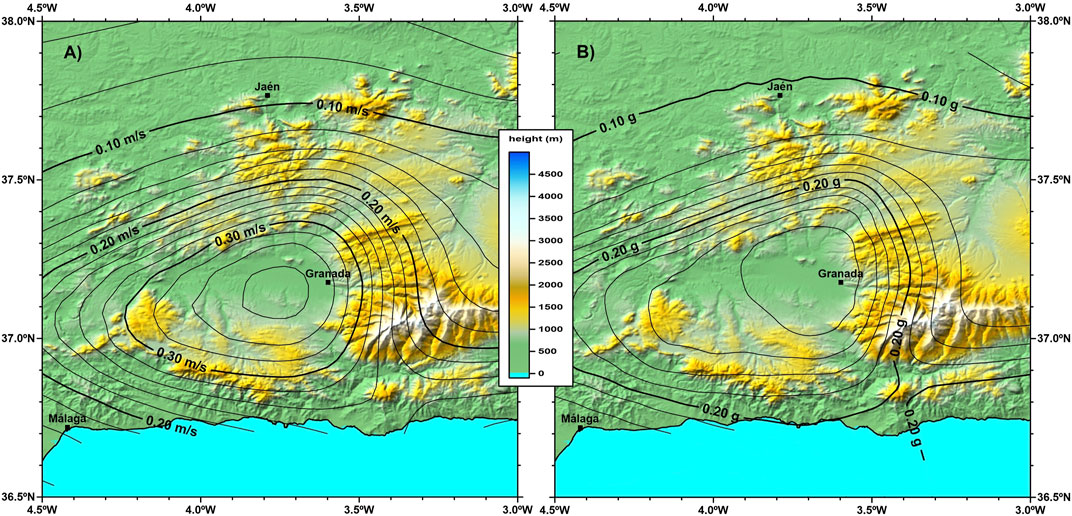
FIGURE 6. Results of the seismic hazard analysis in term of (A) Arias Intensity and (B) peak ground acceleration for the Granada Basin. Return period of 475 years and a VS30 value equal to 760 m/s.
A first part of our study was to verify the ability of the methodology used to predict the occurrence of landslides induced by the events of the considered seismic series of 2021. Given that instabilities were of small size, values of some variables in the logic tree were fixed and differ to those used in the probabilistic scenario. Concretely, Newmark displacements were computed through the empirical relation proposed by Delgado et al. (2020), appropriate for low magnitude events, depth to failure surface was set to 1 m because all instabilities triggered by the studied events had small size and no one had size above 1 m in thickness, and all materials are considered in saturated state. This is because it was raining since 19 January, about a week before the first event considered and 2 weeks for the remaining ones. Cumulative rain was 19.4 mm, 21.9 mm and 35 mm for the events of 23, 26 and 28 January, respectively.
The results of the deterministic approach show that expected Newmark displacements for these earthquakes were low, in agreement with the low peak values of ground motion measured during them. In the worst scenario, the 28 January event, maximum displacements hardly exceed 2 cm (Figure 7). Such values would explain the low number of instabilities triggered by these events. Focusing in the areas around the instabilities triggered by the seismic series (Figures 7, 8), displacements are very low during the 23 January (<1 cm), and a bit larger during the other two events (more than 40% of sites had Newmark displacements in the 1–2 cm range), with similar values for both events. These results seem to point out that instabilities were more likely triggered by one of these two last events. Although these values are low, instabilities are known to occur for such values during low magnitude events (Rodríguez-Peces et al., 2013; 2020). Occurrence of these instabilities is also more probable if we consider the cumulative effect of the seismic series: initial events weaken the slopes, reducing their shear strength until failures occur after another earthquake, even of low magnitude (Delgado et al., 2011b).
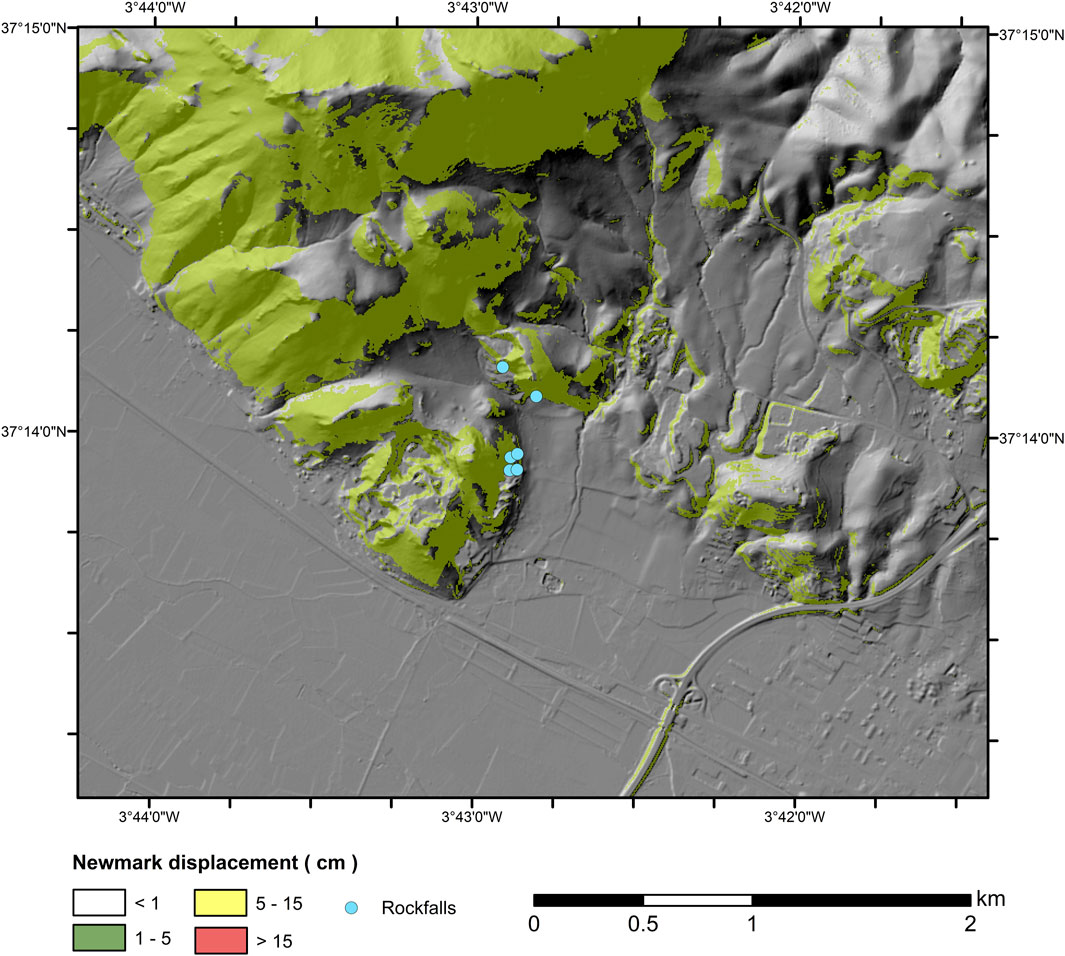
FIGURE 7. Maps showing Newmark displacements computed for the January 28th event in the area where rockfalls occurred.
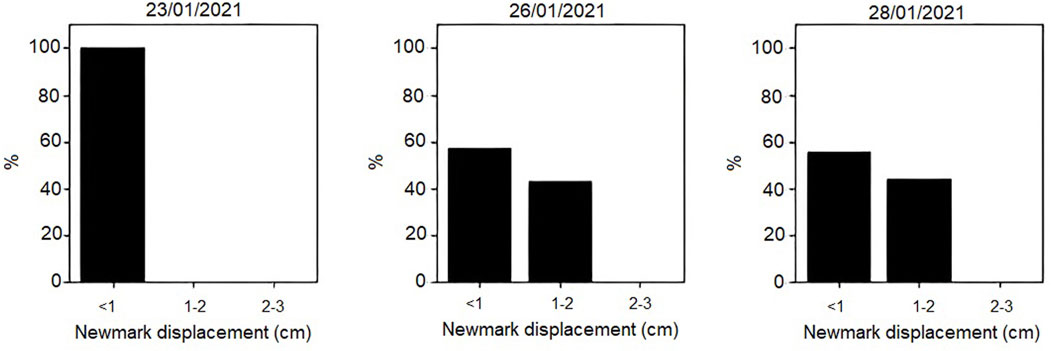
FIGURE 8. Histograms of Newmark displacement values obtained for scenarios of the January 2021 seismic series at sites where rockfalls occurred.
In the case of the probabilistic scenario, a total of 270 maps were computed, resulting from 3 values of depth to failure surface, 3 values of cohesion, 3 values of friction angle, 2 values for the degree of saturation of soil column and 5 empirical relations for computing Newmark displacements. Table 3 presents relationships between variables, specifically focusing on moderate-high magnitude events. It is important to note that the relation proposed by Delgado et al. (2020) is not considered for probabilistic scenario because it is only applicable to low to moderate magnitudes. Figure 9 shows the weighted final map obtained. Because the ground motion values are more severe (Figure 6), displacements computed are also high in some areas of the study zone, and Newmark displacements greater than 15 cm are found in areas with high slopes and the presence of both soft and hard materials. Examples of the results obtained in some sections of the A-92 highway and road A-338 are presented in Figure 10. Multiple slopes around these roads are characterized by high displacement values (high susceptibility to suffer seismic-induced instabilities).
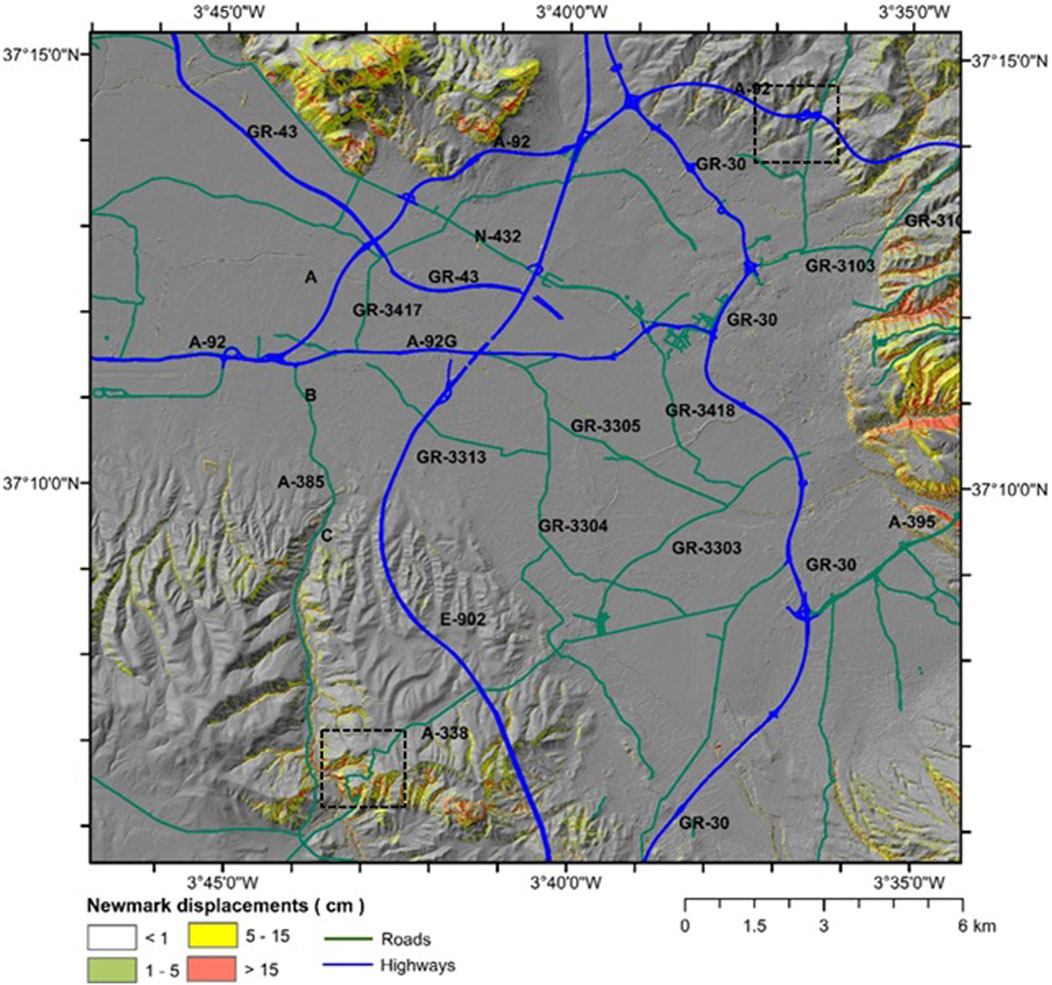
FIGURE 9. Final map of Newmark displacements obtained with the logical tree methodology for Granada basin (probabilistic scenario for a return period of 475 years). Dotted boxes show the location of the areas shown in Figure 10 (north box corresponds to section of A92and south box to section of A-338).
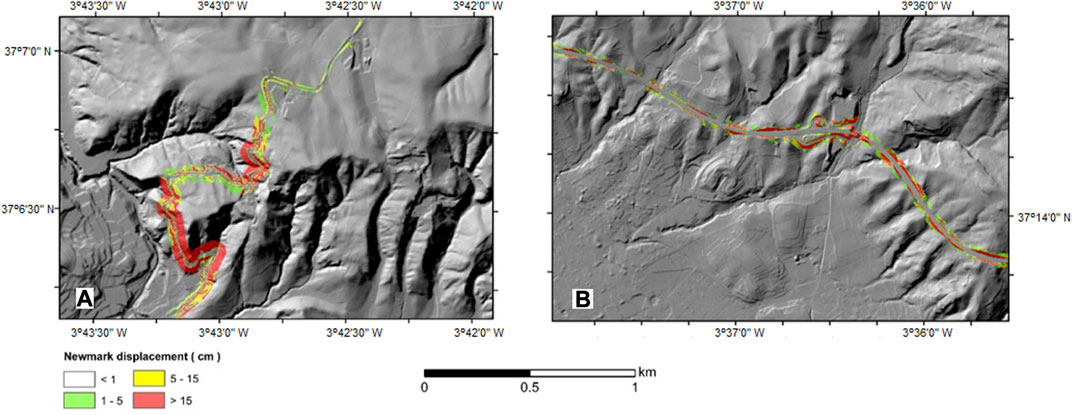
FIGURE 10. Newmark displacements obtained with the logical tree methodology, probabilistic scenario for a return period of 475 years, for two sections of roads: (A) A-338 road (kilometric points 8–11); (B) A-92 highway (kilometric points 240–244). See location in Figure 9.
The susceptibility analysis in the Granada basin reveals that the majority of the basin’s surface, approximately 96.85%, exhibits a null susceptibility, indicating low Newmark displacements (Table 4). This zone is in the central part of the basin, characterized by very low to negligible slopes, and the presence of poorly cemented conglomerates and alluvial sediments. However, it is identified that 1.42% of the surface has a low susceptibility level, while 1.04% shows a moderate susceptibility, and 0.69% indicates high susceptibility to disrupted landslides (Table 4). It is important to note that the category encompassing moderate and high susceptibility levels accounts for 1.73% of the surface, which is higher than the low susceptibility level. Areas with moderate and high susceptibility levels tend to be in steep slope areas and a combination of hard and soft materials, as observed in the eastern zone of the basin with the presence of poorly cemented conglomerates and alluvial sediments.
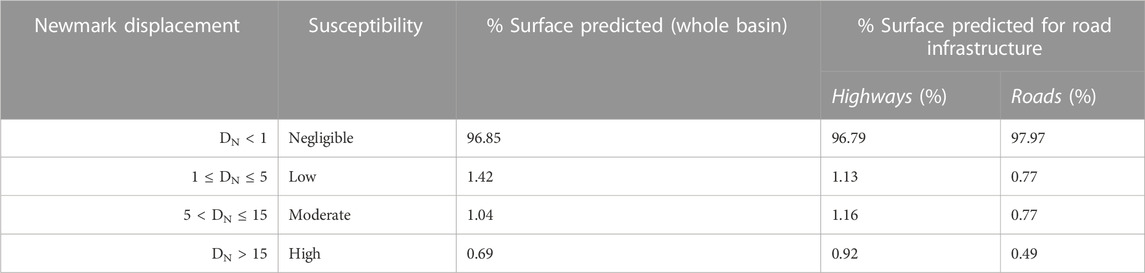
TABLE 4. Newmark displacement values according to the final weighted probabilistic map for both the Granada basin and the infrastructure buffer (50 m).
Regarding the road infrastructure in the Granada basin, it has been determined that many highways and roads pass through low-slope areas, which explains why, on average, 97.38% of the analyzed infrastructure’s alignment (corresponding to a 50 m buffer around it) has a null susceptibility level (Table 4, second and third columns). When comparing the predicted susceptibility levels for each type of infrastructure, it is observed that the different susceptibility intervals are, on average, 62% higher for highways compared to roads. By analyzing the predicted susceptibility in roads (Figure 10), moderate and high susceptibility levels tend to cluster more compared to highways (Figure 10), where they are more scattered. This can be explained by the more winding alignment of roads compared to highways. However, it is forecasted that 1.67% of the road infrastructure’s alignment exhibits moderate to high susceptibility levels, with the A-92 highway being the infrastructure with most slopes in the higher categories of susceptibility, with 1.25% of its entire alignment affected by moderate to high vulnerability Newmark displacements. The A-338 road also shows moderate to high vulnerability, affecting approximately 0.65% of its entire alignment.
Rodríguez-Peces et al. (2014) studied the performance of slopes in the western sector of Sierra Nevada Range. That zone corresponds to the eastern limit of the area here studied. They computed Newmark displacements for the case of occurring an Mw 6.6 event in the western limit of the Sierra Nevada Range. They concluded that rock falls and slides were the most probable slope instabilities caused by this scenario. These instabilities were likely triggered by Newmark displacements of 2 cm or less. These findings are in agreement with results presented in this study. In addition, their results show a similar distribution to those obtained in this study, since the highest Newmark displacement values occur in equivalent mountainous zones (particularly related to the incision of rivers), given the control that the relief has on the stability of terrain (lower safety factor and critical acceleration).
In this study, a logic tree scheme has been used to evaluate the susceptibility of slopes in the Granada basin to shallow seismic-induced landslides. The study accounted for variability in the geotechnical properties of the materials, degree of saturation of soil column and depth to failure surface. Additionally, several empirical relations for estimating the Newmark displacement were implemented in the scheme to account for uncertainties in the computation of this key result of the analysis.
This methodology was first applied to verify its capabilities to evaluate a real case study, the seismic series of January 2021, that affected the study zone. The results obtained show that only two events were able to induce the instabilities known during this series. At the same time, these results confirm the capabilities of the methodology to obtain valuable results, useful for estimating complex scenarios. In this case, maximum expected horizontal acceleration and Arias Intensity for a 475 years return period were considered.
The study has revealed that most of the surface area in the basin exhibits negligible susceptibility (Newmark displacements <1 cm). Consequently, most of road network in the basin largely traverses low-slope areas and shows no susceptibility. However, areas with low, moderate, and high susceptibility have been identified, primarily in steep slopes and a combination of hard and soft materials. It is important to point out that A-92 highway and A-338 road are roads with more slopes susceptible to suffer seismic-induced landslides, with significant portions of their alignments affected by moderate (5–15 cm) to high (>15 cm) Newmark displacements. These findings highlight the importance of taking preventive and mitigation measures in the southern and western sections of the Granada basin, where the roads would be most affected. However, it is observed that in densely populated areas such as the metropolitan area of Granada, the effects of earthquake-induced landslides would be less severe in comparison. The information provided by this study is valuable for resilient infrastructure planning and risk management strategies in the Granada basin.
The results presented show that the combined use of logic tree and rigid block methods allow the study of different scenarios: deterministic and probabilistic. The use of probabilistic scenarios could be used for designing new lineal infrastructures and for planning preventive measures in road networks. Besides, the proposed methodology could be used for co-seismic landslide studies in other areas where the required information is available. In this regard, it will be applied to other active zones where seismicity is characterized by moderate to low magnitude earthquakes.
The raw data supporting the conclusions of this article will be made available by the authors, without undue reservation.
Conceptualization, JR-H, MR-P and JD; Data curation, JD, JR-H, JG and JP; Formal analysis, JR-H and MR-P; Funding acquisition, JD, MR-P; Methodology, JD, JR-H, MR-P and JP; Writing original draft, JR-H; Writing review and editing, JR-H, JP, MR-P, JG and JD. All authors contributed to the article and approved the submitted version.
This research was partially supported by research projects PID 2021-124155NB-C31 and PID 2022-136678NB-I00 AEI/FEDER from the Spanish Investigation Agency and research group “Planetary Geodynamics, Active Tectonics and Related Hazards”, UCM-910368 of the Complutense University of Madrid. This work has been partially funded by the Institut Cartogràfic Valencia, by the Agency Valencian Security and Response to Emergencies (Generalitat Valenciana) and by the Provincial Consortium of Alicante Firefighters. This work has also been funded by the group of research VIGROB20-184 (University of Alicante).
The Spanish Instituto Geográfico Nacional (IGN) shared the strong ground motion data used in this study. Special thanks to J.M. Alcalde (IGN Madrid), who kindly explained all doubts about these data.
The authors declare that the research was conducted in the absence of any commercial or financial relationships that could be construed as a potential conflict of interest.
All claims expressed in this article are solely those of the authors and do not necessarily represent those of their affiliated organizations, or those of the publisher, the editors and the reviewers. Any product that may be evaluated in this article, or claim that may be made by its manufacturer, is not guaranteed or endorsed by the publisher.
Abrahamson, N. A., Silva, W. J., and Kamai, R. (2013). Update of the AS08 ground-motion prediction equations based on the NGA-West2 dataset. Pacific Earthquake Engineering Research Center report 2013/04.
Abrahamson, N. A., and Silva, W. J. (2007). NGA ground motion relations for the geometric mean horizontal component of peak and spectral ground motion parameters. Pacific Earthquake Engineering Research Center report 2007.
AEMET (2023). Open data. Available at: https://opendata.aemet.es/opendata/sh/18c39920 (Accessed April 01, 2023).
Aguilar, A., Ordaz, M., de la Puente, J., González, S. N., Rodríguez, H. E., Córdova, A., et al. (2017). Development and validation of software CRISIS to perform probabilistic seismic hazard assessment with emphasis on the recent CRISIS2015. Comput. Sist. 21, 67–90. doi:10.13053/cvs-21-1-2578
Aki, K. (1965). Maximum likelihood estimate of b in the formula log N = a - bM and its confidence limits, 43. Bulletin of Earthquake Research Institute of the University of Tokyo, 237–239.
Alfaro, P., Delgado, J., García-Tortosa, F. J., Lenti, L., López, J. A., López-Casado, C., et al. (2012). Widespread landslides induced by the Mw 5.1 earthquake of 11 may 2011 in Lorca. SE Spain. Eng. Geol. 137-138, 40–52. doi:10.1016/j.enggeo.2012.04.002
Allstadt, K. E., Jibson, R. W., Thompson, E. M., Massey, C. I., Wald, D. J., Godt, J. W., et al. (2018). Improving near-real-time coseismic landslide models: lssons learned from the 2016 Kaikoura, New Zealand, earthquake. Bull. Seism. Soc. Am. 108, 1649–1664. doi:10.1785/0120170297
Ancheta, T. D., Darragh, R. B., Stewart, J. P., Seyhan, E., Silva, W. J., Chiou, B. S. J., et al. (2013). PEER NGA-west2 database. Pacific earthquake engineering research center report 2013/03.
Bagheri, V., Uromeihy, A., and Aghda, S. M. F. (2018). Evaluation of ANFIS and LR models for seismic rockfalls’ susceptibility mapping: a case study of firooz abad-kojour, Iran, earthquake (2004). Environ. Earth Sc. 77, 800. doi:10.1007/s12665-018-7983-4
Bird, J. F., and Bommer, J. J. (2004). Earthquake losses due to ground failure. Eng. Geol. 75, 147–179. doi:10.1016/j.enggeo.2004.05.006
Bommer, J. J., and Scherbaum, F. (2008). The use and misuse of logic trees in probabilistic seismic hazard analysis. Earthq. Spectra 24, 997–1009. doi:10.1193/1.2977755
Braga, J. C., Martin, J. M., and Alcala, B. (1990). Coral reefs in coarse-terrigenous sedimentary environments (Upper Tortonian, Granada Basin, southern Spain). Sediment. Geol. 66, 135–150. doi:10.1016/0037-0738(90)90011-h
BSSC (2003). NEHRP recommended provisions for seismic regulations for new buildings and other structures, Part1: provisions. FEMA 368. Washington, D.C: Federal Emergency Management Agency.
Caccavale, M., Matano, F., and Sacchi, M. (2017). An integrated approach to earthquake-induced landslide hazard zoning based on probabilistic seismic scenario for Phlegrean Islands (Ischia, Procida and Vivara), Italy. Italy. Geomorphol. 295, 235–259. doi:10.1016/j.geomorph.2017.07.010
Campbell, K. W., and Bozorgnia, Y. (2013). NGA-West2 Campbell-Bozorgnia ground motion model for the horizontal components of PGA, PGV, and 5%-damped elastic pseudo-acceleration response spectra for periods ranging from 0.01 to 10 sec. Pacific Earthquake Engineering Research Center report 2013/06.
Causse, M., Laurendeau, A., Perrault, M., Douglas, J., Bonilla, L. F., and Guéguen, P. (2014). Eurocode 8-compatible synthetic time-series as input to dynamic analysis. Bull. Earthq. Eng. 12, 755–768. doi:10.1007/s10518-013-9544-2
Chousianitis, K., Del Gaudio, V., Sabatakakis, N., Kavoura, K., Drakatos, G., Bathrellos, G. D., et al. (2016). Assessment of earthquake-induced landslide hazard in Greece: from arias intensity to spatial distribution of slope resistance demand. Bull. Seismol. Soc. Am. 106, 174–188. doi:10.1785/0120150172
Chowdhuri, I., Pal, S. Ch., Janizadeh, S., Saha, A., Ahmadi, K., Chakrabortty, R., et al. (2022). Application of novel deep boosting framework-based earthquake induced landslide hazards prediction approach in Sikkim Himalaya. Geocarto Int. 37 (26), 12509–12535. doi:10.1080/10106049.2022.2068675
CNIG (2013). Actualización de mapas de peligrosidad sísmica de España 2012. Madrid: Centro Nacional de Información Geográfica. Available at: https://www.ign.es/web/libros-digitales/peligrosidad-sismica2012.
Daniell, J. E., Schaefer, A. M., and Wenzel, F. (2017). Losses associated with secondary effects in earthquakes. Front. Built. Environ. 3, 30. doi:10.3389/fbuil.2017.00030
Del Gaudio, V., Pierri, P., and Wasowski, J. (2003). An approach to time-probabilistic evaluation of seismically induced landslide hazard. Bull. Seism. Soc. Am. 93, 557–569. doi:10.1785/0120020016
Delgado, J., García-Tortosa, F. J., Garrido, J., Loffredo, A., López-Casado, C., Martín-Rojas, I., et al. (2015). Seismically-induced landslides by a low-magnitude earthquake: the Mw4.7 Ossa de Montiel event (central Spain). Eng. Geol. 196, 280–285. doi:10.1016/j.enggeo.2015.07.016
Delgado, J., Garrido, J., López-Casado, C., Martino, S., and Peláez, J. A. (2011b). On far field occurrence of seismically induced landslides. Eng. Geol. 123, 204–213. doi:10.1016/j.enggeo.2011.08.002
Delgado, J., Peláez, J. A., Tomás, R., García-Tortosa, F. J., Alfaro, P., and López Casado, C. (2011a). Seismically-induced landslides in the betic Cordillera (S Spain). Soil Dyn. Earthq. Eng. 31, 1203–1211. doi:10.1016/j.soildyn.2011.04.008
Delgado, J., Rosa, J., Peláez, J. A., Rodríguez-Peces, M. J., Garrido, J., and Tsige, M. (2020). On the applicability of available regression models for estimating Newmark displacements for low to moderate magnitude earthquakes. The case of the Betic Cordillera (S Spain). Eng. Geol. 274, 105710. doi:10.1016/j.enggeo.2020.105710
Dreyfus, D., Rathje, E. M., and Jibson, R. W. (2013). The influence of different simplified sliding block models and input parameters on regional predictions of seismic landslides triggered by the Northridge earthquake. Eng. Geol. 163, 41–54. doi:10.1016/j.enggeo.2013.05.015
Fernández, J., Viseras, C., and Soria, J. (1996). The stratigraphic record of crustal kinematics. Cambridge: Cambridge University Press.Tertiary basins of Spain
García Mayordomo, J., Insua Arévalo, J. M., Martínez Díaz, J. J., Jiménez Díaz, A., Martín Banda, R., Martín Alfageme, S., et al. (2012). The quaternary active faults database of iberia (QAFI v.2.0). J. Iber. Geol. 38, 285–302. doi:10.5209/rev_JIGE.2012.v38.n1.39219
Gutenberg, B., and Richter, C. F. (1944). Frequency of earthquakes in California. Bull. Seism. Soc. Am. 34, 185–188. doi:10.1785/bssa0340040185
Hsieh, S. Y., and Lee, C. T. (2011). Empirical estimation of the Newmark displacement from the Arias intensity and critical acceleration. Eng. Geol. 122, 34–42. doi:10.1016/j.enggeo.2010.12.006
IGN (2023b). Open data: catálogo de terremotos. Available at: https://www.ign.es/web/ign/portal/sis-catalogo-terremotos (Accessed April 1, 2023).
IGN (2023a). Open data: modelo digital del terreno. Available at: http://centrodedescargas.cnig.es/CentroDescargas/index.jsp (Accessed April 1, 2023).
Jafarian, Y., Lashgari, A., and Haddad, A. (2019). Predictive model and probabilistic assessment of sliding displacement for regional scale seismic landslide hazard estimation in Iran. Bull. Seism. Soc. Am. 109, 1581–1593. doi:10.1785/0120190004
Jibson, R. W., Harp, E. L., and Michael, J. A. (2000). A method for producing digital probabilistic seismic landslide hazard maps. Eng. Geol. 58, 271–289. doi:10.1016/s0013-7952(00)00039-9
Jibson, R. W., and Michael, J. A. (2009). Data from: maps showing seismic landslide hazards in Anchorage. Alaska. U.S. Geol. Surv. Sci. Investig. Map 3077. doi:10.3133/sim3077
Jibson, R. W. (1993). Predicting earthquake-induce landslide displacements using Newmark's sliding analysis. Transp. Res. Rec. 1411, 9–17.
Jibson, R. W. (2007). Regression models for estimating coseismic landslide displacement. Eng. Geol. 91, 209–218. doi:10.1016/j.enggeo.2007.01.013
Keefer, D. K. (1984). Landslides caused by earthquakes. Geol. Soc. Am. Bull. 95, 406–421. doi:10.1130/0016-7606(1984)95<406:lcbe>2.0.co;2
Keefer, D. K., and Wilson, R. C. (1989). “Predicting earthquake-induced landslides, with emphasison arid and semi-arid environments,” in Landslides in a semi-arid environment. Editors P. M. Sadler, and D. M. Morton (England Geological Society), 2, 118–149.
Keefer, D. L., and Bodily, S. E. (1983). Three-point approximations for continuous random variables. Manag. Sci. 29, 595–609. doi:10.1287/mnsc.29.5.595
Kritikos, T., Robinson, T. R., and Davies, T. R. H. (2015). Regional coseismic landslide hazard assessment without historical landslide inventories: a new approach. J. Geophys. Res. Earth Surf. 120 (4), 711–729. doi:10.1002/2014JF003224
Kulkarni, R. B., Youngs, R. R., and Coppersmith, K. J. (1984)., I. San Francisco: California, 263–270.Assessment of confidence intervals for results of seismic hazard analysisProc. VIII World Conf. Earthq. Eng.
Laurendeau, A. (2013). Définition du movement sismique ‘au rocher’. France: Université de Grenoble. [master's thesis].
Lee, C. T., Hsieh, B. S., Sung, C. H., and Lin, P. S. (2012). Regional arias intensity attenuation relationship for taiwan considering VS30. Bull. Seism. Soc. Am. 102, 129–142. doi:10.1785/0120100268
Lee, C. T., Huang, Ch.Ch., Lee, J. F., Pan, K. L., Lin, M. L., and Dong, J. J. (2008). Statistical approach to earthquake induced landslide susceptibility. Eng. Geol. 100, 43–58. doi:10.1016/j.enggeo.2008.03.004
Lozano, L., Cantavella, J. V., Gaite, B., Ruiz-Barajas, S., Antón, R., and Barco, J. (2022). Seismic analysis of the 2020–2021 Santa Fe seismic sequence in the Granada Basin, Spain: relocations and focal mechanisms. Seism. Res. Lett. 93, 3246–3265. doi:10.1785/0220220097
Lupiani Moreno, E., and Soria Mingorance, J. (1985). Mapa MAGNA 50 – hoja 1009 (GRANADA). IGME. Available at: https://info.igme.es/cartografiadigital/datos/magna50/pdfs/d10_G50/Magna50_1009.pdf.
Luzi, L., Pergalani, F., and Terlien, M. T. J. (2000). Slope vulnerability to earthquakes at subregional scale, using probabilistic techniques and geographic information systems. Eng. Geol. 58, 313–336. doi:10.1016/s0013-7952(00)00041-7
Madarieta-Txurruka, A., Galindo Zaldívar, J., González Castillo, L., Peláez, J. A., Ruiz Armenteros, A. M., Henares, J., et al. (2021). High- and low-angle normal fault activity in a collisional orogen: the northeastern Granada Basin (Betic Cordillera). Tectonics 40, e2021TC006715. doi:10.1029/2021TC006715
Madarieta-Txurruka, A., González-Castillo, L., Peláez, J. A., Catalán, M., Henares, J., Gil, A. J., et al. (2022). The role of faults as barriers in confined seismic sequences: 2021 seismicity in the Granada Basin (betic Cordillera). Agu. Tect. 41, 9. doi:10.1029/2022TC007481
Marc, O., Meunier, P., and Hovius, N. (2017). Prediction of the area affected by earthquake-induced landsliding based on seismological parameters. Nat. Hazards Earth Syst. Sci. 17, 1159–1175. doi:10.5194/nhess-17-1159-2017
Martínez-Solares, J. M., and Mezcua, J. (2002). Catálogo sísmico de la península Ibérica (880 a.C.–1900), Monografia 18. Madrid: Instituto Geográfico Nacional.
Martino, S., Bozzano, F., Caporossi, P., D’Angiò, D., Della Seta, M., Esposito, C., et al. (2019). Impact of landslides on transportation routes during the 2016-2017 Central Italy seismic sequence. Landslides 16, 1221–1241. doi:10.1007/s10346-019-01162-2
McCrink, T. P. (2001). Mapping earthquake-induced landslide hazards in Santa Cruz County. Engineering geology practice in northern California. Calif. Geol. Surv. Bull. 210, 77–94.
Nath, R. R., Pareek, N., and Sharma, M. L. (2022). Implications and inclusion of size dependent scenario earthquakes on landslide hazard zonation: a case study of the Indian himalayas. Catena 212, 106027. doi:10.1016/j.catena.2022.106027
NCSE-02 (2002). Norma de construcción sismorresistente: parte general y edificación (NCSE-02). Madrid: Centro de Publicaciones Secretaría General Técnica. Ministerio de Fomento.
Newmark, N. M. (1965). Effects of earthquakes on dams and embankments. Géotechnique 15, 139–160. doi:10.1680/geot.1965.15.2.139
Niño, M., Jaimes, M. A., and Reinoso, E. (2014). Seismic-event-based methodology to obtain earthquake-induced translational landslide regional hazard maps. Nat. Hazards 73, 1697–1713. doi:10.1007/s11069-014-1163-y
Nowicki, M. A., Wald, D. J., Hamburger, M. W., Hearne, M., and Thompson, E. M. (2014). Development of a globally applicable model for near real-time prediction of seismically induced landslides. Eng. Geol. 173, 54–65. doi:10.1016/j.enggeo.2014.02.002
Ordaz, M., Martinelli, F., Aguilar, A., Arboleda, J., Meletti, C., and D’Amico, V. (2015). CRISIS2015. Program for computing seismic hazard.
Peláez, J. A., Delgado, J., and López Casado, C. (2005). A preliminary probabilistic seismic hazard assessment in terms of Arias intensity in southeastern Spain. Eng. Geol. 77, 139–151. doi:10.1016/j.enggeo.2004.09.002
Rathje, E. M., and Saygili, G. (2009). Probabilistic assessment of earthquake-induced sliding displacements of natural slopes. Bull. N. Z. Soc. Earthq. Eng. 42, 18–27. doi:10.5459/bnzsee.42.1.18-27
Robinson, T. R., Rosser, N. J., Davies, T. R. H., Wilson, T. M., and Orchiston, C. (2018). Near-real-time modeling of landslide impacts to inform rapid response: an example from the 2016 Kaikoura, New Zealand, Earthquake. Bull. Seism. Soc. Am. 108, 1665–1682. doi:10.1785/0120170234
Rodríguez-Peces, M. J., García-Mayordomo, J., Azañón, J. M., and Jabaloy, A. (2014). GIS application for regional assessment of seismically induced slope failures in the Sierra Nevada Range, South Spain, along the Padul fault. Environm. Earth Sc. 72, 2423–2435. doi:10.1007/s12665-014-3151-7
Rodríguez-Peces, M. J., García-Mayordomo, J., and Martínez-Díaz, J. J. (2013). Slope instabilities triggered by the 11th may 2011 Lorca earthquake (murcia. Spain): comparison to previous hazard assessments and proposition of a new hazard map and probability of failure equation. Bull. Earthq. Eng. 12, 1961–1976. doi:10.1007/s10518-013-9509-5
Rodríguez-Peces, M. J., Pérez-García, J. L., García-Mayordomo, J., Azañón, J. M., Insua- Arévalo, J. M., and Delgado, J. (2011). Applicability of Newmark method at regional subregional and site scales: seismically induced bullas and La paca rock-slide cases (murcia. SE Spain). Nat. Hazards 59, 1109–1124. doi:10.1007/s11069-011-9820-x
Rodríguez-Peces, M. J., Román-Herrera, J. C., Peláez, J. A., Delgado, J., Tsige, M., Missori, C., et al. (2020). Obtaining suitable logic-tree weights for probabilistic earthquake-induced landslide hazard analyses. Eng. Geol. 275, 105743. doi:10.1016/j.enggeo.2020.105743
Sanz de Galdeano, C., García Tortosa, F. J., Peláez, J. A., Alfaro, P., Azañón, J. M., Galindo Zaldívar, J., et al. (2012). Main active faults in the Granada and guadix-baza basins (betic Cordillera). J. Iber. Geol. 38, 209–223. doi:10.5209/rev_jige.2012.v38.n1.39215
Sanz de Galdeano, C., López-Garrido, A. C., Jabaloy, A., and Ruano, P. (2005). The betic Cordillera: a model for its origin and evolution during the alpine cycle. Episodes 28, 82–90.
Sanz de Galdeano, C., Peláez, J. A., and López Casado, C. (2003). Seismic potential of the main active faults in the Granada Basin (Southern Spain). Pure App. Geophys. 160, 1537–1556. doi:10.1007/s00024-003-2359-3
Saygili, G., and Rathje, E. M. (2008). Empirical predictive models for earthquake-induced sliding displacements of slopes. J. Geotech. Geoenvironm. Eng. 134, 790–803. doi:10.1061/(asce)1090-0241(2008)134:6(790)
Tanyas, H., and Lombardo, L. (2020). Completeness index for earthquake-induced landslide inventories. Eng. Geol. 264, 105331. doi:10.1016/j.enggeo.2019.105331
Tanyas¸, H., van Westen, C. J., Allstadt, K. E., Anna Nowicki Jessee, M., Gorüm, T., Jibson, R. W., et al. (2017). Presentation and analysis of a worldwide database of earthquake-induced landslide inventories. J. Geophys. Res. Earth Surf. 122 (10), 1991–2015. doi:10.1002/2017JF004236
Travasarou, T., Bray, J. D., and Abrahamson, N. A. (2003). Empirical attenuation relationship for arias intensity. Earthq. Eng. Struct. Dyn. 32, 1133–1155. doi:10.1002/eqe.270
Wang, Y., and Rathje, E. M. (2015). Probabilistic seismic landslide hazard maps including epistemic uncertainty. Eng. Geol. 196, 313–324. doi:10.1016/j.enggeo.2015.08.001
Wells, D. L., and Coppersmith, K. J. (1994). New empirical relationships among magnitude, rupture length, rupture width, rupture area, and surface displacement. Bull. Seism. Soc. Am. 84, 974–1002.
Keywords: earthquakes, seismically-induced landslides, road network, logic tree, susceptibility
Citation: Román-Herrera JC, Delgado J, Rodríguez-Peces MJ, Peláez JA and Garrido J (2023) Evaluation of road network slopes susceptibility to seismically-induced landslides in the Granada Basin (S Spain). Front. Earth Sci. 11:1226894. doi: 10.3389/feart.2023.1226894
Received: 22 May 2023; Accepted: 17 August 2023;
Published: 29 August 2023.
Edited by:
George Hloupis, University of West Attica, GreeceReviewed by:
Ritu Raj Nath, Adani Institute of Infrastructure Engineering (AIIE), IndiaCopyright © 2023 Román-Herrera, Delgado, Rodríguez-Peces, Peláez and Garrido. This is an open-access article distributed under the terms of the Creative Commons Attribution License (CC BY). The use, distribution or reproduction in other forums is permitted, provided the original author(s) and the copyright owner(s) are credited and that the original publication in this journal is cited, in accordance with accepted academic practice. No use, distribution or reproduction is permitted which does not comply with these terms.
*Correspondence: J. Delgado, am9zZS5kZWxnYWRvQHVhLmVz
Disclaimer: All claims expressed in this article are solely those of the authors and do not necessarily represent those of their affiliated organizations, or those of the publisher, the editors and the reviewers. Any product that may be evaluated in this article or claim that may be made by its manufacturer is not guaranteed or endorsed by the publisher.
Research integrity at Frontiers
Learn more about the work of our research integrity team to safeguard the quality of each article we publish.