 Zhan-Xi Wei1†
 Jian-Hui Dong
 Meng Zhao
 Fei-Hong Xie
 Lin Feng
95% of researchers rate our articles as excellent or good
Learn more about the work of our research integrity team to safeguard the quality of each article we publish.
Find out more
ORIGINAL RESEARCH article
Front. Earth Sci. , 31 August 2023
Sec. Environmental Informatics and Remote Sensing
Volume 11 - 2023 | https://doi.org/10.3389/feart.2023.1220142
This article is part of the Research Topic Advances and Applications of Artificial Intelligence and Numerical Simulation in Risk Emergency Management and Treatment, volume II View all 13 articles
In this paper, Qinghai alpine mining area is taken as the research object to explore the deformation characteristics of overlying strata in alpine mining area, so as to prevent geological disasters caused by over-exploitation in alpine mining area. The location of old goaf in coal mine is detected by transient electromagnetic method, and the results are used for numerical simulation. The numerical simulation results show that after coal seam mining, the stress gradually increases from the surface to the bottom, and the stress concentration occurs at both ends and the middle of the mining area. The displacement change area is highly coincident with the stress concentration area, and the displacement monitoring map is consistent with the horizontal displacement cloud map analysis, showing a “U” type distribution. The research results have certain reference value for the future study of surface mining subsidence in inclined coal seams.
The mining of underground mineral resources led to the destruction of the overlying strata, which, in turn, led to the subsidence of the surface. In the subsidence area, the surface will produce ground fissures and unstable slopes (Liu et al., 2010; Diao 2011; Ji et al., 2022). The long-term, large-scale, and high-intensity development of mineral resources had caused severe damage to the geological environment. Therefore, it is essential for geological disaster prevention and control engineering to predict the stress and strain characteristics of the overburdened rock in the alpine mining area in time and accurately.
First of all, in the field of geological disaster prevention and control, a large number of scholars have carried out relevant research. Huang et al. (2020) determined the correlation between 13 landslide condition factors (elevation slope, plane curvature, profile distribution, topographic relief amplitude, total surface radiation, population density, river normalized vegetation index, topographic wetness index, and rock type) and landslide location through frequency ratio analysis. They were used to compare heuristic models, general statistical models, and mechanical models, and a machine learning model with high accuracy and reasonable LS distribution characteristics was obtained. Chang et al. (2020) compared the advantages and disadvantages of simple machine learning (SML) and unsupervised machine learning (USML) on the LSP model and finally concluded that USMLModelScan Aso was used for LSP implementation due to its efficient modeling process, dimension reduction, and strong scalability. The results had essential guiding significance for the analysis of landslide stability. Jiang et al. (2018) proposed a simplified approach for generating conditional random feds of soil undrained shear strength. This method can detect the strength of soil to calculate the stability of the slope (Zhao et al., 2020; Zhao et al., 2022), used comparative tests, prices analysis, X-ray diffraction (XRD), and scanning electron microscopy (SEM) analysis to clarify the relationship between loess particle composition, micro structures, and macro mechanics, and analyzes the causes of subgrade settlement in alpine areas. It provided a reference for geological engineering practice. Zhao et al. (2018) and Zhao et al. (2019) used gypsum (MPG) and MPE-cement to reinforce roadbed loess and carried out an unconfined compressive strength test, permeability test, and freeze–thaw test, which improved the strength of modified loess and prevented the settlement of ground roadbed. Zhang et al. (2023) used the finite-element groundwater flow system software to simulate and predict the development of natural seepage field and the dredging construction conditions of seepage field in the West Qinling 1 # tunnel area and studied the change of seepage field in a tunnel engineering aquifer. Zhang et al. (2023) investigated the hydrochemistry, clarifying groundwater quality and assessing human health risks, using various computed techniques of geomodeling, EWQI, GIS mapping, and the USEPA mathematical model.
With the in-depth research of many scholars on the stress distribution of overlying rock mass caused by underground mining, physical models and numerical simulation experiments have been widely used (Li et al., 2019). Geophysical exploration was the main detection method for goaf. Abhay et al. (2019) adopted the resistivity method to conduct tomography detection for the old stope in the Jharia coal field in India, which was helpful to identify the abandoned slope and porous and permeable stratum conditions. The vector finite-element method was used to simulate the TEM response in homogeneous media in three dimensions. It had a good effect on obtaining the HFIL diagram of the real position of the thin layer formation logging instrument (Epov et al., 2007). Shi et al. (2010) carried out terrain correction by combining the high-density resistivity method with the total station instrument. They determined the distribution location of the goaf and verified that the high-density electrical method had a good effect on the detection of goaf.
In addition, researchers have carried out various studies on the deformation characteristics of overburdened rock in near-horizontal and gently dipping coal seam goaf. Boris (1997), on the basis of considering the underground geological characteristics of the slope, used FLAC 2D and UDEC to comprehensively analyze the influence of various factors such as excavation depth, excavation method, and excavation site on slope changes during mining. He found that slope instability is closely related to slope rock inclination conditions.
The abovementioned research showed that the transient electromagnetic method and high-density resistivity method can detect the approximate range, location, and occurrence state of the goaf when studying the underground coal seam goaf and draw the goaf plan accordingly. The plan can provide theoretical practice for the numerical simulation of goaf deformation characteristics. However, no scholars have combined the two methods to study the deformation characteristics of overlying strata in alpine mining areas.
This paper took the mined-out area of Xiaomeidong mine in Datong Coal Mine of Qinghai province as the research object, combined with the geological and hydrological data of the study area, the transient electromagnetic method was used to detect the mined-out area, and the section map of the mined-out area was drawn. The numerical simulation method was used to analyze the surface deformation law under the stress of the original rock in the goaf from the perspective of theoretical analysis and explore the deformation characteristics of the overlying rock in the goaf. It revealed the deformation and failure mechanical characteristics and fracture evolution process of mined-out overburdened rock under the stress of original rock. The research results provided effective theoretical support for surface deformation monitoring and disaster prevention of the mined-out area in Xiaomeidong mine, which had essential theoretical significance.
The Xiaomeidong mine field was located in the southeast of Datong Hui-Tu Autonomous County, Xining City, Qinghai province. The critical research area belonged to plateau continental climate. The mean annual temperature was 2.8–3.9°C. The temperature difference was 25.3°C, average daily temperature difference was 13.2°C ∼ 13.8°C, and average annual precipitation was between 508.7 and 532.6 mm. Summer and autumn had more southeast wind, and the wind speed was small; winter and spring had more northwest wind, with average wind speed 2 m/s, maximum wind speed 17 m/s, and an average frost-free period of 96.3 days.
The study area was located in the southern margin of the Xining–Datong Basin, which was composed of eroded low hills and eroded valley plains. The erosion and denudation hills in the area were mainly composed of Cretaceous, Paleogene mud, sandstone, and Quaternary loess. The altitude was 2,450–2,750 m, the relative height difference was 300 m, the mountain was high and the slope was steep, the ravines were cross, the terrain was undulating, the topography was complex, the vegetation was scarce, and soil erosion was serious. It was the strongest area of modern water erosion. Some villagers in the area built houses according to the mountains, and human engineering activities have caused serious damage to the geological environment.
The coal seam was thick at the top and thin at the bottom, and its structure was complex. The overall distribution characteristics of the overlying strata in the goaf were stratified and crisscrossed. The scale of the mined-out mine was basically the same as the scale of the ore body. The old mined-out area under the surface of the exploration area was covered with tunnels. The distance between the mined-out area and the surface was increased from south to north except the wellhead, and the thickness of the mined-out area was mainly sand mud stone and waste rock, which had low mechanical strength and were easily weathered. Between the layers (between the upper and lower roadway) were mostly sand and mud stone.
The mined-out subsidence area of the Xiaomeidong mine was approximately rectangular in shape, with a length of about 1,600 m and a width of about 650 m. The direction of its long axis was 46°. Figure 1 shows the overall picture. The subsidence area was in the deformation development period. With the extension of time, the surface collapsed will develop from southwest to northeast, and the goaf will lead to the surface movement, which will lead to the continuous increase of the scale of the collapsed, the aggravation of the damage, and further aggravation of the damage to the geomorphic landscape. From the field investigation, it can be concluded that the landslide (such as oil depot landslide) and unstable slope around the Xiaomeidong mine were all induced by the ground collapsed of the goaf, as shown in Figure 2.
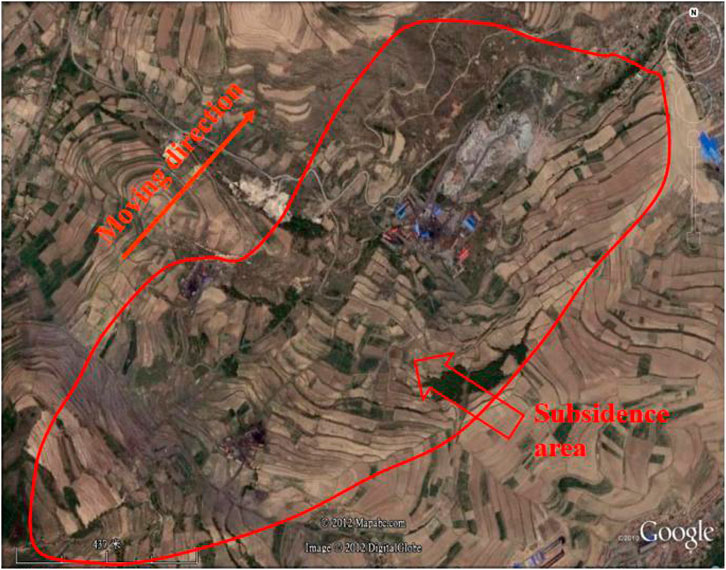
FIGURE 1. Panoramic view of the subsidence area of the Xiaomeidong coal mine.
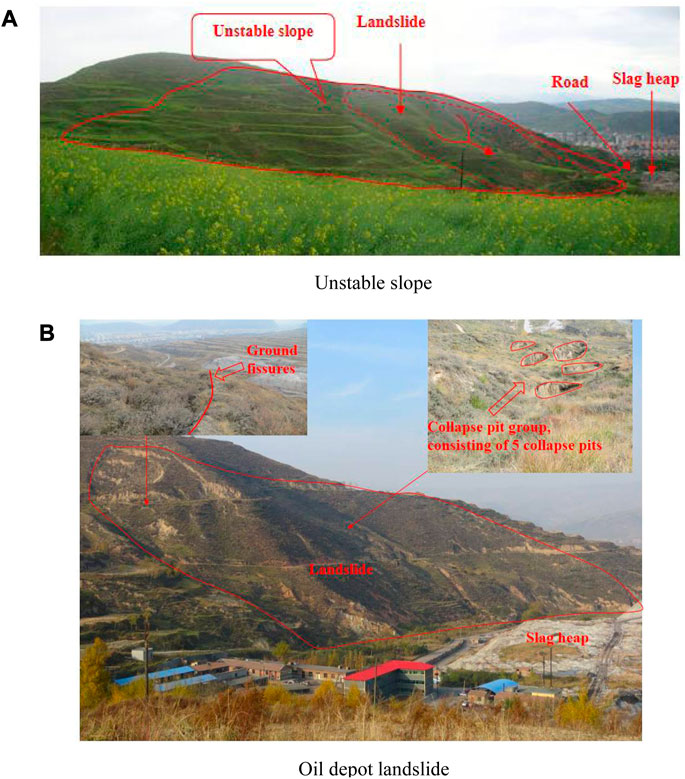
FIGURE 2. Geological disaster of the Xiaomeidong coal mine. (A) Unstable slope and (B) oil depot landslide.
Based on the field situation of the study area, this paper intended to use the transient electromagnetic method to conduct geophysical exploration of the hydrogeology of the coal mine site, constructed a numerical analysis model of the subsidence area, studied and inverted the characteristics of the subsidence area, and analyzed its genesis mechanism and influence range.
The transient electromagnetic method was a method to detect the resistivity of the medium by using an ungrounded loop or ground line source to emit a primary pulse magnetic field to the ground and using coil or ground electrode to observe the secondary-induced eddy current field caused by the underground medium during the intermittent period of primary pulse magnetic field. This method can judge the possible coal mine goaf by detecting the resistivity below the surface, which provides a reliable theoretical basis for the subsequent numerical simulation. It had the advantages of automatically eliminating the main noise source, no terrain influence, combined observation at the same point, best coupling with the detection target, strong abnormal response, simple shape, and strong resolution. Three transient electromagnetic profile lines were set up in the Datong coal mine to detect and identify water-bearing geology in the area, such as karst caves and roadways, coal mine goaves, and deep irregular water bodies, and to establish geological models. The study area was the EH2-2′ survey line area. The geophysical arrangement is shown in Figure 3.
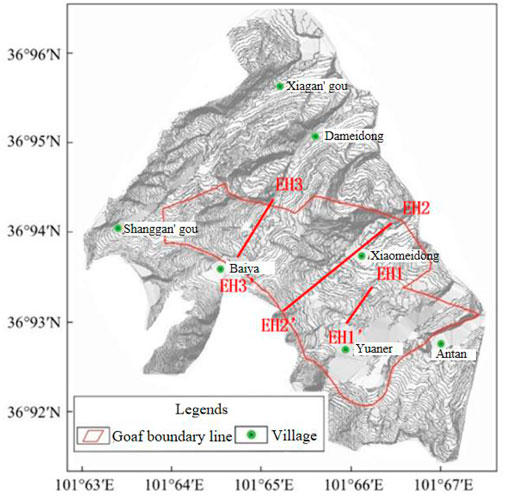
FIGURE 3. Layout plan of geophysical prospecting.
The original resistivity data were obtained by line detection, and then, the topographic data were added for apparent resistivity model inversion. The error value was obtained by comparing the model data calculated by forward modeling with the original data. When the data error was less than 15%, the model was considered as a qualified inversion model. Section directions are shown in the geophysical survey layout. The horizontal axis of each profile was the horizontal distance (unit m), and the vertical axis was the elevation (unit m). This interpretation work was based on the inversion profile and combined with the geological data and the actual situation to explain each profile. The resistivity profile of the measured line and its detailed interpretation are as follows.
The terrain of the EH2-2′ survey line was relatively flat, and the surface layer was mainly covered with silt, which was relatively thick. From the transient electromagnetic inversion results, it can be seen that there was an obvious low-resistance area between 0 m and 28 m down from the surface at a distance of 300–880 m, and the apparent resistivity was less than 30 Ω m, which was presumed to be a coal mine goaf and subsidence water-rich area. There was an obvious low-resistance area between 0 and 125 m down from the surface at a mileage of 1,400–1,600 m, and the apparent resistivity was less than 30 Ω m, which was presumed to be a coal mine goaf and water-rich area. The apparent resistivity of the entire survey line section was greater than 30 Ω m and less than 50 Ω m, which was presumed to be a weak water-rich area of the coal mine goaf. Figures 4, 5 show the details.
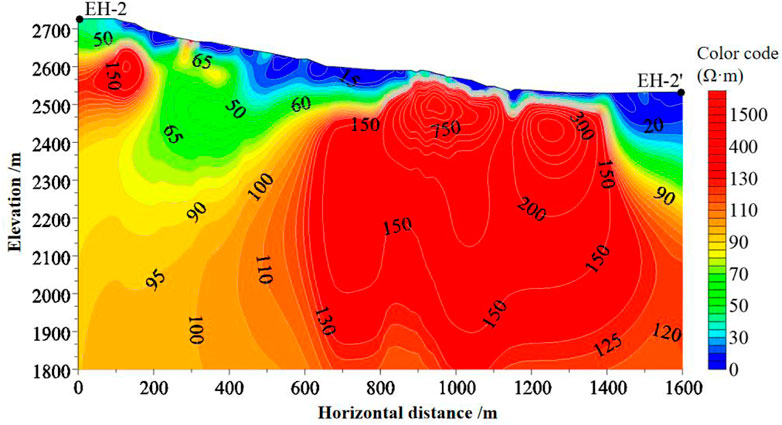
FIGURE 4. Inversion results of the transient electromagnetic method.
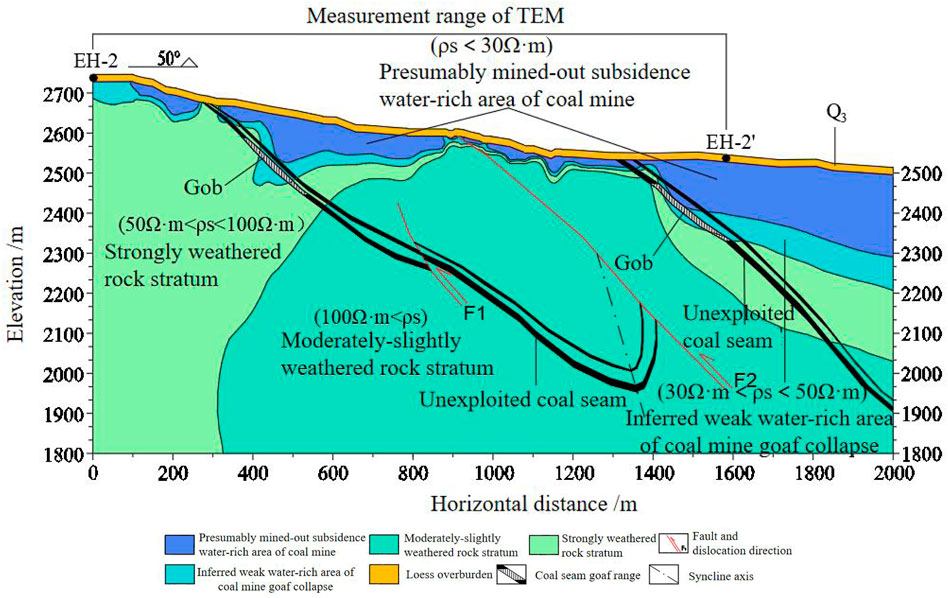
FIGURE 5. Interpretation of inversion results of the transient electromagnetic method.
It could be seen that there were obvious low-resistance areas at 300–880 m from the surface, between 0 and 28 m from the surface, between 1,400 and 1,600 m from the surface, and between 0 and 125 m from the surface. It was speculated that these two areas were coal seam goaves. Therefore, these two areas were set as numerical simulation research areas for subsequent coal seamstress and displacement analysis.
Numerical calculation and analysis of coal and rock stability was one of the essential methods for scientific research, which can reveal the deformation and failure law of rock strata in site engineering. It can solve problems such as the movement and deformation law of surface overburden under various geological conditions and different mining modes (Lei et al., 2018). At present, numerical simulation methods have been widely used in the field of overburden migration and surface deformation. The most commonly used numerical simulation methods mainly include finite-element method, finite-difference method, and discrete-element method. In this study, two-dimensional discrete element numerical simulation technology was used to simulate the mechanical behavior of the overlying strata and mining subsidence, and the numerical simulation results obtained can be used to guide mine safety production (Wang et al., 2021). This numerical simulation method regards the rock mass as a collection of two basic elements of rock and structural plane and continuously judges and updates the contact state of the block during the calculation process. According to these contact states, the load transfer mode between the blocks was judged, the corresponding mechanical laws were selected for contact, and the stress and deformation behavior of these basic elements were defined.
Due to the complex stratigraphic structure of the study area, in the process of establishing the numerical model, the rock and soil bodies with similar physical and mechanical properties were appropriately simplified and the coal seam was simplified into two layers of coal. The two groups of coal were mined simultaneously.
The model was basically assumed to be an isotropic continuous homogeneous medium, and the Mohr–Coulomb elastic–plastic model was adopted as the mechanical model. The top surface of the model was free, the bottom was a fixed constraint, and the periphery was a horizontal displacement constraint. The initial stress in the mining area was mainly self-weight stress, and the acceleration of gravity was set at 9.81 m/s2, with a vertical downward direction. Table 1 shows the physical and mechanical parameters of rock strata.

TABLE 1. Physical and mechanical parameters of overburden.
As for the parameters of joints, their values should be relatively smaller than those of rocks, so the tangential stiffness of joints jks=5 GPa. The joint normal stiffness jkn=2.5 GPa. The values of friction angle of joints and cohesion should be less than those of rocks, and the friction angle of joints should be 15; cohesion was 0.2 MPa.
For the constitutive model, the elastic–plastic model was used in modeling, and the block obeyed CONS = 2 in UEDC. The constitutive model of joints obeyed jcons=3 in UDEC.
The established numerical calculation showed that the strike length was 1,600 m, the vertical height was between 270 m and 470 m, the average vertical height was 370 m, the simulated mining thickness was 2.4 m, and the simulated coal seams were all inclined coal seams, with the dip angle of M1 being 37 and the dip angle of M3 being 43. The model is shown in Figure 7. Above the numerical model coal seam, five monitoring lines were set for M1 and M3, one monitoring line was set near the surface, and four monitoring lines were set down at an equal distance. Figure 6 shows the layout of survey lines.
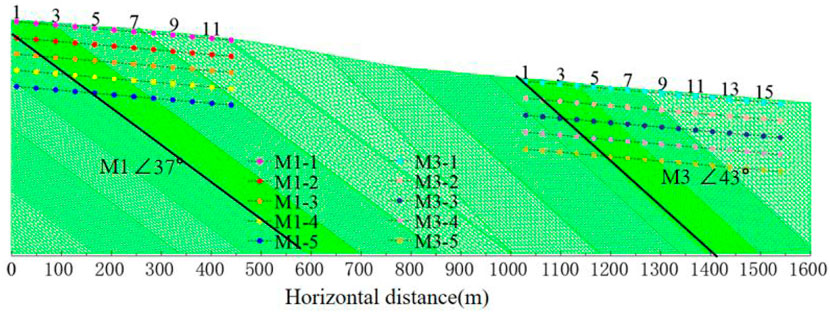
FIGURE 6. Model grid division and survey line layout.
The movement and deformation of the overlying strata and surface caused by coal mining was a complicated mechanical process. In order to explore the movement law of the overlying strata and surface caused by mining and to deeply analyze the influencing factors of movement law under deep mining conditions, taking coal mining in the Xiaomeidong mine as the research background, based on the abovementioned numerical model considering the dynamic response of the overlying strata mining, a numerical simulation scheme was designed to analyze the deformation characteristics and laws of the overlying strata and surface after coal mining (Weng, 2019).
In the actual process of coal mining, there were many multi-layer coal seams in many coal mines. Therefore, taking the actual mining conditions of the Xiaomeidong mine as a prototype, taking into account the rock mass structure conditions actually investigated on the spot, and considering the mining schemes of single-layer mining and multi-layer mining, this paper compared their influences on ground deformation and destruction and provided some theoretical basis for coal mining (Yan, 2019).
Prior to excavation, the model under the original stress needed to be iteratively calculated to reach the equilibrium state. In this working condition, after iterative calculation prior to excavation, when the maximum node unbalanced force reached step 7,647, compared with the initial total force, it was considered that the equilibrium was reached and the dynamic simulation of later excavation could be continued.
After balancing of the original model was completed, it was necessary to start the simulation of coal seam excavation. In UDEC, the delete range region command was used to delete the blocks that needed to be excavated within a certain boundary. At this time, only four corners of the excavation area needed to be determined, and the coordinates (x and y) of each point could be input counterclockwise to delete the blocks in the area to simulate the excavation work. After excavation, iterative calculation was continued to balance. After the solution was completed, the corresponding graphs were output to provide calculation results for further explanation and analysis. The graphs involved included a model graph, horizontal stress graph, vertical stress graph, horizontal displacement graph, vertical displacement graph, combined displacement graph, and monitoring line graph. In this section, the simulation scheme of single-layer excavation and multi-layer excavation would be adopted to analyze the working conditions of the abovementioned graphs.
Coal seam mining characteristics are shown in Table 2.
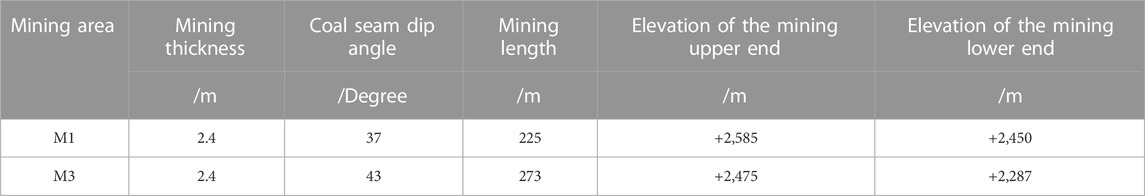
TABLE 2. Coal seam mining characteristics.
After the calculation of the model was balanced, the stress distribution was mainly analyzed by the stress cloud chart because the cloud chart had more intuitive advantages than the contour chart.
Figures 7A, B show the horizontal (x-direction) stress nephogram after coal seam mining had reached equilibrium. The nephogram took 4.0 MPa as the equivalent interval, with the minimum value of 0 Mpa and the maximum value of −16.0 MPa (representing compressive stress). The nephogram was in a layered state, and the layered stress was increasing from top to bottom. During single-layer mining, the stress was 0–8.0 MPa in a large area, and the stress changes mainly occurred in the coal seam roof. The stress increased in the central part of the mining area roof, and the stress concentration was obvious in the horizontal direction near the two ends of the mining subsidence area, with the stress value in the range of 4.0–6.0 MPa, as shown in Figure 7A. During multi-layer mining, the stress was 0–8.0 MPa in a large area. After coal mining, there was stress concentration at both ends of the mined-out area of coal seam M1 and obvious compressive stress concentration at the lower end of the mined-out area of coal seam M3, as shown in Figure 7B.
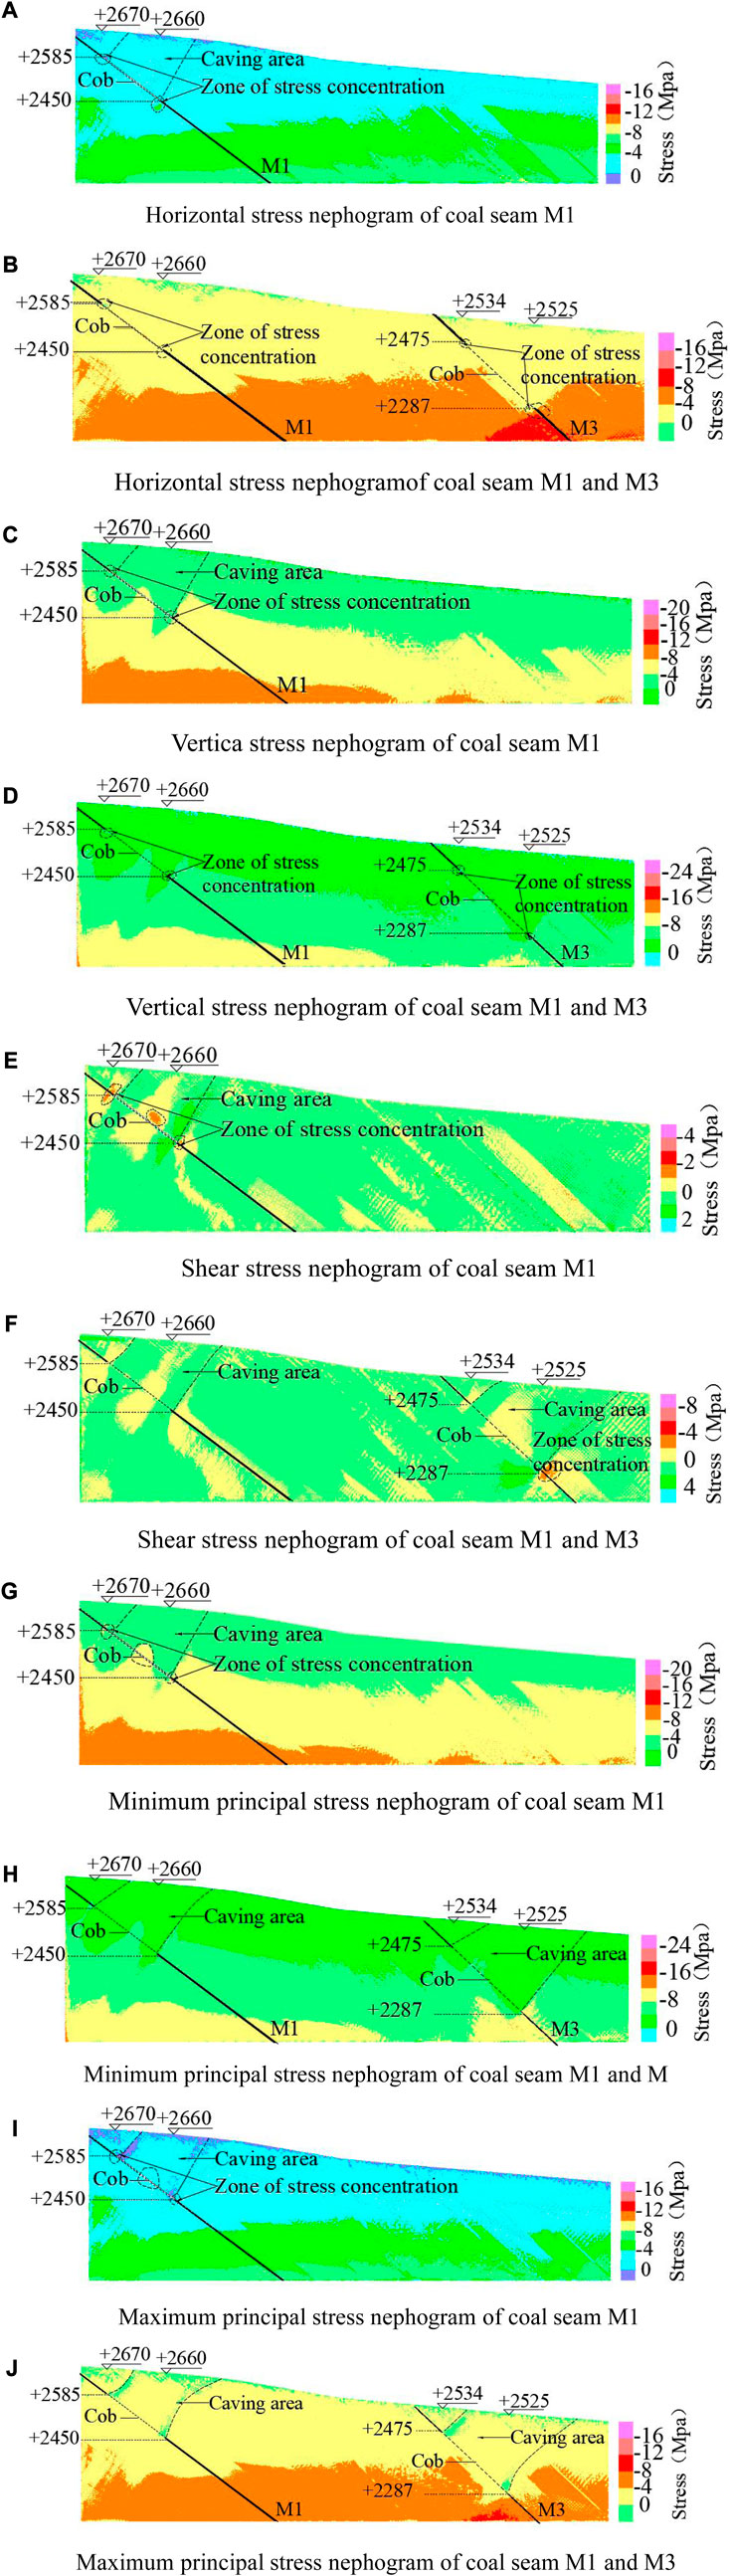
FIGURE 7. (Continued).
Figures 7C, D show the vertical (y-direction) stress nephogram after coal seam mining was balanced. The nephogram took 4.0 MPa as the equivalent interval, with the minimum value of 0 MPa and the maximum value of −16.0 MPa (expressed as compressive stress), and the large area was in the range of 0–12.0 MPa. During single-layer mining, the stress changes mainly occurred in the coal seam roof, and the stress increased in the central part of the roof in the mining area and showed obvious stress concentration in the horizontal direction near both ends of the mining subsidence area, with the stress value in the range of 4.0–8.0 MPa, as shown in Figure 7C. During multi-layer mining, stress concentration occurred at both ends of M1 and M3 mining areas to a certain extent, especially at the lower end of M3 mined-out area, and the stress concentration area was distributed within 8.0–12.0 MPa, as shown in Figure 7D.
Figures 7E, F show the distribution of shear stress after coal seam mining reaches equilibrium. It could be seen from the figure that there were positive and negative shear stresses in the rock strata near the coal seam mining area. The positive shear stress indicates that it was consistent with the moving direction along the inclined layer, and the shear stress in the mined-out subsidence area was mostly positive, reaching 0–2.0 Mpa. It could be seen from Figure 7E that during single-layer mining, the direction of shear stress in the center of the roof of the mining area was opposite to the movement direction of the strata, and there were negative shear stresses on both sides of the caving area. Shear stress concentration occurred at both ends and the middle of the mining area, and the shear stress was negative, reaching 1.0–2.0 Mpa. It could be seen from Figure 7F that during multi-layer mining, the shear stress of the deformation at the center and both sides of the roof and floor in the mining area was negative, ranging from 0 to 0–2.0 MPa, and the stress concentration occurred at the lower end of the M3 mining area in coal seam.
Figures 7G, H show the cloud pictures of minimum principal stress after coal seam excavation was balanced. Through the analysis of the simulated cloud picture of principal stress, it could be further judged whether there was tensile stress in the goaf of coal seam. It could be seen from Figure 7G that after the single-layer excavation reached a new balance, the minimum principal stress of the roof in the M1 mining area of coal seam was 0–4.0 MPa, which showed compressive stress, and the stress concentration occurred on both sides and the center of the excavation area with the minimum principal stress peak value of -8.0 MPa. It could be seen from Figure 7H that during multi-layer excavation, the minimum principal stress of the roof in the coal seam mining area was 0–4.0 MPa and the stress change of the floor was small.
Figures 7I, J, show the nephogram of the maximum principal stress after coal seam excavation was balanced. For the single-layer excavation scheme, at the top of the M1 mining area of coal seam, there was an obvious tensile stress area, and the overlying strata delaminated and collapsed, forming a caving area. The maximum principal stress in the caving area was 0–2.0 MPa and the angle was 60, as shown in Figure 7I. For the multi-layer excavation scheme, the collapsed shape of overburden in mining area could be clearly shown in the normal tensile stress area, as shown in Figure 7J.
From the abovementioned results, it could be seen that when the coal seam is mined, the stress change mainly occurred in the roof of the coal seam. The stress in the middle of the roof increases, and the horizontal stress concentration near the two ends of the mining subsidence area was obvious.
After the coal seam was mined, the original stress balance around the mined-out area was destroyed, which caused the redistribution of stress, thus causing the deformation, destruction, and movement of the rock stratum, which developed from the bottom up to the surface and caused the movement of the surface. Through the displacement nephogram obtained by numerical simulation, the deformation shape and movement angle of overlying strata in goaf could be observed intuitively. This section comprehensively analyzes the horizontal displacement, vertical displacement, and combined displacement of the overlying strata in the mining area after coal seam mining.
The deformation form of the overlying strata could be seen from the figure. With the advancing of the working face, the main roof had vertical and horizontal displacement, and the deformation (horizontal and vertical) was also increasing. Figures 8A, B show the horizontal (x-direction) displacement nephogram after coal seam excavation was balanced. From the numerical simulation results, it could be seen that after coal seam excavation, the horizontal displacement of the roof in the middle of coal seam mining area was the maximum, with the maximum displacement of 1.6 m. The horizontal displacement of the strata near the mined-out area of coal mine changed greatly, and the strata in the excavated area showed obvious bending and collapsed, and the deformation area was 0.8–1.6 m in the large area.
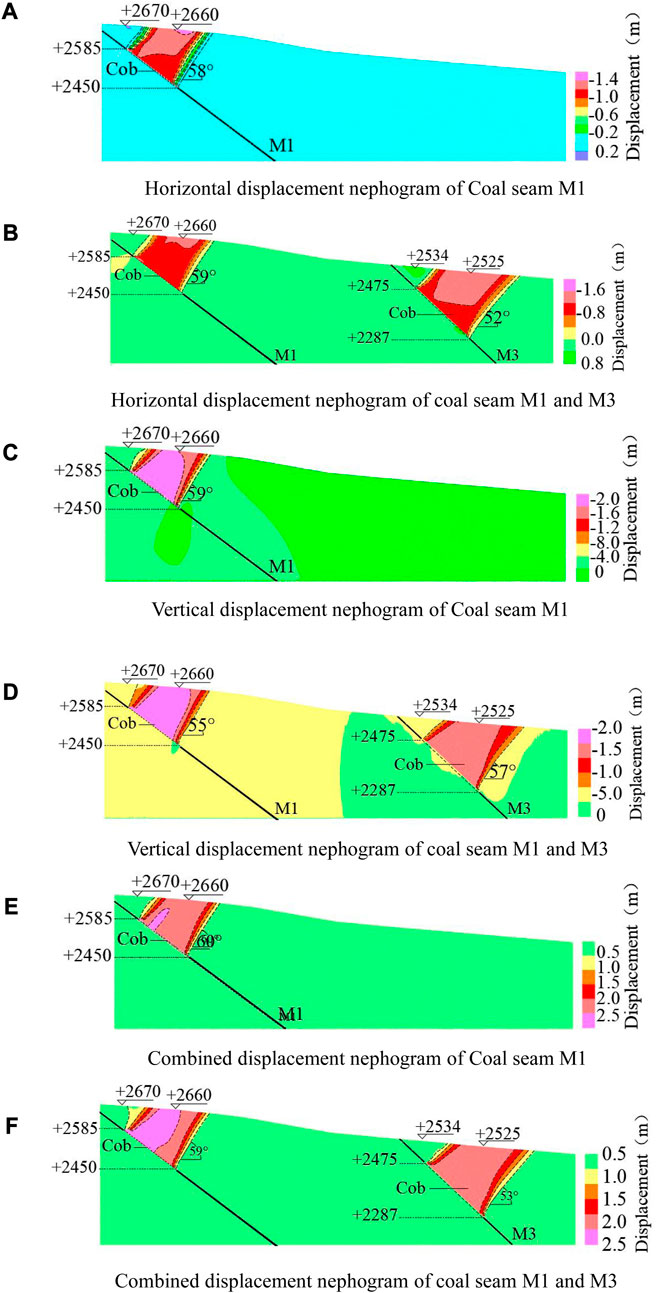
FIGURE 8. Displacement nephogram after coal seam excavation. (A) Horizontal displacement nephogram of coal seam M1, (B) horizontal displacement nephogram of coal seam M1 and M3, (C) vertical displacement nephogram of coal seam M1, (D) vertical displacement nephogram of coal seam M1 and M3, (E) combined displacement nephogram of coal seam M1, and (F) combined displacement nephogram of coal seam M1 and M3.
Figures 8C, D show the vertical (Y-direction) displacement nephogram after coal seam excavation was balanced. From the numerical simulation results, it could be seen that after coal seam excavation, the Y-direction displacement showed a certain rule: the deformation of the overlying strata in goaf was concentrated in the main collapsed area, and the vertical displacement after excavation was distributed in layers. The displacement gradually decreased with the increase in the range, and the displacement peak appeared at the roof of goaf, with M1 vertical displacement exceeding 2.0 m in a large range and M3 vertical displacement ranging from 1.5 to 2.0 m in a large area (the negative sign in the figure indicates the vertical downward movement of the strata).
Figures 8E, F show the combined displacement cloud pictures after coal seam excavation was balanced. From the numerical simulation results, it could be seen that after coal seam excavation, the peak value of combined displacement of the roof was concentrated at the top of goaf, and the maximum value of combined displacement after mining appeared in the center of the roof of the mining area. The more the distance from the center of the mining area, the smaller the subsidence displacement. Under the condition of full mining, the rock strata movement angle of the surrounding rock above the M1 goaf was 59°, and that of the surrounding rock above the M1 goaf was 53°.
From the results of numerical simulation displacement, it could be seen that after coal seam excavation, the peak value of coal seam roof displacement was concentrated on the top of goaf and the maximum value of combined displacement after mining appeared in the center of the roof in the mining area. The more the distance from the center of the mining area, the smaller the settlement displacement, which was consistent with the analysis of the stress cloud map.
The cloud map of displacement was a balanced overburden movement pattern after coal seam excavation in order to verify whether the results of this numerical simulation were reliable. In order to analyze the displacement change of coal seam M3 more clearly and intuitively, we set up five monitoring lines parallel to the surface in the overlying strata of coal seam M1 and M3 mining areas, namely, M1-1, M1-2, M1-3, M1-4, M1-5, M3-1, M3-2, M3-3, M3-4, and M3-5, among which in M1, the distance between the measured points was roughly equal. Figure 6 shows the layout of the monitoring line.
As can be seen from Figure 9, the horizontal displacement had positive and negative values at the horizontal distance of the survey line, and coal seam M1 had a large displacement between the horizontal distance of 100–300 m, and the peak value at the monitoring point M1-108 was 1.34 m. The horizontal displacement of the M3 coal seam after mining was generally U-shaped, with a large horizontal displacement between 1,150–1,350 m. The maximum horizontal displacement occurred at M3-109, and the maximum displacement was −1.537 m.
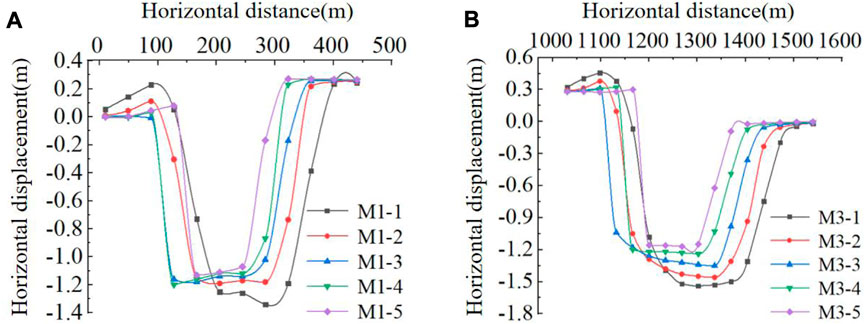
FIGURE 9. Horizontal displacement curve of the coal seam after mining stability. (A) Horizontal displacement curve of M1 coal seam. (B) Horizontal displacement curve of M3 coal seam.
As can be seen from Figure 10, the vertical displacement of the monitoring point was negative, which was downward displacement, and the maximum displacement of coal seam M1 was M1-404, with a maximum displacement of 2.32 m. As can be seen from Figure 10A, M1 had a large deformation in the goaf subsidence area with a horizontal distance of 100–200 m, with a relatively uniform change and a large vertical displacement. The subsidence deformation was within the range of 2.0–2.4 m, while the overlying strata outside this range had a small deformation, and the subsidence deformation was within the range of 0–0.6 m. It could be seen from Figure 10B that M3 had a large deformation in the mined-out subsidence area with a horizontal distance of 1,100–1,350 m, with a relatively uniform change and a large vertical displacement. The subsidence deformation was within the range of 1.6–2.0 m, while the overlying strata outside this range had a small deformation, and the subsidence deformation was within the range of 0–0.2 m.
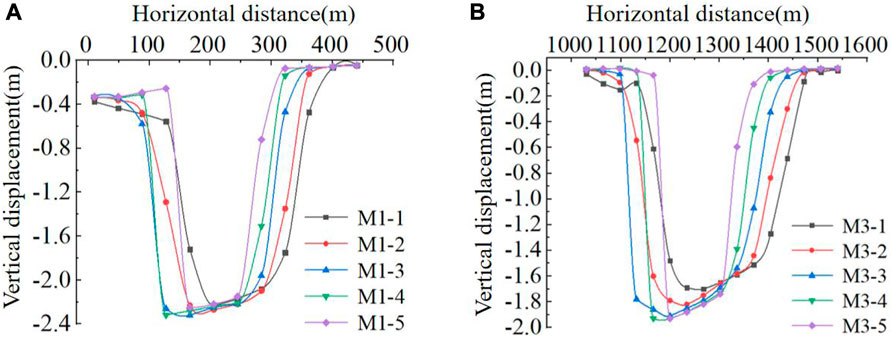
FIGURE 10. Vertical displacement curve of coal seam after mining stability. (A) Vertical displacement curve of M1 coal seam. (B) Vertical displacement curve of M3 coal seam.
The combined displacement curve of Figure 11 could be obtained from the data in the table.
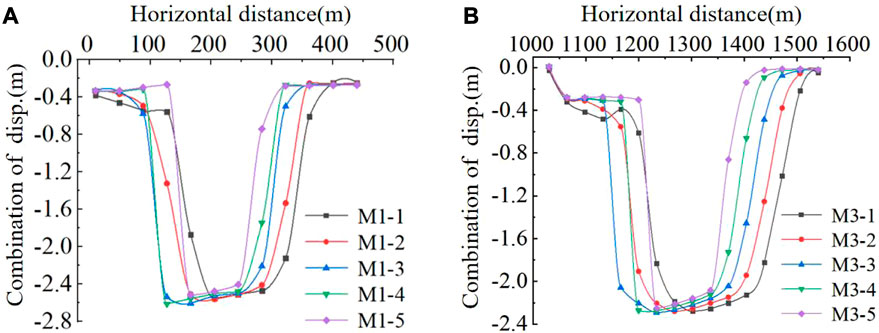
FIGURE 11. Combined displacement curve after coal seam mining is stable. (A) Combined displacement curve of M1 coal seam. (B) Combined displacement curve of M3 coal seam.
As can be seen from Figure 11A, M1 had a large deformation within the horizontal distance of 100–300 m. At this time, the roof in the mining subsidence area collapsed and bent, and the settlement deformation developed from above the mined-out area to the surface. The maximum value of combined displacement occurred at M1-404, and the maximum displacement value was 2.611 m. It could be seen from Figure 11B that M3 had a large deformation within the horizontal distance of 1,200–1,300 m. At this time, the roof of the mining subsidence area collapsed and bent, and the settlement deformation developed from above the mined-out area to the surface. The maximum combined displacement occurred at M3-306, and the maximum displacement was 2.291 m.
The analysis showed that the stress concentration area and the displacement change area were highly coincident, and the displacement monitoring map was consistent with the horizontal displacement cloud analysis, showing a ' U′-type distribution. Under different rock depths, the closer to the coal seam mining area, the greater the displacement change, and the farther away from the main subsidence area, the smaller the overburden displacement change. It was proved that the numerical simulation results do have theoretical guidance for mining subsidence control.
In the process of numerical simulation, the overlying strata of the coal seam bent and sunk, and the strata close to the mined-out area of the coal seam bent more. Correspondingly, the strata far from the mining area were less affected by mining and the subsidence was less. Combined with displacement monitoring data and numerical simulation results, it can be seen that the mined-out area made the overlying strata collapse, and the deformation continuously developed from the roof to the surface, and the original surface sunk, as shown in Figure 12, in which the red dotted line is the original surface position and the blue dotted line is the surface position after subsidence.
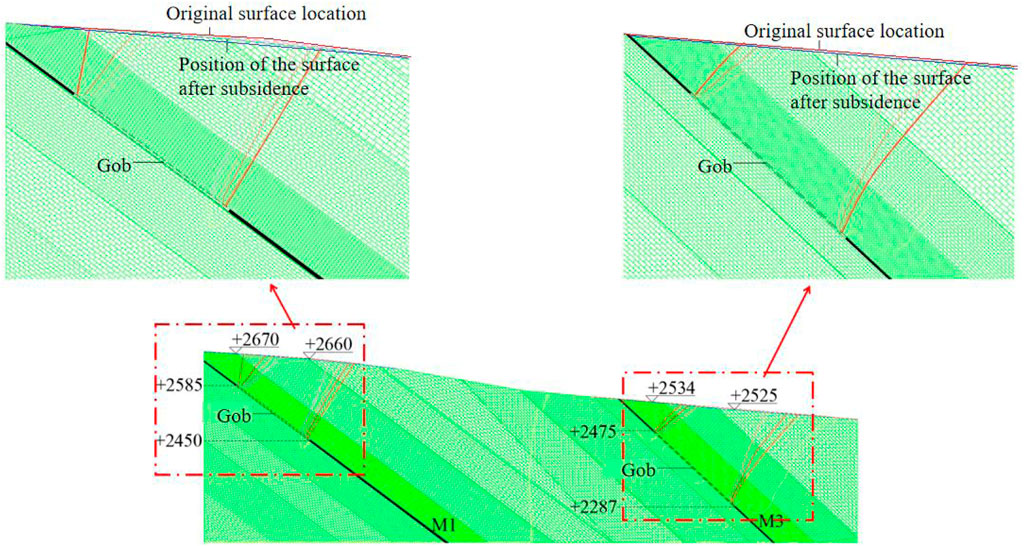
FIGURE 12. Contour map of coal seam excavation subsidence.
Table 3 shows the predicted boundary angle, moving angle, and crack values under sufficient conditions. Combined with the boundary angle, movement angle, and fissure angle of M1 and M3 in Table 3, the schematic diagram of boundary angle, movement angle, and fissure angle of M1 and M3 could be obtained, as shown in Figure 13.
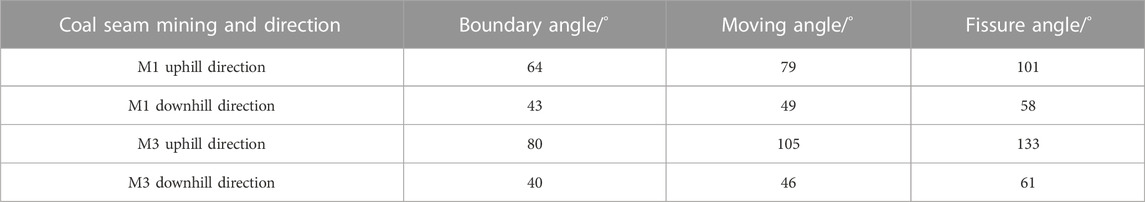
TABLE 3. Predicted boundary angle, movement angle, and fracture angle under sufficient conditions (unit: °).
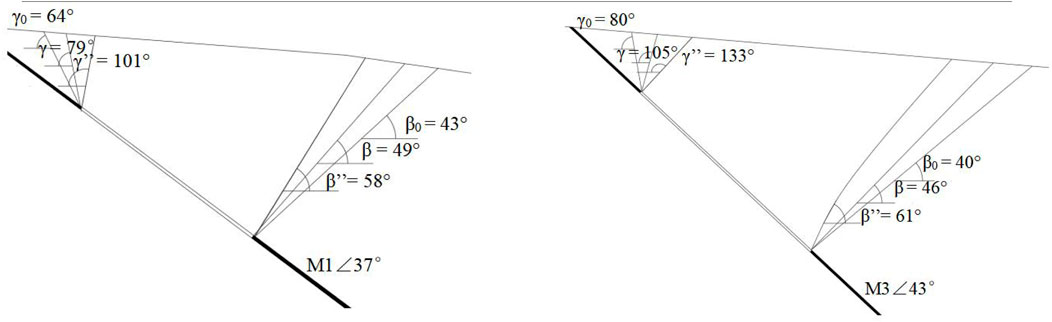
FIGURE 13. Schematic diagram of the boundary angle, movement angle, and fracture angle.
Among them, under the condition of full mining or near full mining, the angle formed by the boundary crack and the horizontal line on the side of the coal pillar was called the fissure angle. Under the condition of full mining or close to full mining, the measured subsidence curved on the main section of the surface movement basin was used, and the point with a subsidence value of 10 mm was taken as the boundary point. The angle between the line connecting the boundary point to the goaf boundary and the horizontal line on the side of the coal pillar was called the boundary angle. The moving angle was the angle between the horizontal line and the line connecting the critical deformation point and the goaf boundary at the edge of the subsidence area. These three together determined the safety status of the mine and the surrounding buildings at this time.
From the analysis of Table 3 and Figure 13, it was inferred that the subsidence of the coal seam would not threaten the safety of the surrounding buildings and residents' lives and properties.
Based on special geological conditions, mining conditions, and abundant measured data in the Xiaomeidong mining area, the research idea of 'transient electromagnetic detection-numerical simulation' was put forward to explore its role in the prevention and control of geological disasters (Huang et al., 2020, Huang et al., 2020, Zhang et al., 2021).
1. Through the geophysical analysis of the old mined-out area of the Xiaomeidong mine, the predicted water-rich area of coal mine goaf subsidence obtained from the results was basically consistent with the weak water-rich area and the historical coal seam mining area of the Xiaomeidong coal mine, and it was used as the basis of numerical simulation.
2. The results of numerical simulation showed that under the action of in situ stress, there was an obvious tensile stress zone at the top of the mined-out area in the old mined-out area, and the overlying strata were separated and collapsed, forming a caving zone. The peak displacement of the coal seam roof was concentrated at the top of the goaf. The more the distance from the center of the mining area, the smaller the subsidence displacement.
3. Through the analysis of the subsidence change of the coal seam goaf, it was known that the boundary angle, moving angle, and fissure angle of M1 and M3 coal seams were within the safe range after mining, so they would not pose a threat to the life and property safety of Xiaomeidong village and nearby residents. In addition, it was necessary to further compare the simulation results with the real-time monitoring results to further improve the evaluation results.
The original contributions presented in the study are included in the article/Supplementary Material. Further inquiries can be directed to the corresponding author.
Z-XW was responsible for field investigation and data curation. J-HD was responsible for the method. MZ was responsible for the method and writing. F-HX was responsible for the method. Y-JL was responsible for field investigation. LF was responsible for data curation. All authors contributed to the article and approved the submitted version.
This project was supported by the Open Fund of Engineering Research Center of Catastrophic Prophylaxis and Treatment of Road and Traffic Safety of Ministry of Education (Changsha University of Science and Technology) (kfj180404).
The authors declare that the research was conducted in the absence of any commercial or financial relationships that could be construed as a potential conflict of interest.
All claims expressed in this article are solely those of the authors and do not necessarily represent those of their affiliated organizations, or those of the publisher, the editors, and the reviewers. Any product that may be evaluated in this article, or claim that may be made by its manufacturer, is not guaranteed or endorsed by the publisher.
Abhay Kumar, B. H. A. R. T. I., Pal, S. K., Saurabh, S., Singh, K. K. K., Singh, P. K., Prakash, A., et al. (2019). Groundwater prospecting by the inversion of cumulative data of wenner–schlumberger and dipole–dipole arrays: A case study at turamdih, Jharkhand, India. Earth Syst. Sci. 128, 107. doi:10.1007/s12040-019-1137-2
Boris, B. (1997). Numerical modeling of complex slope deformations. Canada Dissertation of Department of Geological Science,University of Saskatchewan.
Chang, Z., Du, Z., Zhang, F., Huang, F., Chen, J., Li, W., et al. (2020). Landslide susceptibility prediction based on remote sensing images and gis: comparisons of supervised and unsupervised machine learning models. Remote Sens. 12, 502. doi:10.3390/rs12030502
Diao, C. C. (2011). Development characteristics of ground fissures in Fushun urban area. J. Liaoning Univ. Eng. Technol. Nat. Sci. Ed. 30 (3), 420–422.
Epov, M. I., Shurina, E. P., and Nechaev, O. V. (2007). 3D forward modeling of vector field for induction logging problems. Russ. Geol. Geophys. s 48 (9), 770–774. doi:10.1016/j.rgg.2006.05.003
Huang, F. M., Cao, Z. S., Guo, J. F., Jiang, S. H., and Guo, Z. Z. (2020). Comparisons of heuristic, general statistical and machine learning models for landslide susceptibility prediction and mapping. CATENA 191, 104580. doi:10.1016/j.catena.2020.104580
Huang, F. M., Cao, Z. S., Jiang, S. H., Zhou, C. B., Huang, J. S., and Guo, Z. Z., (2020). Landslide susceptibility prediction based on a semi-supervised multiple-layer perceptron model. Landslides 17, 2919–2930. doi:10.1007/s10346-020-01473-9
Huang, F. M., Jing, Z., Wang, Y., Huang, J., and Zhu, L. (2020). A deep learning algorithm using a fully connected sparse autoencoder neural network for landslide susceptibility prediction. Landslides 17 (01), 217-229. doi:10.1007/s10346-019-01274-9
Ji, L., Zhao, J. J., Wan, X., Li, Q. M., and Wu, S. G., (2022). Study on the influence of goaf location on the deformation of high and steep hard rock slopes. People's Pearl River 43 (3), 66–76. doi:10.3969/j.issn.1001-9235.2022.03.009
Jiang, S. H., Huang, J. S., Huang, F. M., Yang, J. H., Yao, C., and Zhou, C. B. (2018). Modelling of spatial variability of soil undrained shear strength by conditional random fields for slope reliability analysis. Appl. Math. Model. 63, 374–389. doi:10.1016/j.apm.2018.06.030
Lei, Z. Y. (2018). Study on roof instability law and control of fully mechanized top coal caving face in steeply inclined coal seam. Xi'an, China Xi'an University of Science and Technology.
Li, X. L., Hu, C. Y., Sun, Q. F., and Zhang, Z., (2019). UDEC software is used to study the stress distribution in the collapsed process of mine goaf. Guizhou Geol. 36 (3), 254–260.
Liu, T. G., Li, G. J., Ma, X. Y., Yu, C. L., and Wang, C. J., (2010). Genesis analysis and risk prediction of ground fissures in Jingyu County, Jilin Province. Chin. J. Geol. Hazards Prev. 21 (1), 136–139. doi:10.16031/j.cnki.issn.1003-8035.2010.01.031
Shi, L. K., and Liu, H. Y. (2010). Application of high density resistivity method in goaf detection. J. North China Inst. Water Resour. Hydro Power 31 (5), 122–123. doi:10.19760/j.ncwu.zk.2010.05.035
Wang, L., Wang, S. M., Chen, X., Zhai, H., and Zhang, P., (2021). UDEC numerical simulation study on dynamic development characteristics of coal seam roof separation in wenjiapo mine. Min. Technol. 21 (05), 109–112. doi:10.13828/j.cnki.ckjs.2021.05.031
Weng, L. Y. (2019). Study on the law of overburden and surface deformation in Deep Strip Mining considering the dynamic response of overburden mining. Qingdao, China Shandong University of Science and Technology.
Yan, H. Y. (2019). Study on the formation mechanism of jianshanying deformation body in faer coal mine, Guizhou Province. Chengdu, China Chengdu University of Technology.
Zhang, Y. H., Dai, Y. S., Wang, Y., Huang, X., Xiao, Y., and Pei, Q. M., (2021). Hydrochemistry, quality and potential health risk appraisal of nitrate enriched groundwater in the Nanchong area, southwestern China. Sci. Total Environ. 784, 147186. doi:10.1016/j.scitotenv.2021.147186
Zhang, Y. H., Hu, X. B., Luo, H., Liu, Y., Yao, R. W., Ji, D., et al. (2023). Identifying the change of seepage field in karst aquifer under tunnel engineering: insight from feflow modelling. Lithosphere 2021, 6044574. doi:10.2113/2021/6044574
Zhao, M., Chen, L. Y., Wu, H. G., Guo, W., and Ye, C. W, (2018). Computer microscopic test study on the suitability of modified polyimide grease used to improve collapsible loess railway subgrade. CONCURRENCY COMPUTATION-PRACTICE Exp. 24, 30. doi:10.1002/cpe.4900
Zhao, M., Chen, L. Y., Wang, S. Y., and Wu, H. G., (2020). Experimental study of the microstructure of loess on its macroscopic geotechnical properties of the Baozhong railway subgrade in Ningxia, China. Bull. Eng. Geol. Environ. 9 (79), 4829–4840. doi:10.1007/s10064-020-01816-9
Zhao, M., Guo, W., Chen, L. Y., and Wang, S. Y., (2019). Experiment on the frost resistance of modified phospho gypsum: A case used to improve baozhong railway subgrade loess. J. Mt. Sci. 12 (16), 2920–2930. doi:10.1007/s11629-018-5014-2
Keywords: alpine coal mining area, transient electromagnetic, overburden deformation, discrete element numerical simulation, coal seam
Citation: Wei Z-X, Dong J-H, Zhao M, Xie F-H, Li Y-J and Feng L (2023) Transient electromagnetic detection and numerical simulation analysis of the deformation characteristics of an old goaf in an alpine coal mine area. Front. Earth Sci. 11:1220142. doi: 10.3389/feart.2023.1220142
Received: 10 May 2023; Accepted: 15 August 2023;
Published: 31 August 2023.
Edited by:
Chengyi Pu, Central University of Finance and Economics, ChinaReviewed by:
Liangchao Zou, Royal Institute of Technology, SwedenCopyright © 2023 Wei, Dong, Zhao, Xie, Li and Feng. This is an open-access article distributed under the terms of the Creative Commons Attribution License (CC BY). The use, distribution or reproduction in other forums is permitted, provided the original author(s) and the copyright owner(s) are credited and that the original publication in this journal is cited, in accordance with accepted academic practice. No use, distribution or reproduction is permitted which does not comply with these terms.
*Correspondence: Meng Zhao, emhhb21lbmdAY2R1LmVkdS5jbg==
†These authors have contributed equally to this work
Disclaimer: All claims expressed in this article are solely those of the authors and do not necessarily represent those of their affiliated organizations, or those of the publisher, the editors and the reviewers. Any product that may be evaluated in this article or claim that may be made by its manufacturer is not guaranteed or endorsed by the publisher.
Research integrity at Frontiers
Learn more about the work of our research integrity team to safeguard the quality of each article we publish.