 Aibaibu Abulimiti1
 Jiaying Lin
- 1PetroChina Xinjiang Oilfield Company, Karamay, Xinjiang, China
- 2Beijing Gas Group Company Limited, Beijing, China
- 3College of Petroleum Engineering, China University of Petroleum, Beijing, China
Successful hydraulic fracturing is very important in the development of hydrocarbon-bearing formations. The loading introduced by hydraulic fracturing causes deformation and failure, which are related to the damage accumulation and hydraulic fracture initiation process. This study employs a numerical model that considers the dynamic and elastoplastic behaviors in rocks under the influence of impact loads. The acceleration and wave propagation behaviors are quantified using the model. A time integration algorithm is used to ensure numerical accuracy and stability. The effects of loading rate, loading location, and heterogeneity are quantified. Results show that the elastoplastic and dynamic can effectively capture the wavy mechanical responses in the domain. Strain rate, acceleration, and plasticity can all exhibit oscillatory distribution patterns. Increasing the loading rate can magnify acceleration, strain rate, and the maximum plastic strain, while it reduces the range experiencing these induced changes. Changing the loading types and introducing the heterogeneity consideration both largely alter the mechanical response in the domain, and the waveforms of the mechanical parameters are significantly changed. Failure can occur earlier in layers with more elastic mechanical properties. Exerting 50 MPa loading in 0.01 ms can effectively introduce deformation and failures in the reservoir rock. Doubling the loading rate can effectively improve the ability of creating rock failures, which facilitates the following fracture initiation and propagation processes. This study can be a reference for the understanding of near-well and instantaneous rock mechanical behaviors at the beginning of fracturing.
1 Introduction
Hydraulic fracturing is often used in the development of oil and gas reservoirs for the improvement of oil and gas productivities. In the hydraulic fracturing operations in the field, high pressure fracturing fluids are injected into the reservoir. During such operations, the damage is accumulated and fractures are initiated when fracturing fluids flow into the near-well region (Hou et al., 2019; He et al., 2021; Zhi et al., 2021). The introduction of hydraulic fracturing fluids is associated with external loadings on the reservoir rocks, which can result in complex and evolving geomechanical responses (Okere et al., 2023). The quantitative understanding of such responses can help to improve the accuracy of hydraulic fracturing modeling and to optimize the hydraulic fracturing parameter designs. Therefore, it is important to consider the rock mechanical behaviors in reservoir rocks under complex loading conditions. Experimental and simulation techniques are key strategies in the analysis of the rock mechanical behaviors.
Rock mechanical analyses have been widely carried out as they can help to understand the constitutive relationships and stress-strain correlations. Togashi et al. (2017) proposed an experimental method for the characterization of the anisotropic mechanical responses. Deformation magnitudes at various orientations are measured in single tests. Aghababaei et al. (2019) compared single-stage and multi-stage compression tests and analyzed the induced damage in samples. Kluge et al. (2020) introduced a method that establishes shear failures in intact rock samples where hydrostatic loads are involved. Meanwhile, the rock mechanical properties are analyzed based on their hydro-mechanical methodology. Chen et al. (2021a) proposed a numerical and experimental study on the rock mechanical properties of heterogeneous sample. A matching between experimental data and simulation results improves the reliability of the analysis. Their conclusion is also in accordance with Baumgarten and Konietzky (2013) where numerical simulations and experimental studies are combined and the post-failure rock mechanical behaviors are better quantified. In certain cases, CT is also used along with rock mechanical analyses for the better understanding of heterogeneous mechanical behaviors and damage accumulations in reservoir rocks (Guo et al., 2021a). Recently, Okere et al. (2020) proposed a methodology to optimize the laboratory determination of CBM reservoir damage. Permeability is used as the index for formation damage, and the method of cuttings pulse decay is determined as the optimum. Wang et al. (2022a) then considered the effect of pore pressure evolutions on the changes in rock mechanical properties such as in-situ stress and deformation.
In the analysis of rock mechanical behaviors under various types of loadings, the effect of dynamic loadings is of importance as it is often dynamic and the mechanical evolution can be complex. Xia et al. (2017) proposed an analytical solution in Laplace-Fourier space and captured the transient behaviors of the poroelastodynamic field of a wellbore. In a series of studies, the pressure and stress propagations in rocks under the dynamic loadings induced by pulsating hydraulic fracturing are characterized experimentally and numerically. Results show that the dynamic and oscillatory loadings can facilitate the damage accumulation and fracture initiation processes; the pressure wave propagation and distribution are tightly related to the rock mechanical properties and the frequency of the pulses (Hou et al., 2021; Hou et al. 2022a; Hou et al. 2022b). They provided a quantitative method for the understanding of pressure and stress fields in rocks under impact loads. Fakhimi et al. (2018) used physical and numerical methods to analyze rock strength under impact and dynamic loads in the Split Hopkinson Pressure Bar testing. The study was on cylindrical samples and it captured the inertia characteristics. Kim et al. (2010) considered the inertia effect of lateral confinement in the Split Hopkinson Pressure Bar testing and calculated strain rates caused by impact loads. Li et al. (2009) numerically simulated the residual strength of samples under impact loads and introduced a risk evaluation method that is safer than previous methods. Aghababaei et al. (2019) employed a pulse shaper to reduce the strain rate variation in impact load tests, which improves the experimental workflow for the Split Hopkinson Pressure Bar tests. The discrete element method is sometimes employed for the simulation of stress-strain relationships for solids under impact loads. The stress equilibrium assumption and the stress nonequilibrium assumption are both considered in the numerical study (Prabhu and Qiu, 2022). Experimental and numerical studies of the rock mechanical behaviors are relevant since they can help to determine the essential elastic and plastic properties of reservoir rocks. These properties are related to the hydraulic fracturing processes since they usually govern brittleness and fracability (Lecampion et al., 2018; Chen et al., 2021b; Guo et al., 2021b), and they are often correlated with the fluid flow and rock deformation behaviors in the hydrocarbon-bearing formations (Guo et al., 2023). Zhang et al. (2021) proposed an experimental method to quantify the effect of loading rates and lithologies on Kaiser effects during in-situ stress measurements, where loading rate selection criteria are determined. The design and optimization of hydraulic fracturing-related parameters require detailed and accurate understanding of the mechanical properties. Near-well damage evolutions in reservoir rocks can be calculated using certain damage criteria. They can provide a reference for the optimization of perforation designs and for the modeling of the fracture initiation process (Wang et al., 2022b; Wei et al., 2022).
This study is focused on the numerical investigation of the stress and strain behaviors in formation rocks under dynamic loads in hydraulic fracturing. The model considers the inertia effect in the solid deformation process and the elastoplastic behaviors are calculated. Several types of impact loads are analyzed in the numerical investigation and their resultant stress-strain and damage evolution patterns are discussed. The study quantifies the damage evolution in solid rocks caused by impact loads and it can be a reference for the understanding of formation damage propagation during the fracturing process where impact loads are involved.
2 Methodology
Hydraulic fracturing aims at creating failures and fractures in hydrocarbon-bearing reservoir rocks. At the beginning of hydraulic fracturing processes, fracturing fluids directly contact reservoir rocks where dynamic impact loads are exerted. Since the exertion of the loads are rapid, the acceleration in the solid mechanics field cannot be neglected.
In this study, a numerical model is presented for the analysis of stress, strain, and damage evolutions caused by dynamic loads. The inertia effect is considered so that the limitation imposed by quasi-static assumptions can be addressed. The governing equation is shown below. The momentum balance is expressed in terms of Cauchy stress tensor and Newton’s third law of motion.
where
Except for the momentum balance expressed above, the boundary load is also considered as a boundary condition.
where
Similarly, the fixed boundary condition can be expressed.
where a fixed boundary with no displacement allowed is prescribed.
Plasticity is considered in the model. The Drucker-Prager criterion is used to calculate the plastic behaviors.
where
where
3 Results and discussion
In the beginning of the hydraulic fracturing process, dynamic loadings are exerted on reservoir rocks and drastic mechanical changes are induced. The numerical study is focused on the short-term responses right after the exertion of the dynamic loads. The effect of impact loads caused by fracturing fluids is depicted as a changing boundary condition in the solid mechanical problem. In the numerical analysis, several relevant parameters are investigated. Factors considered in the analysis include the loading rate, the loading location, and heterogeneity. The loading time in the base case is 0.01 ms, which presents the relatively fast and instantaneous responses in the beginning of the fracturing operations.
In this section, the base case is first investigated. Then, loading rate, loading location, and heterogeneity of the reservoir rock are investigated. Finally, a discussion is included so that the quantitative understanding of effects of theses parameters can be given.
3.1 Base case
In the first place, a base case is established to simulate the instantaneous response in a rock sample. A 2D model with the plane stress assumption is used. The inertial effect is considered in the dynamic process. A square shape of 5 cm by 5 cm is set up. A Young’s modulus of 30 GPa and a Poisson’s ratio of 0.2 are used. The rock density is 2,600 kg/m3. To establish the failure criterion, a cohesion of 8 MPa and an internal friction angle of 30° are used. These parameters are based on typical sandstone properties in hydrocarbon-bearing formations. The simulation time is 0.01 ms and a changing load is exerted on a boundary on the right. The load increases gradually with time as
Following the convention in reservoir geomechanics, the compressive state is denoted as positive. Results in Figure 1 shows the 2D distribution of the x component of strain, the x component of stress, the plastic strain, and the acceleration magnitude at the end of the simulation time. Since the boundary load is exerted on the right, the most significant responses are observed along the right boundary. Note that the load is exerted entirely on the boundary. The maximum strain of 0.0016 is observed on the right. The maximum stress is 50 MPa on the right, and this corresponds to the impact load magnitude at time 1 ms. Plasticity is observed near the right boundary. The width of the plastic region is around 4 mm and the maximum plastic strain is on the right boundary. The distribution of the acceleration magnitude is also presented. Although the distribution of the acceleration magnitude does not change in the y direction, oscillations are observed in the x direction which is the orientation of the exerted external load from the right. Results indicate that this acceleration propagation is successfully captured by the dynamic model used in this study while a quasi-static model cannot effectively address this wave propagation.
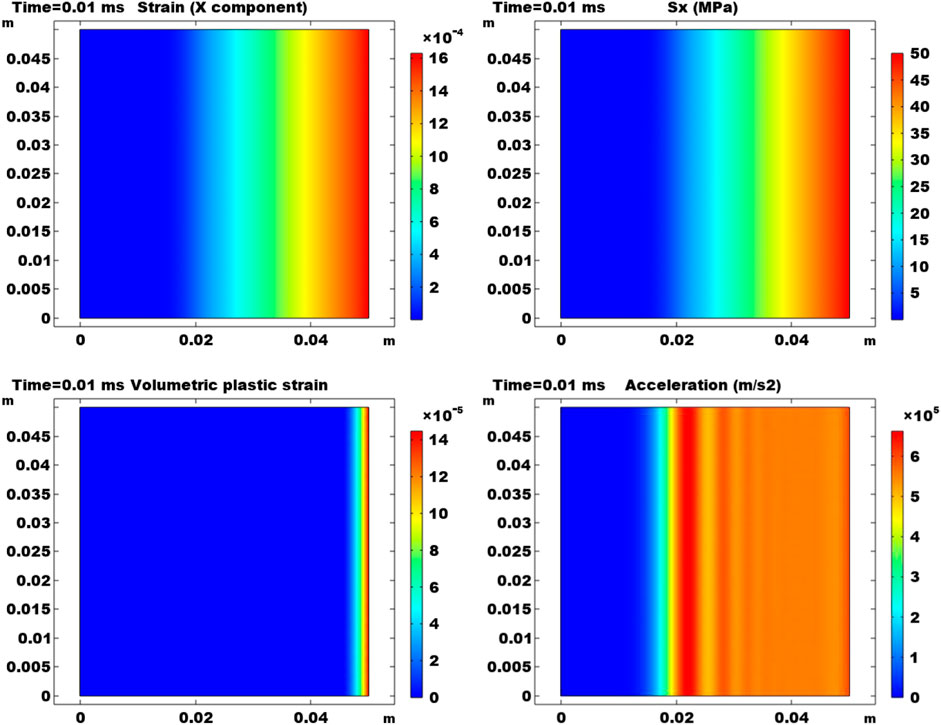
FIGURE 1. Results at the end of the simulation time. Results are 2D plots of the x component of strain, the x component of stress, the plastic strain, and the acceleration magnitude.
Figure 2 presents the temporal evolution of the acceleration magnitude at three locations (0 m, 0.025 m), (0.025 m, 0.025 m), and (0.05 m, 0.025 m). Both of the semi-log and the Cartesian plots are shown to better present the trends. It is observed that as it is closer to the right boundary with the impact load, the acceleration is more drastic. At (0 m, 0.025 m), the acceleration of the solid phase is induced last, and the magnitude is the lowest. This indicates that the propagation caused by the impact load takes time to reach the left boundary. At (0.025 m, 0.025 m), the acceleration magnitude becomes more significant and the start of the acceleration response occurs earlier. An oscillation is observed and the magnitude starts to drop after 0.008 ms. At (0.05 m, 0.025 m), the acceleration is relatively stable as the impact load boundary is prescribed at the beginning of the simulation. Slight oscillations can be observed during the temporal evolution. In the last 0.002 ms, the acceleration magnitude at (0.025 m, 0.025 m) becomes greater than (0.05 m, 0.025 m), showing that the acceleration response in the rock sample is not always monotonic and a wave propagation pattern can be captured. This is in accordance with the acceleration term considered in this elastoplastic and dynamic model.
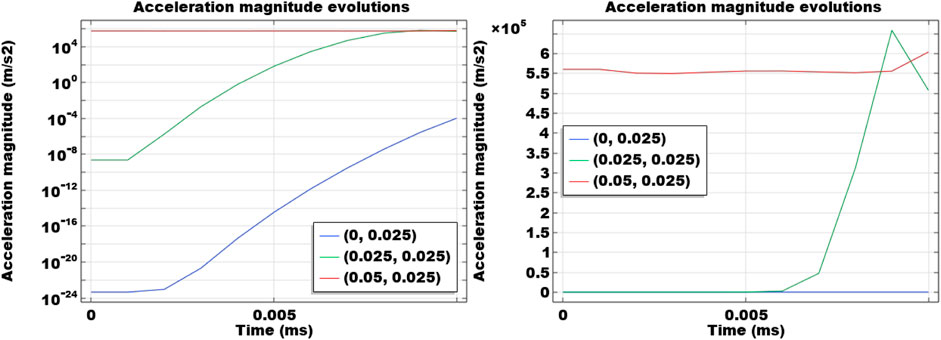
FIGURE 2. Temporal evolutions of acceleration at three locations. Plots are both semi-log and Cartesian.
Figure 3 shows the temporal changes in displacement and strain rate in the x direction at three monitoring points (0 m, 0.025 m), (0.025 m, 0.025 m), and (0.05 m, 0.025 m). Compared to the other two locations, the displacement changes at (0 m, 0.025 m) is nearly negligible. It means that even there are small accelerations at (0 m, 0.025 m), it is relatively small and the induced displacement is insignificant. At (0.025 m, 0.025 m), the displacement increase becomes noticeable in the end. It also shows that it takes time for the boundary load to induce deformation in the solid phase in the middle of the sample. At (0.05 m, 0.025 m), the deformation is induced instantaneously as the boundary load is directly exerted. Results of the strain rate in the x direction are also presented. Since the effect of the impact load on the right boundary is insignificant at (0 m, 0.025 m), the strain rate is nearly 0. At the other two locations, oscillatory patterns of the strain rate in the x direction are observed. This corresponds to the dynamic response induced by the impact load in the sample. The oscillation of strain rate occurs first at the monitoring point of (0.05 m, 0.025 m) than that at the monitoring point of (0.025 m, 0.025 m) due to the distance to the right boundary. However, once it enters into the oscillatory phase, the two monitoring points endure similar patterns of strain rate oscillations. This shows that the model employed in this numerical study can capture the wave propagation patterns caused by the impact load in the dynamic problem.
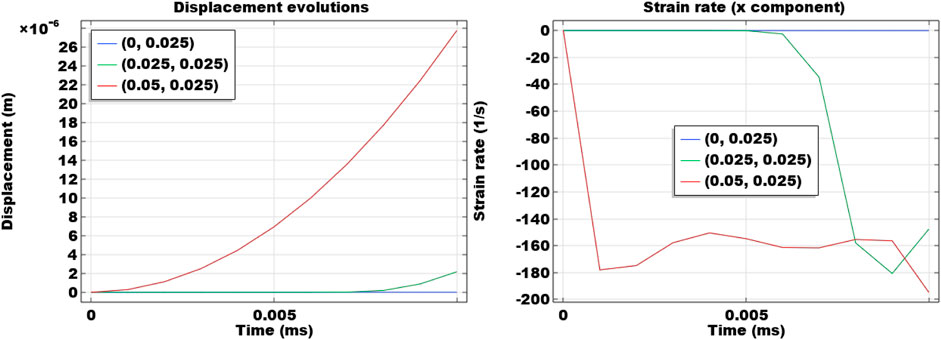
FIGURE 3. Temporal evolutions of displacement and strain rate in the x direction at three locations (0 m, 0.025 m), (0.025 m, 0.025 m), and (0.05 m, 0.025 m).
After the discussion of temporal evolutions of the mechanical responses at certain monitoring points, the spatial distributions are also discussed. Figure 4 shows the distribution of strain rate in the x direction along the horizontal monitoring line (0 m ≤ x ≤ 0.05 m and y = 0.025 m). Results at time steps 0.002 ms, 0.004 ms, 0.006 ms, 0.008 ms, and 0.01 ms are shown. Results indicate that the wave propagation pattern also exists in the strain rate distributions. When the deformation first reaches at a location, the amplitude is relatively great. As the peak moves forward, the amplitude becomes attenuated. The greatest amplitude of the strain rate wave is about 40 1/s. As the loading time increases, the amplitude decreases and the wavelength also decreases. Locations with x ≤ 0.01 m always have 0 strain rates as the effect of the impact load has not traveled to these locations during the simulation time. Figure 5 presents the acceleration distribution at several different time steps. Propagation waves can also be captured and the waveforms are smoother than the strain rate results. Similar to strain rate waveforms, at a certain location, the amplitude of the acceleration distributions also attenuate with time and the wavelength decreases as it moves closer to the right boundary with the impact load. The wave propagation patterns of strain rate and acceleration exhibit similar attenuation trends.
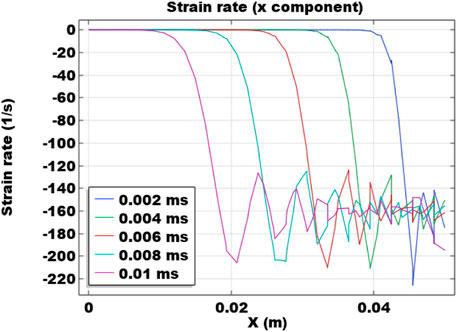
FIGURE 4. Spatial distribution of strain rate in the x direction along the horizontal monitoring line at y = 0.025 m at 0.002 ms, 0.004 ms, 0.006 ms, 0.008 ms, and 0.01 ms.
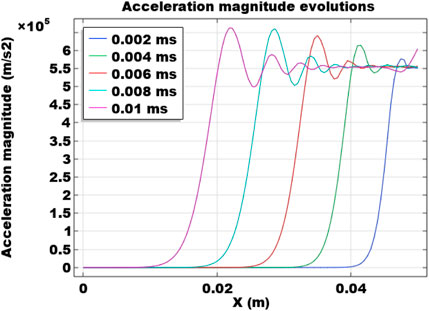
FIGURE 5. Spatial distribution of acceleration magnitude along the horizontal monitoring line at y = 0.025 m at 0.002 ms, 0.004 ms, 0.006 ms, 0.008 ms, and 0.01 ms.
In Figure 6, the distribution of volumetric plastic strain at different time steps of 0.0086 ms, 0.0088 ms, 0.009 ms, 0.0092 ms, 0.0094 ms, 0.0096 ms, 0.0098 ms, and 0.01 ms is plotted. Since the far end does not have significant mechanical responses, the curves are plotted for the end to the external impact load. Results show that, once it enters plasticity, the evolution of this type of material failure magnifies fast. Both the plastic strain magnitude and the plasticity region increase rapidly. It indicates that, due to the increased boundary load, rock failure occurs at and near the traction boundary and damage starts to accumulate.
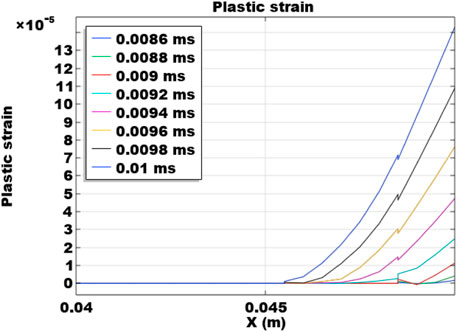
FIGURE 6. Spatial distribution of plastic strain along the horizontal monitoring line at y = 0.025 m at different time steps.
3.2 Loading rate
In the base case, a boundary load of
The acceleration results monitored at three locations (0 m, 0.025 m), (0.025 m, 0.025 m), and (0.05 m, 0.025 m) are presented in Figure 7. It is plotted on a semi-log scale. Compared to Figure 2, it can be seen that when the loading rate is doubled, the acceleration magnitude is also largely increased. This is directly caused by the increased loading rate at the boundary and it is observed at all three plotted locations. The displacement results are also presented in this figure. Compared to the base case results in Figure 3, it can be observed that increasing the loading rate actually decreases the displacement profiles. Only the monitoring location at (0.05 m, 0.025 m) endures deformation, while the other two monitoring locations do not any significant deformation. This is a noticeable difference compared to the displacement results in the base case.
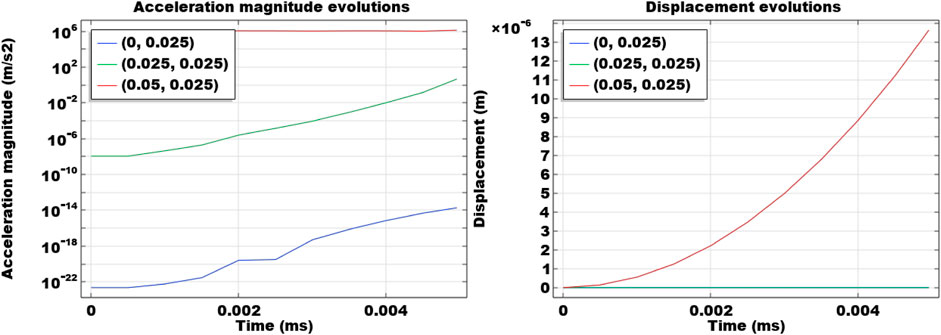
FIGURE 7. Temporal evolutions of acceleration and displacement at three locations (0 m, 0.025 m), (0.025 m, 0.025 m), and (0.05 m, 0.025 m).
Figure 8 shows the spatial distribution of strain rate and acceleration magnitude along the horizontal monitoring line same as the base case. Results are plotted for time steps of 0.001 ms, 0.002 ms, 0.003 ms, 0.004 ms, and 0.005 ms. Compared to the base case, it is clear that increasing the loading rate significantly magnifies the strain rate. The strain rate in the x direction is doubled compared to the base case. The greatest amplitude of the strain rate distribution is nearly 100 1/s. It is significantly increased compared to this value of 40 1/s in the base case. However, the waveform of strain rates travels slower than the base case. Similar trends are observed in the acceleration results. The acceleration waves also travel slower than the base case, while the magnitudes and amplitudes are much higher since the increased loading rate leads to greater accelerations.
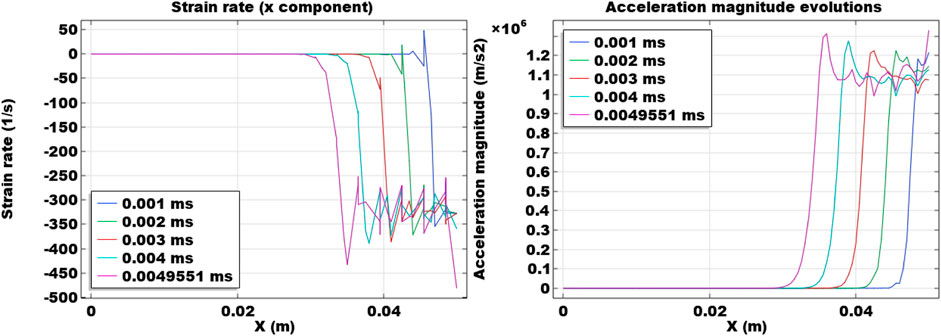
FIGURE 8. Spatial distribution of strain rate and acceleration magnitude along the horizontal monitoring line at y = 0.025 m at 0.001 ms, 0.002 ms, 0.003 ms, 0.004 ms, and 0.005 ms.
Figure 9 shows the plastic strain (volumetric) induced by the impact load with an increased loading rate in this section. Only the last few time steps are presented since the plasticity occurs at these time steps. Increasing the loading rate significantly changes the distribution patterns of plasticity along the monitoring line. The distribution is not monotonical and the oscillatory pattern is also observed. Comparatively, results in the base case are generally gradually decreasing from the impact load boundary. In addition, increasing the loading rate significantly increases the plastic strain magnitudes. The maximum plastic strain in this case is about 10 times of the base case. The area with plasticity is also reduced in this case. These indicate that doubling the loading rate significantly increases the failure, while the plastic region is reduced. Also, due to the dynamic and wavy mechanical response, the propagation of failure from the impact load boundary is not always monotonic and it can be oscillatory in the domain.
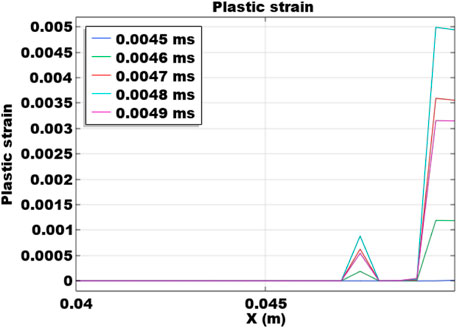
FIGURE 9. Spatial distribution of plastic strain along the horizontal monitoring line at y = 0.025 m at different time steps.
3.3 Loading location
In the base case, the entire right boundary is prescribed with the impact boundary. In this analysis, only a segment of the right boundary is exerted with the impact load. The loading is the same as the base case, while only a 0.1 m-long segment on the right boundary in the middle is exerted with the load.
Figure 10 shows the 2D maps of the x component of stress, the plastic strain, the x component of stress, and the acceleration magnitude at the end of the simulation at 0.01 ms. The location of the boundary load is marked in the plots, which is only on a short segment of 0.1 m compared to 0.5 m of the entire boundary in the base case. Compared to the base case, due to the change in the impact load, the results are no longer uniformly distributed in the y direction. Dissipation patterns can be observed in all four maps. In the
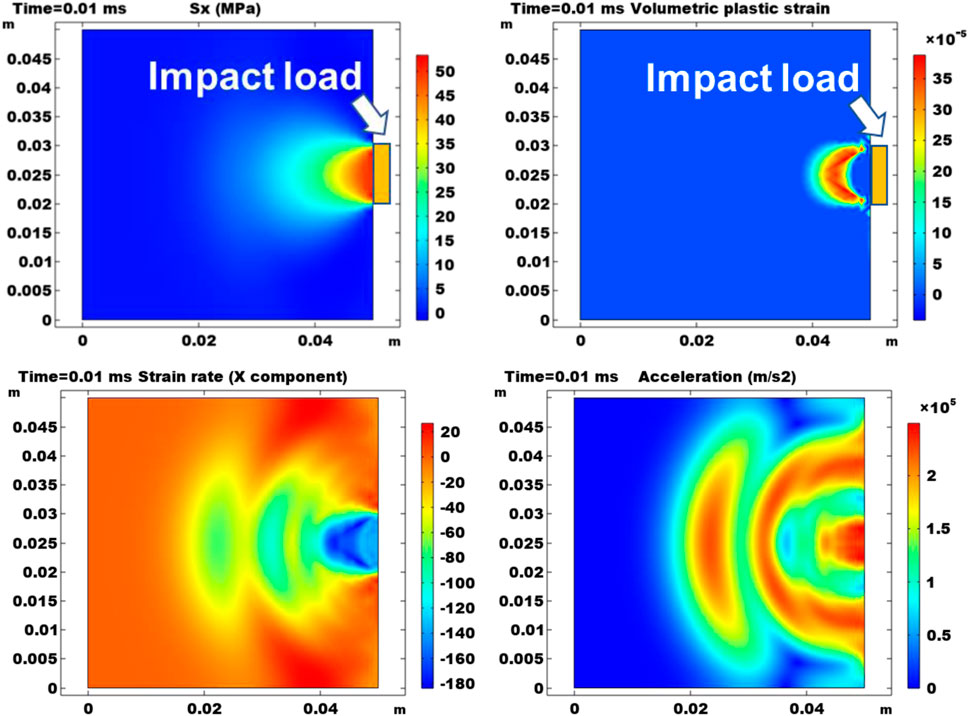
FIGURE 10. Results at the end of the simulation time. Results are 2D plots of the x component of stress, the plastic strain, the x component of stress, and the acceleration magnitude. The location of the impact load boundary is also denoted on the right boundary.
In general, compared with the base case in Figure 2, reducing the length of the impact boundary significantly alters the spatial distribution of stress, plasticity, strain rate, and acceleration at the end of the simulation time.
In addition to the contour map results, temporal and spatial evolutions at some monitoring locations are also discussed. Figure 11 presents the temporal changes in acceleration, displacement, and strain rate in the x direction. At three monitoring points, the curve shapes of acceleration are very similar to the base case and the values are also similar. The curve of the strain rate in the x direction is also oscillatory at (0.025 m, 0.025 m) and (0.05 m, 0.025 m). The greatest magnitude of strain rate becomes lower than the base case, and this is because the impact caused by the exertion of the boundary becomes weaker.
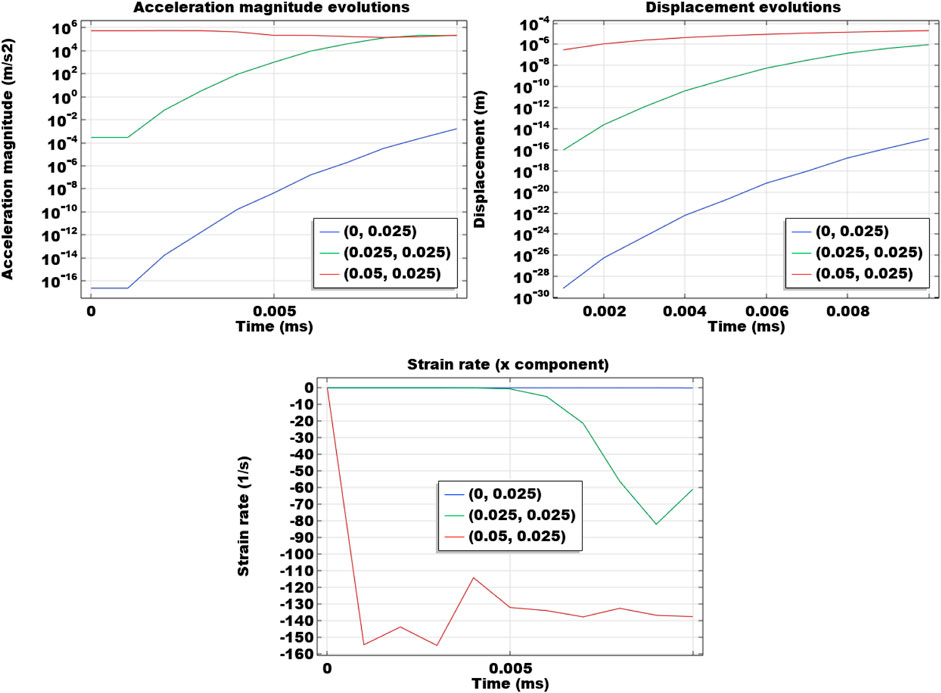
FIGURE 11. Temporal evolutions of acceleration, displacement, and strain rate in the x direction at three locations (0 m, 0.025 m), (0.025 m, 0.025 m), and (0.05 m, 0.025 m).
Then, Figure 12 shows the spatial distributions of acceleration, plasticity, and strain rate in the x direction along the monitoring line at y = 0.025 m at various simulation time steps. Compared to the base case, the spatial distribution patterns of these parameters have been changed considerably. In the acceleration results, the peaks of the waves are no longer the highest near the propagation fronts as in the base case. The waves attenuate as they move into the domain from the impact load boundary. The plastic strain curves become pulse-shaped. After 0.006 ms, plasticity starts to occur at x = 0.043 m. It does not start to occur and peak at the impact load boundary, which is largely different from the base case. The pulse-shaped plasticity profile then gradually magnifies at this location and propagates to the left and to the right. The strain rate curves are changed similarly to the acceleration curves. The peak strain rate attenuates as it moves away from the boudanry.
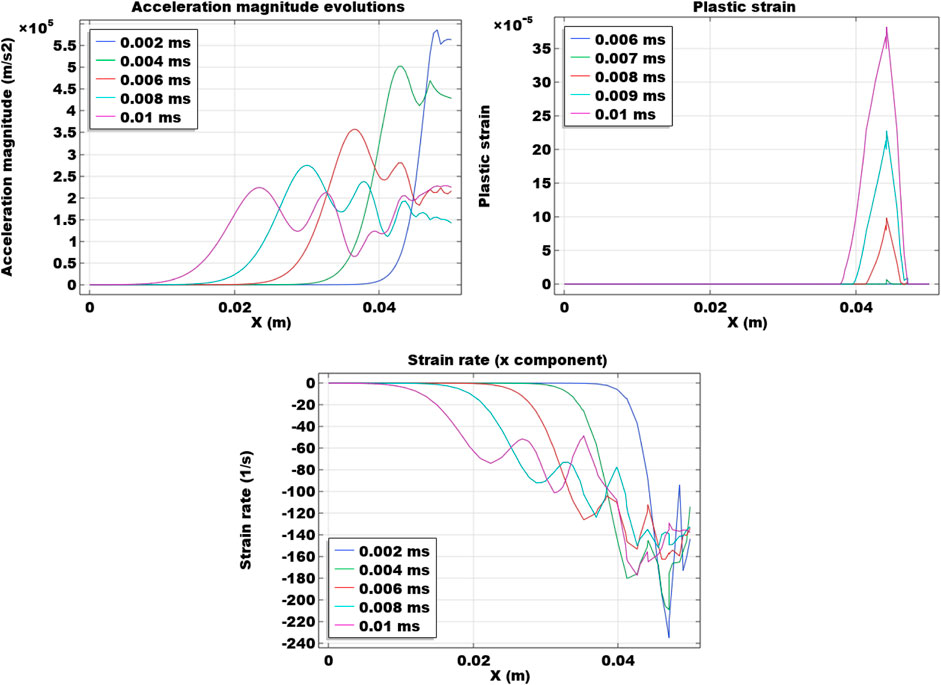
FIGURE 12. Spatial evolutions of acceleration, plasticity, and strain rate in the x direction at different time steps.
3.4 Heterogeneity
After the analysis using the homogeneous assumption, this section is aimed at the mechanical response in a domain with heterogenous mechanical properties. The base case is based on the homogeneous rock material properties: Young’s modulus = 30 GPa; Poisson’s ratio = 0.2; rock density = 2,600 kg/m3; cohesion = 8 MPa; internal friction angle = 30°. In this study, another rock material is used. It has the following properties: Young’s modulus = 40 GPa; Poisson’s ratio = 0.1; rock density = 2,600 kg/m3; cohesion = 12 MPa; internal friction angle = 20°. This material is embedded in the 2D domain. The domain is equally divided into five layers. Three layers are the same as the base case and two embedded layers are the new rock material. Each of the five layers is 0.01 m thick. The heterogeneity is only in the y direction while the x direction is not heterogeneous. The boundary impact load is on the right and it is exerted on the entire boundary.
Figure 13 shows the 2D maps of the x component of stress, the plastic strain, the x component of stress, and the acceleration magnitude at the end of the simulation time 0.01 ms. Compared to the homogeneous scenarios in previous results, it is distinguishable that the introduction of heterogeneity changes the mechanical response in the dynamic domain. The stress result indicates that the new material leads to layered mechanical response. Since the new material has more brittle elastic properties, it can be noted that the propagation of
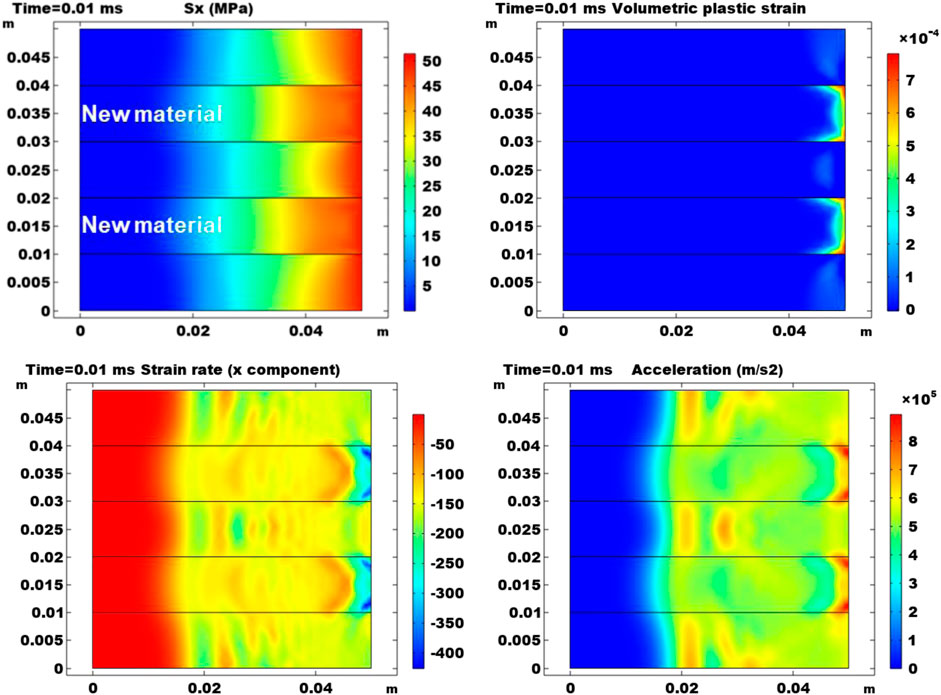
FIGURE 13. Results at the end of the simulation time in the heterogeneous case. Results are 2D plots of the x component of stress, the plastic strain, the x component of stress, and the acceleration magnitude. Two layers with the new material are marked in the plot.
3.5 Discussion
The numerical analysis provides insights into the behavior and stability of reservoir rocks during hydraulic fracturing operations. The captured dissipative and propagative patterns in the mechanical field under impact loads are of particular importance. The observed waveforms of strain rate, plasticity, and acceleration demonstrate that the dynamic model captures the dynamic response of reservoir rocks at the beginning of hydraulic fracturing operations. This is in contrast to the quasi-static assumption, which would fail to capture or quantify these behaviors. Understanding the dynamic response is important for the quantification of fracture initiation and propagation in reservoir rocks.
Increasing the loading rate leads to higher magnitudes of strain rate, acceleration, and plasticity in the domain. This finding suggests that higher loading rates during hydraulic fracturing operations can induce more significant dynamic responses in the reservoir rocks. The increased strain rate and acceleration magnitudes indicate a potential for enhanced fracture propagation and stimulated reservoir volume. However, it is important to note that the regions experiencing these induced responses become smaller compared to cases with lower loading rates due to shorter exertion time. This can guide the design of hydraulic fracturing operations.
The significant strain rate and acceleration responses, which are observed at and near the impact load boundary, have direct implications for fracture initiation and propagation. These responses can indicate areas of high stress concentrations and potential fracture development. However, the study also reveals that strain rate and acceleration responses can occur within the domain due to wavy propagation patterns. This highlights the importance of considering the potential for induced responses away from the direct impact load boundary. It emphasizes the need for fracture containment and control during hydraulic fracturing operations to avoid unwanted fracture initiation.
Heterogeneity has a direct impact on the mechanical response in reservoir rocks. The presence of different material properties within the rock formations can influence stress propagation, plasticity, and strain rate patterns. The observed stronger stress and plasticity responses in more elastic domains suggest that these areas are prone to higher stress concentrations and potential fracture development. On the other hand, less elastic domains exhibit smaller plastic strains and weaker stress responses, indicating potentially more stable regions. Understanding the heterogeneity-induced variations in the mechanical response is crucial for optimizing hydraulic fracturing designs and targeting zones with favorable mechanical properties.
The observed responses in the numerical analysis provide insights into the behavior and stability of reservoir rocks during hydraulic fracturing operations. By considering factors such as loading rate, loading location, and rock heterogeneity, engineers and geoscientists can better understand the dynamics of fracture initiation, propagation, containment, and stability. This knowledge is essential for optimizing hydraulic fracturing designs, minimizing risks associated with unwanted fracture growth, and ensuring the safe and efficient development of hydrocarbon-bearing reservoirs.
4 Conclusion
This study presents an elastoplastic model considering the dynamic effects. Plasticity, acceleration, and strain rate’s wavy propagation patterns induced by the impact load boundary have been quantified and discussed. Some conclusions are drawn.
(1) When the impact load is uniformly exerted on a boundary, the propagation of plasticity is monotonic in the rock. However, when the impact load is partially exerted on a boundary, dissipative and propagative patterns of mechanical responses such as strain and deformation are induced and the occurrence of plasticity is not always initiated at the impact load boundary.
(2) Increasing the impact loading rate can magnify the magnitudes of plasticity, strain rate, and acceleration. However, since the load is more rapidly exerted, the distribution range and magnitude of deformation are reduced. The distribution ranges of plasticity, strain rate, and acceleration are also reduced. This process is highly nonlinear due to the plastic nature of the problem. There is no thresholds since the determination of plasticity is jointly governed by the mechanical properties and the boundary conditions.
(3) The existence of heterogeneity leads to different mechanical response behaviors. In the layered heterogeneity investigated in this study, more elastic layers have more drastic mechanical responses and greater strain rate, acceleration, and plasticity propagations. The observation here serves as a reference for the understanding of the containment of failure and fracture initiation in layered formations.
5 Recommendation
Based on the observations in this study, some recommendations are brought up. Uniform loading is preferred at the contact boundary between the fluid loading and the reservoir rock, as it can induce failures from perforated locations in the casing. Also, the effect of the size and location of perforations and how it affects plasticity evolution can be related to the loading location investigation in this study. Although large loading rates (or high pumping rate) are wanted for faster failure creation and greater damage accumulation, the exertion of the loading should be maintained long enough so that the near-well regions are effectively impacted. Note that these recommendations are only focused on the limited near-well region on the millisecond scale instantaneously after the start of hydraulic fracturing, and this is focused on the accumulation of failures at these very early stages.
Data availability statement
The raw data supporting the conclusion of this article will be made available by the authors, without undue reservation.
Author contributions
AA, LW, and CZ wrote the manuscript. BC and XX performed analyses and produced plots. PJ and JL reviewed and modified the original manuscript. All authors contributed to the article and approved the submitted version.
Conflict of interest
Authors AA, LW, CZ, BC, and XX were employed by PetroChina Xinjiang Oilfield Company. Author PJ was employed by Beijing Gas Group Company Limited.
The remaining author declares that the research was conducted in the absence of any commercial or financial relationships that could be construed as a potential conflict of interest.
Publisher’s note
All claims expressed in this article are solely those of the authors and do not necessarily represent those of their affiliated organizations, or those of the publisher, the editors and the reviewers. Any product that may be evaluated in this article, or claim that may be made by its manufacturer, is not guaranteed or endorsed by the publisher.
References
Aghababaei, M., Behnia, M., and Moradian, O. (2019). Experimental investigation on strength and failure behavior of carbonate rocks under multistage triaxial compression. Int. J. Rock Mech. Min. Sci. 123, 104099. doi:10.1016/j.ijrmms.2019.104099
Baumgarten, L., and Konietzky, H. (2013). “Investigations on the fracture behaviour of rocks in a triaxial compression test,” in ISRM international symposium-EUROCK 2013 (Wroclaw, Poland: OnePetro).
Chen, A., Guo, X., Yu, H., Huang, L., Shi, S., and Cheng, N. (2021a). A parametric study of hydraulic fracturing interference between fracture clusters and stages based on numerical modeling. Energy Explor. Exploitation 39 (1), 65–85. doi:10.1177/0144598720953257
Chen, A., Ji, J., Lin, J., Chen, H., Wang, X., Lin, J., et al. (2021b). Experimental and numerical investigation of characteristics of highly heterogeneous rock mechanical responses in tight sandy conglomerate reservoir rock under tri-axial compression. Front. Earth Sci. 9, 735208. doi:10.3389/feart.2021.735208
Chung, J., and Hulbert, G. M. (1993). A time integration algorithm for structural dynamics with improved numerical dissipation: the generalized-α method. J. Appl. Mech. 60 (2), 371–375. doi:10.1115/1.2900803
Fakhimi, A., Azhdari, P., and Kimberley, J. (2018). Physical and numerical evaluation of rock strength in Split Hopkinson Pressure Bar testing. Comput. Geotechnics 102, 1–11. doi:10.1016/j.compgeo.2018.05.009
Guo, X., Huang, L., Jin, Y., Lin, B., and Lin, J. (2021a). “An experimental study of the rock mechanical properties in highly heterogeneous reservoir rocks of tight sandy conglomerates,” in ARMA/DGS/SEG international geomechanics symposium (United States: OnePetro).
Guo, X., Jin, Y., Zi, J., and Lin, B. (2021b). Numerical investigation of the gas production efficiency and induced geomechanical responses in marine methane hydrate-bearing sediments exploited by depressurization through hydraulic fractures. Energy & Fuels 35 (22), 18441–18458. doi:10.1021/acs.energyfuels.1c02569
Guo, X., Jin, Y., Zi, J., Lin, J., and Zhu, B. (2023). A 3D modeling study of effects of heterogeneity on system responses in methane hydrate reservoirs with horizontal well depressurization. Gas Sci. Eng. 115, 205001. doi:10.1016/j.jgsce.2023.205001
He, J., Okere, C. J., Su, G., Hu, P., Zhang, L., Xiong, W., et al. (2021). Formation damage mitigation mechanism for coalbed methane wells via refracturing with fuzzy-ball fluid as temporary blocking agents. J. Nat. Gas Sci. Eng. 90, 103956. doi:10.1016/j.jngse.2021.103956
Hou, B., Chang, Z., Fu, W., Muhadasi, Y., and Chen, M. (2019). Fracture initiation and propagation in a deep shale gas reservoir subject to an alternating-fluid-injection hydraulic-fracturing treatment. Spe J. 24 (04), 1839–1855. doi:10.2118/195571-pa
Hou, Y., Peng, Y., Chen, Z., Liu, Y., and Tian, Y. (2022a). Investigating heterogeneous distribution of fluid pressure in hydraulic fractures during pulsating hydraulic fracturing. J. Petroleum Sci. Eng. 209, 109823. doi:10.1016/j.petrol.2021.109823
Hou, Y., Peng, Y., Chen, Z., Liu, Y., Zhang, G., Ma, Z., et al. (2021). Investigation on the controlling factors of pressure wave propagation behavior induced by pulsating hydraulic fracturing. SPE J. 26 (05), 2716–2735. doi:10.2118/205384-pa
Hou, Y., Peng, Y., Liu, Y., Chen, Z., Fan, B., Yin, Z., et al. (2022b). Influence of increasing mean stress on fatigue properties of shale during pulsating hydraulic fracturing. Energy & Fuels 36 (23), 14174–14186. doi:10.1021/acs.energyfuels.2c03064
Kim, D., Sirijaroonchai, K., El-Tawil, S., and Naaman, A. E. (2010). Numerical simulation of the Split Hopkinson Pressure Bar test technique for concrete under compression. Int. J. Impact Eng. 37 (2), 141–149. doi:10.1016/j.ijimpeng.2009.06.012
Kluge, C., Blöcher, G., Barnhoorn, A., and Bruhn, D. (2020). Hydraulic-mechanical properties of microfaults in granitic rock using the Punch-Through Shear test. Int. J. Rock Mech. Min. Sci. 134, 104393. doi:10.1016/j.ijrmms.2020.104393
Lecampion, B., Bunger, A., and Zhang, X. (2018). Numerical methods for hydraulic fracture propagation: a review of recent trends. J. Nat. Gas Sci. Eng. 49, 66–83. doi:10.1016/j.jngse.2017.10.012
Li, Q., Lu, Y., and Meng, H. (2009). Further investigation on the dynamic compressive strength enhancement of concrete-like materials based on split Hopkinson pressure bar tests. Part II: numerical simulations. Int. J. Impact Eng. 36 (12), 1335–1345. doi:10.1016/j.ijimpeng.2009.04.010
Okere, C. J., Sheng, J. J., Fan, L. K., Huang, X. W., Zheng, L. H., and Wei, P. F. (2023). Experimental study on the degree and damage-control mechanisms of fuzzy-ball-induced damage in single and multi-layer commingled tight reservoirs. Petroleum Sci. 2023, 17. doi:10.1016/j.petsci.2023.05.017
Okere, C. J., Su, G., Zheng, L., Cai, Y., Li, Z., and Liu, H. (2020). Experimental, algorithmic, and theoretical analyses for selecting an optimal laboratory method to evaluate working fluid damage in coal bed methane reservoirs. Fuel 282, 118513. doi:10.1016/j.fuel.2020.118513
Prabhu, S., and Qiu, T. (2022). Simulation of split Hopkinson pressure bar tests on sands using the discrete-element method. Int. J. Geomechanics 22 (2), 06021036. doi:10.1061/(asce)gm.1943-5622.0002262
Togashi, Y., Kikumoto, M., and Tani, K. (2017). An experimental method to determine the elastic properties of transversely isotropic rocks by a single triaxial test. Rock Mech. Rock Eng. 50, 1–15. doi:10.1007/s00603-016-1095-9
Wang, L., Guo, X., Zheng, G., Yu, P., Wang, W., Jin, Y., et al. (2022b). Effects of parent well spacing on the poroelastic behaviors in the infill zone in shale oil reservoirs: a case study in jimsar shale oil, China. Energy Sci. Eng. 10 (4), 1043–1054. doi:10.1002/ese3.1059
Wang, L., Li, Y., Xu, D., Gao, Y., Zhang, J., He, J., et al. (2022a). Evolution of near-well damage caused by fluid injection through perforations in wellbores in low-permeability reservoirs: a case study in a shale oil reservoir. Lithosphere 2022 (12), 3824011. doi:10.2113/2022/3824011
Wei, S., Kuru, E., Jin, Y., and Yang, X. (2022). Numerical investigation of the factors affecting the cement sheath integrity in hydraulically fractured wells. J. Petroleum Sci. Eng. 215, 110582. doi:10.1016/j.petrol.2022.110582
Xia, Y., Jin, Y., Chen, M., and Chen, K. (2017). Poroelastodynamic response of a borehole in a non-hydrostatic stress field. Int. J. Rock Mech. Min. Sci. 93, 82–93. doi:10.1016/j.ijrmms.2017.01.008
Zhang, Y., Okere, C. J., and Su, G. (2021). Effect of loading rates on accurate in-situ stress determination in different lithologies via Kaiser effect. Arabian J. Geosciences 14, 1304–1308. doi:10.1007/s12517-021-07674-3
Zhi, D., Guo, X., Wang, W., Jin, Y., Liu, C., Chen, G., et al. (2021). Fracturing and production analysis of the efficacy of hydraulic fracture stage reduction in the improvement of cost-effectiveness in shale oil development: a case study of jimsar shale oil, China. Energy Sci. Eng. 9 (9), 1337–1348. doi:10.1002/ese3.940
Keywords: rock mechanics, simulation, hydraulic fracturing, elasticity, plasticity
Citation: Abulimiti A, Wang L, Zang C, Chen B, Xiang X, Jiang P and Lin J (2023) A study of effects of different impact loads on the dynamic and elastoplastic behavior in reservoir rocks at the beginning of hydraulic fracturing. Front. Earth Sci. 11:1219158. doi: 10.3389/feart.2023.1219158
Received: 08 May 2023; Accepted: 08 August 2023;
Published: 21 August 2023.
Edited by:
Peng Tan, CNPC Engineering Technology R&D Company Limited, ChinaReviewed by:
Jun Liu, Sichuan University, ChinaChinedu J. Okere, Texas Tech University, United States
Copyright © 2023 Abulimiti, Wang, Zang, Chen, Xiang, Jiang and Lin. This is an open-access article distributed under the terms of the Creative Commons Attribution License (CC BY). The use, distribution or reproduction in other forums is permitted, provided the original author(s) and the copyright owner(s) are credited and that the original publication in this journal is cited, in accordance with accepted academic practice. No use, distribution or reproduction is permitted which does not comply with these terms.
*Correspondence: Bo Chen, ZnczLWNoZW5ib0BwZXRyb2NoaW5hLmNvbS5jbg==; Jiaying Lin, bGluankxMjIzQDE2My5jb20=