 Kuikui Hou
 Mingde Zhu1,2
 Yingjie Hao
95% of researchers rate our articles as excellent or good
Learn more about the work of our research integrity team to safeguard the quality of each article we publish.
Find out more
ORIGINAL RESEARCH article
Front. Earth Sci. , 06 July 2023
Sec. Economic Geology
Volume 11 - 2023 | https://doi.org/10.3389/feart.2023.1216667
This article is part of the Research Topic Coal and Rock Dynamic Disasters: Advances of Physical and Numerical Simulation in Monitoring, Early Warning, and Prevention, volume II View all 29 articles
The construction of deep underground engineering is greatly influenced by complex geological conditions such as high stress, faults, and fracture zones, which significantly affects the stability of the project. Taking the construction of 1,915-m-deep shaft in Sanshandao Gold Mine as the engineering background, which passes through many different strata and multiple fracture zones, the stability evaluation and failure zone prediction during its excavation under the influence of high stress, uneven strata, and fault structure are studied. Results show that the range of the failure zone increases significantly when the shaft passes through the fracture zone or different lithologies, and the maximum depth is 5.28 m. When the distance between the rock mass in the borehole and the excavation face is greater than 48 m, the disturbance superposition effect basically disappears. This paper provides theoretical and data support for the design and construction of the kilometer-deep shaft in Sanshandao Gold Mine.
With the depletion of shallow resources, metal mines at domestic and abroad have gradually entered the stage of deep mining. As the first project of deep mining, the construction of deep shafts has become the primary problem to be solved. Overviewing the deep mining activities at domestic and abroad, many deep shafts with a depth of over 2,000 m have been built and operated in South Africa, Canada, the United States, and Russia. The deep shafts that have been built in China include the main and auxiliary shafts of Sishanling Iron Mine of Jianlong Group, with depths of 1,505 and 1,503.9 m, respectively, the No. 3 shaft of Huize lead–zinc mine in Yunnan Province, with a depth of 1,526 m, and the new main shaft of Xincheng Gold Mine in the Shandong Gold Group, with the depth of 1,527 m. However, there are few engineering examples of shafts deeper than 1,500 m (Zhao, 2018; Tan et al., 2021). The deep shaft, with a depth of over 1,000 m, passes through multi-layer non-uniform complex strata, faults, and fracture zones of different scales during the construction process. Therefore, due to the influence of high stress and complex geological conditions, there are obvious regional differences in the mechanical response characteristics of the surrounding rock on the shaft wall during its construction, bringing difficulties to the stability control of the rock mass during the construction process (Kaiser et al., 1983; Gao et al., 2009; He et al., 2009; Wang et al., 2009; Qian and Zhou, 2018; Zhang and Zhou, 2020; Wang et al., 2022; Li et al., 2023; Zhang et al., 2023).
Experts in the field of shaft construction and rock mechanics have carried out many research studies on borehole stability when shafts or tunnels pass through rock mass of different strata (Liu et al., 2016; Song et al., 2018; Walton et al., 2018; Cheng et al., 2020; Li and Wang, 2020; Huang et al., 2022). Sun et al. (2020) utilized UDEC software combined with surface subsidence monitoring to analyze the stress and displacement meter damage changes in rock mass of a shaft of Jinchuan Group at different mining stages of the ore body and pointed out that as the mining activities pass through the upper and lower parts of the fault, it will be activated in different ways, and suggestions were made for the stability of the shaft during the operation. Gao et al. (2021) analyzed the stress distribution of the surrounding rock in granite and homogeneous mixed rock strata using FLAC3D and demonstrated clear requirements for the strengthening of the lining concrete, aiming at the wall cracking of the west second auxiliary shaft of Longshou Mine in the Jinchuan mining area. Feng et al. (2012) pointed out that the instability and failure of the tunnel mostly occurred in the contact zone of soft and hard rocks and studied the stress distribution during excavation using FLAC3D. It was concluded that there is obvious stress concentration and uneven distribution in the soft and hard rock foundation zone after tunnel excavation. The stress is concentrated in hard rock, whereas a certain degree of stress release occurs in the soft rock area. The plastic zone of soft rock is significantly larger than that of hard rock. Yassaghi and Salari-Rad (2004) illustrated that the stress concentration occurs when the tunnel passes through the fault zone. The convergence value of the roadway near the fault zone is approximately 3% higher than that of the normal area. The deformation of the tunnel gradually stabilizes after 1 month of excavation. Sun et al. (2018) used 3DEC to analyze the deformation characteristics of rock mass and borehole when the shaft passes through different lithologies and pointed out that shear stress concentration occurs in the contact zone of soft and hard rocks, where the depth of the plastic zone is the largest, forming a pressure relief zone.
The aforementioned research studies analyze the deformation law and instability mode of surrounding rock and supporting system when the shaft or tunnel passes through different strata or fault zones at different angles. However, in view of the lack of systematic research on crossing multi-layer non-uniform complex strata during construction, this paper uses FLAC3D to analyze stability and evaluate failure zone prediction of the 1,915-m auxiliary shaft of Sanshandao Gold Mine, which is the deepest shaft in China and the fourth deepest shaft in Asia. First, the failure proximity index is introduced for rock mass stability analyzation. Meanwhile, the size characteristics and variation law of the failure zone are predicted. The study provides theoretical and foundation data support for shaft construction and its long-term stability.
On the purpose of the construction of a 1,915-m auxiliary shaft in Sanshandao Gold Mine, a 2,017-m prospecting hole was drilled in the center of the shaft; the wellhead elevation was 15 m. During the drilling process, the core investigation, in situ stress test, and rock mechanics experiments were carried out simultaneously, which obtained the distribution of strata, the variation law of in situ stress, and the mechanical parameters of rock mass in this deep shaft, respectively. According to the results of the in situ stress test, its three-dimensional variation law (Hou et al., 2022) is shown in Eq. 1. The investigation results showed that the auxiliary shaft of Sanshandao Gold Mine passes through seven different lithologies and six obvious fracture structures during its construction. Based on the results of rock mechanics experiment and rock mass quality classification, the whole length of the geological exploration borehole was divided into 18 areas with the lithology boundary and fault as the interface, as shown in Figure 1. According to the results of engineering exploration, it can be seen that the 1,915-m auxiliary shaft of Sanshandao Gold Mine is affected by the combined action of complex geological conditions such as uneven strata, high stress, and fault structure, which inevitably leads to the deformation and failure characteristics of borehole rock mass showing significant regional differences.
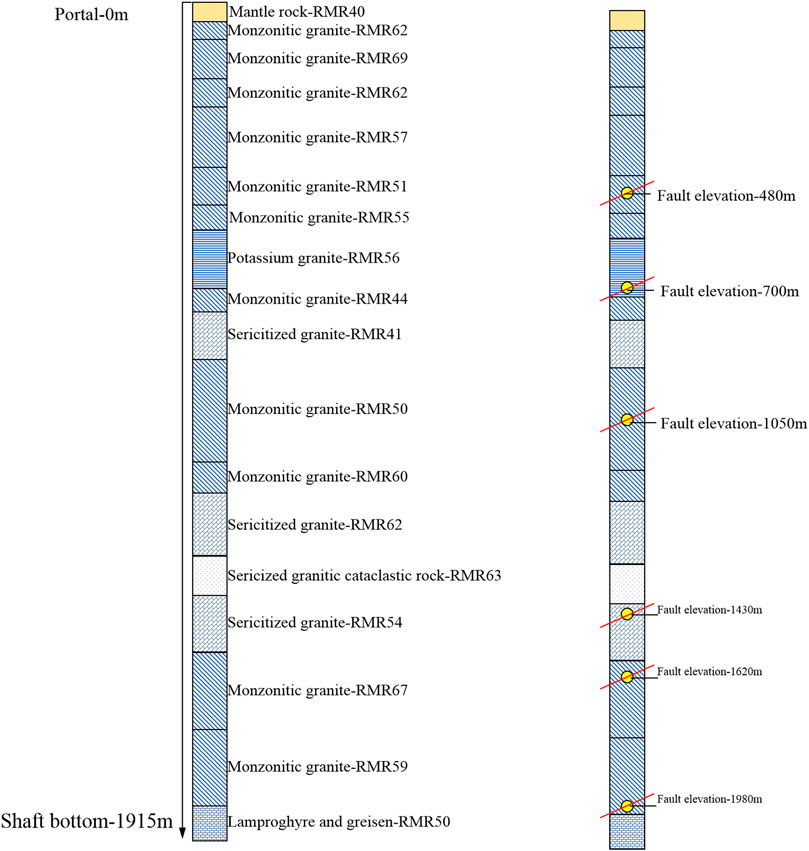
FIGURE 1. Diagram of the shaft crossing different strata.
where H is the depth of rock mass, σH is the maximum horizontal principal stress, σh is the minimum horizontal principal stress, and σv is the vertical principal stress.
According to the results of the rock mass quality investigation and in situ stress test of the exposed strata, a refined numerical calculation model of the auxiliary shaft of Sanshandao Gold Mine was established, and the corresponding rock mechanics parameters were assigned to the 18 rock mass regions. The excavation response characteristics of rock mass under the combined influence of stress state, uneven strata, and faults were analyzed, and the stability of surrounding rock was evaluated. Since the design diameter of this shaft section was 10.5 m, the diameter of this model was set to 10.5 m, as shown in Figure 2. In order to eliminate the boundary effect of the model, its scale was set to 3–5 times of the engineering scale. Meanwhile, the model size was 100 m × 100 m × 2,200 m, and the single excavation footage of this model was 5.0 m.
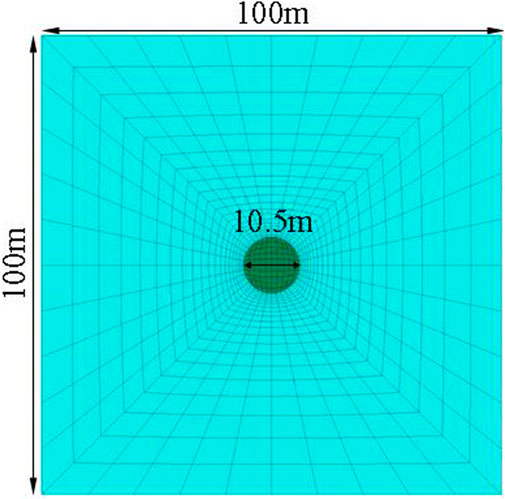
FIGURE 2. Section of numerical calculation model.
In this paper, the Hoek–Brown criterion (Sun et al., 2011; Hoek and Brown, 2019; Renani and Cai, 2021) was used to carry out numerical simulation. The boundary conditions were the normal displacement constraints on the left, right, front, back, and upper boundaries of the model and the three-way fixed displacement constraints at the bottom. The stress conditions of the model were set according to the in situ stress results, and the calculation expression of rock mechanical parameters is given as follows:
where φ represents the internal friction angle of rock mass, c represents cohesion, and σT represents the tensile strength of rock mass. fa = (1 + a) (2 + a) and fb = 6amb, fc = (s + mbσ3n)a−1, where σ3n = σ3max/σci, σ3max = 0.47σcm [σcm/γH]−0.94, and σcm represents the rock mass strength, σcm = σci[mb + 4s-a (mb-8s) (mb/(4+s))a−1]/2fa. Furthermore, a, s, and mb represent Hoek–Brown material parameters related to rock damage.
The value mi in the aforementioned formula is the empirical parameter of rock dimension, which is obtained using the following empirical formula (Zhang et al., 2019):
GSI is a geological strength index, which can be estimated from the RMR (rock mass classification index) value. The empirical relationship between RMR and GSI is obtained from Zhang et al. (2019) as follows:
D is the coefficient of the disturbance degree of blasting or stress release to rock mass, and its value ranges from 0 (not disturbed) to 1 (the maximum disturbance), and the disturbance parameter D is 0.2. Parameters obtained from the aforementioned formulas are summarized in Table 1.
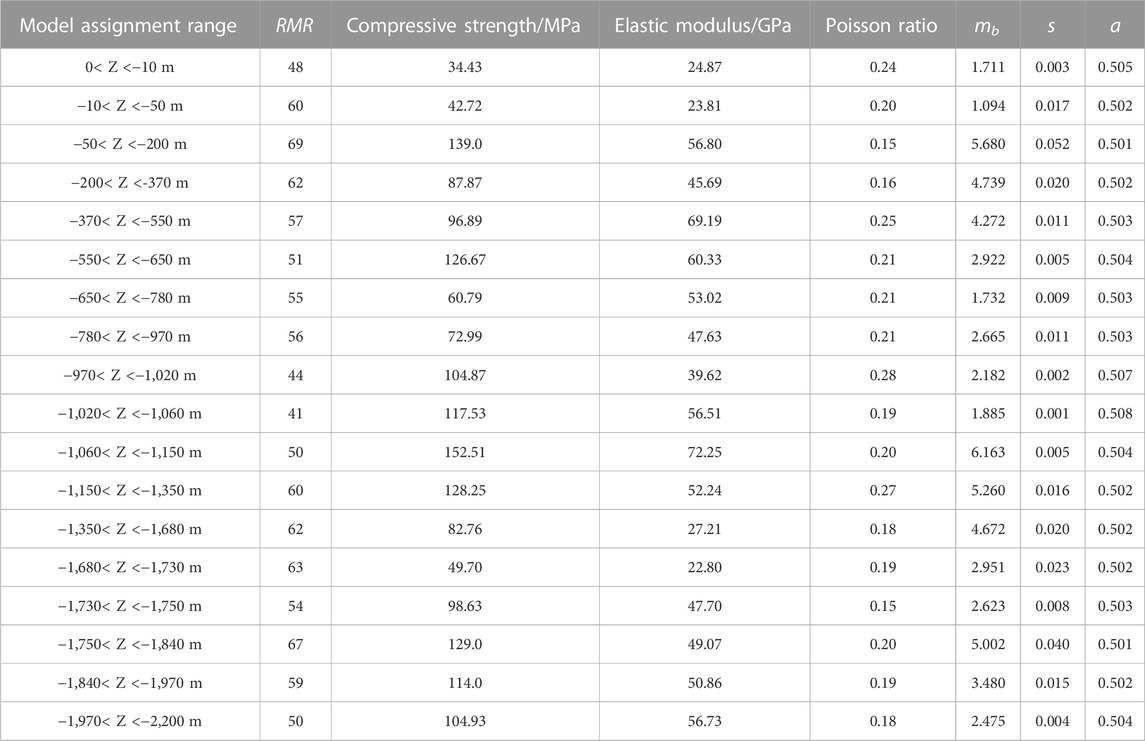
TABLE 1. Material assignment parameters.
The plastic zone obtained according to the current failure criterion can only determine the range of the damage zone and cannot further quantify its damage degree. Therefore, the damage proximity index (Liu et al., 2009; Zhang et al., 2011) is used to evaluate the failure of the rock mass. FAI is a comprehensive quantitative evaluation index of risk degree, and its calculation expression is given as follows:
where FD is the degree of failure and ω is the complementary parameter of yield approachability YAI, given as ω = 1 − YAI, where YAI is the yield approachability function. The formula of yield approachability function based on the Hoek–Brown criterion is as follows:
where θσ is the stress lode angle; σπ and τπ are normal stress and shear stress components of the plane, respectively; γ is the rock mass density; H is the depth of embedment;
In summary, the FAI index can be used to characterize the rock failure degree intuitively and quantitatively. Moreover, it can predict the distribution and size of the rock failure zone after shaft excavation. When FAI ≥ 2.0, the rock is seriously broken and failure occurs. In this paper, the area with FAI ≥ 2.0 is defined as the instability zone.
As shown in Figures 3, 4, with the increase in buried depth, the maximum principal stress of the surrounding rock also increases. However, due to the influence of uneven strata, the maximum principal stress changes non-linearly with the increase in buried depth, and it experiences a significant increase or decrease in some areas. It shows a critical decrease at the depth from −680 to −780 m, −1,680 to −1,750 m, and −1,820 to −2,050 m. The comparative analysis shows that the mechanical properties of the rock mass corresponding to these three areas are lower than those of the adjacent strata and the rock mass is weak and broken, which indicates that the reduction degree of the maximum principal stress is critically influenced by the difference in mechanical properties between adjacent strata. The maximum principal stress increases strongly in the two areas of buried depths from −1,050 to −1,350 m and −1,750 to −1,850 m. The rock mass in the aforementioned two areas is relatively complete and hard, whereas the stress concentration effect on the surrounding rock is significant. The maximum principal stress value at the fault reduced obviously, and its reduction value differs with the increase in buried depth. When the buried depth is less than 500 m, the reduction value caused by the fault is 10 MPa. Compared with the buried depth from 500 to 1,200 m, its value is 15 MPa. When the buried depth is greater than 1,200 m, it could reach 20 MPa. Therefore, with the increase in buried depth, the initial in situ stress increases, and the unloading effect at the fault caused by shaft excavation is significant, which indicates that the support should be strengthened.
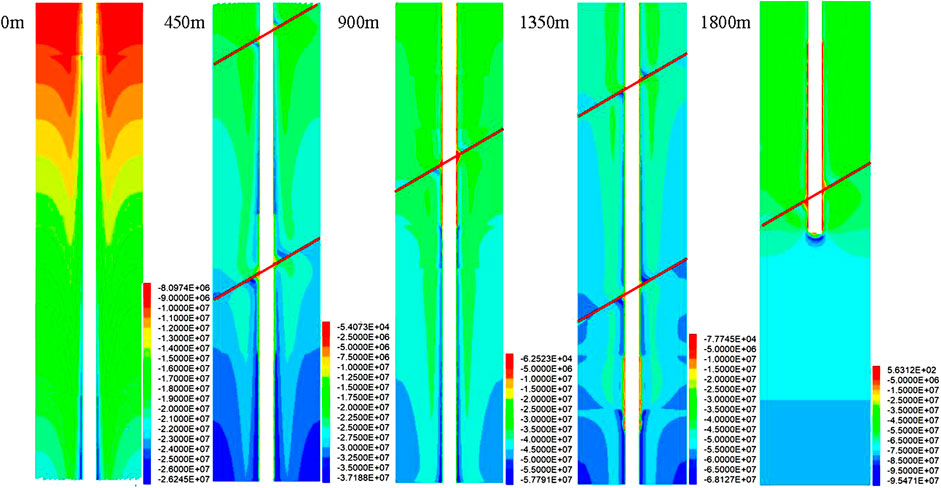
FIGURE 3. Cloud diagram of the maximum principal stress of the surrounding rock after deep shaft excavation.
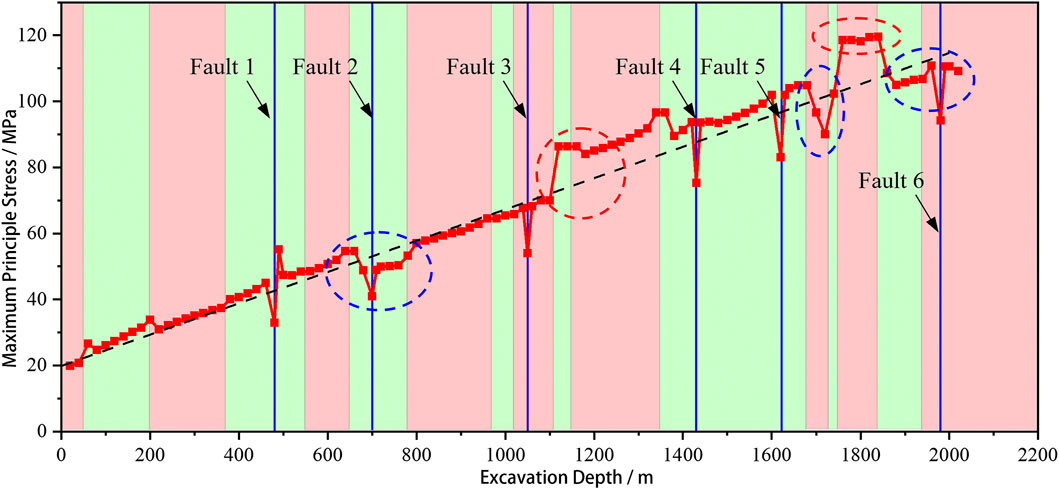
FIGURE 4. Variation law of maximum principal stress with excavation depth.
Figures 5, 6 show that the pressure relief zone is generated near the borehole, and the depth of the pressure relief zone at the fault position is obviously increased. According to the distribution of the minimum principal stress, it is obviously reduced from −650 to −1,150 m, −1,350to −1,650 m, and −1,850 to −1,980 m, respectively, with a critical unloading phenomenon, which demonstrates the support system on the borehole should be strengthened, and the forced state of the borehole is changed from compression to tension due to the existence of fault. It further aggravated the risk of borehole caving.
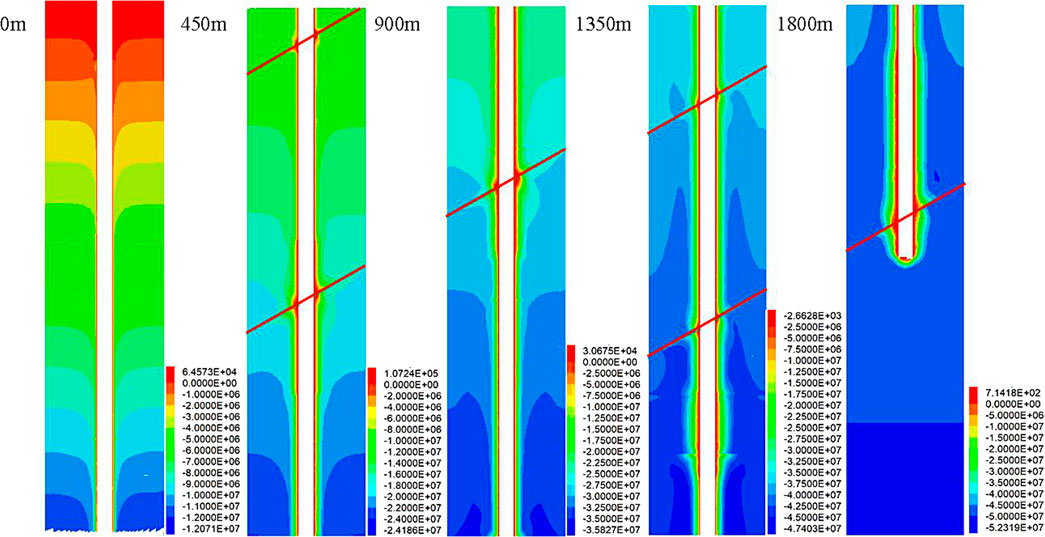
FIGURE 5. Cloud diagram of the minimum principal stress of the surrounding rock after deep shaft excavation.
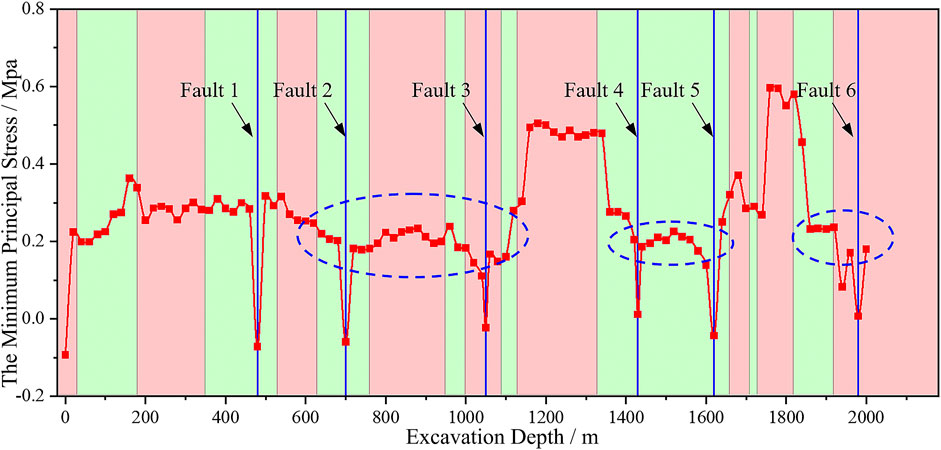
FIGURE 6. Variation in minimum principal stress with excavation depth.
As shown in Figures 7, 8, with the increase in buried depth, the displacement of the borehole shows an increasing trend. Affected by uneven strata, the displacement of surrounding rock increases sharply in some areas. The displacement increases sharply in the depth from −650 to −1,050 m, −1,350 to −1,750, and −1,850 to −1,950 m. Among the non-fault areas from −1,680 to −1,720 m, it reaches the maximum value of 75.75 mm. By analyzing the distribution law of the initial maximum principal stress direction, the minimum principal stress direction, and the displacement of rock mass in the area without the interface between the fault and the lithology, it can be seen that the displacement value in the maximum principal stress direction is greater than that in the minimum principal stress direction, and the displacement difference in those two directions gradually increases with the increase in the buried depth. It reaches 10 mm when the excavation depth is between 1,400 and 1,700 m. Moreover, the displacement in the direction of the maximum principal stress at the fault is seven times more than that in the direction of the minimum principal stress. For example, at a depth of −480 m, the displacement value in fault is 13.17 mm higher than that in rock mass near the borehole, and this difference increases to 29.23 mm at −700 m, 103.06 mm at −1,050 m, 495.90 mm at −1,430 m, 467.28 mm at −1,620 m, and 139.78 mm at −1,980 m. It can be seen that the influence of fault on surrounding rock displacement is more significant than that of excavation depth and stratum condition.
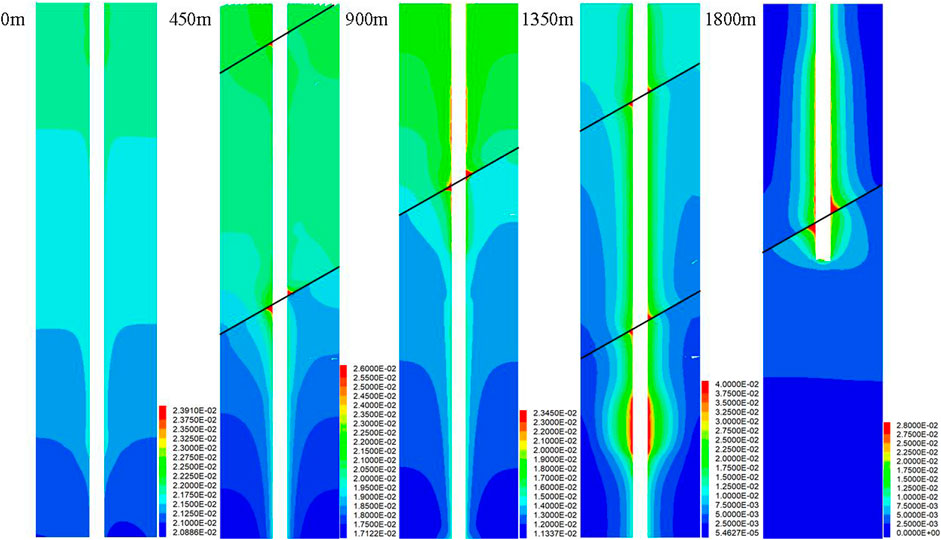
FIGURE 7. Cloud image of surrounding rock displacement after deep shaft excavation.
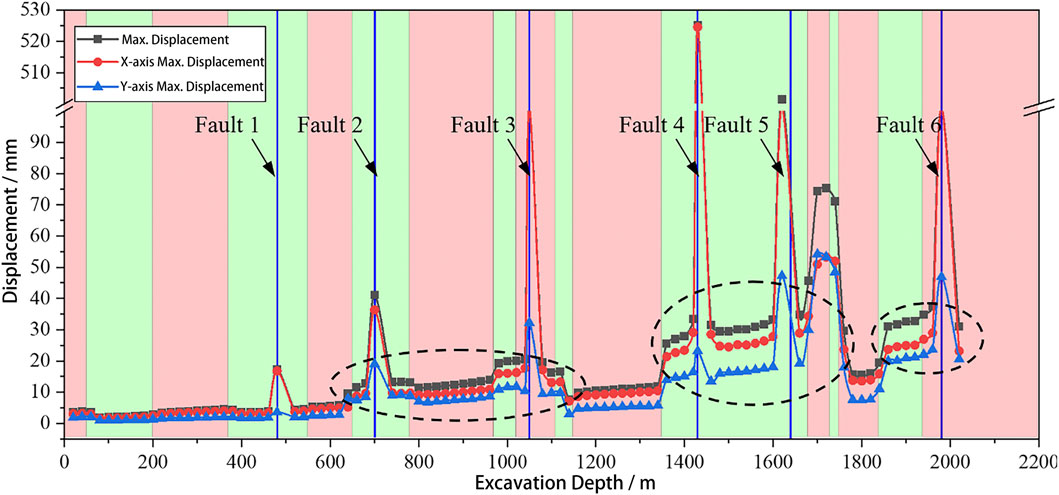
FIGURE 8. Variation in surrounding rock displacement with excavation depth.
Through the analysis of displacement, it demonstrates that displacement increases from −650 to −1,050 m, −1,350 to −1,750 m,−1,850 m to −1,950 m, and six fault zones. It experiences a significant increase below −1,000 m due to the comprehensive influence of high stress and discontinuity structure. Timely and strong support measures should be considered, such as long anchor cables and lining concrete.
From Figures 9, 10, it can be concluded that the failure type of the shaft is mainly shear failure (Li and Wang, 2020). When the buried depth is shallow, tensile failure and shear–tensile mixed failure appear in the borehole rock mass. With the increase in buried depth, the in situ stress increases and the depth of the plastic zone also increases. However, due to the influence of uneven rock strata, the plastic zone in the local area fluctuates. From −650 to −1,150 m, −1,680 to−1,750 m, and −1,900 to −2,000 m, the equivalent depth of the plastic zone increases significantly, resulting in the deterioration of rock mass mechanical parameters. Among them, it has the most critical increase from −680 to −780 m and −1,680 to −1,750 m, which are 5.73 and 6.38 m, respectively. In the region of buried depth from −1,080 to −1,350 m, the equivalent depth of the plastic zone decreases significantly due to the strengthening mechanical parameters of the rock mass. In addition, the plastic zone of the surrounding rock at the fault increases obviously, and there are more shear–tensile mixed failure in the rock mass near the fault.
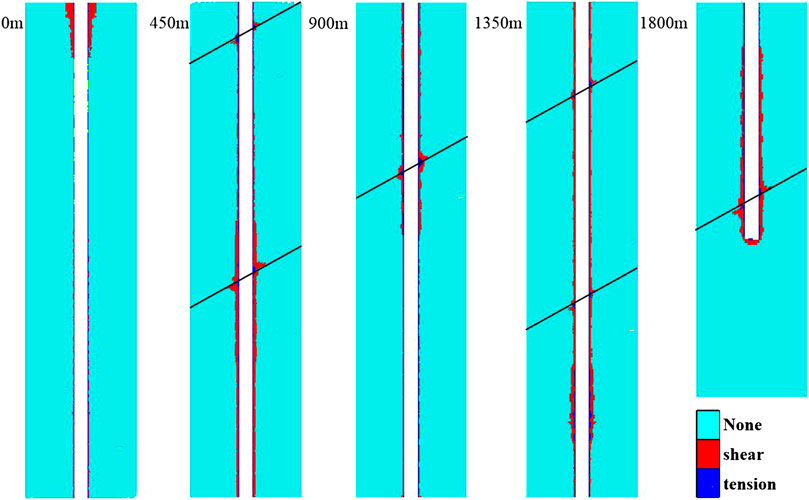
FIGURE 9. Plastic zone distribution of the surrounding rock after deep shaft excavation.
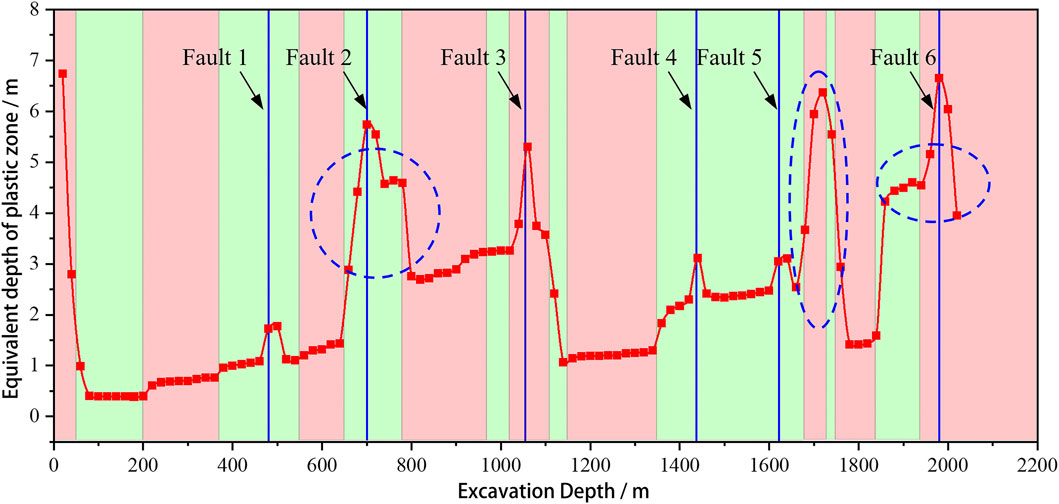
FIGURE 10. Variation in plastic zone depth with the excavation depth of the shaft section.
Meanwhile, the equivalent depths of the plastic zones in the fault area buried at −480 , −700, −1,050, −1,430, −1,620, and −1,980 m are, respectively, 0.64, 1.42, 2.58, 0.78, 0.58, and 1.89 m higher than those of the surrounding rock near the fault. It can be obtained that the variation in the plastic zone caused by faults at different buried depths differs due to the influence of uneven strata, and its variation law is affected by faults, ground in situ stress, and geomechanical characteristic.
The stress release and deformation of surrounding rock during shaft excavation will be constrained by the excavation face. Therefore, the stress during shaft excavation is released step by step, and its damage is affected by the distance from the excavation face. In this section, the shaft section at the buried depth of 1,900 m is used as the monitoring surface to analyze the stress release and damage evolution law of surrounding rock with the increase in the shaft excavation depth.
Figures 11, 12 show that the distance between the monitoring surface and the excavation surface increases, and the displacement shows an increasing trend followed by a stable tendency. When excavating to the monitoring surface, due to the influence of the upper excavation, a displacement of 5.66 mm has been generated. With the first step of excavation, the displacement increases rapidly to 14.03 mm. As the excavation depth continues to increase, the displacement of the surrounding rock continues to increase, and its increment decreases. When the excavation depth reaches 48 m, the displacement increases by 19.21 mm, and it no longer increases and tends to be stable with the further increase in excavation depth.
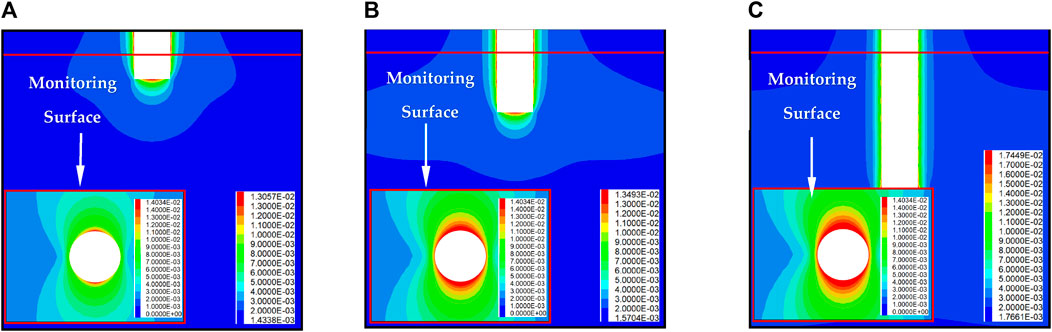
FIGURE 11. Displacement variation in the monitoring surface with excavation depth: (A) 6 m between excavation and monitoring face; (B) 18 m between excavation and monitoring face; and (C) 48 m between excavation and monitoring face.
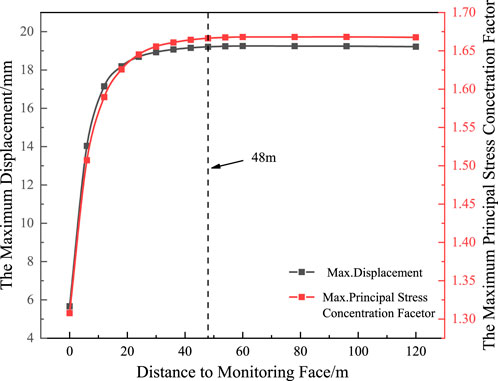
FIGURE 12. Maximum displacement and maximum principal stress concentration coefficient of the monitoring surface varying with the distance from the excavation surface.
Figures 12, 13 show that they have a similar displacement variation law. Due to the influence of the upper excavation, the maximum principal stress on the monitoring surface is 90.47 MPa, and the stress concentration factor is 1.31. With the first step of excavation, the stress is rapidly released, and the stress concentration occurs on both sides of the borehole. The maximum principal stress of the monitoring surface increases to 104.27 MPa, and the stress concentration factor increases to 1.51. With the increase in excavation depth, the degree of stress concentration continues to increase, and the increase in stress concentration decreases. When the excavation depth reaches 48 m, the stress concentration degree of the monitoring surface tends to be stable. At this time, the maximum principal stress of the monitoring surface increases to 115.28 MPa, and the stress concentration factor increases to 1.666.
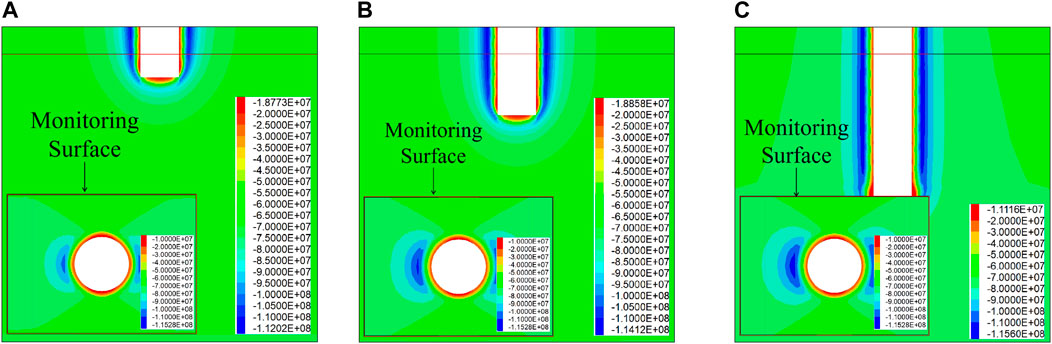
FIGURE 13. Nephogram of maximum principal stress of the monitoring surface with excavation depth: (A) 6 m between excavation and monitoring face; (B) 18 m between excavation and monitoring face; and (C) 48 m between excavation and monitoring face.
Figures 14, 15 show that the displacement variation law is similar to the maximum principal stress variation tendency. Due to the influence of the upper excavation, the destruction approaching degree FAImax of the monitoring surface is 2.89, and the depth of the failure zone is 0.39 m. With the first step of excavation, the surrounding rock around the monitoring surface is rapidly destroyed, the destruction approaching degree FAImax of the monitoring surface increases rapidly to 7.48, and the depth of the damage zone increases to 1.92 m. As the excavation depth continues to increase, the depth of the failure zone and the degree of damage continue to increase, whereas the depth of the failure zone decreases. When the excavation depth reaches 48 m, the depth of the failure zone and the degree of damage to the monitoring surface basically tend to be stable. At this time, the destruction approaching degree FAImax of the monitoring surface is 8.69, and the depth of the failure zone increases to 2.52 m.
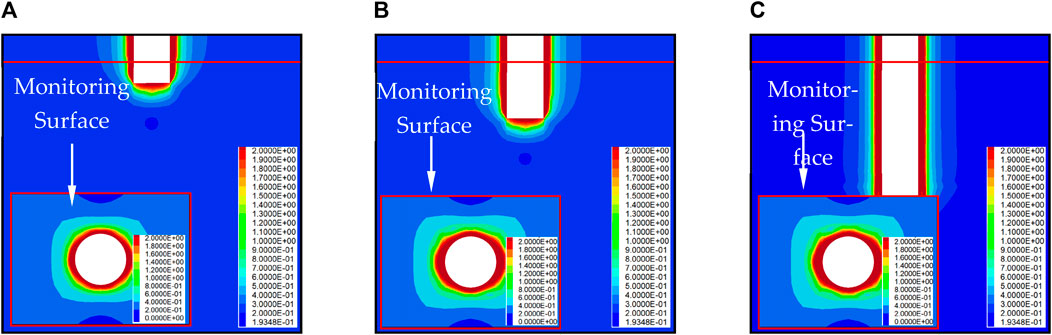
FIGURE 14. Variation rule of the monitoring surface with the depth of the excavation failure zone: (A) 6 m between excavation and monitoring face; (B) 18 m between excavation and monitoring face; and (C) 48 m between excavation and monitoring face.
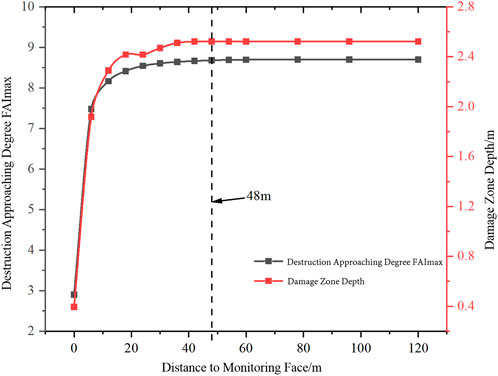
FIGURE 15. Variation in the failure zone on the monitoring surface with distance from the excavation surface.
In summary, with the increase in the distance between the working face and the monitoring section, the constraint effect of the working face is gradually weakened, and the stress is fully released. The displacement, the maximum principal stress concentration factor, the maximum value of destruction approaching degree, and the depth of the failure zone increase, indicating the expansion of the rock damage range and the increase in the degree of fragmentation. When the monitoring section is 48 m away from the excavation surface, the deformation of the surrounding rock is released by stress, and the changes in each evaluation index tend to be stable.
As shown in Figures 16, 17, with the increase in buried depth, there is no damage zone in the shallow rock mass. The first and only damage zone is located at the fault buried at −480 m. When passing through the fault, with the increase in excavation depth. When the excavation depth exceeds −660 m, the borehole begins to produce a damage zone. With the increase in excavation depth, the damage zone shows an increasing trend, but it is affected by the uneven stratum. There is a significant increase in the surrounding rock in the local area. The depth of the failure zone increases significantly in the three regions of −650 to −1,050 m, −1,350 to −1,750 m, and −1,850 to −2,016 m. Among them, the depth of the failure zone increases slightly in the region of −650 to −1,050 m, whereas it increases greatly from −1,350 m to −1,750 m. Particularly, in the region of −1,680 m to −1720 m, the damage reaches the peak (5.68 m). The change rule is consistent with the reduction zone of the minimum principal stress. It shows that the support strength of the surrounding rock should be strengthened in the aforementioned three areas during construction, and there are two serious damage areas in the whole shaft construction area, which locate at −1,400 to −1,750 m and −1,850 to −2,016 m. The depth of the serious damage area of the surrounding rock in the aforementioned two areas is more than 2 m. Similar to the aforementioned analysis of displacement and plastic zone, due to the existence of the discontinuous structure of the fault, the depth of the failure zone is significantly increased compared with the depth of the surrounding rock failure zone in the borehole. At the same time, when the buried depth reaches −480, −700, −1,050, −1,430,−1,620, and −1,980 m, the equivalent depth of the failure zone increases by 0.41, 1.34, 1.75, 0.72, 0.98, and 1.79 m, respectively.
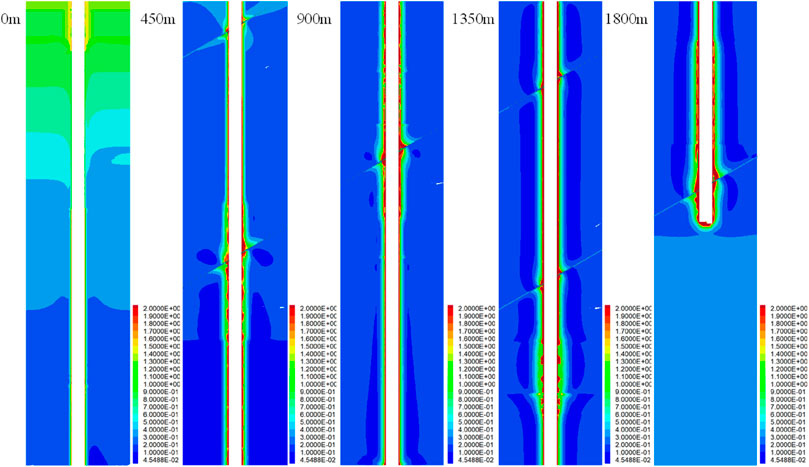
FIGURE 16. Variation in the failure area of shaft section distribution with excavation depth (including faults).
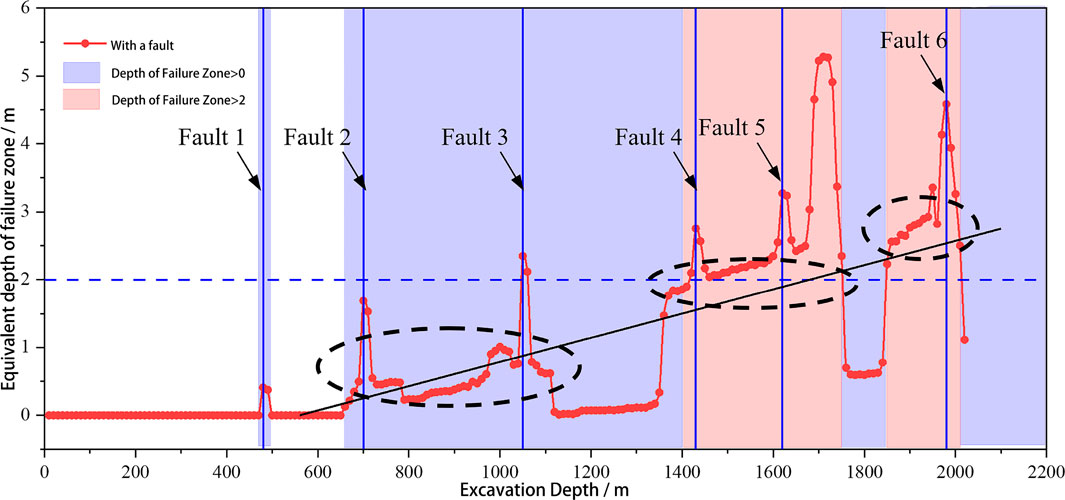
FIGURE 17. Variation rule of the equivalent depth of the failure zone with excavation depth.
Through the analysis of the failure zone, it will be generated at the depth of −480 m fault and more than −660 m area, and the stability of the surrounding rock should be paid attention to in the area where the failure zone will be generated. Moreover, a corresponding support plan should be formulated. Particularly, in the two areas of −1,400 to −1,750 m and −1,850 to −2,016 m, the depth of the failure zone exceeds 2 m. The traditional bolt support will no longer be able to meet the requirements of stability control in these two areas.
1) Through the analysis of stress, displacement, and plastic zone, with the increase in excavation depth and the decrease in rock mass quality, the maximum principal stress concentration value, displacement, and plastic zone area increase. The stress reduction zone, the deformation zone of rock mass, and the increase in the area of the plastic zone are consistent: 650 to −1,050 m, −1,350 to −1,750 m, and −1,850 to −1,950 m.Particularly, in the area of −1,680 to −1,720 m, the displacement reaches a maximum value of 75.75 mm, with a 6.38 m plastic zone. The maximum displacement at fault reaches 525.06 mm, with a 6.64 m plastic zone.
2) Through the analysis of the stress release law and damage superposition characteristics of the surrounding rock during the shaft excavation, it is concluded that with the increase in the distance between the working face and the monitoring section, the constraint effect of the working face is gradually weakened, and the stress release is sufficient. When the distance between the monitoring section and the excavation face reaches 48 m, the deformation of the surrounding rock is released as stress, and the change in each evaluation index tends to be stable.
3) Through the analysis and prediction of the failure zone, except for the fault, there is no failure zone when the buried depth is less than 660 m. The depth of the failure zone is more than 2 m at the buried depth of −1,400 to −1,750 m and −1,850 to −2,016 m, and the depth of the failure zone reaches a maximum of 5.28 m.
The original contributions presented in the study are included in the article/supplementary material; further inquiries can be directed to the corresponding authors.
KH: responsible for drafting the main text of the manuscript and for designing and conducting the experiments; YH and YY: software; MZ and LA: validation. All authors contributed to the article and approved the submitted version.
This research was funded by the National Science Foundation of Shandong Province, China (grant number ZR2021ZD36).
The authors would like to thank the research team members for their contributions to this work.
Authors KH, MZ, YH, and YY were employed by the company Deep Mining Laboratory of Shandong Gold Group Co., Ltd., Laizhou, China.
The remaining author declares that the research was conducted in the absence of any commercial or financial relationships that could be construed as a potential conflict of interest.
All claims expressed in this article are solely those of the authors and do not necessarily represent those of their affiliated organizations, or those of the publisher, the editors, and the reviewers. Any product that may be evaluated in this article, or claim that may be made by its manufacturer, is not guaranteed or endorsed by the publisher.
Cheng, Q., Yi, D., Yuan, Q., Liu, T. X., Lei, H., and Wang, F. (2020). Large deformation analysis of tunnel-surrounding rock along the expressway from Wenchuan to Maerkang, China. IOP Conf. Ser. Earth Environ. Sci. 570 (5), 052058. doi:10.1088/1755-1315/570/5/052058
Feng, W. K., Huang, R. Q., and Li, T. B. (2012). Deformation analysis of a soft–hard rock contact zone surrounding a tunnel. Tunn. Undergr. Space Technol. incorporating Trenchless Technol. Res. 32, 190–197. doi:10.1016/j.tust.2012.06.011
Gao, M. S., Dou, L. M., Xie, Y. S., Gao, J., and Zhang, L. S. (2009). Latest progress on study of stability control of roadway surrounding rocks subjected to rock burst. Procedia Earth Planet. Sci. 1 (1), 409–413. doi:10.1016/j.proeps.2009.09.065
Gao, Y. L., He, Q. Y., Li, C. P., Wang, M., Han, X. L., Ma, B., et al. (2021). Analysis of shaft failure mechanism in the 1240m-1120m range of xier auxilisry shaft in Longshou mine of jinchuan deposit[J]. Sicence Technol. Eng. 21 (23), 9814–9822. doi:10.12404/j.issn.1671-1815.2023.23.03.00991
He, M. C., Gong, W. L., Li, D. J., and Zhai, H. M. (2009). Physical modeling of failure process of the excavation in horizontal strata based on IR thermography. Min. Sci. Technol. 19 (6), 689–698. doi:10.1016/s1674-5264(09)60128-9
Hoek, E., and Brown, E. T. (2019). The Hoek–Brown failure criterion and GSI – 2018 edition. J. Rock Mech. Geotechnical Eng. 11 (03), 445–463. doi:10.1016/j.jrmge.2018.08.001
Hou, K. K., Wu, Q. Z., Zhang, F. P., Peng, C., Liu, H. X., Liu, X. Q., et al. (2022). Application of different in-situ stress testing methods in 2005 meterss haft-building area of Sanshandao gold mine and the distribution law of in-situ stress [J]. Geotech. Mech. 43 (04), 1093–1102. doi:10.16285/j.rsm.2021.1172
Huang, J., Wei, X., Luo, Y., Gong, H., Liu, T., and Li, X. (2022). Analysis of the deformation characteristics of the surrounding rock mass of a deep tunnel during excavation through a fracture zone. Rock Mech. Rock Eng. 55 (12), 7817–7835. doi:10.1007/s00603-022-03056-7
Kaiser, P. K., Maloney, S., and Morgenstern, N. R. (1983). “The time dependent properties of tunnel in highly stressed rocks,” in Proceedings of the 5th Congress ISRM (D), Melbourne, Australia, April 10–15, 1983. (A.A. Balkema), 329–335.
Li, H. H., and Wang, X. D. (2020). Deformation and failure law and control technology of surrounding rock in deep shafts[J]. Metal. Mine 533 (11), 11–18. doi:10.19614/j.cnki.jsks.202011002
Li, X. L., Zhang, X. Y., Shen, W. L., Wang, Y., Qin, Q., Lu, X., et al. (2023). Abutment pressure distribution law and support analysis of super large mining height face. Int. J. Environ. Res. Public Health 20 (2), 227. doi:10.3390/ijerph20010227
Liu, M., Zhang, J. M., Zhou, Z. P., and Xiang, Z. B. (2016). Analysis of the surrounding rock stability and supporting time of a soft rock tunnel in the red bed area[J]. Saf. Environ. Eng. 23 (03), 146–151+162. doi:10.13578/j.cnki.issn.1671-1556.2016.03.025
Liu, Q. Y., Zhu, Z. Q., Zhong, Z. Q., and He, X. Q. (2009). Yield proximity analysis of tunnel surrounding rock based on Hoek-Brown criterion [J]. Geotech. Mech. 30 (08), 2447–2451. doi:10.19713/j.cnki.43-1423/u.2008.05.008
Qian, Q. H., and Zhou, X. P. (2018). Failure behaviors and rock deformation during excavation of underground cavern group for Jinping I hydropower station. Rock Mech. Rock Eng. 51 (8), 2639–2651. doi:10.1007/s00603-018-1518-x
Renani, H. R., and Cai, M. (2021). Forty-year Review of the Hoek–Brown failure criterion for jointed rock masses. Rock Mech. Rock Eng. 55 (1), 439–461. doi:10.1007/s00603-021-02661-2
Song, Z. Y., Mao, A. Q., and Yi, S. S. (2018). Deformation analysis of surrounding rocks in weak and broken zone under high water[J]. Transp. Sci. Technol. 287 (02), 87–93. doi:10.3963/j.issn.1671-7570.2018.02.022
Sun, C., Zhang, X. D., and Zhang, J. J. (2011). Stability analysis of vertical shaft surrounding rock and supporting system in deep fracture [J]. J. Chian Coal Soc. 36 (4), 914–920. doi:10.13225/j.cnki.jccs.2013.04.019
Sun, Q. H., Ma, F. S., Guo, J., Li, G., and Feng, X. (2020). Deformation failure mechanism of deep vertical shaft in jinchuan mining area [J]. Sustainability 12 (6), 2226. doi:10.3390/su12062226
Sun, X. M., Li, G., Zhao, C. W., Liu, Y., and Miao, C. (2018). Investigation of deep mine shaft stability in alternating hard and soft rock strata using three-dimensional numerical modeling. J. Process. 7 (1), 2–17. doi:10.3390/pr7010002
Tan, J., Liu, Z. Q., Song, C. Y., Liu, Q. H., Long, Z. Y., and Ning, F. B. (2021). The status and development trend of shaft sinking technology in mines in China [J]. Metal. mines 539 (05), 13–24. doi:10.19614/j.cnki.jsks.202105002
Walton, G., Kim, E., Sinha, S., Sturgis, G., and Berberick, D. (2018). Investigation of shaft stability and anisotropic deformation in a deep shaft in Idaho, United States. Int. J. Rock Mech. Min. Sci. 105, 160–171. doi:10.1016/j.ijrmms.2018.03.017
Wang, J. X., Lin, M. Y., Tian, D. X., and Zhao, C. l. (2009). Deformation characteristics of surrounding rock of broken and soft rock roadway. Min. Sci. Technol. 19 (2), 205–209. doi:10.1016/s1674-5264(09)60039-9
Wang, S. K., Zhu, Z. G., Yu, Y. S., Cheng, Y., and Liu, J. M. (2022). Stability analysis and support optimization of shaft wall with deep high stress[J]. Min. Res. Dev. 42 (04), 38–44. doi:10.13827/j.cnki.kyyk.2022.04.028
Yassaghi, A., and Salari-Rad, H. (2004). Squeezing rock conditions at an igneous contact zone in the taloun tunnels, tehran-shomal freeway, Iran: A case study. Int. J. Rock Mech. Min. Sci. 42 (1), 95–108. doi:10.1016/j.ijrmms.2004.07.002
Zhang, C. Q., Zhou, H., and Feng, X. T. (2011). An index for estimating the stability of brittle surrounding rock mass: FAI and its engineering application. Rock Mech. Rock Eng. 44 (4), 401–414. doi:10.1007/s00603-011-0150-9
Zhang, J. Z., and Zhou, X. P. (2020). AE event rate characteristics of flawed granite: From damage stress to ultimate failure. Geophys. J. Int. 222 (2), 795–814. doi:10.1093/gji/ggaa207
Zhang, J. C., Li, X. L., Qin, Q. Z., Wang, Y., and Gao, X. (2023). Study on overlying strata movement patterns and mechanisms in super-large mining height stopes. Bull. Eng. Geol. Environ. 82 (3), 142. doi:10.1007/s10064-023-03185-5
Zhang, Q., Huang, X. B., Zhu, H. H., and Li, J. (2019). Quantitative assessments of the correlations between rock mass rating (RMR) and geological strength index (GSI). Tunn. Undergr. Space Technol. 83, 73–81. doi:10.1016/j.tust.2018.09.015
Keywords: deep shaft, uneven strata, surrounding rock stability, fault, damage proximity
Citation: Hou K, Zhu M, Hao Y, Yin Y and An L (2023) Stability analysis and evaluation of surrounding rock of ultra-deep shaft under complicated geological conditions. Front. Earth Sci. 11:1216667. doi: 10.3389/feart.2023.1216667
Received: 04 May 2023; Accepted: 12 June 2023;
Published: 06 July 2023.
Edited by:
Xuelong Li, Shandong University of Science and Technology, ChinaReviewed by:
Xiaoping Zhou, Chongqing University, ChinaCopyright © 2023 Hou, Zhu, Hao, Yin and An. This is an open-access article distributed under the terms of the Creative Commons Attribution License (CC BY). The use, distribution or reproduction in other forums is permitted, provided the original author(s) and the copyright owner(s) are credited and that the original publication in this journal is cited, in accordance with accepted academic practice. No use, distribution or reproduction is permitted which does not comply with these terms.
*Correspondence: Kuikui Hou, aG91a3Vpa3VpQHNkLWdvbGQuY29t; Yingjie Hao, aGFveWluZ2ppZWxsQHNkLWdvbGQuY29t; Yantian Yin, eWlueWFudGlhbkBzZC1nb2xkLmNvbQ==; Long An, YW5sb25nQG1haWwubmV1LmVkdS5jbg==
Disclaimer: All claims expressed in this article are solely those of the authors and do not necessarily represent those of their affiliated organizations, or those of the publisher, the editors and the reviewers. Any product that may be evaluated in this article or claim that may be made by its manufacturer is not guaranteed or endorsed by the publisher.
Research integrity at Frontiers
Learn more about the work of our research integrity team to safeguard the quality of each article we publish.