 Yolanda De Pro-Díaz1*
 Hector Perea2
 Juan Miguel Insua-Arévalo1
 José J. Martínez-Díaz1,3
 Carolina Canora4
- 1Department of Geodynamics, Stratigraphy and Paleontology, Universidad Complutense de Madrid, Madrid, Spain
- 2Institut de Ciències Del Mar, Consejo Superior de Investigaciones Científicas, Barcelona, Spain
- 3Instituto de Geociencias (IGEO), Universidad Complutense de Madrid-Consejo Superior de Investigaciones Científicas, Madrid, Spain
- 4Department of Geology and Geochemistry, Universidad Autónoma de Madrid, Ciudad Universitaria de Cantoblanco, Cantoblanco, Spain
Macroseismic observations can be useful to study pre-instrumental earthquakes when paleoseismological analysis are not viable for various reasons (e.g., erosion or lack of sedimentation). The analysis of the distribution of the macroseismic intensity data points and the reports about geological effects has been shown as a tool that may provide meaningful information to localize the fault source of a historical earthquake. Using this approach, we have studied two earthquakes in the Betic Cordillera (South Spain), the 1804 Dalías and the 1680 Málaga events, and we have used the 2011 Lorca earthquake as a test subject to calibrate the methodologies. During the calibration process, we also find the best performing combination of ground-motion models and ground-motion-to-intensity-conversion equations for generating seismic scenarios in this area. Even though the results for the Málaga earthquake were not conclusive, our methodology successfully identified the most likely source for the Dalías earthquake: a conjunct rupture of the Loma del Viento and Llano del Águila Faults.
1 Introduction
Identifying faults that have produced large earthquakes and extending their earthquake record towards the past is crucial to include these faults as seismogenic sources in modern probabilistic seismic hazard assessments (e.g., Gómez-Novell et al., 2020; Caputo et al., 2015 and references therein; Basili et al., 2008 and references therein; Ambraseys and Jackson, 1998). In order to do this, it is necessary to answer three questions to characterize every earthquake: (1) when did it occur? (2) what was its size? and (3) which was the fault that caused it? This is usually achieved either through the use of its instrumental records (if there are any), or by characterizing the earthquake through active tectonics and paleoseismological studies. However, these two approaches are not always feasible. Firstly, most of the known large earthquakes have occurred in the pre-instrumental era and, secondly, external factors such as soil usage, geomorphology, high erosion rates or even sea coverage, among others, might preclude to carry out paleoseismological studies in some regions or might provide inconclusive results. An alternative approach may be to associate a historical earthquake with a specific fault by the use of the available written records. Some examples of such records correspond to city council reports filed in the following days after an earthquake, correspondence from the local or regional administration asking for financial support to repair damages, personal diaries or even announcements convening religious events to “placate divine wrath”. These documents often provide detailed descriptions of both damages and casualties, from which researchers can assign intensity values to sites where the earthquake was felt through the use of macroseismic intensity scales (Teves-Costa and Batlló, 2011; Muñoz Clares et al., 2012; Huerta et al., 2015; Murphy Corella, 2019).
Macroseismic data have been mainly used to study pre-instrumental historical earthquakes. Early attempts to locate the epicenters of the historical earthquakes through the assignation and distribution of intensities date back to the 19th century; however, the results of these early studies might have large uncertainties due to not well established methodologies and lack of knowledge about seismology and earthquake geology (Cecic et al., 1996, and references therein). Throughout the 20th century, different intensity scales, such as the Sieberg (1912), Sieberg (1923), the Mercalli-Cancani-Sieberg (Sieberg, 1932), the Modified Mercalli (Richter, 1958) or the EMS-98 (Grünthal, 1998), among others, were developed to classify the strength of ground motion on a site based on its effects. The most early scales were based on the effects of an earthquake on people, structures and nature alike, while recently developed scales focus more either on damage to buildings (usually considering several different structural types of building stock), such as the EMS-98; or on environmental and geological effects, as the ESI-07 (Guerrieri and Vittori, 2007). The 20th and 21st centuries have seen plethora of authors using intensity fields to estimate different earthquake parameters, such as magnitude (e.g., Nuttli, 1973; Toppozada, 1975; Nuttli et al., 1979; Ambraseys, 1985; Johnston, 1996; Johnston and Schweig, 1996; Bakun and Wentworth, 1997), epicenter location (e.g., Bakun and Wentworth, 1997; Gasperini et al., 1999; Gasperini et al., 2010), rupture size (e.g., Evernden, 1975; Gasperini et al., 1999; Gasperini et al., 2010; Canora et al., 2021) or hypocentral depth (e.g., Evernden, 1975; Sbarra et al., 2022; Sbarra et al., 2019).
The 9 October 1680, Málaga and the 25 August 1804, Dalías historical destructive earthquakes (both IEMS98 IX) were widely felt in south Spain; however the faults that produced them still remain unknown (Espinar Moreno, 1994; Goded et al., 2008; Martínez Solares, 2011; Mezcua et al., 2013; Huerta et al., 2015; Murphy Corella, 2019; Silva Barroso et al., 2019). The aim of this study is to provide some constrains in the faults that may have produced these earthquakes. To achieve this goal we combine two different approaches, the one proposed by Gasperini et al. (1999, 2010) (Gasperini method henceforth), to locate possible fault candidates for the earthquake, and another one proposed by de Pro-Díaz et al. (2022) (seismic scenario method henceforth), which ranks several candidate faults that might have produced the event, searching for the candidate most similar to the actual seismic source. In addition, we use the 11 May 2011, Lorca earthquake (Mw 5.1) (Martínez-Díaz et al., 2012a; Benito Oterino et al., 2012; Rodríguez-Pascua et al., 2012) to calibrate the methodologies and test the reliability of the Gasperini method for the southern Iberian Peninsula. Finally, we compare the results obtained from each methodology and discuss their applicability and limitations.
2 Geological and seismological context
The Betic Cordillera, also known as the Betics, is an ENE-WSW cordillera localized in the south of the Iberian Peninsula and its recent evolution is related to the convergence between the Iberia and Nubia plates. At the beginning, the cordillera developed as a thrust stack during the Alpine orogeny (Egeler and Simon, 1969). Later, there was an inversion of the major tectonic structures’ kinematics to normal faulting during two extensional episodes occurred between the Burdigalian to the Serravallian and related to the westward migration of the Gibraltar arc (Galindo-Zaldivar et al., 1989; Aldaya et al., 1991; García-Dueñas et al., 1992; Jabaloy et al., 1993; Martínez-Martínez and Azañon, 1997). In the last 9 My, a compressional stress field with NNW-SSE shortening has become dominant in the area and formed high-angle reverse and strike-slip faults, most of which remain active since Late Miocene (Martínez-Díaz et al., 2012b).
The Betic Cordillera is traditionally divided into three distinct domains: Internal Zones, External Zones, and sin- and post-orogenic basins. Both the Internal and the External Zones are formed by allochthonous tectonic complexes, the more internal the more allochthonous and deformed (Vera et al., 2004). The Internal Zones, in which the oldest materials can be found, are the result of a superposition of tectonic units usually divided into the Nevado-Filábride, Alpujárride and Maláguide Complexes (from bottom to top). Some of these units still show remnants of pre-Alpine magmatism, metamorphism and orogenies (Aldaya et al., 1991; Jabaloy et al., 1993; Vera et al., 2004). The lesser-deformed sediments of the sin-orogenic and post-orogenic basins date from the Miocene to the Quaternary, and Neogene-Quaternary volcanic complexes were emplaced in some basins to the SE (Sanz de Galdeano, 1990; Vera et al., 2004) (Figure 1).
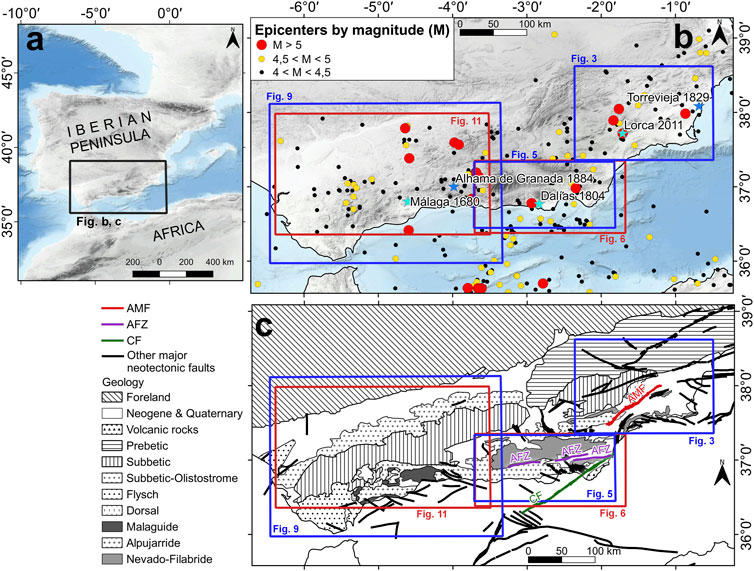
FIGURE 1. Inset of the study area (A), epicenter location of historical earthquakes with M > 4 (B) and geology of the region (C), modified from Sanz de Galdeano and Alfaro (2004). The location of the earthquakes addressed in this work (Lorca 2011; Dalías 1804 and Málaga 1680) is also marked. Insets for subsequent figures in this work are also provided. AMF=Alhama de Murcia Fault; AFZ=Alpujarras Fault Zone; CF=Carboneras Fault.
Along the Betic Cordillera, active faults show three main orientations: E-W, NW-SE and NE-SW (Sanz de Galdeano, 1983; Sanz de Galdeano et al., 2020). One of the most important fault systems is the Eastern Betics Shear Zone (EBSZ) (Silva et al., 1993), a sigmoidal, NE-SW, shear corridor composed mainly of left-lateral strike-slip faults, which on the northern sector have an important reverse component. The Alhama de Murcia (AMF) and the Carboneras Faults (CF) are major faults of this system (Silva et al., 1993; García-Mayordomo et al., 2012; Sanz de Galdeano et al., 2020). This is the most studied active fault system in Spain and has been the object of different paleoseismological studies (e.g., Ferrater et al., 2017; 2016; Martín-Banda et al., 2016; Insua-Arévalo et al., 2015; Ortuño et al., 2012). The NW-SE trending faults, on the other hand, are dip-slip faults and control some of the Neogene basins, such as the Dalías, Lorca, Granada and Guadix-Baza basins (Sanz de Galdeano et al., 2020). Some of these faults include the Loma del Viento, the Llano del Águila and the Balanegra Faults in Campo de Dalías (Martínez-Díaz and Hernández-Enrile, 2004; Marín-Lechado et al., 2005; García-Mayordomo et al., 2012; Pedrera et al., 2012; Sanz de Galdeano et al., 2020; Molins-Vigatà et al., 2022). Among the E-W-trending faults, there are strike-slip major structures such as the Alpujarras Fault Zone (AFZ), which is a right-lateral corridor composed of several faults, some of which show evidence of Quaternary activity (Sanz de Galdeano et al., 2020; 1985; Martínez-Martínez, 2006; Echeverria et al., 2015). Some blind thrusts with complex geometry in depth, such as the Montes de Málaga Fault and the system formed by the Mijas, Cártama, and Villafranco de Guadalhorce Faults in the Málaga area, also show an E-W orientation (Insua Arévalo, 2008; García-Mayordomo et al., 2012). A more detailed context of the Lorca, Campo de Dalías and Málaga areas is provided in section 4.
The Betic Cordillera is the most seismically active region in Spain. Seismicity in this area is mostly shallow and characterized by earthquakes with low-moderate magnitudes (Figure 1); however, some destructive large magnitude earthquakes have affected the area during historical times such as the 1829 Torrevieja and 1884 Alhama de Granada earthquakes, both with estimated M>6 (Reicherter et al., 2003; IGN, 2023). In addition, the biggest earthquakes instrumentally recorded that have caused severe damages, and in some cases casualties, are the 1930 Montilla, 1984 Granada and 2011 Lorca earthquakes, all with magnitudes around 5 (Morales et al., 1996; Martínez Solares and Mezcua Rodríguez, 2002; Batlló et al., 2010; Martínez-Díaz et al., 2012a). There is also some very localized intermediate-depth seismicity and scarce deep earthquakes; however the strongest instrumentally recorded earthquake (Mw7.8) occurred below Granada in 1954 at a depth of 650 km, reaching Imax V and producing property damage in Málaga and Granada (Chung and Kanamori, 1976; Frohlich, 2006; Stich et al., 2020), although this earthquake is unique in its source characteristics inside this area and is not related to surface faults. The majority of the focal mechanisms calculated on the Betics provide a high kinematic variability, combining strike-slip with either reverse or normal component (Stich et al., 2020).
3 Methodology
In this paper, we combine two different methodologies: the Gasperini method (Gasperini et al., 1999; Gasperini et al., 2010) and the seismic scenario method with spatial intensity analysis from de Pro-Díaz et al. (2022), to evaluate the faults that may have produced the two addressed historical earthquake cases. The methodology’s workflow is illustrated in Figure 2.
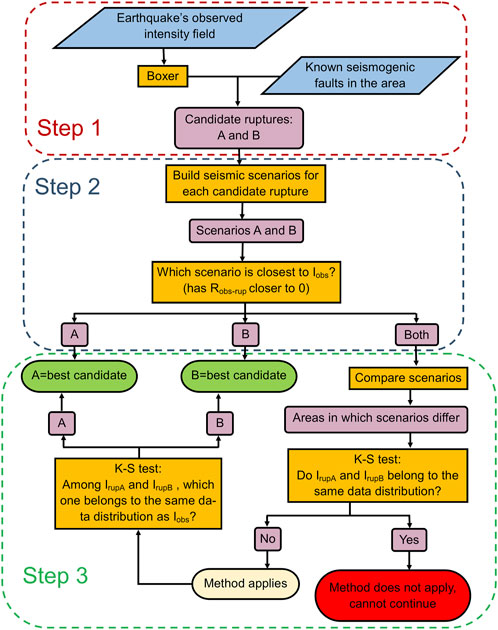
FIGURE 2. Flow diagram of the methodology for this work, a combination of the Gasperini method (Gasperini et al., 1999; Gasperini et al., 2010) and the seismic scenario method and spatial analysis of the residuals (de Pro-Díaz et al., 2022). Iobs=observed intensity data values. IrupA=intensity values sampled from simulated scenario A. IrupB=intensity values sampled from simulated scenario B. K-S test=Kolmogorov-Smirnov test.
3.1 Gasperini method
The Gasperini method (Gasperini et al., 1999; Gasperini et al., 2010) (Step 1 in Figure 2) uses the distribution of the intensity data points to localize the epicentral area of a historical earthquake and estimate the dimensions and orientation of its most likely rupture area and its moment magnitude (Mw). This method generates an oriented rectangle, named “boxer”, which is meant to represent the surface projection of the fault responsible for the earthquake or the portion of the Earth where it would be likely to be located. The boxer’s dimensions derive from the magnitude using empirical relations proposed by several authors (Wells and Coppersmith, 1994; Stirling et al., 2002; Wesnousky, 2008; Hanks and Bakun, 2008).
Comparing the projection of the obtained earthquake area source with the geological information (i.e., active faults) may help to define those faults more suitable to be responsible for the event. This may allow discarding as possible earthquake sources the geological faults that lie too far from the boxer and/or those whose dimensions and strike differ significantly from it. The faults considered as probable seismic sources are then taken as candidates and modeled in the simulation stage (see Seismic Scenario method) (step 2 in Figure 2). The calculations have been done using the Boxer software (Gasperini et al., 1999; Gasperini et al., 2010) calibrated with specific coefficients for the Betics region (Gomez-Capera et al., 2014).
3.2 Seismic scenario method
The seismic scenario method (de Pro-Díaz et al., 2022) (Step 2 in Figure 2) builds earthquake scenarios that simulate the distribution of the intensity field related to each of the candidate fault sources identified with the Gasperini method. Then, the obtained intensity fields are compared with the observed intensity field to see which one fits better the observed data.
To model the seismic scenarios this method uses the OpenQuake software (Pagani et al., 2014), which requires as input several source parameters: (1) earthquake magnitude, whose source is explained later in this paragraph; (2) fault geometry and location, which are obtained from the geological maps (e.g., García-Mayordomo et al., 2012) and previous works (e.g., Insua Arévalo, 2008; Martínez-Díaz and Hernández-Enrile, 2004); (3) hypocentral depth and coordinates, whose source is also explained later in this paragraph; and (4) upper and lower seismogenic limits of the candidate fault, which generally range between 0 and 15 km (García-Mayordomo et al., 2012, and references therein). Magnitude is calculated through empirical relations considering the size of the rupture; the relations we used are cited at the end of this section 3.2, as well as the criteria to select them. Hypocentral depth and coordinates are obtained from different bibliographic sources, such as earthquake catalogues (e.g., Martínez Solares and Mezcua Rodríguez, 2002) or other authors’ works searching for the source of the earthquake (e.g., Muñoz and Udías, 1988); whenever we find discrepancies in the bibliography about this parameter, we try several depths in the simulations to test which one produces the best results. With these parameters, OpenQuake calculates the ground motion in the study area, and the ground motion values can then be transformed into intensities using ground-motion-to-intensity conversion equations. To account for amplifications in the ground motion caused by site effects, OpenQuake allows the user to input a Vs.30 model. OpenQuake also allows the user to input a default uniform Vs.30 value for the whole study area. Because each lithology has different Vs.30 values and due to the spatial variability of lithologies in the Betics, we prefer to use the Vs.30 models provided by Allen and Wald (2007) and Rodríguez-Peces et al. (2012).
Finally, to predict ground-motion parameters such as peak ground velocity (PGV) or peak ground acceleration (PGA) it is necessary to use a ground motion model (GMM). Ground motion is usually considered to increase with magnitude and decrease with increasing distance to the seismic source; but it also has an aleatory standard deviation associated with the Gaussian distribution around the mean value predicted by a function of magnitude and distance, the sigma (e.g., Reiter, 1991). Using a GMM, OpenQuake generates a regular grid over the study area, where each cell contains simulated ground motion values for both PGA and PGV. We performed a total of 100 different simulations for each rupture, so each point on the grid contains 100 simulated values for PGA and PGV. We calculated the mean of the logarithms of the 100 values for each point on the grid, since ground motion models show a lognormal distribution. Due to the nonlinearity of the site amplification functions used in GMMs and the aleatory variable sigma, it is better to use 100 different simulations instead of using the mean ground-motion field for each location (de Pro-Díaz et al., 2022). In a single mean simulation we can observe regions with abnormally high or low ground-motion values considering the values in the surrounding area, but we have no way of knowing if this anomaly is caused by the random sigma or by site effects. If the same “anomalous” values appear in that area in 100 simulations, it is much more likely that they are due to actual site effects, so the values sampled from the 100-averaged simulations are considered more representative of the ground-motion generated by the earthquake and its possible site effects amplification. Then, with the help of a ground-motion-to-intensity conversion equation (GMICE) suitable for our area, we transform the grids of simulated ground motion values (PGV and PGA) into grids of intensity values. All the grids resulted from the simulations are crossed with the observed intensity data points, and residuals are obtained as follows:
where
To build accurate seismic scenarios it is essential to use GMM and GMICE developed for the area in which the earthquake occurred, since the crustal composition, the building style and people’s perception of an earthquake can greatly vary from one region to another. However, there are no GMM or GMICE specifically designed for south Spain. Consequently, we needed to carry on a calibration test combining different GMM and GMICE to determine which pair performs best in this area. To do so, we have carried out various seismic scenario simulations for the 2011 Lorca earthquake (Figure 3), which was generated by the Alhama de Murcia Fault (Martínez-Díaz et al., 2012a; Frontera et al., 2012), combining different GMM and GMICE and comparing the simulated intensities to the actual distribution of observed intensities (see section 4.1). On the scenarios of the 1804 Dalías and 1680 Málaga earthquakes, we applied the GMM-GMICE pair that provides better correlations.
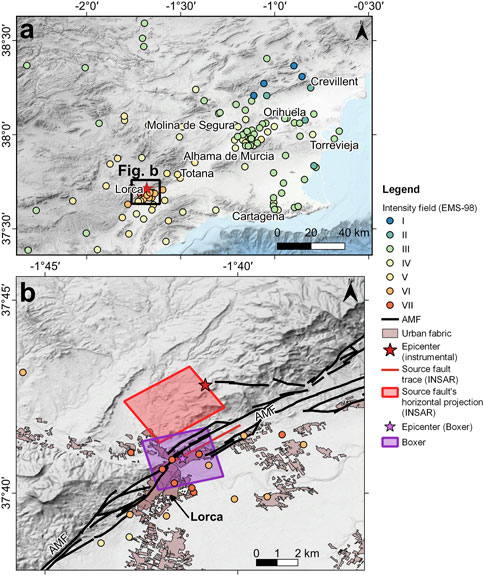
FIGURE 3. Intensity field of the 2011 Lorca earthquake (A) and within the epicentral area (B). Intensity data come from Martínez-Díaz et al. (2012a). AMF=Alhama de Murcia Fault. The AMF’s trace is from the QAFI (García-Mayordomo et al., 2012) and the instrumental epicentral location and INSAR source fault are from Martínez-Díaz et al. (2012a) and Frontera et al. (2012). The Boxer has been modeled using the intensity field and the Gasperini et al. (1999, 2010)’s method.
The 2011 Lorca earthquake was also used to test several empirical relations for the magnitude calculation of an earthquake from its rupture size. We calculated the magnitude based on the rupture area constrained by Martínez-Díaz et al. (2012a) and Frontera et al. (2012) using equations from Wesnousky (2008), Hanks and Bakun (2008), Stirling et al. (2002) and Wells and Coppersmith (1994), and then compared the results to the actual Mw of the event to see which result was closer to it.
3.3 Spatial intensity analysis
When seismic scenarios from two or more candidate sources show Robs-rup equally close to 0, de Pro-Díaz et al. (2022) propose an extra step in the methodology to distinguish the better candidate (Step 3 in Figure 2). First, it is necessary to compare the two competing candidate scenarios to identify the areas where the intensity values differ. To do this, we have to subtract one scenario’s raster from the other, resulting a new raster that may show a large area with zero values and smaller areas with positive and negative values (in which one scenario has higher intensity values than the other). From this point onwards, only the areas with positive and negative values, which are automatically identified with GIS software, are considered in the analysis. Then, for each of these areas, a Kolmogorov-Smirnov statistical test (K-S) (Massey, 1951) is done to compare the likeness of two data distributions. The K–S is a nonparametric test that can evaluate whether two datasets belong to the same distribution. This test calculates the maximum distance (D-value) between both empirical cumulative distributions, and compares it with the size-dependent value Dc(α) obtained for the particular significance level α. The null hypothesis (H0) assumes that the two considered data samples follow the same distribution. In addition, a p-value is calculated and it represents the probability of having the observed D-value from randomness, assuming that H0 is true. We use the typical value of 5% significance level to evaluate the results. When comparing intensity distributions of the two scenarios, if H0 is accepted it means that the two scenarios are still too similar in the sampling points and we cannot statistically distinguish the best candidate, so this method cannot be fully applied. However, if H0 is rejected in this step, we can continue on with the analysis. Finally, the K-S test is carried out again to compare the simulated intensity distribution of each scenario with the observed intensity distribution. Presumably, there will be one scenario were H0 is accepted and, then, the candidate earthquake fault source after which this scenario was modeled may be the best candidate to explain the earthquake effects and, thus, the closest to the fault that produced that specific event.
4 Results
4.1 2011 Lorca earthquake: control earthquake
Although of moderate magnitude (Mw 5.2), the 2011 Lorca earthquake produced nine casualties and large economic losses in Lorca (Martínez-Díaz et al., 2012a; Benito Oterino et al., 2012; Rodríguez-Pascua et al., 2012), and it was felt in a large area (Figure 3). The shallowness of the earthquake focus (4.6 km), its proximity to the city of Lorca (5.5 km) and the directivity of the rupture propagation that induced maximum PGA values larger than expected, may explain its catastrophic consequences (López-Comino et al., 2012). The analysis of the coseismic deformation using radar interferometry (INSAR), as well as the seismological data, allowed Martínez-Díaz et al. (2012b) and Frontera et al. (2012) to localize and model the causative fault and relate the earthquake to the Alhama de Murcia fault (AMF) (red rectangle in Figure 3B), one of the major tectonic structures of this area, which is known to have caused large earthquakes of M > 6.0 in both historical and pre-historical times (Masana et al., 2004; Martínez-Díaz et al., 2019; Martínez-Díaz et al., 2012a; Ortuño et al., 2012).
Using the Gasperini method, we have modeled the probable rupture area of the 2011 Lorca earthquake from the macroseismic data presented by Martínez-Díaz et al. (2012a) (purple rectangle in Figure 3B and Table 1). The computed epicenter is localized at 37.6815° N and 1.6905° W, centered in the city of Lorca, and the resulting earthquake source has an area of 8.84 km2, strikes N75° E and the obtained estimated magnitude is Mw 4.83 ± 0.20. The modeled epicenter is localized 3.6 km towards the SSW of the instrumental epicenter and the rupture area lies on top of the AMF, partially overlapping with the rupture derived from INSAR and seismological data (red rectangle in Figure 3B). Even though the rupture area modeled with the Gasperini method appears to be slightly displaced to the southwest and a bit smaller than the INSAR-derived area, there is a rather good correlation in both size and strike. The discrepancy on the location of both sources may be related to the bias in the distribution of the intensity data points in the epicentral area, most of them restricted to the southeast of the fault where the town of Lorca is located. Considering the good agreement between the source modeled from the intensity data points and the seismological and INSAR data, we consider that the Gasperini method using the coefficients calibrated for the Betics region (Gomez-Capera et al., 2014) may be a suitable first approach to select the candidate faults that could have produced the Malaga 1680 and the Dalías 1804 earthquakes.
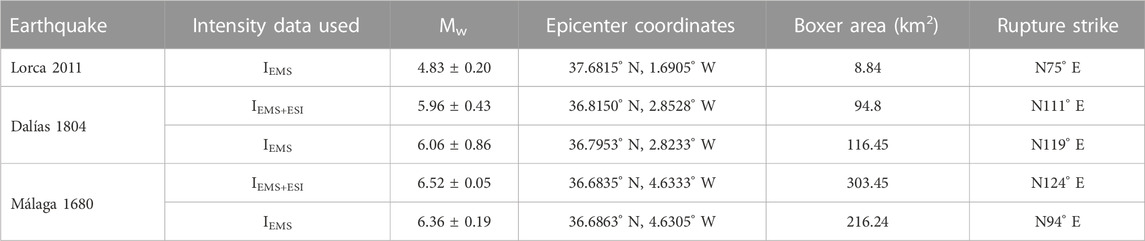
TABLE 1. Rupture parameters calculated with the Gasperini method for each earthquake.
In order to select the GMM and the GMICE that better represents the study area, we have built seismic scenarios using the fault parameters corresponding to a simplified AMF (Table 2). According to Quirós Hernández (2017), we have tested the two GMM recommended for this zone, Abrahamson et al. (2014) and Campbell and Bozorgnia (2014). For the GMICE, we have tested five global conversion equations: Caprio et al. (2015), Wald et al. (1999), Tselentis and Danciu (2008), Atkinson and Kaka (2007), and Worden et al. (2012). Residuals for the different combinations of GMM and GMICE for the Lorca earthquake are shown in Figure 4. The closer the residual is to 0, the best the simulated seismic scenario fits the observed intensity field. Both GMMs used show good results (Figure 4), although Campbell and Bozorgnia (2014) shows residuals slightly closer to 0. Both models were built based on similar databases and share almost identical applicability ranges, although Campbell and Bozorgnia (2014) covers a larger range of Vs.30 values for the site amplification: from 150 to 1500 m/s, in contraposition to the 180—900 m/s for Abrahamson et al. (2014). The range of Vs.30 values in the study area is 150–1500 m/s. For the sake of avoiding duplicity of scenarios, for its better performance with the Lorca earthquake (even if the difference with Abrahamson et al. (2014)’s GMM was little) and for its larger range of applicability, we chose to use Campbell and Bozorgnia (2014)’s GMM to generate the ground-motion fields for the studied historical earthquakes. For the GMICE, the best performing equation, the one with R closer to zero, is Worden et al. (2012) (Figure 4). According to these results, we have chosen the GMICE proposed by Worden et al. (2012) to calculate the intensity values in the analysis of the Málaga and Dalías earthquakes.
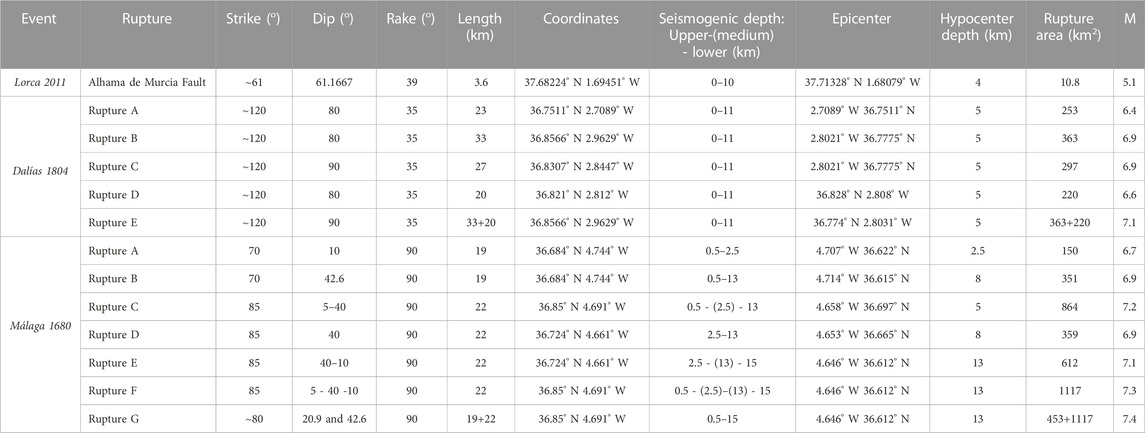
TABLE 2. Seismic source parameters for the seismic scenarios of each candidate rupture for the Dalías and Málaga earthquakes, and for the source of the Lorca earthquake.
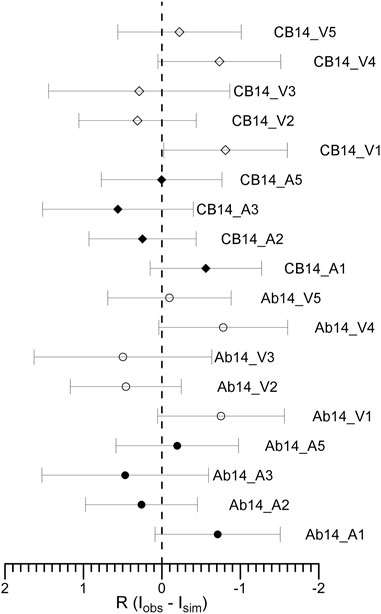
FIGURE 4. Resume of the residuals (R) for the calibration of the seismic scenario method with the 2011 Lorca earthquake as the test case. Each point represents the residuals for a scenario for the Lorca earthquake built with a different combination of GMM and GMICE. The closer R is to 0, the best the scenario (Isim) fits the observed intensity field (Iobs). Points correspond to the mean of the residuals and error bars correspond to the standard deviation. Round points correspond to scenarios built with the Abrahamson et al. (2014) GMM (Ab14) and diamond points correspond to scenarios built with the Campbell and Bozorgnia (2014) GMM (CB14). The number at the end of the labels represents the GMICE which was used in each case: 1=Caprio et al. (2015), 2=Wald et al. (1999), 3=Tselentis and Danciu (2008), 4=Atkinson and Kaka (2007), 5=Worden et al. (2012). Intensities were derived from both PGA (black points, A before the number) and PGV (white points, V before the number).
We also used the Lorca earthquake to test several empirical relations to estimate the magnitude of an earthquake from the size of the rupture. As has been stated before, the Mw for this event was 5.2 (López-Comino et al., 2012). Using the equations in Hanks and Bakun (2008), we obtained Mw 5.0. Wells and Coppersmith (1994) gave Mw 5.7 when using rupture length as input and 5.1 when using rupture area. Stirling et al. (2002)’s equations resulted in Mw 6.3 when using the length of the rupture as the input parameter and Mw 5.8 when using the rupture area. With Wesnousky (2008), the calculated Mw was 6.0. We decided to use Hanks and Bakun (2008), Wells and Coppersmith (1994), and Stirling et al. (2002), using rupture area as the preferred input parameter instead of rupture length. When deciding the input Mw for the Málaga and Dalías simulations, we consider the magnitude proposed in the bibliography as the minimum possible magnitude. If this minimum magnitude does not produce simulations with high enough intensities to match the observed intensity field, we calculate Mw from the size of the rupture modeled in OpenQuake (which does not necessarily have to match the size of the boxer) using the aforementioned size-magnitude scaling equations.
4.2 1804 Dalías earthquake
On 25 August 1804, the Dalías earthquake caused important damage as well as geological effects (liquefaction, rock falls and hydrogeological anomalies, among others) all around the Campo de Dalías area (Murphy Corella, 2019) (Figure 1; Figure 5). There are 83 intensity data points available from Murphy Corella (2019) for this earthquake, 47 of them corresponding to geological effects with intensity values assigned in the ESI-07 scale (IESI henceforth) and the rest corresponding to EMS-98 intensity values (IEMS henceforth). Different studies have estimated that its magnitude would be 6.4-6.6 and have located its epicenter either inland (Figure 5) or in an unspecified offshore location, but its seismic fault source remains unclear (Espinar Moreno, 1994; Martínez Solares, 2011; Huerta et al., 2015; Murphy Corella, 2019).
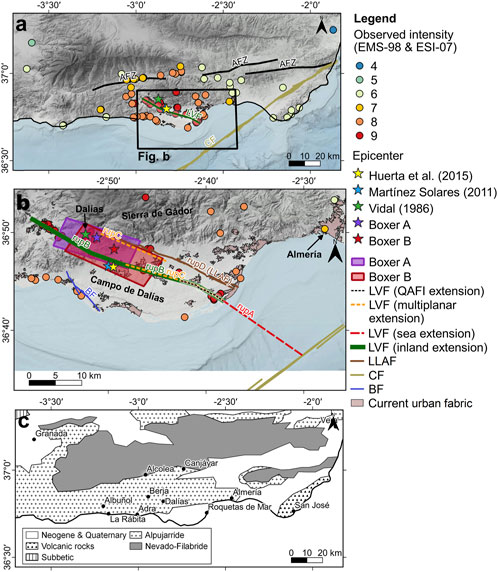
FIGURE 5. Intensity field of the 1804 Dalías earthquake (A) from Murphy Corella (2019), epicentral area (B) and geology of the area [(C), modified from Sanz de Galdeano and Alfaro, 2004). Fault traces are from the QAFI (García-Mayordomo et al., 2012) and from Pedrera et al. (2012) and Molins-Vigatà et al. (2022). The Boxers are modeled with Gasperini et al. (1999, 2010) using the IEMS+ESI dataset (boxer A) and the IEMS dataset (boxer B). Bibliographic sources for the different locations of the earthquake are included in the figure’s legend. AFZ=Alpujarras Fault Zone; CF=Carboneras Fault; LVF=Loma del Viento Fault; BF=Balanegra Fault; LLAF= Llano del Águila Fault.
Geologically, Campo de Dalías is one of the Neogene basins controlled by NW-SE faults. The sedimentary sequence, which lies over the Alpujárride metamorphic basement, goes from the Upper Tortonian to the Holocene showing a process of marine regression, and is composed of sedimentary rocks deformed by subtle E-W trending, high-wavelength folds and by neotectonic faulting (Rodríguez-Fernández and Martín-Penela, 1993; Martínez-Díaz, 1999; Sanz de Galdeano and Alfaro, 2004; Marín-Lechado et al., 2007; Pedrera et al., 2012). The Alpujárride basement outcrops outside Campo de Dalías, in Sierra de Gádor, the relief which delimits the basin to the north (Sanz de Galdeano and Alfaro, 2004; Marín-Lechado et al., 2007; Pedrera et al., 2012) (Figure 5C). Tectonically, Campo de Dalías has a complex system of faults and rotating blocks of crust delimited by the CF offshore to the SE and the AFZ inland to the N (Figure 5 in this work; figure 11 in Martínez-Díaz and Hernández-Enrile, 2004). These blocks, delimited by oblique faults, are part of a bigger, wedge-shaped crustal block which may escape westwards (Martínez-Díaz and Hernández-Enrile, 2004). Among these faults is the Loma del Viento Fault (LVF), a NW-SE normal-dextral segmented fault whose inland mapped trace is around 8 km long (Marín-Lechado et al., 2005; García-Mayordomo et al., 2012), but according to Murphy Corella (2019) and Pedrera et al. (2012) it could actually extend both offshore and inland to reach more than 30 km in total length. Mostly parallel to the LVF, but at ∼3 km to the north-east from its trace is the Llano del Águila Fault (LLAF), a 20-km long normal-dextral fault which has been recently mapped in detail by Molins-Vigatà et al. (2022). The Balanegra Fault (BF) is another of these normal-dextral faults delimiting the rotating blocks, which is localized to the south of LVF and with a total inland length of around 9 km (Martínez-Díaz and Hernández-Enrile, 2004; Marín-Lechado et al., 2010; Sanz de Galdeano et al., 2020). The distribution of the intensity data points (Figure 5) suggests that either of these three faults could have generated the 1804 Dalías earthquake.
Since there is a significant amount of IESI points in the intensity field of this earthquake, we used the Gasperini method twice, one with the whole intensity field (IEMS+ESI dataset henceforth) and the other with only the IEMS points. The aim was to check whether or not the addition of the IESI points to the dataset changes the results on this step of the analysis. In both cases, the source location for the Dalías earthquake obtained using the Gasperini method is estimated northwest of the Campo de Dalías, between the LVF and the LLAF (Figure 5). For the IEMS+ESI dataset, this method has provided an epicenter 36.82° N and 2.85° W, a magnitude of 5.96 ± 0.43, and a rupture area of 94.8 km2 with a strike of N111° E, similar to the LVF and the LLAF (boxer A in Figure 5B and Table 1). For the IEMS dataset, the method provides an epicenter 36.79° N and 2.82° W, a magnitude of 6.06 ± 0.86, and a rupture area of 116.45 km2 with a strike of N119° E, also quite close to the strike of the local faults (boxer B in Figure 5B and Table 1). The geometric characteristics, such as length, size and strike, and the location of the modeled source areas suggest that the LVF or the LLAF may be the best fault candidates to have generated the 1804 Dalías earthquake. Even though the BF’s strike is similar to the modeled source areas, its position far to the south may discard it as a possible source for this earthquake. Finally, we have discarded the CF as possible candidate due to the distance from the modeled source and the disagreement in strike. In agreement to all these observations, the preferred rupture candidates are the LVF and/or the LLAF. For LVF we have considered three different possible ruptures scenarios (Table 2; Figure 5) and two of the LLAF (Figure 5):
- Scenario D1: LVF extended towards the sea following descriptions by Murphy Corella (2019) and the model of Martínez-Díaz and Hernández-Enrile (2004) (rupture A).
- Scenario D2: Rupture of the LVF extended towards the Alpujarras mountain range following the model of Martínez-Díaz and Hernández-Enrile (2004) and simplifying the multiple fault traces present around the Berja and Dalías area for modelling purposes (rupture B).
- Scenario D3: Multiplanar LVF as mapped by Pedrera et al. (2012) (rupture C).
- Scenario D4: Rupture of the full LLAF mapped by Molins-Vigatà et al. (2022) simplified for modelling purposes (rupture D).
- Scenario D5: Combined rupture of both LLAF from scenario D4 and LVF from scenario D2 (rupture E).
The seismic scenario simulations for the Dalías earthquake for each candidate fault rupture (Figure 6) show that there is an evident spatial discrepancy between the distribution of Iobs values and the pattern of simulated intensities for Scenario D1 (Figure 6A). In addition, the analysis of the residuals show that the maximum intensity calculated for this scenario D1 is almost 2 degrees lower than the maximum observed intensity on average (Figure 7). These observations suggest that this source may be discarded as a possible source of the earthquake. The scenarios considering inland ruptures (scenarios D2-D5) show better correlation with the observed intensity data points (Figures 6B–E); however, the analysis of the residuals corresponding to the intensities derived from PGA and PGV indicate that overall the modeled intensities are lower than the observed ones (Figure 7). The comparison of the residuals between these four scenarios show that the lower residuals, which are less than 1 intensity degree, are obtained for scenarios D2 and D5 (Figure 7). In contrast, scenarios D3 and, specially, D4 result in intensities a little bit much lower than the previous ones (Figure 7). These differences are consistent with the spatial distribution of intensities in map view (Figures 6B–E), suggesting that scenarios D2 and D5 are the more plausible ones. Accordingly, we selected these two scenarios to carry out the spatial difference analysis to define the best scenario.
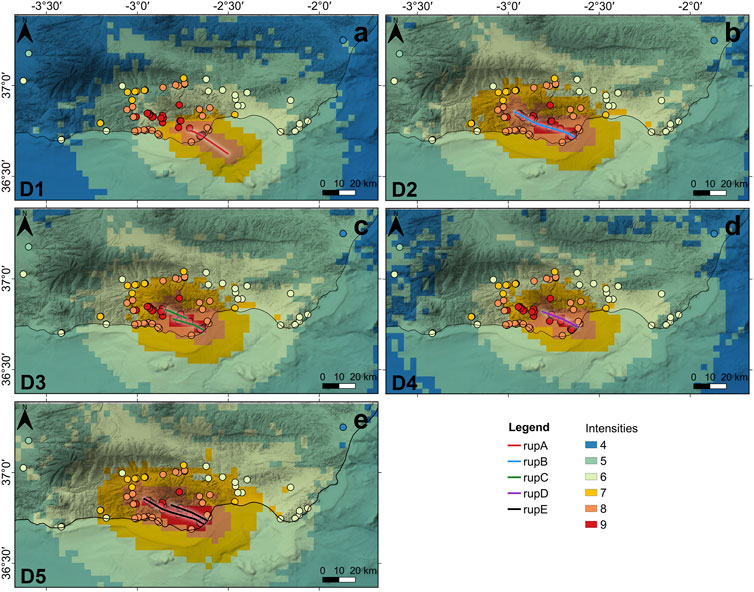
FIGURE 6. Seismic scenarios for the 1804 Dalías earthquake modeled after the five candidate ruptures: sea extension of the LVF [(A), scenario D1], inland extension of the LVF [(B), scenario D2], multiplanar version of the LVF as mapped by Pedrera et al. (2012) [(C), scenario D3], LLAF [(D), scenario D4] and combined rupture of LVF and LLAF [(E), scenario D5]. Murphy Corella (2019)’s intensity field has been included in the same color scheme as the simulations.
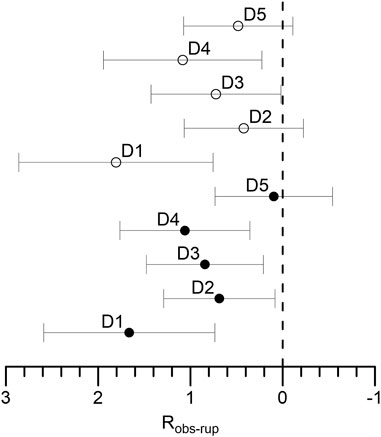
FIGURE 7. Resume of the results for the scenario comparison for the 1804 Dalías earthquake. Each point represents the residuals for each of the candidate ruptures’ scenario. The points represent the mean of the residuals and the error bars represent the standard deviation. The closer R is to 0, the better fit between the observed intensity (obs) and the scenario (rup), and so the closer the candidate rupture is to the actual source of the earthquake. Black points correspond to scenarios derived from PGA and white points correspond to scenarios derived from PGV. D1=rupture A, D2=rupture B, D3=rupture C, D4=rupture D, D5=rupture E.
The spatial intensity difference map (Figure 8) shows the areas in which the preferred scenarios D2 and D5 differ from each other, as well as the 14 intensity data points located inside these areas (“useful points” henceforth). Any intensity data point outside of these areas is not considered useful for the analysis, as stated in the Methodology section. Scenario D2 produces lower intensities than scenario D5 towards the northeast of the interest area, whereas towards the south the values are rather similar between both scenarios. Histograms on Figure 8 show the distribution of frequencies of the intensity values sampled from the useful points for scenarios D2 (IrupB) and D5 (IrupE), as well as the distribution of frequencies of the observed intensities (Iobs). Scenario D5’s distribution seems to be closer to the distribution of Iobs. In contrast, scenario D2 is slightly off towards lower intensity values. However, the distribution of frequencies does not completely match neither for scenario D2, nor D5. Then, visual inspection of the histograms is not conclusive to select between scenarios.
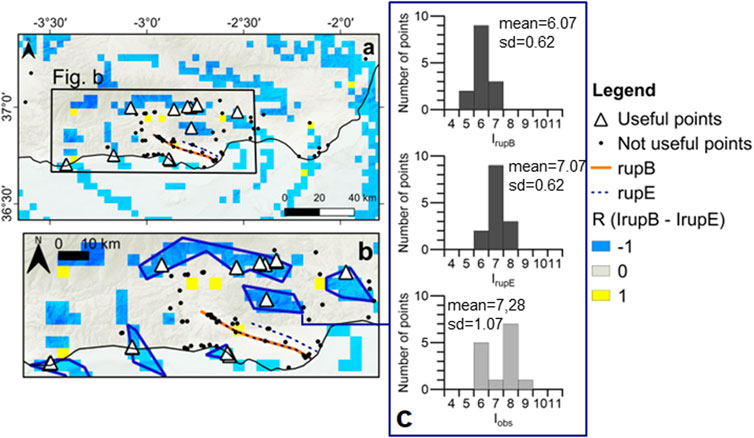
FIGURE 8. Spatial differences between values of scenarios D2 (rupture B) and D5 (rupture E) of the 1804 Dalías earthquake (A) and areas where the spatial residuals analysis has been performed (B). Selected points for this analysis are represented by triangles and unselected points by dots. Histograms (C) show the distribution of frequencies of the intensities sampled from each scenario (IrupB for rupture B and IrupE for rupture E) in these points and from the observed intensity field (Iobs).
In the areas where the results of scenario D2 and scenario D5 differ we have first used the K-S tests to evaluate if the intensity values sampled in the useful points from both scenarios belong to the same distribution or not. In the case of the scenarios calculated using PGA, the null hypothesis H0 is rejected at 5% significance level. This means that the two distributions are statistically different enough and thus the last step of the analysis can be carried out. We then compare Iobs with the simulated intensities for each of the two scenarios using the K-S test. In this last step, H0 is rejected at the 5% significance level for scenario D2 and accepted for scenario D5. These results are presented in Table 3 and may suggest that scenario D5 provides the most consistent distribution of intensities in comparison to the observed data.
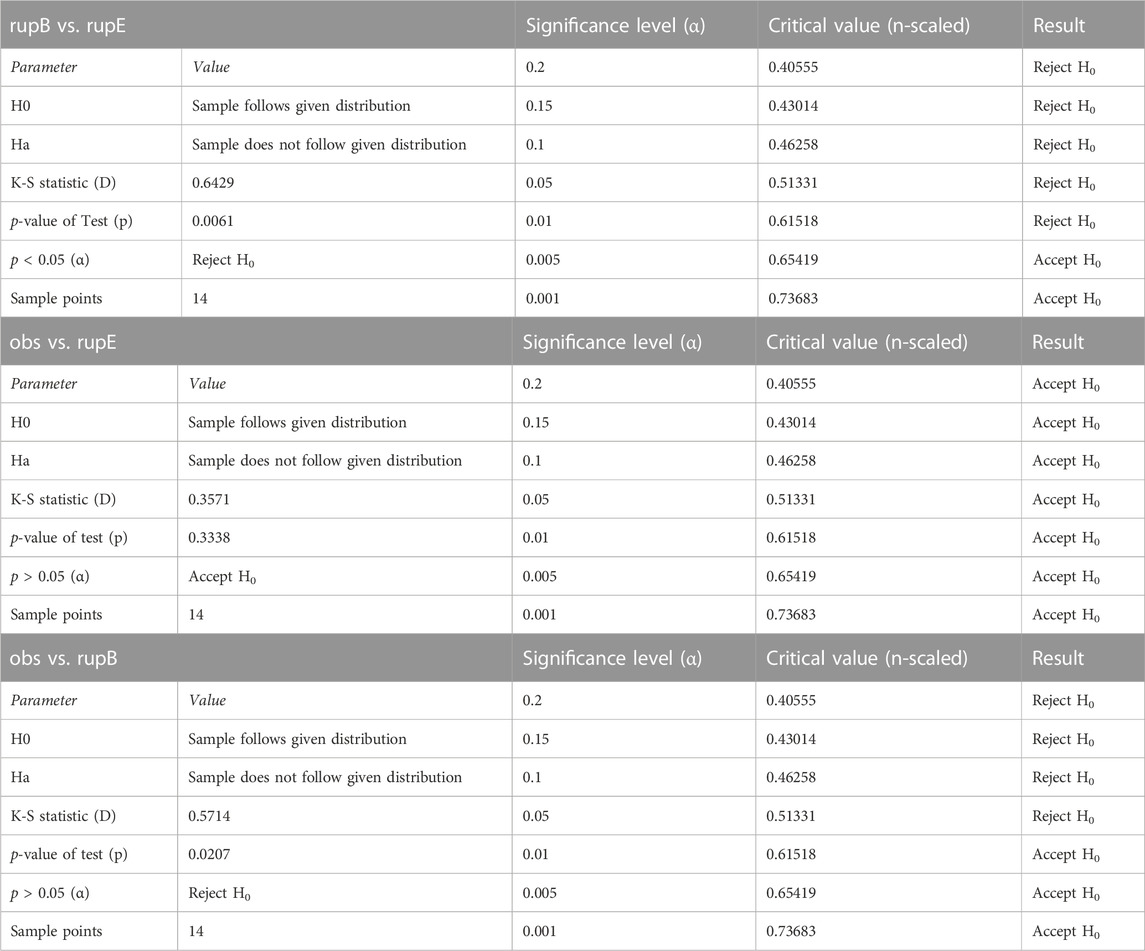
TABLE 3. Results of the Kolmogorov-Smirnov (K-S) tests for rupture B and rupture E of the 1804 Dalías earthquake. The location of the sample points is shown on Figure 8.
4.3 1680 Málaga earthquake
The 1680 Málaga earthquake produced damages in the province of Málaga and was felt in a larger area (Figure 9). Its estimated magnitude ranges between 6.6 and 6.8 (Muñoz and Udías, 1988; Martínez Solares and Mezcua Rodríguez, 2002). There is a total of 35 intensity data points available for this earthquake from Silva Barroso et al. (2019), eight based on the evaluation of geological effects in the ESI-07 scale and the others provided by regular macroseismic analysis considering also archaeological effects in the EMS-98 and MSK-64 scales. Even with all this information, there is still uncertainty about the source of the earthquake. Goded et al. (2008) suggested an inland location, although they did not point to any specific fault. Alternatively, Mezcua et al. (2013) pointed at the El Acebuchal and Los Alamillos Faults as possible sources (Figure 9). Several other faults have been mapped in the area, such as the Montes de Málaga Fault (MMF) and the Cártama, Mijas and Villafranco de Guadalhorce (VDG) Faults (Figure 9) (García-Mayordomo et al., 2012). These faults trend approximately E-W and Insua Arévalo (2008) proposed a structural model consisting of blind thrust fault strands whose dip varies along ramps and flats with all strands merging at depth (Figure 9). Although it has not been mapped nor named yet, it has been proposed that there is a third blind thrust to the east of the Mijas system with similar length and strike as the Cártama and VDG Faults (“blind fault” in Figure 9) (Insua Arévalo, 2008). Geologically, the Málaga basin consists of a sequence of regression-transgression-regression in its sedimentary record ranging from Tortonian to Quaternary and lying over the Alpujárride and Maláguide metamorphic basements (Sanz de Galdeano and López-Garrido, 1992; López-Garrido and Sanz de Galdeano, 1999; Guerra-Merchán et al., 2000). The metamorphic basement outcrops to the north and south of this basin, and was formed by a superimposition of the Maláguide and Alpujárride units, both of which have a complex internal structure (Vera et al., 2004; Insua Arévalo, 2008) (Figure 9B).
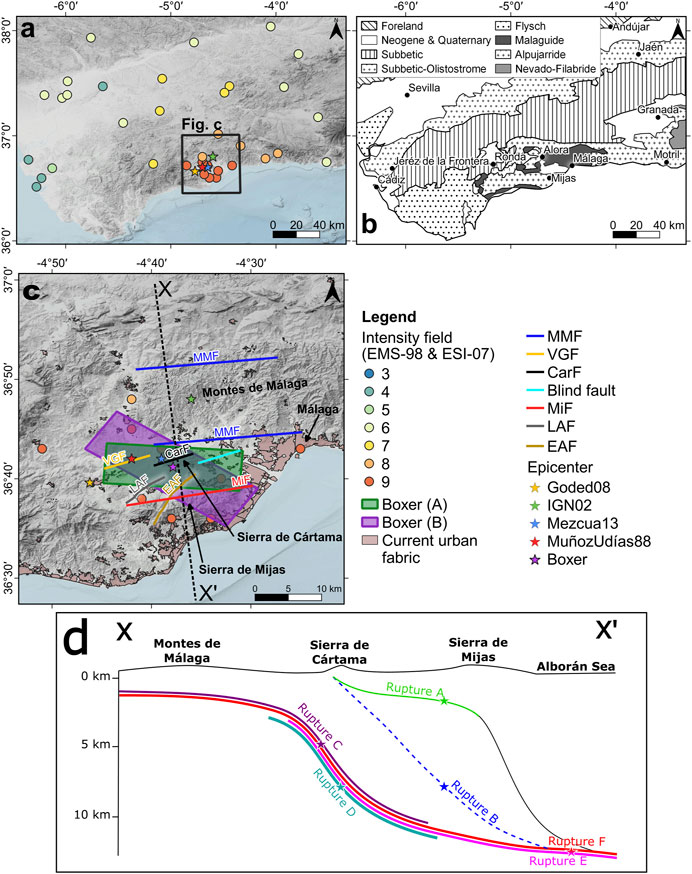
FIGURE 9. Intensity field for the 1680 Málaga earthquake (A) (Silva Barroso et al., 2019), geology of the area [(B), modified from Sanz de Galdeano and Alfaro, 2004], epicentral area of the earthquake (C) and fault geometry of the Montes de Málaga Fault and the fault system formed by the Mijas, Cártama and Villafranco de Guadalhorce Faults [(D), modified from Insua Arévalo, 2008]. Geometry of the different candidate ruptures (Table 2) has been marked in colors. Fault traces are from the QAFI (García-Mayordomo et al., 2012). Bibliographic sources for the location of the epicenter are included in the figure’s legend. Boxer A has been modeled with the EMS intensities. Boxer B has been modeled with the full EMS+ESI intensity field. X-X’: profile shown in c. MMF=Montes de Málaga Fault; VGF=Villafranco de Guadalhorce Fault; CarF=Cártama Fault; MiF=Mijas Fault; EAF=El Acebuchal Fault; LAF=Los Alamillos Fault. Goded08=Goded et al. (2008), IGN02=Martínez Solares and Mezcua Rodríguez (2002), Mezcua13= Mezcua et al. (2013), MuñozUdías88=Muñoz and Udías (1988).
For the Málaga earthquake we used the Gasperini method with two different datasets. The first one only considered the EMS-98 intensities compiled by Goded et al. (2008) (area A henceforth) and the second one corresponded to the intensities provided in Silva Barroso et al. (2019) (area B henceforth). Both modeled seismic sources overlap and the location of the computed epicenters is rather similar (Figure 9; Table 1). However, there is a significant divergence with the dimensions of the rupture area and its strike. The area obtained for the A dataset measures 216.24 km2 and strikes N94° E, whereas for the B dataset measures 303.45 km2 and shows a trend of N124° E. In agreement, the change in dimensions of the rupture areas also implies a difference in the resulting estimated magnitude for both ruptures, being 6.36 ± 0.19 and 6.52 ± 0.05 for A and B datasets, respectively. When compared with the faults mapped in the study area, both modeled ruptures partially or totally overlap with the fault system consisting of the VDG, Cártama and Mijas Faults, as well as the southern MMF faults. However, area A’s strike is in better agreement with the general trend of the local faults. Considering the relationship between both modeled ruptures and the mapped faults, we selected seven possible rupture scenarios. In addition, we discarded the El Acebuchal and Los Alamillos Faults as possible fault candidates because they did not match any of the area source solutions neither in size or strike. The modeled fault ruptures are shown in the cross-section in Figure 9D and the used parameters for each rupture are summarized in Table 2. The seven scenarios are (Figure 9D; Figure 10):
- Scenario M1: Conjunct rupture of the Cártama, VFG and the third blind fault to the east considering the flat and frontal ramp geometry, and not involving the deeper thrust ramp corresponding to the Mijas fault, with a hypocentral depth of 2.5 km (rupture A in Figure 9D).
- Scenario M2: Full rupture of a blind thrust ramp equivalent to the Cártama, VFG, the blind thrust and the Mijas faults (rupture B in Figure 9D). The geometry of the fault system has been simplified and the hypocentral depth localized at 8 km.
- Scenario M3: Complex rupture of the MMF thrust, including upper flat and ramp, with hypocentral depth of 5 km (rupture C in Figure 9D).
- Scenario M4: Simple rupture of the MMF, including only the ramp, with hypocentral depth of 8 km (rupture D in Figure 9D).
- Scenario M5: Complex rupture of the MMF, including the ramp and the lower flat, with hypocentral depth of 13 km (rupture E in Figure 9D).
- Scenario M6: Whole rupture of the MMF, with hypocentral depth of 13 km (rupture F in Figure 9D).
- Scenario M7: Conjunct rupture of the MMF and the Cártama, VFG and Mijas system (including the third blind fault), with hypocentral depth of 13 km (rupture G). This rupture has been simplified as a multiplanar rupture of two simple surfaces because OpenQuake does not compute simulations with more than one complex surface, but the magnitude used is the one corresponding to the complex surface model.
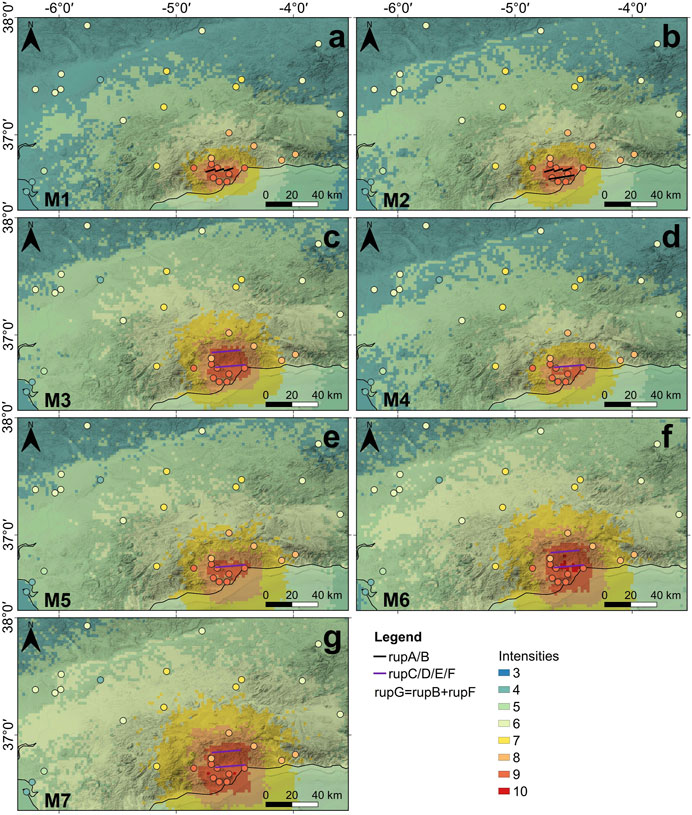
FIGURE 10. Seismic scenarios modeled for the 1680 Málaga earthquake after the five candidate ruptures: a combined rupture of the VDG and Cártama Faults, plus the blind hypothetical thrust [(A), scenario M1], simplified rupture of the VDG, Cártama, Mijas and blind thrust system [(B), scenario M2], complex ruptures of the MMF considering the upper flat and the ramp [(C), scenario M3], only the ramp [(D), scenario M4], the ramp and the lower flat [(E), scenario M5] and the ramp and both flats [(F), scenario M6] and a combined rupture of the MMF and VDG, Cártama, Mijas and blind thrust system, simplified for modelling purposes [(G), scenario M7]. Silva Barroso et al. (2019)´s intensity field has been included in the same color scheme as the simulations.
The spatial distribution of simulated intensities (Figure 10) does not allow for a clear rejection or candidate selection from the defined scenarios because of the mismatch of intensities below VII between observed and simulated intensities. The comparison of the distribution between the maximum simulated intensity area and maximum observed intensities (Figure 10) suggests that all the scenarios may seem plausible, with the exception for M4. In addition, the analysis of the residuals for each of the scenarios shows that the simulated average intensities are between 1.6 and 0.3 degrees lower than the observed ones (Figure 11). However, the best residuals are provided by scenarios M6 and M7, which are around 0.5–0.3 degrees lower than the observed intensities. Scenarios M1, M2 and M4 produce average intensities 1.2–1.6 degrees lower than the observed ones, which may suggest that ruptures A, B and D are the less plausible candidates. Finally, scenarios M3 and M5 show average intensities almost 1 degrees lower than the observed intensity, which makes ruptures C and E unfitting to be considered good candidates either. This would point to ruptures G and F as the preferred candidates, in that order. We thus move on to the next step of the analysis with candidate ruptures G and F.
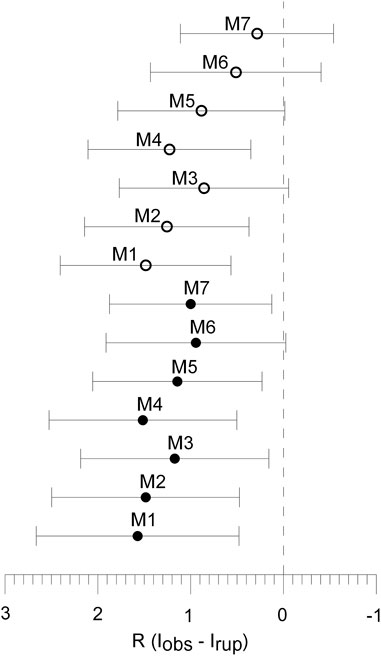
FIGURE 11. Resume of the results for the scenario comparison for the 1680 Málaga earthquake. Each point represents the residuals for each of the candidate ruptures’ scenario. The points represent the mean of the residuals and the error bars represent the standard deviation. The closer R is to 0, the better fit between the observed intensity (obs) and the scenario (rup), and so the closer the candidate rupture is to the actual source of the earthquake. Black points correspond to scenarios derived from PGA and white points correspond to scenarios derived from PGV. M1=rupture A, M2=rupture B, M3=rupture C, M4=rupture D, M5=rupture E, M6=rupture F, M7=rupture G.
The spatial intensity difference map for this earthquake (Figure 12) shows that in some areas scenario M7 produces higher intensities than M6 (blue polygons in Figure 12) and the contrary in others (red polygons in Figure 12). Unfortunately, there are only four useful points inside these areas from the observed intensities data points, which are not enough to perform a robust statistical test. Thus, the spatial intensity step of the analysis could not be carried out for the Málaga earthquake.
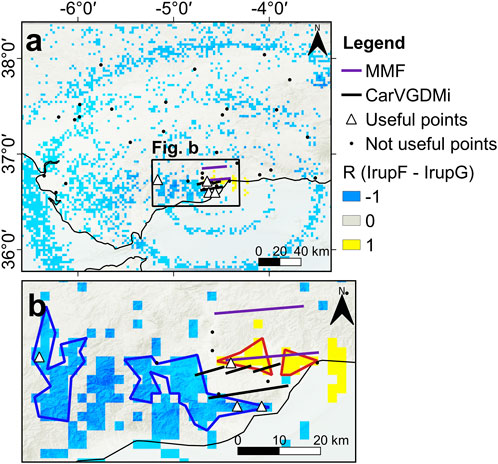
FIGURE 12. Spatial differences between values of scenarios M6 (rupture F) and M7 (rupture G) of the 1680 Málaga earthquake (A) and areas where the spatial residuals analysis would have been performed, were it more sampling points available (B). Useful points for this analysis are represented by triangles and not useful points by dots. CarVGDMi refers to the Cártama, VDG and Mijas fault system.
5 Discussion
5.1 2011 Lorca earthquake
We have used the Lorca earthquake as a calibration event to test the accuracy of both the Gasperini method and several magnitude-rupture size regressions, as well as to establish the best performing combination of GMM-GMICE in the study region. The 2011 Lorca earthquake was the strongest event occurred during the instrumental period at a shallow hypocentral depth. Despite its moderate magnitude (Mw 5.2), the Lorca event generated a notable volume of intensity data that is suitable for intensity distribution analysis. In addition, its seismic source has already been determined in earlier studies allowing the comparison with the results obtained in the present study. Because of this, we consider the Lorca earthquake as the most reliable calibration event.
The magnitude of the Lorca earthquake is significantly lower than the ones estimated for the 1680 Málaga and the 1804 Dalías earthquakes and this could have had some influence on the results of the calibration for choosing the GMICE. The GMICEs of Caprio et al. (2015) and Tselentis and Danciu (2008), which were both designed using Mediterranean data, performed worse than Worden et al. (2012), which was built based mainly on North American data. While the differences between GMICEs’ residuals in the calibration step were notable, the difference between the results of the two GMMs during the calibration was quite subtle (Figure 4), so much that we do not consider an increment on magnitude may aggrandize these differences notably. In addition to this, both GMMs have been recommended for this region and used by Quirós Hernández (2017). Because of this, we consider the difference in magnitude between the Lorca earthquake and the other two studied events has not had a relevant influence in the results of the GMM calibration.
The equations to estimate magnitude from rupture size that performed better with the Lorca earthquake were Hanks and Bakun (2008), Wells and Coppersmith (1994) and Stirling et al. (2002), using rupture area instead of rupture length for the latter. Stirling et al. (2013) did a shortlist of scaling magnitude equations from several authors for each tectonic environment and recommend Hanks and Bakun (2008) for strike-slip faults only (such as the AMF, source of the Lorca earthquake). Stirling et al. (2013) considered Wells and Coppersmith (1994) and Stirling et al. (2002) could be used globally in different geodynamic contexts and applied to any fault regardless of its kinematics. Since our candidate faults were normal for the Dalías earthquake and reverse for the Málaga one, we preferred using global equations instead of equations recommended for particular kinematics. We also chose to rely more on the equations by each author that consider rupture area instead of length, since, especially in the Málaga case, we have several candidate ruptures with the same length but different areas.
5.2 1804 Dalías earthquake
In the case of the Dalías earthquake, our results show that the candidates which fit better the observed intensity data are all inland faults, agreeing with Espinar Moreno (1994). The best performing simulations, D2 and D5, were the only ones that generated intensities high enough to match observed ones. The magnitude derived for these two scenarios taking into account the modeled source dimensions ranges between Mw 6.9 and 7.1 for D2 and D5, respectively. Although the obtained magnitude is higher than the Mw 6.4-6.6 proposed previously (Martínez Solares, 2011; Huerta et al., 2015; Murphy Corella, 2019), we prefer the newly estimated magnitudes since the resulting intensity distribution fits better the historical and geological observations.
The source area modeled using the dataset that includes the geological effects (Murphy Corella, 2019) slightly differs in size, strike and position from the one using only macroseismic data (Figure 5; Table 1). Considering that the Gasperini method uses the points with the highest degrees of intensity minus one degree (Imax-1) to calculate position and strike of the source area, these differences may be related to the number and distribution of the maximum intensity data points. Although in both datasets the spatial distributions of the points along Campo de Dalías and the surrounding area is similar, the dataset that combines the macroseismic and the geological effects data includes 24 locations with an assigned intensity of VIII, per 13 locations when using just IEMS data. Knowing that the Gasperini method results highly depend on the high intensity data point spatial distribution and that earthquake geological effects are usually localized in the areas that have experienced large ground motion, it seems advisable to use the geological effects, when available, to better constrain the modeled earthquake source.
Mw calculated with Boxer for the IEMS+ESI dataset was 5.96 ± 0.43, while for the IEMS dataset the result was Mw 6.06 ± 0.86. Both calculated magnitudes are quite similar considering their respective error margins, and they are both also lower than the magnitudes proposed by independent authors in the bibliography. For this reason, we consider Boxer to be clearly underestimating this earthquake’s magnitude. This underestimation could be related to the asymmetry in the observed intensity field: as it is shown in Figure 5, this earthquake occurred in a coastal area, so there is a complete lack of data in the marine area to the southeast. This asymmetry might make it difficult to assess the exact magnitude of this earthquake, and could have also affected the calculations of Huerta et al. (2015) and Martínez Solares (2011), since they used macroseismic intensities to estimate the magnitude as well. Murphy Corella (2019) partially evaded this issue by calculating the magnitude from the length of his proposed source rupture, which is slightly smaller than our preferred source.
Intensities derived from PGV performed similarly to those derived from PGA in the simulations for the Dalías earthquake, although the residuals show a higher standard deviation in the simulations derived from PGV (Figure 7). This tendency is consistent with what we have seen in the control earthquake of Lorca, where scenarios based on PGA showed residuals with overall lower standard deviations than their PGV-based counterparts (Figure 4). In the case of the Lorca earthquake, the PGA-based scenarios also showed average residuals closer to 0 than their PGV-based counterpart (Figure 4), which is also true for the D1, D4 and D5 scenarios in the Dalías earthquake (Figure 7). This could mean that PGA-based scenarios in this area show a more realistic intensity distribution, regardless of their similarity with the observed intensity field.
The spatial analysis of the residuals for rupture B and rupture E scenarios shows that the simulations are quite similar to each other, although there is an area (blue polygons in Figure 8) where intensities produced by rupture E are higher and more similar to the reported values. In addition, the histograms in Figure 8 and the results from the K-S test indicate that the best candidate among the five analyzed candidates may be rupture E. Accordingly, the combined rupture of the Loma del Viento and Llano del Águila Faults may be the closest to the actual seismic source of the 1804 Dalías earthquake. Our results agree with Murphy Corella (2019), who proposed the inland sector of the LVF as the most likely source of this event, and with Molins-Vigatà et al. (2022), who proposed that the LLAF might have also ruptured during the earthquake. As stated in section 3 of this work, this method ranks several candidates and searches for the one most similar to the actual source of the earthquake. This does not mean that the most plausible candidate has to be an exact representation of the earthquake source. Analysis of intensities alone does not provide that level of accuracy; intensity describes the effects of the earthquake, not a direct physical parameter, despite its rather good correlation with ground motion. Unfortunately, because of the intensive agricultural activity and greenhouse constructions, it is currently impossible to carry out paleoseismic studies to accurately identify the source of pre-instrumental earthquakes in Campo de Dalías. This leaves researchers with the analysis of historical earthquakes’ effects (such the one presented in this work) as the only available tool for searching for pre-instrumental seismic sources at the present day in this area. For this reason, and considering how our results agree with Espinar Moreno (1994), Murphy Corella (2019) and Molins-Vigatà et al. (2022), until a better candidate source for the Dalías earthquake is found, we recommend taking into account our results in future characterizations of the LVF and the LLAF, as well as in future seismic hazard assessments of the Campo de Dalías area. In doing so, future researchers should remember that the combined rupture of the LVF and the LLAF seems to be the best rupture candidate, but the single rupture of the LVF is also a plausible source for the Dalías earthquake.
It is important to point out that the 83 available intensity points with which we have worked in the Dalías earthquake are significantly less than the 170 points used during the development of the proposed methodology (de Pro-Díaz et al., 2022). However, despite the difference in observed intensity data points, the same methodology has allowed us to discern the best out of five candidates in the case of the Dalías earthquake. Accordingly, this new study carried out using a lower number of intensity data points highlights the potential of this methodology even with a limited dataset.
The 1804 Dalías earthquake intensity points data set contains 47 sites, out of 83, with the intensity assigned from geological effects (Murphy Corella, 2019). Including these sites in the dataset resulted in having a richer and more complete spatial coverage of intensity data, especially in rural and low-populated areas. According to Guerrieri and Vittori (2007), the EMS-98 scale for macroseismic intensities and the ESI-07 scale for geological effects can be quite well correlated when working from grade IV to grade IX. This is consistent with Ferrario et al. (2022), who verified the good correlation between the two scales and, also, recommended the combined use of EMS and ESI intensities when working with intensity fields. Since the maximum intensity values for the Dalías earthquake are lower than X and the spatial distribution of intensity data is irregular, we consider that the combined use of ESI and EMS intensities contributes to obtain scenarios which are more consistent with all the available data related to the release of seismic energy generated by the seismic source.
5.3 1680 Málaga earthquake
In the case of the Málaga earthquake, the difference in size and strike between the area sources obtained from the Gasperini method and using the IEMS+ESI dataset (A) or only the IEMS dataset (B) is evident (Figure 9). This shows, once again, how the Gasperini method is biased towards regions with a higher concentration of data points. It is important to remark that none of the candidate ruptures generated intensities high enough to match the observed intensity field, not even the ones with a larger rupture area than the boxer. That could be a sign that the Gasperini method is underestimating the size of the rupture for this earthquake, as it happened with the Dalías case. This underestimation could once again be due to the asymmetry of the intensity field, since the Málaga earthquake also occurred near the coast and we find the same lack of intensity data in the marine area (Figure 9). The lesser amount of available intensity data points in the Málaga case (35 points) might have contributed to underestimating the magnitude as well. Lastly, there is another factor that may have contributed to the underestimation, particularly in the Gasperini method when considering just the macroseismic information based exclusively on the EMS-98 scale (Goded et al., 2008). It has been pointed out that the EMS-98 scale might present some limitations when it comes to studying past earthquakes (e.g., Serva et al., 2015; Silva Barroso et al., 2019). In the case of the area source calculated from the combination of the macroseismic and geological effects data, this issue might have been mitigated by the combination of EMS-98 intensities together with geological and archaeological effects (Silva Barroso et al., 2019). This difference in the source of the input data could also contribute to the difference in size between the two area sources computed using the Gasperini method.
Our methodology identified two plausible candidates to be the source of the Málaga earthquake: a full rupture of the MMF (including both the upper and lower flats, as well as the ramp) and a combined rupture of the full MMF and Cártama, VDG and Mijas systems. The other candidates did not generate intensities high enough to match the observed intensity field. Even scenarios M6 and M7 seem to underestimate slightly the intensities, although by an average of only 0.5 and 0.3 degrees, respectively. Analyzing Figure 12, we can see that the trends we observed in both the Lorca and the Dalías cases, where PGA-based scenarios overall perform better and show lower standard deviations than PGV-based ones, are not reproduced in the Málaga earthquake. The best performing scenarios were built considering Mw 7.3 and 7.4, both higher than the magnitudes previously proposed by other authors for this earthquake, and also higher than the Mw computed by the Gasperini method. We were unable to apply the full extent of the methodology to the Málaga earthquake, so we are aware our results for this event are not as robust as the ones for the Dalías earthquake. Even so, we could rule out five of the seven candidate ruptures. Although we could not discern the best candidate between ruptures F and G, we believe the methodology allowed us to narrow down the possible earthquake source candidates.
We find three issues that might have influenced the results obtained for the Málaga earthquake. The first one is related to the limited amount of available data points. While in the case of the Dalías earthquake we had over 80 observed intensity data points available, in Málaga we only have 35 intensity data points, which are also distributed over a wide area (Figure 9). Even though we consider this an issue, we also have to state that we have been able to point to two possible rupture candidate over the seven proposed ones, which may imply an improvement over the previous knowledge.
The second potential issue is that this is the first time the seismic scenario method is applied to a system of blind thrust faults with complex geometry. Up to this day, the methodology has been used to study earthquakes that could be related to faults with a simpler geometry than that of the MMF and the Cártama, VDG, and Mijas Fault systems. Complex fault geometry in depth might be another limitation, which should be explored in future works. It is also a fact that OpenQuake does not yet compute scenarios with more than one complex rupture surface, so we could not properly model rupture G in this software. Despite this modelling limitation, we use OpenQuake because it is a free, open, user-friendly software that has proven useful before (de Pro-Díaz et al., 2022). The complex geometry issue may also be related to the geology of the Málaga area, where the Maláguide and Alpujárride complexes are predominant. These units have been described to have a complex internal structure (Vera et al., 2004; Insua Arévalo, 2008) and it has been observed before how the local geology and inherited tectonic and lithostratigraphic structures can influence the geometry of an earthquake rupture (e.g., Barchi et al., 2021; Yue et al., 2005; Chiarabba et al., 1997; Zhao and Kanamori, 1995).
The third potential issue is the lack of data about the faults in the study area. We have been working with the models proposed in Insua Arévalo (2008), which were built based on gravimetry, surface geology and geomorphological analysis. As far as we are aware, no public seismic reflection data has been acquired in this area, so the geometry and kinematics of these models have yet to be confirmed. A better constraint is needed in the geometry of the MMF and the Cártama, VDG, and Mijas systems with further geophysical studies, which were not the objective of this work.
Our results point to either a full rupture of the MMF or a conjunct rupture of the MMF and the Cártama, VDG and Mijas Fault system as the best candidate among the considered ones to be the source of the Málaga earthquake. Still, until a better candidate is found and based on our results, we tentatively consider the conjunct rupture as the closest candidate to the source of the Málaga earthquake. Nevertheless, we are aware that more constrains are needed on these results before they can be considered in future seismic hazard assessments of the Málaga area.
6 Conclusion
We have applied the Gasperini and seismic scenarios methods in this work to search for the source of the 1804 Dalías and the 1680 Málaga earthquakes. The best performing combination of GMM and GMICE to build seismic scenarios on SE Spain was the one of Campbell and Bozorgnia (2014) and Worden et al. (2012).
Gasperini’s method has been found to be biased towards the areas in which more intensity data points are available, and it can also underestimate the size of the rupture. For these reasons, Gasperini’s method on itself is not enough to search for the source of historical earthquakes. However, Gasperini’s method can be used as a general guide to select which faults in the area are plausible candidates to be the earthquake source.
With the seismic scenario method, we were able to identify the best candidate for the 1804 Dalías earthquake among five proposed ruptures. The most probable earthquake source may combine the rupture of the Loma del Viento and the Llano del Águila Faults, with a Mw 7.1 and hypocentral depth of 5 km.
The results for the 1680 Málaga earthquake were inconclusive. The methodology allowed us to discard five out of seven candidate ruptures, but it could not clearly discern the best candidate among a full rupture of the Montes de Málaga Fault and a conjunct rupture of the Montes de Málaga, Cártama, Villafranco de Guadalhorce and Mijas Faults. Despite this, we tentatively propose the conjunct rupture as the best candidate until a better one is proposed. The amount and distribution of intensity data points available for this earthquake, the modelling applicability of the software used, as well as the complex geometry of the faults and a lack of information on this geometry might have been limitations for the applicability of the seismic scenario method in this case. These limitations should continue to be explored in future works.
The results of this work for the Dalías earthquake can and should be used to improve the characterization of the faults in Campo de Dalías, as well as the seismic hazard assessment analysis of the area. As for the Málaga earthquake, unfortunately the results are not nearly as robust as the ones for the Dalías event, so they should be considered with caution until the limitations of the methodology are better constrained. There are still more historical earthquakes, both pre-instrumental and early-instrumental, in SE Spain whose seismic source remains unclear, and as long as there is a rich enough intensity field available for them, we believe that the combination of the Gasperini and seismic scenarios methods is providing remarkable results to constraint the fault source for historical earthquakes. In addition, including intensity data assigned from geological and archaeological effects in the ESI-07 scale is highly recommended, since it enriches the intensity field and complements the commonly available macroseismic intensity data. Finally, we have presented the potential of the described methodology and advise to consider it as a new option to study those large historical earthquakes where the source fault is still unknown.
Data availability statement
Publicly available datasets were analyzed in this study. This data can be found here: https://doi.org/10.1016/j.tecto.2012.04.010 https://www.ign.es/web/libros-digitales/terremotos-almeria-1804 http://e-spacio.uned.es/fez/view/bibliuned:grupinvestGAMA-Libros-Jlario-0001.
Author contributions
YPD conceived the study and wrote the first draft of the manuscript. YPD and HP calibrated, refined and applied the methodology. JJMD and JMIA contributed to the magnitude estimations and proposed candidate ruptures for the Málaga earthquake. CC contributed to the geological analysis. JJMD provided the Loma del Viento fault traces in the Dalías earthquake as well as their simplified version. All authors contributed to the article and approved the submitted version.
Funding
This research was supported by the grants STRENGTH (PID2019-104668RB-I00) and Model_SHaKER (PID2021-124155NB-C31) funded by MCIN/AEI/10.13039/501100011033 and by “ERDF A way of making Europe”. This project acknowledges the “Severo Ochoa Centre of Excellence“ accreditation (CEX2019-000928-S) and the grant UNrIDDLE (2018-T1/AMB-11039) “Atracción de Talento Investigador” call 2018 funded by Comunidad de Madrid. YPD was a fellow researcher at the Universidad Complutense de Madrid under a Predoctoral Research Contract (2019/2020).
Acknowledgments
We acknowledge the “Severo Ochoa Centre of Excellence” accreditation (CEX2019-000928-S). We would like to thank editor MS-W and the four reviewers for their time and constructive critics and comments, which helped greatly strengthen and improve this work.
Conflict of interest
The authors declare that the research was conducted in the absence of any commercial or financial relationships that could be construed as a potential conflict of interest.
Publisher’s note
All claims expressed in this article are solely those of the authors and do not necessarily represent those of their affiliated organizations, or those of the publisher, the editors and the reviewers. Any product that may be evaluated in this article, or claim that may be made by its manufacturer, is not guaranteed or endorsed by the publisher.
References
Abrahamson, N. A., Silva, W. J., and Kamai, R. (2014). Update of the AS08 ground-motion prediction equations based on the NGA-west2 data set, PEER report 2013-04. Pacific Engineering Research Center, 174.
Aldaya, F., Álvarez, F., Galindo-Zaldívar, J., González-Lodeiro, F., Jabaloy, A., and Navarro-Vilá, F. (1991). The maláguide-alpujárride contact (betic cordillera, Spain): A brittle extensional detachment. Compte. rendu. Acad. Sci. Paris 313 (II), 1447–1453.
Allen, T. I., and Wald, D. J. (2007). Topographic slope as a proxy for seismic site-conditions (VS 30) and amplification around the globe. USGS Open-File Report, 1379–1395.
Ambraseys, N., and Jackson, J. A. (1998). Faulting associated with historical and recent earthquakes in the Eastern Mediterranean region. Geophys. J. Int. 133 (2), 390–406. doi:10.1046/j.1365-246x.1998.00508.x
Ambraseys, N. (1985). Magnitude assessment of northwestern European earthquakes. Earthq. Eng. Struct. Dyn. 13 (3), 307–320. doi:10.1002/eqe.4290130305
Atkinson, G. M., and Kaka, S. L. I. (2007). Relationships between felt intensity and instrumental ground motion in the Central United States and California. Bull. Seismol. Soc. Am. 97 (2), 497–510. doi:10.1785/0120060154
Bakun, W. H., and Wentworth, C. M. (1997). Estimating earthquake location and magnitude from seismic intensty data. Bull. Seismol. Soc. Am. 87 (6), 557–1521. doi:10.1785/bssa0890020557
Barchi, M. R., Carboni, F., Michele, M., Ercoli, M., Giorgetti, C., Porreca, M., et al. (2021). The influence of subsurface geology on the distribution of earthquakes during the 2016-–2017 Central Italy seismic sequence. Tectonophysics 807, 228797. doi:10.1016/j.tecto.2021.228797
Basili, R., Valensise, G., Vannoli, P., Burrato, P., Fracassi, U., Mariano, S., et al. (2008). The database of individual seismogenic sources (DISS), version 3: summarizing 20 years of research on Italy's earthquake geology. Tectonophysics 453 (1-4), 20–43. doi:10.1016/j.tecto.2007.04.014
Batlló, J., Stich, D., Macià, R., and Morales, J. (2010). Moment tensor inversion for the 5 july 1930 Montilla earthquake (southern Spain). Seismol. Res. Lett. 81 (5), 724–731. doi:10.1785/gssrl.81.5.724
Benito Oterino, B., Rivas Medina, A., Gaspar-Escribano, J. M., and Murphy, P. (2012). El terremoto de Lorca (2011) en el contexto de la peligrosidad y el riesgo sísmico en Murcia. Física Tierra 24, 255–287. doi:10.5209/rev_fite.2012.v24.40141
Campbell, K. W., and Bozorgnia, Y. (2014). NGA-West2 ground motion model for the average horizontal components of PGA, PGV, and 5% damped linear acceleration response spectra. Earthq. Spectra 30 (3), 1087–1115. doi:10.1193/062913EQS175M
Canora, C., Vilanova, S. P., de Pro-Díaz, Y., Pina, P., and Heleno, S. (2021). Evidence of surface rupture associated with historical earthquakes in the Lower Tagus Valley, Portugal. Implications for seismic hazard in the Greater Lisbon Area. Front. Earth Sci. 9, 620778. doi:10.3389/feart.2021.620778
Caprio, M., Tarigan, B., Bruce Worden, C., Wiemer, S., and Wald, D. J. (2015). Ground motion to intensity conversion equations (GMICEs): A global relationship and evaluation of regional dependency. Bull. Seismol. Soc. Am. 105 (3), 1476–1490. doi:10.1785/0120140286
Caputo, R., Sboras, S., Pavlides, S., and Chatzipetros, A. (2015). Comparison between single-event effects and cumulative effects for the purpose of seismic hazard assessment. A review from Greece. Earth-Science Rev. 148, 94–120. doi:10.1016/j.earscirev.2015.05.004
Cecic, I., Musson, R. M. W., and Stucchi, M. (1996). Do seismologists agree upon epicentre determination from macroseismic data? Ann. Geofis. 39, 1013–1027. doi:10.4401/ag-4031
Chiarabba, C., Amato, A., and Meghraoui, M. (1997). Tomographic images of the El Asnam fault zone and the evolution of a seismogenic thrust-related fold. J. Geophys. Res. Solid Earth 102 (11), 24485–24498. doi:10.1029/97jb01778
Chung, W. Y., and Kanamori, H. (1976). Source process and tectonic implications of the Spanish deep-focus earthquake of March 29, 1954. Phys. Earth Planet. Interiors 13 (2), 85–96. doi:10.1016/0031-9201(76)90073-X
de Pro-Díaz, Y., Vilanova, S., and Canora, C. (2022). Ranking earthquake sources using spatial residuals of seismic scenarios: methodology application to the 1909 benavente earthquake. Bull. Seismol. Soc. Am. 113 (2), 710–731. doi:10.1785/0120220067
Echeverria, A., Khazaradze, G., Asensio, E., and Masana, E. (2015). Geodetic evidence for continuing tectonic activity of the Carboneras fault (SE Spain). Tectonophysics 663, 302–309. doi:10.1016/j.tecto.2015.08.009
Egeler, C. G., and Simon, O. J. (1969). Orogenic evolution of the betic zone (betic cordilleras, Spain), with emphasis on the nappe structures. Geol. Mijnb. 48 (3), 296–305.
Espinar Moreno, M. (1994). “Los estudios de sismicidad histórica en andalucía: los terremotos históricos de la provincia de Almería,” in El estudio de los terremotos en Almería (Instituto de Estudios Almerienses), 115–180.
Evernden, J. F. (1975). Seismic intensities, “size” of earthquakes and related parameters. Bull. Seismol. Soc. Am. 65 (5), 1287–1313. doi:10.1785/bssa0650051287
Ferrario, M. F., Livio, F., and Michetti, A. M. (2022). Fifteen years of Environmental Seismic Intensity (ESI-07) scale: dataset compilation and insights from empirical regressions. Quat. Int. 625, 107–119. doi:10.1016/j.quaint.2022.04.011
Ferrater, M., Ortuño, M., Masana, E., Martínez-Díaz, J. J., Pallàs, R., Perea, H., et al. (2017). Lateral slip rate of Alhama de Murcia fault (SE Iberian Peninsula) based on a morphotectonic analysis: comparison with paleoseismological data. Quat. Int. 451, 87–100. doi:10.1016/j.quaint.2017.02.018
Ferrater, M., Ortuño, M., Masana, E., Pallàs, R., Perea, H., Baize, S., et al. (2016). Refining seismic parameters in low seismicity areas by 3D trenching: the Alhama de Murcia fault, SE Iberia. Tectonophysics 680, 122–128. doi:10.1016/j.tecto.2016.05.020
Frohlich, C. (2006). Deep earthquakes. Cambridge: Cambridge University Press. doi:10.1017/CBO9781107297562
Frontera, T., Concha, A., Blanco, P., Echeverria, A., Goula, X., Arbiol, R., et al. (2012). DInSAR Coseismic Deformation of the May 2011 M<sub>w</sub> 5.1 Lorca Earthquake (southeastern Spain). Solid earth. 3 (1), 111–119. doi:10.5194/se-3-111-2012
Galindo-Zaldivar, J., Gonzalez-Lodeiro, F., and Jabaloy, A. (1989). Progressive extensional shear structures in a detachment contact in the Western Sierra Nevada (Betic Cordilleras, Spain). Geodin. Acta 3 (1), 73–85. doi:10.1080/09853111.1989.11105175
García-Dueñas, V., Balanyá, J. C., and Martínez-Martínez, J. M. (1992). Miocene extensional detachments in the outcropping basement of the northern Alboran Basin (Betics) and their tectonic implications. Geo-Marine Lett. 12 (2–3), 88–95. doi:10.1007/BF02084917
García-Mayordomo, J., Insua-Arévalo, J. M., Martínez-Díaz, J. J., Jiménez-Díaz, A., Martín-Banda, R., Martín-Alfageme, S., et al. (2012). The quaternary faults database of Iberia (QAFI v.2.0). J. Iber. Geol. 38 (1), 285–302. doi:10.5209/rev_JIGE.2012.v38.n1.39219
Gasperini, P., Bernardini, F., Valensise, G., and Boschi, E. (1999). Defining seismogenic sources from historical earthquake felt reports. Bull. Seismol. Soc. Am. 89 (1), 94–110. doi:10.1785/BSSA0890010094
Gasperini, P., Vannucci, G., Tripone, D., and Boschi, E. (2010). The location and sizing of historical earthquakes using the attenuation of macroseismic intensity with distance. Bull. Seismol. Soc. Am. 100 (5), 2035–2066. doi:10.1785/0120090330
Goded, T., Buforn, E., and Muñoz, D. (2008). The 1494 and 1680 Málaga (southern Spain) earthquakes. Seismol. Res. Lett. 79 (5), 707–715. doi:10.1785/gssrl.79.5.707
Gomez-Capera, A. A., Rovida, A., Gasperini, P., Stucchi, M., and Viganò, D. (2014). The determination of earthquake location and magnitude from macroseismic data in Europe. Bull. Earthq. Eng. 13 (5), 1249–1280. doi:10.1007/s10518-014-9672-3
Gómez-Novell, O., García-Mayordomo, J., Ortuño, M., Masana, E., and Chartier, T. (2020). Fault system-based probabilistic seismic hazard assessment of a moderate seismicity region: the eastern Betics shear zone (SE Spain). Front. Earth Sci. 8, 579398. doi:10.3389/feart.2020.579398
Grünthal, G. (1998). European macroseismic scale 1998 (vol 15). European Seismological Commission. Available at: http://lib.riskreductionafrica.org/bitstream/handle/123456789/1193/1281.European Macroseismic Scale 1998.pdf?sequence=1.
Guerra-Merchán, A., Serrano, A., and Ramallo, D. (2000). El plioceno de la Cuenca de Málaga (cordillera bética). Geotemas 1 (2), 107–110.
Guerrieri, L., and Vittori, E. (2007). INQUA environmental seismic intensity scale 2007 (ESI-2007). Servizio Geológico d’Italia - dipartamento Difensa del Suolo.
Hanks, T. C., and Bakun, W. H. (2008). M-log A observations for recent large earthquakes. Bull. Seismol. Soc. Am. 98 (1), 490–494. doi:10.1785/0120070174
Huerta, P., Silva, P. G., Giner-Robles, J. L., Rodríguez-Pascua, M. A., and Bautista Davila, M. B. (2015). “Efectos geológicos del terremoto de Dalías-Berja 1804 AD. (Almería, SE España),” in XIV reunión nacional de Cuaternario (University of Granada), 194–197.
Insua Arévalo, J. M. (2008). “Neotectónica y tectónica activa de la Cuenca de Málaga (Cordillera Bética Occidental),”. (Thesis) (Universidad Complutense de Madrid).
Insua-Arévalo, J. M., García-Mayordomo, J., Salazar, A., Rodríguez-Escudero, E., Martín-Banda, R., Álvarez-Gómez, J. A., et al. (2015). Paleoseismological evidence of Holocene activity on los tollos fault (Murcia, SE Spain): A lately formed quaternary tectonic feature of the eastern betic shear zone. J. Iber. Geol. 41 (3), 333–350. doi:10.5209/rev_JIGE.2015.v41.n3.49948
Jabaloy, A., Galindo-Zaldívar, J., and González-Lodeiro, F. (1993). The Alpujárride-Nevado-Fibábride extensional shear zone, Betic Cordillera, SE Spain. J. Struct. Geol. 15 (3–5), 555–569. doi:10.1016/0191-8141(93)90148-4
Johnston, A. C., and Schweig, E. S. (1996). The enigma of the New Madrid earthquakes of 1811-1812. Annu. Rev. Earth Planet. Sci. 24, 339–384. doi:10.1146/annurev.earth.24.1.339
Johnston, A. C. (1996). Seismic moment assessment of earthquakes in stable continental regions-III. New Madrid 1811-1812, Charleston 1886 and Lisbon 1755. Geophys. J. Int. 126, 314–344. doi:10.1111/j.1365-246x.1996.tb05294.x
López-Comino, J. Á., Mancilla, F. D. L., Morales, J., and Stich, D. (2012). Rupture directivity of the 2011, Mw 5.2 Lorca earthquake (Spain). Geophys. Res. Lett. 39 (3), 1–5. doi:10.1029/2011GL050498
López-Garrido, A. C., and Sanz de Galdeano, C. (1999). Neogene sedimentation and tectonic-eustatic control of the Malaga basin, south Spain. J. Petroleum Geol. 22 (1), 81–96. doi:10.1111/j.1747-5457.1999.tb00460.x
Marín-Lechado, C., Galindo-Zaldívar, J., Gil, A. J., Borque, M. J., de Lacy, M. C., Pedrera, A., et al. (2010). Levelling profiles and a GPS network to monitor the active folding and faulting deformation in the campo de dalias (Betic Cordillera, Southeastern Spain). Sensors 10 (4), 3504–3518. doi:10.3390/s100403504
Marín-Lechado, C., Galindo-Zaldívar, J., Rodríguez-Fernández, L. R., and Pedrera, A. (2007). Mountain front development by folding and crustal thickening in the internal zone of the Betic Cordillera-Alboran Sea Boundary. Pure Appl. Geophys. 164 (1), 1–21. doi:10.1007/s00024-006-0157-4
Marín-Lechado, C., Galindo-Zaldívar, J., Rodríguez-Fernández, L. R., Serrano, I., and Pedrera, A. (2005). Active faults, seismicity and stresses in an internal boundary of a tectonic arc (Campo de Dalías and Níjar, southeastern Betic Cordilleras, Spain). Tectonophysics 396 (1–2), 81–96. doi:10.1016/j.tecto.2004.11.001
Martín-Banda, R., García-Mayordomo, J., Insua-Arévalo, J. M., Salazar, Á. E., Rodríguez-Escudero, E., Álvarez-Gõmez, J. A., et al. (2016). New insights on the seismogenic potential of the eastern betic shear zone (SE Iberia): quaternary activity and paleoseismicity of the SW segment of the carrascoy Fault Zone. Tectonics 35 (1), 55–75. doi:10.1002/2015TC003997
Martínez Solares, J. M., and Mezcua Rodríguez, J. (2002). Catálogo sísmico de la Península ibérica (880 a. C. - 1900). Instituto Geográfico Nacional.
Martínez Solares, J. M. (2011). “Sismicidad pre-instrumental. Los grandes terremotos históricos en España,” in Enseñanzas de las Ciencias de la Tierra. Editors E. Carreño, and J. F. Valero (Asociación Española para la Enseñanza de las Ciencias de la Tierra), 296–304.
Martínez-Díaz, J. J., Alonso-Henar, J., Insua-Arévalo, J. M., Canora, C., García-Mayordomo, J., Rodríguez-Escudero, E., et al. (2019). Geological evidences of surface rupture related to a seventeenth century destructive earthquake in betic cordillera (SE Spain): constraining the seismic hazard of the Alhama de Murcia fault. J. Iber. Geol. 45 (1), 73–86. doi:10.1007/s41513-018-0082-2
Martínez-Díaz, J. J., Bejar-Pizarro, M., Álvarez-Gómez, J. A., Mancilla, F. de L., Stich, D., Herrera, G., et al. (2012a). Tectonic and seismic implications of an intersegment rupture. Tectonophysics 546–547, 28–37. doi:10.1016/j.tecto.2012.04.010
Martínez-Díaz, J. J., and Hernández-Enrile, J. L. (2004). Neotectonics and morphotectonics of the southern Almería region (Betic Cordillera-Spain) kinematic implications. Int. J. Earth Sci. 93 (2), 189–206. doi:10.1007/s00531-003-0379-y
Martínez-Díaz, J. J., Masana, E., and Ortuño, M. (2012b). Active tectonics of the Alhama de Murcia fault, betic cordillera, Spain. J. Iber. Geol. 38 (1), 253–270. doi:10.5209/rev_jige.2012.v38.n1.39218
Martínez-Díaz, J. J. (1999). “Neotectónica y Tectónica Activa del Sector Centro-Occidental de la Región de Murcia y Sur de Almería (Cordillera Bética - españa),”. (Thesis) (Universidad Complutense de Madrid).
Martínez-Martínez, J. M., and Azañón, J. M. (1997). Mode of extensional tectonics in the southeastern Betics (SE Spain): implications for the tectonic evolution of the peri-Alborán orogenic system. Tectonics 16 (2), 205–225. doi:10.1029/97TC00157
Martínez-Martínez, J. M. (2006). Lateral interaction between metamorphic core complexes and less-extended, tilt-block domains: the Alpujarras strike-slip transfer Fault Zone (Betics, SE Spain). J. Struct. Geol. 28 (4), 602–620. doi:10.1016/j.jsg.2006.01.012
Masana, E., Martínez-Díaz, J. J., Hernández-Enrile, J. L., and Santanach, P. (2004). The Alhama de Murcia fault (SE Spain), a seismogenic fault in a diffuse plate boundary: seismotectonic implications for the Ibero-Magrebian region. J. Geophys. Res. Solid Earth 109 (1), 1–17. doi:10.1029/2002jb002359
Massey, F. (1951). The Kolmogorov-smirnov test for goodness of fit. J. Am. Stat. Assoc. 46 (253), 68–78. doi:10.1080/01621459.1951.10500769
Mezcua, J., Rueda, J., and García Blanco, R. M. (2013). Iberian peninsula historical seismicity revisited: an intensity data bank. Seismol. Res. Lett. 84 (1), 9–18. doi:10.1785/0220120097
Molins-Vigatà, J., García-Mayordomo, J., Ortuño, M., García-Sellés, D., and Gómez-Novell, O. (2022). Caracterización geológica de la falla del Llano del Águila en campo Dalías (almería): posible fuente sismogénica del terremoto de 1804. Rev. Soc. Geol. España 35 (1), 71–83. doi:10.55407/rsge.94908
Morales, J., Singh, S. K., and Ordaz, M. (1996). Analysis of the Granada (Spain) earthquake of 24 june, 1984 (M = 5) with emphasis on seismic hazard in the Granada basin. Tectonophysics 257 (2-4), 253–263. doi:10.1016/0040-1951(95)00188-3
Muñoz Clares, M., Fernández Carrascosa, M., Alcolea López, M. O., Arcas Navarro, M. C., Arcas Ruiz, N., Caro del Vas, P., et al. (2012). Sismicidad histórica y documentación municipal: el caso de Lorca. Bol. Geol. Min. 123 (4), 415–429.
Muñoz, D., and Udías, A. (1988). “Evaluation of damage and source parameters of the Málaga earthquake of 9 October 1680,” in Symposium on historical seismograms and earthquakes, 208–221.
Murphy Corella, P. (2019). Los terremotos de Almería de 1804 en el archivo histórico nacional. Instituto Geográfico Nacional.
Nuttli, O. W., Bollinger, G. A., and Griffiths, D. W. (1979). On the relation between Modified Mercalli Intensity and body-wave magnitude. Bull. Seismol. Soc. Am. 69 (3), 893–909. doi:10.1785/bssa0690030893
Nuttli, O. W. (1973). The Mississippi Valley earthquakes of 1811 and 1812: intesities, ground motion and magnitudes. Bull. Seismol. Soc. Am. 63 (1), 227–248. doi:10.1785/bssa0630010227
Ortuño, M., Masana, E., García-Meléndez, E., Martínez-Díaz, J., Štěpančíková, P., Cunha, P. P., et al. (2012). An exceptionally long paleoseismic record of a slow-moving fault: the Alhama de Murcia fault (Eastern Betic shear zone, Spain). Bull. Geol. Soc. Am. 124 (9–10), 1474–1494. doi:10.1130/B30558.1
Pagani, M., Monelli, D., Weatherill, G., Danciu, L., Crowley, H., Silva, V., et al. (2014). OpenQuake engine: an open hazard (and risk) software for the global earthquake model. Seismol. Res. Lett. 85 (3), 692–702. doi:10.1785/0220130087
Pedrera, A., Marín-Lechado, C., Stich, D., Ruiz-Constán, A., Galindo-Zaldívar, J., Rey-Moral, C., et al. (2012). Nucleation, linkage and active propagation of a segmented Quaternary normal-dextral fault: the Loma del Viento fault (Campo de Dalías, Eastern Betic Cordillera, SE Spain). Tectonophysics 522–523, 208–217. doi:10.1016/j.tecto.2011.12.001
Quirós Hernández, L. E. (2017). “Modelizaciones y análisis de sensibilidad en la evaluación integral del riesgo sísmico a escala urbana. Aplicación a la ciudad de Lorca,”. (Thesis) (Universidad Politécnica de Madrid).
Reicherter, K. R., Jabaloy, A., Galindo-Zaldívar, J., Ruano, P., Becker-Heidmann, P., Morales, J., et al. (2003). Repeated palaeoseismic activity of the Ventas de Zafarraya fault (S Spain) and its relation with the 1884 Andalusian earthquake. Int. J. Earth Sci. 92 (6), 912–922. doi:10.1007/s00531-003-0366-3
Reiter, L. (1991). Earthquake hazard analysis: Issues and insights. New York: Columbia University Press.
Rodríguez-Fernández, J., and Martín-Penela, A. J. (1993). Neogene evolution of the campo de Dalías and the surrounding offshore areas - (northeastern alboran sea). Geodin. Acta 6 (4), 255–270. doi:10.1080/09853111.1993.11105253
Rodríguez-Pascua, M. A., Pérez-López, R., Martín-González, F., Giner-Robles, J. L., and Silva, P. G. (2012). “New and reactivated effects on the architectural heritage of Lorca caused by the May 2011 earthquake,” in 3rd INQUA-IGCP-567 International Workshop on Active Tectonics, Paleoseismology and Archaeoseismology, Morelia, Mexico, 18 – 24 November 2012, 161–164.
Rodríguez-Peces, M. J., Ching, A., Tsige, M., and García Flórez, I. (2012). Estimación regional de los efectos de amplificación sísmica en la Región de Murcia (SE España) mediante el uso de un SIG.
Sanz de Galdeano, C., and Alfaro, P. (2004). Tectonic significance of the present relief of the Betic Cordillera. Geomorphology 63 (3–4), 175–190. doi:10.1016/j.geomorph.2004.04.002
Sanz de Galdeano, C., Azañón, J. M., Cabral, J., Ruano, P., Alfaro, P., Canora, C., et al. (2020). “Active faults in Iberia,” in The geology of Iberia: a geodynamic approach. Volume 5: Active processes: seismicity, active faulting and relief (Springer), 33–75.
Sanz de Galdeano, C. (1990). Geologic evolution of the betic cordilleras in the western mediterranean, Miocene to the present. Tectonophysics 172 (1–2), 107–119. doi:10.1016/0040-1951(90)90062-D
Sanz de Galdeano, C., and Lopez Garrido, A. C. (1992). Tectonic evolution of the Malaga basin (beltic cordillera). Regional implications. Geodin. Acta 5 (3), 173–186. doi:10.1080/09853111.1992.11105226
Sanz de Galdeano, C. (1983). Los accidentes y fracturas principales de las Cordilleras Béticas. Estud. Geol. 39 (3–4), 157–165.
Sanz de Galdeano, C., Rodriguez-Fernandez, J., and Lopez-Garrido, A. C. (1985). A strike-slip fault corridor within the alpujarra mountains (betic cordilleras, Spain). Geol. Rundsch. 74 (3), 641–655. doi:10.1007/BF01821218
Sbarra, P., Burrato, P., Rubeis, V., De Rubeis, P., Valensise, G., Vallone, R., et al. (2022). Modern earthquakes as a key to understanding those of the past: the intensity attenuation curve speaks about earthquake depth and magnitude. Nat. Hazards Earth Syst. Sci., 1–33. doi:10.5194/nhess-2022-30
Sbarra, P., Burrato, P., Tosi, P., Vannoli, P., De Rubeis, V., and Valensise, G. (2019). Inferring the depth of pre-instrumental earthquakes from macroseismic intensity data: A case-history from northern Italy. Sci. Rep. 9, 15583. doi:10.1038/s41598-019-51966-4
Serva, L., Blumetti, A. M., Esposito, E., Guerrieri, L., Michetti, A. M., Okomura, K., et al. (2015). “Earthquake environmental effects, intensity and seismic hazard assessment: the lesson of some recent large earthquakes,” in Earthquake environmental Effects for seismic hazard assessment: The ESI intensity Scale and the EEE catalogue. Memorie descriptiva della carta geologica D’italia 47. Editors A. Franck, M. Audemard, and T. Azuma (Italy: ISPRA), 5–8.
Sieberg, A. (1932). “Geologie der Erdbeben,” in Handbuch der Geophysik, vol. 2 (Gebrüder Bornträger), 550–555.
Sieberg, A. (1912). Über die makroseismische Bestimmung der Erdbebenstärke. Gerl. Beiträge. Geophys. 11, 227–239.
Silva Barroso, P. G., Rodríguez-Pascua, M. A., Giner-Robles, J. L., Perez-Lopez, R., Gomez Lario, J., Perucha Atienza, M., et al. (2019). “Catálogo de los efectos geológicos de los terremotos en España,” in Riesgos geológicos/geotecnia. Editors P. G. Silva Barroso, and M. A. Rodríguez-Pascua 2nd ed. (Instituto Geológico y Minero de España, Asociación Española para el Estudio del Cuaternario).
Silva, P. G., Goy, J. L., Somoza, L., Zazo, C., and Bardají, T. (1993). Landscape response to strike-slip faulting linked to collisional settings: quaternary tectonics and basin formation in the Eastern Betics, southeastern Spain. Tectonophysics 224 (4), 289–303. doi:10.1016/0040-1951(93)90034-H
Stich, D., Martínez-Solares, J. M., Custódio, S., Batlló, J., Martín, R., Teves-Costa, P., et al. (2020). “Seismicity of the iberian peninsula,” in The geology of Iberia: a geodynamic approach. Volume 5: Active processes: seismicity, active faulting and relief. Editors C. Quesada, and J. T. Oliveira (Switzerland: Springer Nature), 139. doi:10.1007/978-3-030-10931-8
Stirling, M., Goded, T., Berryman, K., and Litchfield, N. (2013). Selection of earthquake scaling relationships for seismic-hazard analysis. Bull. Seismol. Soc. Am. 103 (6), 2993–3011. doi:10.1785/0120130052
Stirling, M. W., Rhoades, D. A., and Berryman, K. (2002). Comparison of earthquake scaling relations derived from data of the instrumental and preinstrumental era. Bull. Seismol. Soc. Am. 92 (2), 812–830. doi:10.1785/0120000221
Teves-Costa, P., and Batlló, J. (2011). The 23 April 1909 Benavente earthquake (Portugal): macroseismic field revision. J. Seismol. 15 (1), 59–70. doi:10.1007/s10950-010-9207-6
Toppozada, T. R. (1975). Earthquake magnitude as a function of intensity data in California and western Nevada. Bull. Seismol. Soc. Am. 65 (5), 1223–1238. Available at: http://www.bssaonline.org/cgi/content/abstract/65/5/1223.
Tselentis, G. A., and Danciu, L. (2008). Empirical relationships between modified Mercalli intensity and engineering ground-motion parameters in Greece. Bull. Seismol. Soc. Am. 98 (4), 1863–1875. doi:10.1785/0120070172
Vera, J. A., Martín-Algarra, A., Sánchez-Gómez, M., Fornós, J. J., and Gelabert, B. (2004). “Cordillera bética y baleares,” in Geología de España (Sociedad Geológica de España), 347–464.
Wald, D. J., Quitoriano, V., Heaton, T. H., and Kanamori, H. (1999). Relationships between peak ground acceleration, peak ground velocity, and modified mercalli intensity in California. Earthq. Spectra 15 (3), 557–564. doi:10.1193/1.1586058
Wells, D. L., and Coppersmith, K. J. (1994). New empirical relationships among magnitude, rupture length, rupture width, rupture area, and surface displacement. Bull. Seismol. Soc. Am. 84 (4), 974–1002.
Wesnousky, S. G. (2008). Displacement and geometrical characteristics of earthquake surface ruptures: issues and implications for seismic-hazard analysis and the process of earthquake rupture. Bull. Seismol. Soc. Am. 98 (4), 1609–1632. doi:10.1785/0120070111
Worden, C. B., Gerstenberger, M. C., Rhoades, D. A., and Wald, D. J. (2012). Probabilistic relationships between ground-motion parameters and modified mercalli intensity in California. Bull. Seismol. Soc. Am. 102 (1), 204–221. doi:10.1785/0120110156
Yue, L. F., Suppe, J., and Hung, J. H. (2005). Structural geology of a classic thrust belt earthquake: the 1999 Chi-Chi earthquake Taiwan (Mw = 7.6). J. Struct. Geol. 27 (11), 2058–2083. doi:10.1016/j.jsg.2005.05.020
Keywords: Betics, SE Spain, 2011 Lorca earthquake, 1804 Dalías earthquake, 1680 Málaga earthquake, seismic source, intensity field
Citation: De Pro-Díaz Y, Perea H, Insua-Arévalo JM, Martínez-Díaz JJ and Canora C (2023) Constraining earthquake fault sources through the use of intensity data and seismic scenarios: application to the Betic Cordillera (South Spain). Front. Earth Sci. 11:1214836. doi: 10.3389/feart.2023.1214836
Received: 30 April 2023; Accepted: 14 August 2023;
Published: 25 August 2023.
Edited by:
Magdalena Scheck-Wenderoth, GFZ German Research Centre for Geosciences, GermanyReviewed by:
Maria Francesca Ferrario, University of Insubria, ItalySotiris Sboras, Institute of Geodynamics, Greece
Kiichiro Kawamura, Yamaguchi University, Japan
Andrea Zanchi, University of Milano-Bicocca, Italy
Copyright © 2023 De Pro-Díaz, Perea, Insua-Arévalo, Martínez-Díaz and Canora. This is an open-access article distributed under the terms of the Creative Commons Attribution License (CC BY). The use, distribution or reproduction in other forums is permitted, provided the original author(s) and the copyright owner(s) are credited and that the original publication in this journal is cited, in accordance with accepted academic practice. No use, distribution or reproduction is permitted which does not comply with these terms.
*Correspondence: Yolanda De Pro-Díaz, eXByb0B1Y20uZXM=