 Denise Silva de Moura
 Yára Regina Marangoni
- Department of Geophysics, Institute of Astronomy, Geophysics and Atmospheric Sciences, University of São Paulo, São Paulo, Brazil
We conduct a gravity study of the lithosphere beneath three large sedimentary basins in southeastern South America: Paraná, Chaco-Paraná, and Pantanal. We compile a massive gravity database and estimate the free-air and Bouguer gravity anomalies, resulting in a novel complete Bouguer anomaly map for the study area. To discern the influence of crustal loads with known lithologies, including sediments, basalts, and topography variations of the Moho discontinuity, we calculate their gravity effects and subsequently remove them from the complete Bouguer anomaly, leading to the development of our residual Bouguer anomaly map. This map highlights unknown anomalous masses within the lithosphere. To aid in the interpretation of these residual anomalies, we perform a 2D forward modeling. Based on our results, we propose new boundaries for the Paranapanema block and the Luiz Alves craton. Additionally, we propose that the Ponta Grossa swarm dike has a more substantial impact on the crust and lithosphere than previously considered, and delimit the region of influence of this magmatism in the lithosphere. Moreover, tectonic features such as the São Francisco paleocontinent and the Rio de La Plata craton appear to be associated with negative residual Bouguer anomaly regions. Furthermore, we identify and emphasize the significance of the Western Paraná Suture, which acts as a demarcation between the Paraná Basin region and the Pantanal and Chaco-Paraná basins. Remarkably, this suture appears to play a more important role in shaping the density structure of the southwest of South America than the age and tectonic history of the sedimentary basins.
1 Introduction
The South American platform is the relatively stable Precambrian portion of South America bounded by the Andean orogeny and the Patagonian block (Heilbron et al., 2017), which consists of a mosaic of interconnected Archean and Proterozoic cratonic nuclei interspersed with mobile belts (Brito Neves and Fuck, 2014). Many of these mobile belts were formed during the Brasiliano collage, a series of Neoproterozoic tectonic events that contributed to the amalgamation of Gondwana (Brito Neves et al., 2014).
Despite its geological significance, studying the South American platform poses challenges due to the depths of the sedimentary layers, which can reach up to 6 km and 7 km in the Chaco-Paraná and Paraná basins, respectively, overlaying the crystalline basement. However, geophysical methods have been employed to overcome these challenges, leading to new insights into the density structure beneath the southern portion of the South American platform. Among these methods, gravity and geoid anomalies have proven successful in characterizing tectonic structures within the region (Ussami and Molina, 1999; Mariani et al., 2013; Chaves et al., 2016; Dragone et al., 2017). Additionally, seismic tomography has played a crucial role in providing velocity distributions that are representative of the lithosphere (Feng et al., 2007; Rocha et al., 2019a; Affonso et al., 2021; Ciardelli et al., 2022; Nascimento et al., 2022), refining our understanding of the tectonic framework in the area.
This study provides new insights into the major density structure of the Southeast region of the South American lithosphere, encompassing the Paraná, Chaco-Paraná, and Pantanal basins. Utilizing new free-air and complete Bouguer anomaly maps, along with a Bouguer residual model accounting for gravity effects of known masses and interfaces, we aim to reevaluate known lithosphere structures from literature and identify potential unknown density anomalies linked to unknown tectonic features or those proposed by other geophysical methods.
2 Study area
The study area focuses on the southern part of the South American platform, an extensive area covering approximately five million km2. This region is predominantly covered by sedimentary basins, with particular emphasis on the Paleozoic Paraná and Chaco-Paraná basins (PB and CPB in Figure 1). These two basins share similarities in terms of sedimentary composition and history but exhibit differences related to the physical properties of their lithospheres (Dragone et al., 2017). Additionally, our investigation includes the Pantanal basin (PtB in Figure 1), a Quaternary deposit located to the west of the Paraná basin, which presents a shallower sedimentary layer of about 500 m (Ussami et al., 1999; Assine et al., 2016). The objective is to explore whether significant density disparities exist when comparing this basin with the lithosphere beneath the Paleozoic basins.
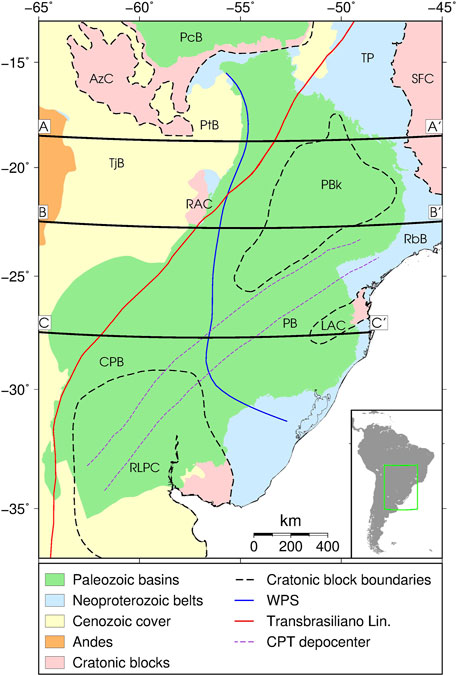
FIGURE 1. Tectonic map of the study area. AzC: Amazonian craton, PcB: Parecis basin, PtB: Pantanal basin, TjB: Tarija basin, RAC: Rio Apa craton, TP: Tocantins province, SFC: São Francisco craton, PBk: Paranapanema block, RbB: Ribeira belt, PB: Paraná basin, CPB: Chaco-Paraná basin, LAC: Luiz Alves craton, RLPC: Rio de La Plata craton (contours by Cordani et al., 2016); WPS: Western Paraná Suture (Dragone et al., 2021); CPT: Central Paranaense trough (Veroslavsky et al., 2021). The three profiles are the same as in Figure 7.
The Paraná and Chaco-Paraná intracratonic basins share a similar tectonic evolution (Milani et al., 1998). Due to the thick sedimentary package of approximately 7 km (Milani et al., 2007), the age and composition of their basement are difficult to constrain and are still subjects of study. In the Paraná basin, the oldest sedimentary sequence is Ordovician (Milani, 2004; Milani et al., 2007), while in the Chaco-Paraná basin, it is Devonian (Veroslavsky et al., 2021 and references therein). The Pantanal basin, on the other hand, developed during the Quaternary period after the Andean reactivation approximately 2.5 million years ago (Ussami et al., 1999; Assine and Soares, 2004). The basement of the Pantanal basin is believed to be associated with the Neoproterozoic terranes of the Paraguay fold thrust belt (Ussami et al., 1999).
Among the three basins, the Paraná basin has been the subject of the most extensive study. Gravity and seismological data have revealed a heterogeneous lithosphere resulting from different geological scenarios for the basement. Some researchers have proposed the presence of a single cratonic nucleus, with different suggested positions and boundaries (e.g., Cordani, 1984; Mantovani and Brito Neves, 2005; Affonso et al., 2021). Milani and Ramos (1998) proposed that the basement consists of a few blocks or a nucleus altered by a few events (Milani et al., 1998). Zalán et al. (1990), Assine et al. (1998), and Milani et al. (2007) proposed that events following the Brasiliano-Pan-African orogenic cycle have influenced the lithosphere in the region. The Paraná-Etendeka Magmatic Province adds complexity to the tectonic history of the region, a Cretaceous magmatism in which the extrusive part in Brazil is named Serra Geral Formation (Frank et al., 2009).
Verozlavsky et al. (2021) presented a revised tectono-sedimentary evolution model for the Chaco-Paraná basin. They divided the basin’s basement into three units based on age: the Archean-Proterozoic Rio de La Plata craton, the Nico-Pérez terrane to the west, and the Paleozoic Dom Feliciano belt to the east. According to their classification, the southern part of the study area predominantly consists of Archean-Proterozoic terranes, along with a younger coastal orogenic belt. They proposed an NNE-SSW depocenter zone, known as the Central Paranaense Trough (CPT in Figure 1), spanning 600 km and bounded by crustal faults, which divides the Paraná and the Chaco-Paraná basins into the southern and northern regions.
Ussami et al. (1999), relying on gravity data, seismic sections, and boreholes, suggest that the Pantanal basin formed as an uplift and flexural extension of the Paraguay fold belt, which constitutes its basement. The seismic sections reveal Cenozoic fragments of limestones and sandstones over the faulted basement. The origin of the Pantanal basin, associated with the reactivation of the Andes approximately 2.5 million years ago, differs from the long tectono-sedimentary history spanning from the Ordovician to the Neogene observed in the Paraná and Chaco-Paraná basins.
(Dragone et al. 2017; Dragone et al. 2021) proposed an evolutionary model for the three basins. Using gravity and magnetotelluric data, they suggested the existence of a suture or shear zone named the Western Paraná Suture (WPS in Figure 1) between the lithospheres of the Paraná basin and the surrounding Chaco-Paraná and Pantanal basins. According to their model, the lithosphere of the Paraná basin may result from the accommodation of several cratonic nuclei along an older suture zone. They propose that the lithosphere beneath the Pantanal basin is composed of the Rio Apa craton, while the lithosphere beneath the Chaco-Paraná basin by the Rio de La Plata and Rio Tebicuary cratons.
3 Materials and methods
3.1 Ground data
We collected a total of 81,078 ground gravity stations from different databases. These stations included 66,707 points from the Potential Methods Lab at the Institute of Astronomy, Geophysics, and Atmospheric Sciences of the University of São Paulo, 6,860 points from the Topography and Geodesy Lab at the School of Engineering of the University of São Paulo, most of which were unpublished, and 7,511 points from the Instituto Geográfico Nacional in Argentina (Figure 2). These data were collected from 1950 until the present.
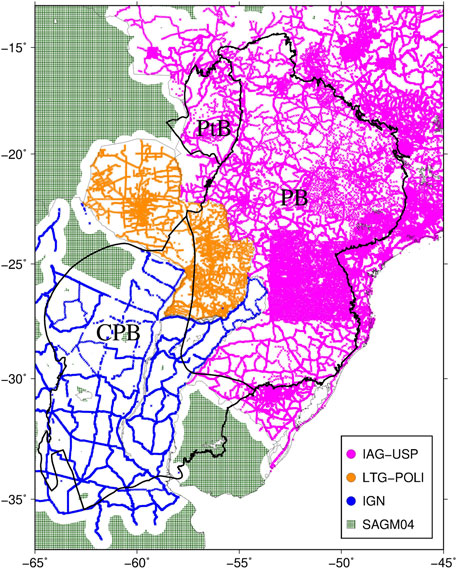
FIGURE 2. Gravity ground data distribution and model complement where no ground data is available. The black lines delimit the basin contours: Paraná basin (PB), Chaco-Paraná basin (CPB), and Pantanal basin (PtB). Notice the uneven distribution and the absence of data in some areas of the Paraná and the Chaco-Paraná basins.
The measurement of orthometric heights for the gravity stations relied on several methodologies over time, which implies different data precision. Before the 1990s, common approaches included the use of benchmarks with centimeter precision, barometric leveling with precision ranging from 1 to 3 m, and geometric leveling with centimeter precision. Geometric leveling is still employed in detailed surveys for mineral prospecting in Brazil. The introduction of GPS in the late 1990s popularized the use of double-frequency GPS for altitude surveys. It is important to note that GPS height measurements are based on the WGS-84 system, providing geometric heights, while other measurements are referenced to mean sea level or the geoid. In Brazil, a common practice in gravity research is to transform geometric heights into orthometric heights using the Brazilian Continuous Monitoring GNSS System (RBMC—https://www.ibge.gov.br/en/geosciences/geodetic-positioning/geodetic-networks), maintained by the Brazilian Geography and Statistics Institute (IBGE).
The least accurate techniques for determining the heights and locations of some of our stations are the barometer and topographic maps, which have uncertainties of up to 3 and 200 m, respectively. Considering these values, along with a maximum gravimeter uncertainty of 0.01 mGal and negligible errors in the terrain correction model, the maximum uncertainty is 1.1 mGal for the free-air anomaly map and 1.5 mGal for the complete Bouguer anomaly map.
3.2 Database analysis and processing
The gravity acceleration measured on the Earth’s surface is influenced by different factors, including equipment drift, Earth’s tide, topography, and mass variation within the crust and mantle. To highlight mass variations, particularly in the crust and upper mantle, it is necessary to apply corrections, such as the free-air and Bouguer corrections. Then, to isolate anomalies stemming from the crust and upper mantle conventional mathematical methods are often employed, e.g., upward continuation and spectral analyses.
In our study, we adopt a different approach to isolate density anomalies in the crust and upper mantle. We first calculate the gravitational attraction of known masses, such as sedimentary deposits, large volcanic rock volumes, and density differences between crust and mantle rocks due to variations in the Moho discontinuity topography. These known contributions are then subtracted from the observed complete Bouguer anomaly map, yielding a residual map. We resume the entire procedure in a flowchart (Figure 3). We utilize GMT (Wessel et al., 2013) tools and Oasis Montaj software for many steps of the analysis.
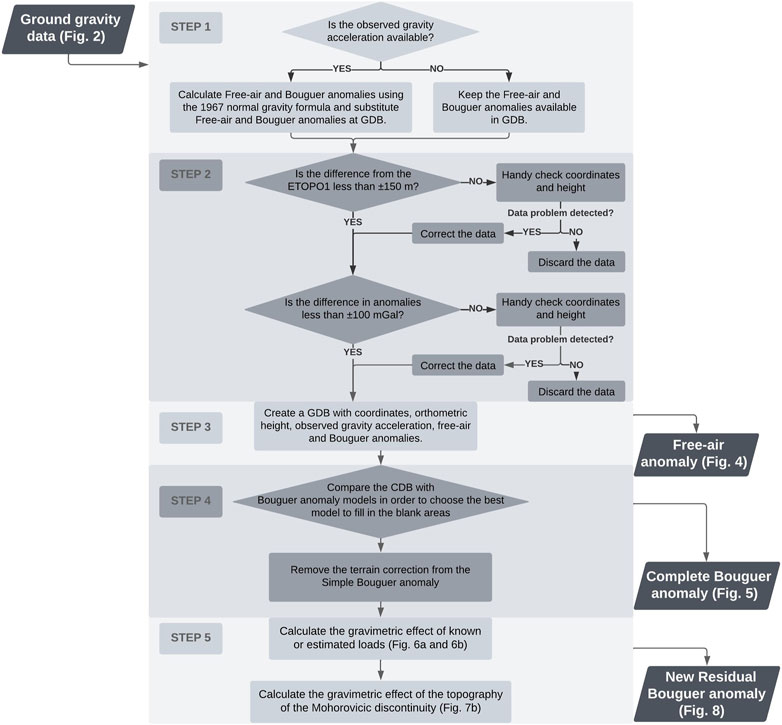
FIGURE 3. Flowchart description of database analysis and calculation of the gravimetric anomalies and components.
In the first step, we calculate the normal gravity. As Brazilian institutions usually use the 1967 Normal Gravity Formula (IAG, 1971), we decided to recalculate all the anomalies whenever possible using it. In cases where gravity or height data are unavailable, we retain the Bouguer and free-air anomalies from the existing database. For the Bouguer correction, we adopt a density of 2,670 kg/m³.
Next, in step 2, we evaluate the data and remove points that exhibit discrepancies in the topography compared to the ETOPO1 (Olson et al., 2014) model, as well as discrepancies in the free-air or Bouguer anomalies compared to the EGM08 (Pavlis et al., 2012) global model. The ETOPO1 model provides a precision of 1 arc-minute (30.9 m) for planar coordinates, and the altimetry precision varies depending on the adopted database (Olson et al., 2014). For continental topography, ETOPO1 employs the GLOBE model. Matos (2005) estimates that for Brazil the altimetry precision is 50 m comparing the GLOBE model with topographic charts. EGM08 has 5 arc-minute (154.5 m) precision for planar coordinates, 2 mGal precision for oceanic basins, and varied precision for continental areas. Using Figure 6A of Pavlis et al. (2012), a variation between −4 and +14 mGal is acceptable for the precision in the study area. Considering the ETOPO1 and EGM08 errors, we removed from our database the points with a discrepancy greater than 150 m or 100 mGals. This results in the removal of 70 data points, which corresponds to 0.09% of the data. These outliers are scattered across the study region and generate gravity anomalies that are not supported by global models. Additionally, these points exhibit differences that surpass our predetermined thresholds and significantly differ from neighboring measurements.
In step 3, after analyzing the data and calculating the anomalies, we generate a ground gravity database. From this database, we produce a new free-air anomaly map (Figure 4) with a 5′x5′ grid, only for the portion of the study area with ground data (Figure 2).
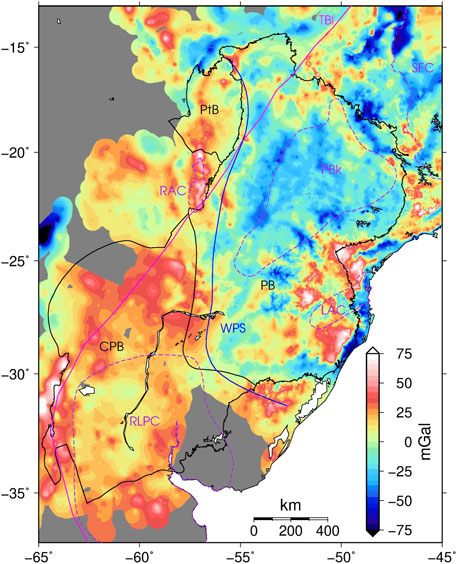
FIGURE 4. Free-air anomaly map of the database. The abbreviations are the same as in Figure 1.
To fill areas without data, in step 4, we evaluate a Bouguer anomaly global model by comparing our ground data (Figure 2) with widely used gravity models for the region, namely, the Global Model EGM08 (Pavlis et al., 2012) and the South America Continental Model SAGM04 (Sá, 2004), both calculated by combining ground and satellite data. The difference between the ground data and the global gravity models varies from −30 to +30 mGal, also the zero mGal average difference is more common for the SAGM04 than for the EGM08 in the Brazilian and Argentinian data sets (Supplementary Figure S1), leading us to adopt the SAGM04 model to fill areas with no available data (Figure 2). Subsequently, we apply the terrain correction to the simple Bouguer anomaly using a 5′ x 5′ resolution grid, provided by personal correspondence with Dr. Ana Cristina de Oliveira Cancoro de Matos (Center of Geodesy Studies), which is an update of the terrain corrections presented in Matos (2005). Consequently, we generate a complete Bouguer anomaly grid for the southeast of the South American continent (Figure 5).
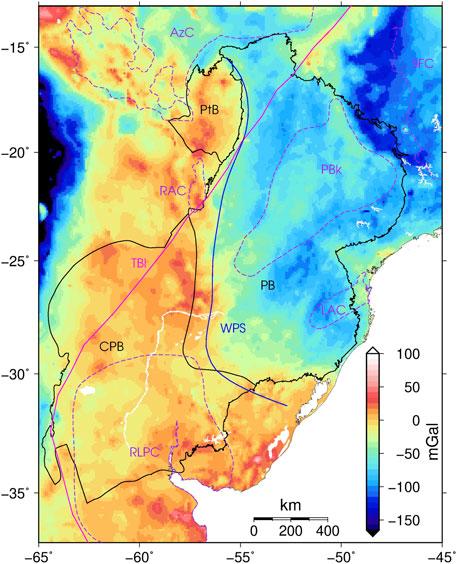
FIGURE 5. Complete Bouguer anomaly map of the database combined with the SAGM04 (Sá, 2004). The abbreviations are the same as in Figure 1.
In step 5, we calculate the gravity effect of load masses in the crust using the Parker (1973) method with the routine from Chaves et al. (2016). To account for the effect of Moho discontinuity topography, we use the Nagy et al. (2000) formulation through the package Fatiando a Terra (Uieda et al., 2013). We adopt the CRUST1.0 (Laske et al., 2013) model for the geometries of the sediments, and Molina et al. (1988) for the geometries of the basalts. The density contrast adopted is −200 kg/m³ for the sediments and +200 kg/m³ for the basalts, around the average value of 2,670 kg/m³ for the crust (Hinze, 2003), thus, we used density values of 2,470 kg/m³ (Laske and Masters, 1997) and 2,870 kg/m³ for sediments and basalts, respectively. Regarding the Moho topography, we adopt the RCM10 model (Chaves et al., 2016) and assume 37 km as the average depth of the crust, which is the average depth of the study area calculated with the RCM10. The density contrast is determined based on the variable CRUST1.0 model values for the lower crust and mantle (Supplementary Figure S2). By subtracting the gravity effect of the known masses from the complete Bouguer anomaly, we obtain the residual Bouguer anomaly (Figure 8) grid with a resolution of 5′ x 5′, which highlights mass anomalies in the crust and upper mantle.
Finally, for aiding in the interpretation of the residual Bouguer anomaly map, we perform a forward 2D modeling along three profiles using GRAVMAG software (Pedley et al., 1993 updated by Jones, 2012), to estimate density variations. The lithosphere-asthenosphere boundary is determined using the global model EMC-CAM2016 (Priestley et al., 2018). We consider only lateral density variations in our model, without any vertical changes within each block, so we expect to have higher density contrasts in the real scenario. The contrast density values of the forward models do not directly stem from real geology structures, they are a simplification intended to aid the interpretation process.
4 Results
4.1 Free-air and complete Bouguer anomaly maps
The free-air anomaly map (Figure 4) exhibits positive anomalies in the Pantanal and Chaco-Paraná areas, while the Paraná basin shows a more heterogeneous pattern with negative anomalies. The magnitude of the anomalies ranges from 25 to 40 mGal at the borders of the Chaco-Paraná basin and is around 0 mGal at the center. In the center of the Paraná basin, the anomalies range from −25 to −50 mGal, whereas its eastern border displays strong positive anomalies ranging from 50 to 75 mGal. Additionally, a linear positive anomaly extends through the Pantanal basin in a north-south direction and enters the Rio Apa cratonic block to the south of the basin.
The complete Bouguer anomaly map (Figure 5) exhibits similar behavior to the free-air anomaly map. The Pantanal and Chaco-Paraná areas display a positive average anomaly, while the Paraná area shows a negative average anomaly varying by more than 100 mGals. The Bouguer anomalies in the Paraná basin are approximately 60 mGal more negative compared with the Chaco-Paraná and Pantanal basins, which exhibit Bouguer anomaly values close to 0 mGal.
Most of the tectonic features depicted in Figures 4, 5, as well as Figure 1, do not demonstrate a strong correspondence with the free-air and Bouguer anomalies. The Rio Apa craton exhibits a relatively better correspondence with the free-air anomaly, which may be attributed to the higher elevation of the area. The lowest free-air anomalies within the Paraná basin rest along the border of the Paranapanema block (Figure 4). In the complete Bouguer anomaly map (Figure 5), the Paranapanema block is characterized by anomalies of approximately −30 mGal anomaly, surrounded by a −110 mGal anomaly. The Western Paraná Suture, which delineates the boundary between the Pantanal and Chaco-Paraná basins and the Paraná basin, is also highlighted in the complete Bouguer anomaly, as a lineament that separates a positive anomaly in the west from a negative anomaly in the east.
4.2 Residual Bouguer anomaly map
With the aim of highlighting both known and potentially unmapped tectonic features, we derived a residual Bouguer anomaly map by subtracting the gravity effect of known masses from the complete Bouguer anomaly map. The gravity effects and thickness of sediments and basalts are presented in Figure 6, while Figure 7 displays the Moho depth and the gravity effect of the Moho topography.
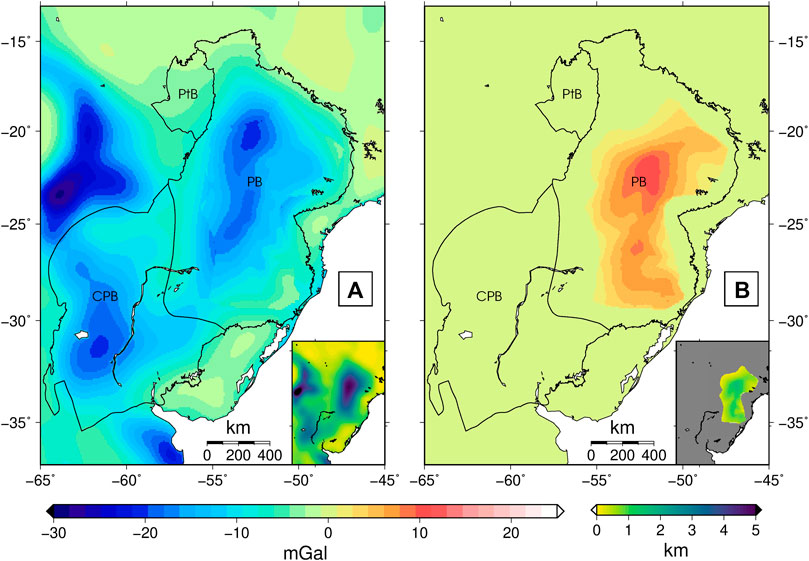
FIGURE 6. Gravity effect of (A) sedimentary basins infill, calculated with −200 kg/m³ density contrast, and of (B) Serra Geral Fm. tholeiitic basalts, calculated with +200 kg/m³ density contrast. PtB, Pantanal basin; PB, Paraná basin; CPB, Chaco-Paraná basin. On the inset of each map is exhibited the thickness of the layers, and the color scale is in km.
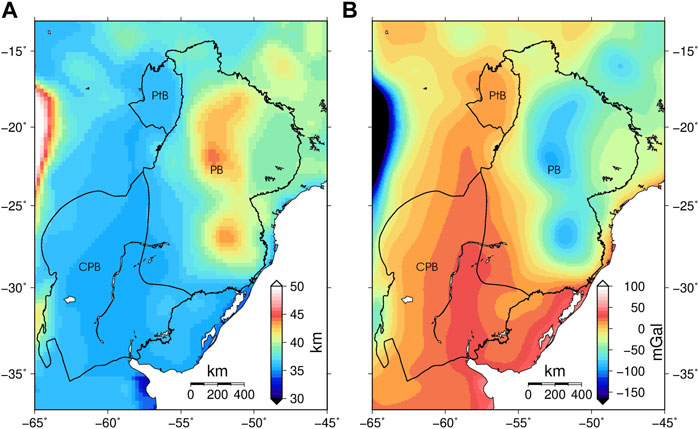
FIGURE 7. (A) Moho discontinuity depth from RCM10 model (Chaves et al., 2016), and (B) gravimetric component due to Moho discontinuity relief obtained using densities from CRUST 1.0 model (Laske et al., 2013). PtB, Pantanal basin; PB, Paraná basin; CPB, Chaco-Paraná basin.
Figure 6A shows that the most negative gravity anomaly, approximately −20 mGal, is associated with the depocenter of the Paraná and Chaco-Paraná basins. The Pantanal basin does not exhibit any significant effect on the sedimentary load. The basalts of Serra Geral Fm. are located in the Paraná basin, with a maximum thickness of 1,500 m, according to Molina et al. (1988). The estimated gravity anomaly resulting from the basalt load can reach values of up to +12 mGal at the center of the Paraná basin (Figure 6B), where the basalt thickness is maximum. Notice that the basalt load does not affect the Chaco-Paraná and Pantanal basins.
The Moho discontinuity depth in the study area varies between 34 and 45 km, with an average value of 37 km (Figure 7A). Figure 7A emphasizes the greater crust thicknesses observed in the Paraná basin, where the maximum crustal thickness coincides with the maximum gravity anomaly and sediment/basalt loads. In contrast, the Chaco-Paraná basin exhibits a minimum crustal thickness of 36 km, unrelated to the maximum thickness of the sediments or basalts. The contrast densities between the lower crust and upper mantle, based on CRUST1.0, range from 250 to 550 kg/m³ (Supplementary Figure S2).
As expected, the calculated gravity effect (Figure 7B) reveals negative values in regions where the Moho depth exceeds the average value of 37 km. This negative effect is more pronounced in the Paraná basin, where the Moho is deeper compared with the Pantanal and Chaco-Paraná basins (Figure 7A). The Chaco-Paraná basin exhibits positive anomaly values, corresponding to a shallower Moho depth that is consistent with the Andes back-arc basin’s location. The Pantanal basin is situated between two regions with low gravity effects, resulting in a gravimetric gradient of approximately 0.15 mGa l/km.
The residual Bouguer anomaly map (Figure 8) highlights mass distribution in the crust and upper mantle by excluding sediment and basalt distribution. To aid in the analyses of the residual Bouguer anomaly map, we estimate the uncertainties associated with each of the three components, considering a 10% uncertainty for the depths and density contrast values. A similar approach was employed by Chaves et al. (2016). The average uncertainties for the basins’ areas are 2.2, 0.2, and 4.4 mGal for sediments, basalts, and Moho discontinuity, respectively. The maximum uncertainties, observed in the depocenter of the Paraná basin are 4.3, 2.1, and 14.5 mGal for sediments, basalts, and Moho discontinuity, respectively. The map depicting the maximum uncertainty for the study area is presented in Figure 8.
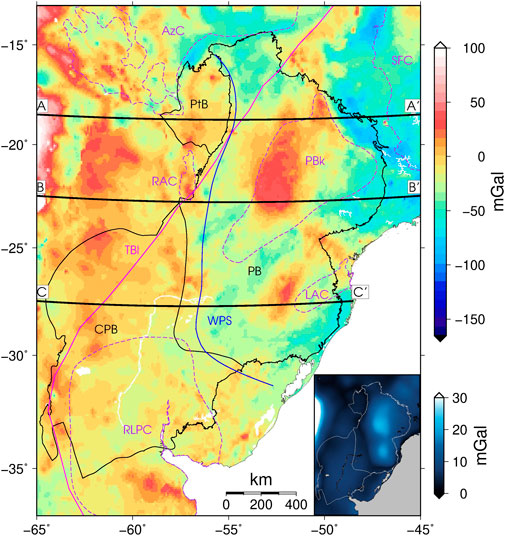
FIGURE 8. Residual Bouguer anomaly map after the correction for the gravimetric effect of density contrasts belonging to sediment infill, basalt thickness, and Moho discontinuity relief. The abbreviations are the same as in Figure 1. On the inset map is exhibited the maximum uncertainty of the residual Bouguer anomaly map, including the uncertainties of the complete Bouguer anomaly and of all the gravity effects, as described in the text.
The maximum uncertainties of the residual Bouguer anomalies are higher in the central region of the Paraná basin, reaching approximately 17 mGal (Figure 8), while in other basins, they remain below 10 mGal. It is worth noting that these values represent the maximum uncertainties and that the average uncertainties are lower than 10 mGal for the entire study area, with the exception of the Andes region to the west, where uncertainties may impede the interpretation of the residual anomalies.
Paraná basin displays two positive anomalies of approximately +40 mGal surrounded by negative values ranging from −10 to −40 mGal. One of these anomalies coincides with the location of the Paranapanema block, which is also evident in the complete Bouguer anomaly map (Figure 5). The Pantanal and Chaco-Paraná basins exhibit similar residual Bouguer values, close to 0 mGal, with some regions displaying positive anomalies of less than 15 mGal (Figure 8). The Western Paraná Suture continues to mark an anomaly gradient between the west and east, albeit with a reduced variation compared with the complete Bouguer anomaly map.
4.3 Forward gravity modeling and possible anomalous mass distribution in the lithosphere
We conducted the modeling of the lithosphere density structure along three profiles (AA’, BB’, and CC’ in Figure 8) to help with the interpretation of the Residual Bouguer anomaly map. The density modeling of the profiles helps us analyze the influence of the lithosphere, including the LAB depth. Removing the LAB topography from the residual Bouguer is complex due to the density variation in the asthenosphere being predominantly influenced by temperature rather than composition, which would introduce higher uncertainties in our model. That is why we prefer to realize the forward modeling to assist the analyses.
Considering the study area as a collage of distinctive lithospheres with varying ages, thicknesses, and densities, we assigned density values in the model based on lithospheric age, following the proposal by Poudjom-Djomani et al. (2001). Specifically, we adopt density values of −20 kg/m³ for the Archean lithosphere, between 0 and −10 kg/m³ for the Proterozoic lithospheres, and positive values for Phanerozoic lithospheres.
The forward model yielded a satisfactory fit between the model and data for the large-scale wavelength of the residual Bouguer anomaly. However, the small-scale anomalies were not fully fitted since our modeling approach employed large block dimensions without considering lateral and vertical variations within them. Across all profiles, density contrasts vary within the range of −20 and 25 kg/m³ constrained by the LAB. Notably, the highest density contrast value of 25 kg/m³ is observed in the profile AA’, corresponding to the Andes region where the uncertainties in our model are higher (Figure 8). Thus, the major density contrast we can interpret is the 10 kg/m³ at the Paraná basin (PB in Figure 9) at profiles AA’ and CC’, corresponding to the approximately 40 mGal residual Bouguer anomaly observed in Figure 8.
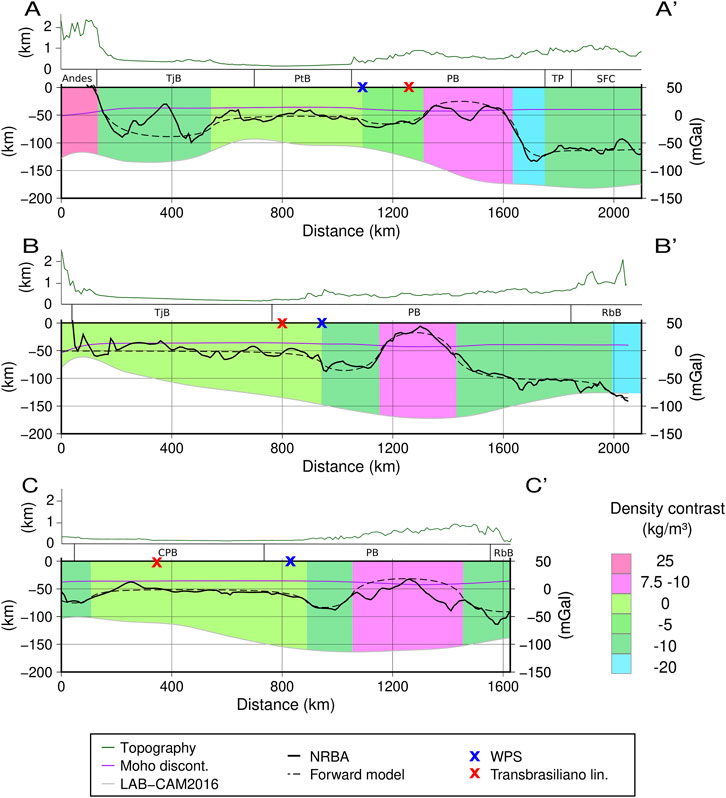
FIGURE 9. Density model for the three W-E profiles (AA’–CC’), whose locations are in Figure 8. Colors relate to age: blue for Archean/Proterozoic, green for Proterozoic, and pink for Phanerozoic. The topography is shown at the top of the profiles with a 30x vertical exaggeration to assist in the interpretation. TjB—Tarija basin, PtB–Pantanal basin, PB–Paraná basin, TP–Tocantins province, SFC–São Francisco craton, RbB–Ribeira belt, CPB–Chaco-Paraná basin.
The lithosphere thickness and topography exhibit a correlation with the density contrasts, as depicted in Figure 9. The region of the Paraná basin (PB in Figure 9) displays the thickest lithosphere and most significant positive density contrasts. However, our simplified model did not incorporate the relative lows within these pink blocks (Profiles AA’ and CC’) as we aimed to maintain the blocks as simple and homogeneous as possible. The areas of the thinnest lithosphere generally exhibit minimal density contrasts and correspond to the lowest topography (indicated by the green line in Figure 9), but the thick lithosphere does not always correspond to high topography in the South American Platform.
The Western Paraná Suture (indicated by blue x in Figure 9) is located between regions with zero density contrast in the west and a more heterogeneous lithosphere region in the east, associated with the Paraná basin. The other lineament identified in the profiles (indicated by red x in Figure 9), the Transbrasiliano lineament, does not appear to be related to the boundaries of density blocks.
5 Discussion
5.1 The updated map of the complete Bouguer anomaly
The uncertainties associated with global gravity anomaly models in our study area have been recognized as a significant challenge (Mariani et al., 2013). To address this issue and improve the accuracy of our analysis, we have calculated a new complete Bouguer anomaly map for the study area. This map aims to reduce uncertainties and provide a more precise representation of the gravity anomalies in the region.
Our new map exhibits notable differences compared to the EGM08 model, particularly in the western part of the Paraná basin, where we have incorporated additional data from the Topography and Geodesy Lab at the School of Engineering of the University of São Paulo (depicted in orange in Figure 2). The discrepancies between our map and the EGM08 model can reach up to 60 mGal in certain regions. For a detailed comparison between our map, the EGM08 model, and the SAGM04 model, please refer to Supplementary Figure S3 in the supplementary file.
5.2 Tectonic features on the gravity anomaly maps
The free-air and complete Bouguer anomaly maps serve as valuable tools in revealing the tectonic structures within our study area. The gravity anomalies prominently highlight the Paranapanema block and the Western Paraná Suture, which aligns with our expectations, considering that both of these features were previously proposed and delineated using gravity anomaly maps (Mantovani and Brito Neves, 2005; Dragone et al., 2017).
Another noteworthy tectonic feature in the study area is the Rio Apa craton, whose free-air and Bouguer anomalies agree with the boundaries proposed by Cordani et al. (2016). However, it is important to exercise caution in attributing the positive free-air and Bouguer anomalies solely to the Rio Apa craton, as the literature lacks a consensus on its exact boundaries, which varies depending on geological (e.g., Cordani et al., 2016), gravity (e.g., Dragone et al., 2017), or seismological-based approaches (e.g., Affonso et al., 2021). Further investigations are needed to conclusively establish the correlation between these anomalies and the specific geological features in that particular location.
By removing the contributions of known masses from the gravity anomaly, we can isolate density variations associated with unknown masses in our residual Bouguer anomaly map. As a result, this map exhibits density variations that are either unrelated or only weakly related to factors such as sediments, exhumed magmatism of the Serra Geral formation, and Moho topography.
Notably, the sediments exhibit relatively higher amplitude anomalies in the Paraná basin compared to the basalts. This observation indicates that the positive anomalies identified in the complete Bouguer anomaly map cannot be solely attributed to the presence of massive volumes of basalts within the sedimentary column, coherent with previous findings by Mariani et al. (2013).
Furthermore, the anomalies of the Moho topography gravity effect show a range of approximately 100 mGal (Figure 7), which nearly corresponds to the full range of the complete Bouguer anomalies (Figure 5). Consequently, the removal of the Moho topography effect leads to significant changes in the gravity map, enabling the identification and better delineation of previously recognized as well as unrecognized anomalies.
Even after removing the known mass effects, noticeable differences persist between the west and east sides of the Western Paraná Suture, corroborating Dragone et al.'s (2017; 2021) hypothesis of a suture zone between two distinct lithospheres: a thinner lithosphere in the west compared to the eastern portion. This feature allows us to partition the study area into two distinct regions.
On the western side of the Western Paraná Suture, where the anomalies range between −20 and 60 mGal, except for the high positive anomaly at the east border of the AA’ profile, a region with more than 30 mGal uncertainty (inset map in Figure 8), we observe a smoother variation of the anomalies, particularly in the Pantanal and Chaco-Paraná basins. In this same region, between the profiles AA’ and BB’, where the Tarija sedimentary basin is located (TjB in Figure 1), we identify a positive anomaly near its depocenter. Although this basin is beyond the scope of our specific study, the presence of this feature, not apparent in the complete Bouguer anomaly, offers a valuable opportunity for future investigations to better understand these anomalies and provide insights into the history and current architecture of the Tarija basin.
On the eastern side of the Western Paraná Suture, the density modeled profiles (Figure 9) generally exhibit a negative contrast density, except for four positive regions. Among these positive regions, three will be further presented and delimited in the next section, while the other is situated north of the Paraná basin, in the western part of the Tocantins province (TP in Figure 1). This positive anomaly encompasses the Goias Magmatic arc and the Araguaia/Paraguay belts of the Tocantins province. The negative anomaly in the same province is related to the Brasilia belt, which has been included in a paleocontinent named São Francisco paleocontinent (e.g., Rocha et al., 2019) or São Francisco-Congo when considering its African counterpart (e.g., Kuchenbecker and Barbuena, 2023).
Additionally, the negative anomaly south of the Paranapanema block seems to delineate an NNW-SSE lineament that goes until the Chaco-Paraná basin and could be related to the Central Paranaense Trough (CPT in Figure 1) since the region is the same. However, it is noteworthy that this fault-bounded depocenter proposed by Verozlavsky et al. (2021), primarily associated with the Chaco-Paraná basin, extends longer than the negative residual anomaly. Therefore, we hold back from proposing a definitive association based solely on our results.
5.3 Delimitations of lithospheric density features from the residual Bouguer anomaly
We delimited three positive anomalies, all situated within or on the border of the Paraná basin, as they exhibit larger amplitudes and may share a similar tectonic history. These anomalies are related to the Paranapanema block, the Luiz Alves craton, and the Ponta Grossa arch (indicated by red dashed contours in Figure 10). Previous studies have already delimited the first two features in similar positions. Mantovani and Brito Neves (2005) used gravity anomalies to propose and delineate the Paranapanema block, and Affonso et al. (2021) delimited the Luiz Alves craton based on a high-velocity anomaly in their P-wave seismic tomography. The third positive anomaly, located within the Ponta Grossa arch, has also been associated with a positive Bouguer anomaly by Santos et al. (2022).
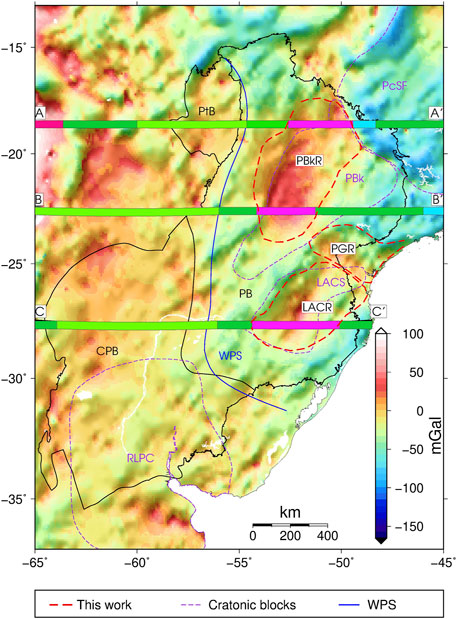
FIGURE 10. Residual Bouguer anomaly map, the colors of the (AA’–CC’) profiles are the same as in Figure 9. WPS by Dragone et al. (2021). PtB: Pantanal basin, PB: Paraná basin, CPB: Chaco-Paraná basin, and PBk: Paranapanema block by Cordani et al. (2016); PcSF: Paleocontinent São Francisco by Rocha et al. (2019b); LACS: Luiz Alves craton from seismic tomography by Affonso et al. (2021); PBkR: Paranapanema block from residual Bouguer anomaly, PGR: Ponta Grossa arch from residual Bouguer anomaly and LACR: Luiz Alves craton from residual Bouguer anomaly by this work.
The Paranapanema block is a well-studied tectonic feature within the Paraná basin, although its formation and nature remain a topic of debate. In the literature, there are hypotheses suggesting that it is a craton, with some proposing a single nucleus (Cordani, 1984; Mantovani and Brito Neves, 2005; Rocha et al., 2019a; Affonso et al., 2021) while others suggest that the craton is currently divided into several blocks (Milani, 1997; Milani and Ramos, 1998; Julià et al., 2008). Chaves et al. (2016) proposed that the densification of the lithosphere may be related to mantle refertilization. Mariani et al. (2016) suggested that the positive anomaly is caused by a surplus mass in the crust, a theory previously supported by Molina et al. (1988), Vidotti et al. (1998), and Piccirillo et al. (1989). The position of the surplus mass in the base of the crust was motivated by the deep Moho discontinuity estimated from seismologic data (Assumpção et al., 2013), which contrasts with the isostatic Moho expected by Airy’s hypothesis. While our data and methodology cannot distinguish between these hypotheses or determine the depth of the excess mass causing the positive residual Bouguer anomaly, we were able to laterally delineate the region of the positive anomaly, which may assist future studies on the Paranapanema block. Our proposed boundaries (PBkR in Figure 10) extend approximately 100 km to the west from the region proposed by Cordani et al. (2016), encompassing an area of approximately 2,000 km2.
Regarding the Luiz Alves craton, the boundary proposed by Cordani et al. (2016) (LAC in Figures 1, 4, 5, 8) covers a much smaller area than our proposal (LACR in Figure 10); however, the exact limits of this cratonic area remain unclear in the literature (Cordani and Sato, 1999; Cordani et al., 2016; Santos et al., 2019). Affonso et al. (2021) delimited a boundary for the Luiz Alves craton based on their seismic tomography (LACS in Figure 10), which is similar to our proposal. We extended their boundaries to the east, incorporating the area from Cordani et al. (2016), encompassing an area of approximately 1,500 km2. We also identify a high S-velocity anomaly at the same location in the first adjoint waveform tomography for South America (SAAM23 by Ciardelli et al., 2022) that may be correspondent to the Luiz Alves craton as well.
The Ponta Grossa arch (PGR in Figure 10) is a tectonic and magmatic feature associated with a dike swarm of the Mesozoic rifting (Santos et al., 2022). Santos et al. (2022) have associated this structure with positive gravity anomalies, the latter even calculated the regional residual Bouguer anomaly using the polynomial method to analyze the arch’s area. Their residual anomaly highlighted the same region with the highest amplitude as ours; however, they were not able to delimit the entire arch, which mainly consists of four lineaments, all within the area delimited by our study, covering approximately 1,150 km2.
5.4 Comparison between the lithosphere density structure of the sedimentary basins
Our residual Bouguer anomaly map (Figure 10) provides compelling evidence that the lithosphere beneath the Paraná and Chaco-Paraná Paleozoic basins and the Pantanal Quaternary basin exhibits a heterogeneous density structure, which is consistent with its complex tectonic evolution. As previously discussed in Section 5.2, the residual anomalies are distinct to the west and east of the Western Paraná Suture (WPS in blue), which is also reflected in the density models of the three profiles (Figure 9 and color profiles Figure 10). This information highlights significant density differences in the lithosphere below the basins. Remarkably, despite the marked differences in the tectonic history and duration of deposition of the Pantanal and Chaco-Paraná basins, they present a more similar lithospheric density structure, compared with the Paraná basin.
The density modeling of the profiles helps us analyze the influence of the lithosphere, considering the LAB depth. Through the forward model, we were able to confirm that the density contrast is different along the Paraná basin compared to the Pantanal and Chaco-Paraná basins even with the LAB difference between them. Moreover, the density contrast of the lithosphere below the Pantanal and Chaco-Paraná basins is the same, equals to zero.
The Paraná basin presents the most complex density structure in the study area, with its residual Bouguer anomaly (PB Figure 10) characterized by a negative baseline with three positive anomalies, which we have delimited in this work and presented the details in the last section. The complete Bouguer anomaly (Figure 5) exhibits this negative anomaly with a higher amplitude, which was partially reduced by the removal of the Moho topography gravity effect (Figure 7B), though it still persists in the residual anomaly. This indicates that the lithosphere of this basin indeed differs from the lithosphere below the Chaco-Paraná basin, which supports the Western Paraná Suture hypothesis (Dragone et al., 2017; Dragone et al., 2021).
Furthermore, in the residual Bouguer anomaly map (Figure 10), we observe distinct gravity anomalies in the northern and southern of the Chaco-Paraná basin, the southern part coinciding with the area of the Rio de La Plata craton (RLPC in Figure 10), a feature that was not evident in the complete Bouguer anomaly map (Figure 5). This association could be linked to the craton, similar to the negative anomaly related to the São Francisco paleocontinent discussed in Section 5.2 of this manuscript. Notably, the primary deposition of this basin is the Las Breñas Fm., located in the northern portion of the Chaco-Paraná basin (Meeßen et al., 2018), where the basin’s depocenter is also situated. While the maximum of the residual Bouguer anomaly is not exactly at this location, the higher amplitude in the north could be related to the basin’s formation or post-tectonic evolution, similar to the positive residual Bouguer anomaly observed in the north of the Paraná basin, coinciding with the Rio Ivai supersequence, the oldest units of the Paraná basin (Milani and Ramos, 1998).
Finally, the Pantanal basin, the youngest and smallest sedimentary basin under investigation, was included in the study to compare its geophysical characteristics with those of the Paleozoic basins. The complete Bouguer anomaly map (Figure 5) reveals a prominent positive anomaly covering the entire Pantanal basin, and the residual Bouguer anomaly also exhibits a positive anomaly, near to zero value. A noteworthy observation is the presence of an NS-oriented positive high anomaly lineament that almost bisects the basin, likely linked to the terranes comprising the lithosphere of the basin. Surprisingly, we observed no significant difference in the residual Bouguer anomaly between this younger basin and the Paleozoic Chaco-Paraná basin. However, it is worth noting that the lithosphere of the latter may have undergone alterations during its evolution (Meeßen et al., 2018), potentially influencing its overall density contrast. The alteration of the lithosphere below the Chaco-Paraná basin would explain the zero density contrast, that following our scale is related to a Proterozoic lithosphere.
6 Conclusion
Our study presents a residual Bouguer anomaly map for the Paraná, Chaco-Paraná, and Pantanal basins calculated by a new approach. Unlike conventional methods that rely on regional filters, like upward continuation or isostatic model compensation, we calculated the gravity effect of known masses in the sedimentary infill, basalt flood, and Moho topography, allowing us to remove their influence from the complete Bouguer anomaly. This approach has provided us with a more accurate and detailed representation of the lithosphere’s density structures in the study area.
Through our residual Bouguer anomaly map and forward gravity modeling of the three profiles, we have not only reaffirmed density structures already reported in the literature but also revealed new insights. Notably, we propose a revised location for the Paranapanema block, situated more to the west than previously suggested, and with a limited southwestern extension. Additionally, we have identified a larger Luis Alves craton for the first time using gravity data, which is consistent with recent seismological proposals (Affonso et al., 2021). Our analysis of the Ponta Grossa swarm dike has shed light on its significant impact on the lithosphere’s density structure, leading to the identification of a new anomaly. Furthermore, the western and eastern sides of the Western Paraná Suture exhibit contrasting residual Bouguer anomalies, with positive anomalies dominating the west and a mix of positive and negative anomalies with strong gradients in the eastern portion, supporting the hypothesis proposed by Dragone et al. (2017; 2021) of a suture between two different lithospheric compositions.
In summary, our findings contribute to a deeper understanding of the tectonic evolution and lithospheric density structures of the Paraná, Chaco-Paraná, and Pantanal basins, and their surrounding areas. By employing gravity data and modeling techniques, we have provided valuable geophysical insights that will aid future studies and enhance the knowledge of this complex geological region.
Data availability statement
The data analyzed in this study is subject to the following licenses/restrictions: The authors are not proprietary of the datasets analyzed for this study. Gridded files generated in this work may be available by request to the corresponding author and will be at the USP data repository after August 2024. Data from Brazil can be retrieved at BNDG (https://www.gov.br/anp/pt-br/assuntos/exploracao-e-producao-de-oleo-e-gas/dados-tecnicos/legislacao-aplicavel/bndg-banco-nacional-de-dados-gravimetricos). Requests to access these datasets should be directed to DM, ZGVuaXNlbW91cmFAb3V0bG9vay5jb20=; YM, eWFyYW1hcmFuQHVzcC5icg==.
Author contributions
DM: main contribution to the research. YM: senior contribution to the research. All authors contributed to the article and approved the submitted version.
Acknowledgments
DM acknowledges FAPESP for scholarship grant 2018/19562-2. The authors thank LTG-Poli-USP for providing access to data from Paraguay; Carlos Alberto Moreno Chaves for sharing programs for data analysis and helping in the interpretation of the results; Gabriel Negrucci Dragone for contributing to the discussion of the results; and André Vinícius de Sousa Nascimento for reviewing the manuscript. We are thankful for the comments of two reviewers, which improved the manuscript.
Conflict of interest
The authors declare that the research was conducted in the absence of any commercial or financial relationships that could be construed as a potential conflict of interest.
Publisher’s note
All claims expressed in this article are solely those of the authors and do not necessarily represent those of their affiliated organizations, or those of the publisher, the editors and the reviewers. Any product that may be evaluated in this article, or claim that may be made by its manufacturer, is not guaranteed or endorsed by the publisher.
Supplementary material
The Supplementary Material for this article can be found online at: https://www.frontiersin.org/articles/10.3389/feart.2023.1214828/full#supplementary-material
References
Affonso, G. M. P. C., Rocha, M. P., Costa, I. S. L., Assumpcao, M., Fuck, R. A., Albuquerque, D. F., et al. (2021). Lithospheric architecture of the Paranapanema block and adjacent nuclei using multiple-frequency P -wave seismic tomography. J. Geophys. Res. Solid Earth 126 (4). doi:10.1029/2020jb021183
Assine, M. L., Merino, E. R., Pupim, F. N., Warren, L. V., Guerreiro, R. L., and McGlue, M. M. (2016). “Geology and geomorphology of the Pantanal basin,” in Dynamics of the pantanal wetland in south America. Editors I. Bergier, and M. L. Assine (Berlin, Germany: Springer), 23–50.
Assine, M. L., Perinotto, J. A. J., Alvarenga, C. J. S. D., and Petri, S. (1998). Arquitetura estratigráfica, tratos deposicionais e paleogeografia da Bacia do Paraná (Brasil) no Neo-Ordoviciano/Eo-Siluriano. Rev. Bras. Geociências 28 (1), 61–76.
Assine, M. L., and Soares, P. C. (2004). Quaternary of the pantanal, west-central Brazil. Quat. Int. 114 (1), 23–34. doi:10.1016/S1040-6182(03)00039-9
Assumpção, M., Bianchi, M., Julià, J., Dias, F. L., França, G. S., Nascimento, R., et al. (2013). Crustal thickness map of Brazil: data compilation and main features. J. S. Am. Earth Sci. 43, 74–85. doi:10.1016/j.jsames.2012.12.009
Brito Neves, B. B., Fuck, R. A., and Pimentel, M. M. (2014). The Brasiliano collage in south America: A review. Braz. J. Geol. 44, 493–518. doi:10.5327/Z2317-4889201400030010
Brito Neves, B. B., and Fuck, R. A. (2014). The basement of the South American platform: half Laurentian (N-NW)+half Gondwanan (E-SE) domains. Precambrian Res. 244, 75–86. doi:10.1016/j.precamres.2013.09.020
Chaves, C., Ussami, N., and Ritsema, J. (2016). Density and P-wave velocity structure beneath the Paraná Magmatic Province: refertilization of an ancient lithospheric mantle. Geochem. Geophys. Geosystems 17 (8), 3054–3074. doi:10.1002/2016GC006369
Ciardelli, C., Assumpção, M., Bozdağ, E., and van der Lee, S. (2022). Adjoint waveform tomography of South America. J. Geophys. Res. Solid Earth 127 (2), e2021JB022575. doi:10.1029/2021JB022575
Cordani, U. G. (1984). Estudo preliminar de integração do Pré-Cambriano com os eventos tectônicos das bacias sedimentares brasileiras. Bol. Ciênc. Técn. Petról. 15, 1–70.
Cordani, U. G., Ramos, V. A., Fraga, L. M., Cegarra, M., Delgado, I., Souza, K. G. D., et al. (2016). Tectonic map of South America. CGMW-CPRM-SEGEMAR. doi:10.14682/2016TEMSA
Cordani, U. G., and Sato, K. (1999). Crustal evolution of the South American Platform, based on Nd isotopic systematics on granitoid rocks. Episodes J. Int. Geoscience 22 (3), 167–173. doi:10.18814/epiiugs/1999/v22i3/003
Dragone, G. N., Bologna, M. S., Ussami, N., Gimenez, M. E., Alvarez, O., Klinger, F. G. L., et al. (2021). Lithosphere of South American intracratonic basins: electromagnetic and potential field data reveal cratons, terranes, and sutures. Tectonophysics 811, 228884. doi:10.1016/j.tecto.2021.228884
Dragone, G. N., Ussami, N., Gimenez, M. E., Klinger, F. G. L., and Chaves, C. A. M. (2017). Western Paraná suture/shear zone and the limits of Rio Apa, Rio Tebicuary and Rio de la Plata cratons from gravity data. Precambrian Res. 291, 162–177. doi:10.1016/j.precamres.2017.01.029
Feng, H. Q., Wu, D. J., and Chao, J. K. (2007). Size and energy distributions of interplanetary magnetic flux ropes. J. Geophys. Res. Space Phys. 112 (A2). doi:10.1029/2006JA011962
Frank, H. T., Gomes, M. E. B., and Formoso, M. L. L. (2009). Review of the areal extension and volume of the serra GERAL FORMATION, paraná basin, south America. Pesqui. em Geociências 36 (1), 49–57. doi:10.22456/1807-9806.17874
Heilbron, M., Cordani, U. G., and Alkmim, F. F. (2017). “The São Francisco craton and its margins,” in São Francisco craton, eastern Brazil: Tectonic genealogy of a miniature continent (Berlin, Germany: Springer), 3–13.
Hinze, W. J. (2003). Bouguer reduction density, why 2.67? Geophysics, 68(5), 1559–1560. doi:10.1190/1.1620629
IAG - International Association of Geodesy (1971). “Geodetic reference system 1967,” in Publi. Spéc. n° 3 du Bulletin Géodésique (Paris: Springer).
Jones, C. H. Updaters for GravMag, 2012. Available at: http://cires.colorado.edu/people/jones.craig/GSSH/updaters/GravMag.html (Accessed October, 3, 2020).
Julià, J., Assumpção, M., and Rocha, M. P. (2008). Deep crustal structure of the Paraná Basin from receiver functions and Rayleigh-wave dispersion: evidence for a fragmented cratonic root. J. Geophys. Res. Solid Earth 113 (B8). doi:10.1029/2007JB005374
Kuchenbecker, M., and Barbuena, D. (2023). Basement inliers of the araçuaí-west Congo orogen: key pieces for understanding the evolution of the São Francisco-Congo paleocontinent. J. S. Am. Earth Sci. 125, 104299. doi:10.1016/j.jsames.2023.104299
Laske, G., and Masters, G. (1997). A global digital map of sediment thickness. EOS Trans. Am. Geophys. Union 78, F483.
Laske, G., Masters, G., Ma, Z., and Pasyanos, M. (2013). “Update on CRUST1. 0—a 1-degree global model of earth’s crust,” in Geophysical research abstracts (Vienna, Austria: EGU General Assembly), 2658.
Mantovani, M. S. M., and de Brito Neves, B. B. (2005). The Paranapanema lithospheric block: its importance for Proterozoic (Rodinia, Gondwana) supercontinent theories. Gondwana Res. 8 (3), 303–315. doi:10.1016/S1342-937X(05)71137-0
Mariani, P., Braitenberg, C., and Ussami, N. (2013). Explaining the thick crust in Paraná basin, Brazil, with satellite GOCE gravity observations. J. S. Am. Earth Sci. 45, 209–223. doi:10.1016/j.jsames.2013.03.008
Matos, A. C. D. O. C. (2005). “Implementação de modelos digitais de terreno para aplicações na área de geodésia e geofísica na América do Sul,”. Doctoral Thesis (Brazil: Universidade de São Paulo).
Meeßen, C., Sippel, J., Scheck-Wenderoth, M., Heine, C., and Strecker, M. R. (2018). Crustal Structure of the Andean foreland in Northern Argentina: results from data-integrative three-dimensional density modeling. J. Geophys. Res. Solid Earth 123 (2), 1875–1903. doi:10.1002/2017JB014296
Milani, E. J., Araujo, L. M., Cupertino, J. A., Faccini, U. F., and Scherer, C. M. (1998). Sequences and stratigraphic hierarchy of the parana basin (ordovician cretaceous), southern Brazil. Bol. IG-USP. Série Científica 29.
Milani, E. J. (2004). “Comentários sobre a origem e evolução tectônica da Bacia do Paraná,” in Geologia do Continente Sul-Americano: Evolução da obra de Fernando Flávio Marques de Almeida,. Editors V. Mantesso-Neto, and A. BartorellI, 265–291.
Milani, E. J. (1997) Evolução tectono-estratigráfica da Bacia do Paraná e seu relacionamento com a geodinâmica fanerozóica do Gondwana Sul-ocidental, Doctoral thesis (São Paulo, Brazil: Universidade de São Paulo).
Milani, E. J., Melo, J. H. G., Souza, P. A., Fernandes, L. A., and França, A. B. (2007). Bacia do Paraná. Bol. Geociências Petrobras 15 (2), 265–287.
Milani, E. J., and Ramos, V. A. (1998). Orogenias paleozóicas no domínio sul-ocidental do Gondwana e os ciclos de subsidência da Bacia do Paraná. Rev. Bras. Geociências 28 (4), 473–484. doi:10.25249/0375-7536.1998473484
Molina, E. C., Ussami, N., De Sá, N. C., Blitzkow, D., and Miranda Filho, O. F. (1988). “Deep crustal structure under the Paraná Basin (Brazil) from gravity study,” in The mesozoic flood volcanism of the Paraná Basin: Petrogenetic and geophysical aspects. Editors E. M. Piccirillo, A. J. Melfi, and org (São Paulo, Brazil: São Paulo, Instituto Astronômico e Geofísico - Universidade de São Paulo), 271–283.
Nagy, D., Papp, G., and Benedek, J. (2000). The gravitational potential and its derivatives for the prism. J. Geodesy 74, 552–560. doi:10.1007/s001900000116
Nascimento, A. V. S., França, G. S., Chaves, C. A. M., and Marotta, G. S. A. (2022). Rayleigh wave group velocity maps at periods of 10–150 s beneath South America. Geophys. J. Int. 228 (2), 958–981. doi:10.1093/gji/ggab363
Olson, C. J., Becker, J. J., and Sandwell, D. T. (2014). A new global bathymetry map at 15 arcsecond resolution for resolving seafloor fabric: SRTM15_PLUS. AGU Fall Meet. Abstr. 2014, OS34A–03.
Parker, R. L. (1973). The rapid calculation of potential anomalies. Geophys. J. Int. 31 (4), 447–455. doi:10.1111/j.1365-246X.1973.tb06513.x
Pavlis, N. K., Holmes, S. A., Kenyon, S. C., and Factor, J. K. (2012). The development and evaluation of the earth gravitational model 2008 (EGM2008). J. Geophys. Res. Solid Earth 117 (B4). doi:10.1029/2011JB008916
Pedley, R. C., Busby, J. P., and Dabek, Z. K. (1993). GRAVMAG user manual–interactive 2.5 D gravity and magnetic modeling. Nottingham, UK: British Geological Survey, 73. Technical Report WK/93/26/R.
Piccirillo, E. M., Civetta, L., Petrini, R., Longinelli, A., Bellieni, G., Comin-Chiaramonti, P., et al. (1989). Regional variations within the Paraná flood basalts (southern Brazil): evidence for subcontinental mantle heterogeneity and crustal contamination. Chem. Geol. 75 (1-2), 103–122. doi:10.1016/0009-2541(89)90023-5
Poudjom-Djomani, Y. H. P., O’Reilly, S. Y., Griffin, W. L., and Morgan, P. (2001). The density structure of subcontinental lithosphere through time. Earth Planet. Sci. Lett. 184 (3-4), 605–621. doi:10.1016/S0012-821X(00)00362-9
Priestley, K., McKenzie, D., and Ho, T. (2018). A lithosphere–asthenosphere boundary—a global model derived from multimode surface-wave tomography and petrology. Lithospheric discontinuities, 111–123. doi:10.1002/9781119249740.ch6
Rocha, M. P., Assumpção, M., Affonso, G. M. P. C., Azevedo, P. A., and Bianchi, M. (2019a). Teleseismic P wave tomography beneath the pantanal, Paraná, and chaco-paraná basins, SE South America: delimiting lithospheric blocks of the SW Gondwana assemblage. J. Geophys. Res. Solid Earth 124 (7), 7120–7137. doi:10.1029/2018JB016807
Rocha, M. P., Azevedo, P. A., Assumpção, M., Pedrosa-Soares, A. C., Fuck, R., and Von Huelsen, M. G. (2019b). Delimiting the neoproterozoic São Francisco paleocontinental block with P-wave traveltime tomography. Geophys. J. Int. 219 (1), 633–644. doi:10.1093/gji/ggz323
Sá, N. C. de (2004). O campo de gravidade, o geoide e a estrutura crustal na américa do sul: Novas estratégias de representação. São Paulo: Thesis (Livre Docência) – Instituto de Astronomia, Geofísica e Ciências Atmosféricas, Universidade de São Paulo.
Santos, J. O., Chernicoff, C. J., Zappettini, E. O., McNaughton, N. J., and Hartmann, L. A. (2019). Large geographic and temporal extensions of the Río de la Plata Craton, South America, and its metacratonic eastern margin. Int. Geol. Rev. 61 (1), 56–85. doi:10.1080/00206814.2017.1405747
Santos, M. D., Ladeira, F. S. B., Batezelli, A., Nunes, J. O. R., Salamuni, E., Silva, C. L. D., et al. (2022). Interactions between tectonics, bedrock inheritance and geomorphic responses of rivers in a post-rifting upland (Ponta Grossa Arch region, Brazil). Braz. J. Geol. 52, e20210002. doi:10.1590/2317-4889202220210002
Uieda, L., Oliveira, V. C., and Barbosa, V. C. (2013). “Modeling the earth with fatiando a terra,” in Proceedings of the 12th Python in Science Conference, Austin, Texas, June 2013, 96–103.
Ussami, N., and Molina, E. C. (1999). Flexural modeling of the neoproterozoic Araguaia belt, central Brazil. J. S. Am. Earth Sci. 12 (1), 87–98. doi:10.1016/S0895-9811(99)00007-3
Ussami, N., Shiraiwa, S., and Dominguez, J. M. L. (1999). Basement reactivation in a sub-Andean foreland flexural bulge: the Pantanal wetland, SW Brazil. Tectonics 18 (1), pp25–39. doi:10.1029/1998TC900004
Veroslavsky, G., Rossello, E. A., López-Gamundí, O., de Santa Ana, H., Assine, M. L., Marmisolle, J., et al. (2021). Late paleozoic tectono-sedimentary evolution of eastern Chaco-Paraná basin (Uruguay, Brazil, Argentina and Paraguay). J. S. Am. Earth Sci. 106, 102991. doi:10.1016/j.jsames.2020.102991
Vidotti, R. M., Ebinger, C. J., and Fairhead, J. D. (1998). Gravity signature of the western Paraná basin, Brazil. Earth Planet. Sci. Lett. 159 (3-4), 117–132. doi:10.1016/S0012-821X(98)00070-3
Wessel, P., Smith, W. H., Scharroo, R., Luis, J., and Wobbe, F. (2013). Generic mapping tools: improved version released. Eos, Trans. Am. Geophys. Union 94 (45), 409–410. doi:10.1002/2013eo450001
Keywords: Paraná basin, Chaco-Paraná basin, Pantanal basin, gravity corrections, Bouguer anomaly, forward modeling, lithosphere density structure
Citation: Moura DS and Marangoni YR (2023) Lithosphere density structure of southeastern South America sedimentary basins from the analysis of residual gravity anomalies. Front. Earth Sci. 11:1214828. doi: 10.3389/feart.2023.1214828
Received: 30 April 2023; Accepted: 11 August 2023;
Published: 31 August 2023.
Edited by:
Henglei Zhang, China University of Geosciences Wuhan, ChinaReviewed by:
Chong Zhang, Chinese Academy of Geological Sciences, ChinaNatasha Stanton, Rio de Janeiro State University, Brazil
Copyright © 2023 Moura and Marangoni. This is an open-access article distributed under the terms of the Creative Commons Attribution License (CC BY). The use, distribution or reproduction in other forums is permitted, provided the original author(s) and the copyright owner(s) are credited and that the original publication in this journal is cited, in accordance with accepted academic practice. No use, distribution or reproduction is permitted which does not comply with these terms.
*Correspondence: Denise Silva de Moura, ZGVuaXNlbW91cmFAb3V0bG9vay5jb20=
†These authors share first authorship