- 1School of Geomatics and Municipal Engineering, Zhejiang University of Water Resources and Electric Power, Hangzhou, China
- 2Engineering Research Center of Digital Twin Basin of Zhejiang Province, Hangzhou, China
- 3Henan Water and Power Engineering Consulting Co., Ltd., Zhengzhou, China
- 4College of Energy and Power Engineering, North China University of Water Resources and Hydropower, Zhengzhou, China
- 5School of Water Conservancy and Environmental Engineering, Zhejiang University of Water Resources and Electric Power, Hangzhou, China
Trapped air bubbles in pipelines significantly affect the safety and efficiency of water supply systems, potentially inducing water hammer and leading to pipeline explosions and interruptions. This study investigates the sweeping velocity of air bubbles in horizontal pipelines by analyzing the forces acting on a single air bubble and deriving a theoretical expression for calculating the sweeping velocity. Physical model experiments and numerical simulations are conducted to examine the variations in sweeping velocity with respect to bubble volume and dimensionless bubble volume. Results indicate that the sweeping velocity increases with bubble volume, and the diameter of the pipeline significantly affects the movement of air bubbles. These findings contribute to a better understanding of air bubble behavior in horizontal pipelines and can inform strategies for mitigating risks associated with trapped air bubbles, ultimately improving the safety and reliability of water supply systems.
1 Introduction
Constructing long-distance water supply projects is one of the most direct methods to ensure the optimal allocation of water resources, and has become the main means of water supply for water-deficient cities and regions around the world (Zhang et al., 2015; Li et al., 2018; Ge et al., 2022). These projects require complicated fluid transportation systems which equipped with long pipelines with large flow, high pressure, many branches, wide range, and complex terrain conditions. Their operational safety requirements are extremely high (Leila et al., 2016; Wang et al., 2022; Zhang et al., 2023). Trapped air is a dominant factor which may induce pipeline burst in pressured pipeline transportation systems, and it has been one of the major potential risks that threaten the safe operation of water supply projects. The sweeping velocity of air bubbles reflects the ability of the fluid in the pipeline to carry air pockets, which can be used as a measure to estimate the movement and retention of air pockets in water pipelines.
Numbers of researches have been conducted to study the moving status, morphological variations, and physical processes of air bubbles in water pipelines. Benjamin T, 1968 determined the Fred number corresponding to the sweeping velocity of air bubbles in horizontal pipelines based on theoretical analysis. Bendiksen (1984) conducted physical model experiments using horizontal pipelines with the diameters ranged from 0.02 to 0.05 m, and proved the existing of the slip velocity. Escarameia et al. (2005) found that the velocity of bubbles in closed pipelines is directly proportional to the diameter of the pipe. The velocity of the air bubbles increase with the increasing of the diameters of pipeline. Yang et al. (2007) demonstrated that pressure affects the physical mechanism governing the gas-liquid interaction, and accordingly influences the dynamics of air bubbles. The dynamics of air bubbles plays a key role in dictating the transport phenomena in gas—liquid fluidization systems. Pothof (2011) deemed that the dimensionless velocity of air bubbles in an outlet pipe n is related to the bubble volume and pipe diameter. Previous researchers have linked the bubble sweeping velocity with the pipe diameter, pipe inclination, and gravity acceleration. However, there is a gap in the effect of bubble volume, surface tension, and other parameters on the bubble sweeping velocity. Ni et al. (2008) believed that bubbles are merely affected by surface tension and buoyancy force. Liu et al. (2008) proposed the correction relation of the friction coefficient between the air phase and water phase using theoretical and experimental analysis. Wang et al. (2019) conducted air-water two-phase flow experiments using a horizontal pipeline, and deduced the friction coefficient between the air phase and water phase.
A numbers of numerical simulation methods also have been proposed to study the law of movement of air bubbles in pipelines. The interface tracking methods (Jafari and Okutucu-Özyurt, 2016; Wu et al., 2021; Wang et al., 2023) such as, MAC (marker and cell technology) model (Santos et al., 2012), etc., have been introduced. The interface capture methods such as the level-set (Zhang et al., 2013; Zhai et al., 2021; Amin and Majid Eshagh, 2020), VOF (volume of fluid) (Ye et al., 2020; Mohammad et al., 2020; Li et al., 2021), and CLSVOF models also have been widely used. Song (2011) proved that when computing the sweeping velocity of air bubbles using convection transport equation, the precision of air–liquid two-phase flow using the CLSVOF model is much more accurate than that of the level-set model and the VOF model. The CLSVOF model is also used to simulate the bubble rising process. This model can not only overcome the shortcomings of the level-set and VOF methods, but also benefits from the advantages of the two methods (Shang et al., 2017; Ge et al., 2020).
Researchers have used machine learning methods to analyze the velocity and shape of air bubbles obtained from physical model experiments. The precision of these methods are more accurate comparing with that of the empirical equations (Deng et al., 2019). Bak et al. (2020) proposed a semi-theoretical correlation developed from a steady-state bubble number density transport equation for predicting the distribution of local bubble size. To obtain physical mechanism governing the air-water interaction, a new method to determine the bubble velocity magnitude was proposed (Qu et al., 2020). Giorgio et al. (2016) provided an experimental method to observe the motion of air bubbles by using a light-field camera, and then analyzed the flow properties and distribution of the air bubbles. Himr (2015) observed the trapped air in the pipeline using a high-speed camera and workbench, and determined the relevant movement laws of trapped air. In order to describe the gas—liquid two-phase flow; Baranivignesh et al. (2019) proposed a new observation method that can locally measure the gas—liquid two-phase flow using particle image velocimetry (PIV) technique, and they verified that the measured bubble size error was small. The optical flow method is a technical method used to detect underwater gas (Sandsten and Andersson, 2012). Xu et al., 2020 designed an automatic detection method for underwater gas, and predicted the motion of underwater gas by using the Farneback optical flow method. The systematical error analysis of the optical flow method in velocity measurements was valid by comparing with the cross-correlation method using in PIV technique (Liu et al., 2015).
The sweeping velocity of the air bubbles is an important index to estimate the carrying capacity of the water supply system. At present, the understanding of the sweeping velocity is still not sufficient. Also, the conclusions obtained from different studies are lack of consistency. This paper studies the motion of bubbles in horizontal water pipelines experimentally and numerically, and deduces the formula of bubble sweeping velocity on the basis of forces analysis. Then, the effect of bubble volume and pipe diameter on the bubble sweeping velocity is discussed.
2 Theoretical analysis
In practical engineering, the pipes can be horizontal or with certain slopes depending on actual construction conditions. To simplify the complexity of practical engineering, we only considered horizontal pipeline in this study. We first define the dimensionless bubble volume as:
where n is the dimensionless bubble volume, Vb is the volume of the bubble, and D is the diameter of the water pipeline.
For the situation of n > 0.8, the air in the pipeline is mainly in the form of air pocket, i.e., the bubbles gathers together, and the sweeping velocity of the air pocket is mainly affected by the diameter and inclination of the pipeline. For the situation of n < 0.8, the air is mainly in the state of dispersive bubbles. The universal movement law of air bubbles is still lacking. In this section, the forces and sweeping velocity of air bubbles in a horizontal pipeline is analyzed.
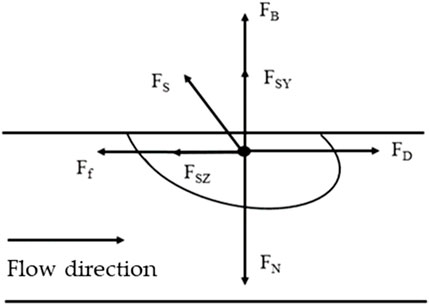
When n < 0.8, the air bubbles in the horizontal pipeline are mainly affected by the buoyancy force, the support force of the side wall of the pipeline, the drag force of the water flow, the friction resistance of the side wall of the pipeline, and the surface tension. When the fluid velocity in the horizontal pipe is small, the resultant force acts on the bubbles in the horizontal direction is zero, and the bubbles remain still close to the upper wall of the pipe. Figure 1 illustrates the force analysis of a single air bubble in a horizontal pipeline. FD is the drag force, Ff is the frictional resistance of the side wall of the pipeline to the bubble, FN is the support force of the side wall of the pipeline on the bubble, FB is the buoyancy force, FS is the surface tension of the bubble with FSY the vertical component of surface tension and FSZ the horizontal component of surface tension. If the resultant force in the vertical and horizontal directions is zero, the bubble will adhere to the pipe wall.
For the horizontal direction:
For the vertical direction:
The expressions of the drag force FD are as follows:
where
where VB is the volume of the bubble in the pipeline,
where
where
3 Physical model experiment
3.1 Experimental facilities
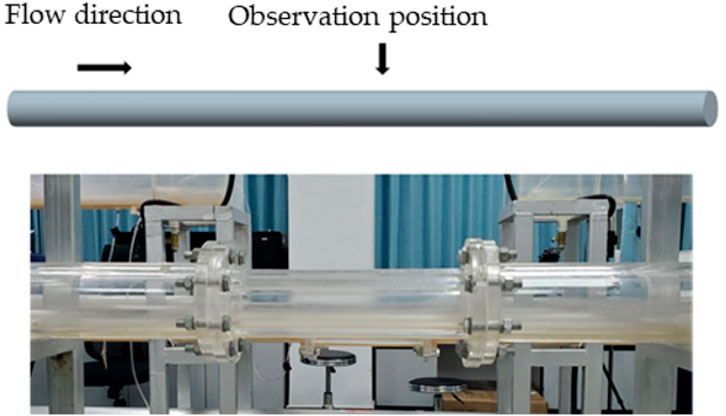
Figure 2 illustrates the experimental facilities used in the physical model experiments of this study. The experiments were conducted in constant temperature and pressure environment. The temperature was 25°C and the temperature was the standard atmospheric pressure. Figure 2A shows the panorama Gram of the facilities which mainly include three parts: an air—water two-phase flow test platform, a data acquisition system, and an image acquisition system. The air—water two-phase flow test platform mainly included a water supply module, an air transmission module, and a bubble movement observation module. The pipe material commonly used in practical engineering is concrete. In our experiments, we used transparent plastic pipe to visualize the motion of bubble inside the pipeline. The material of the pipe may affect the dynamic of the fluid via influencing the resistance of the side wall. However, we do not enter the errors result from difference of side wall materials in this study. The data acquisition system can not only collect the characteristics of the flow such as velocity, but also controls the velocity of flow and volume of air bubbles. The image acquisition system mainly includes a high-speed camera. In order to improve the quality and accuracy of images, the experimental setup was equipped with a high-precision and high-speed camera with a built-in 12bit CMOS sensor. The resolution of the camera includes 1920 × 1,080, 1,280 × 1,024, and 800 × 600, with a minimum pixel of 5 × 5 μm. In this experiment, we have used a camera with a resolution of 1920 × 1,080 with a minimum pixel of 5 × 5 μm. The sensitivity is 12,000–3000 ISO monochrome, 4,800–1200 ISO color, shutter speed 3 μs to 41.667 ms. The velocity and state of bubble initiation were recorded using the high speed camera. The image acquisition system is shown in Figure 2D. An electromagnetic flowmeter was used to measure the real time velocity of fluid. The measurement range of the electromagnetic flowmeter is 0–15 m/s, and the flow velocity accuracy was 0.005 m/s. The layout of the electromagnetic flowmeter is shown in Figure 2B. The air flow measurement assembly is shown in Figure 2C. These facilities are used to explore the dynamic of air bubbles in horizontal pipelines with different inclinations and diameters.
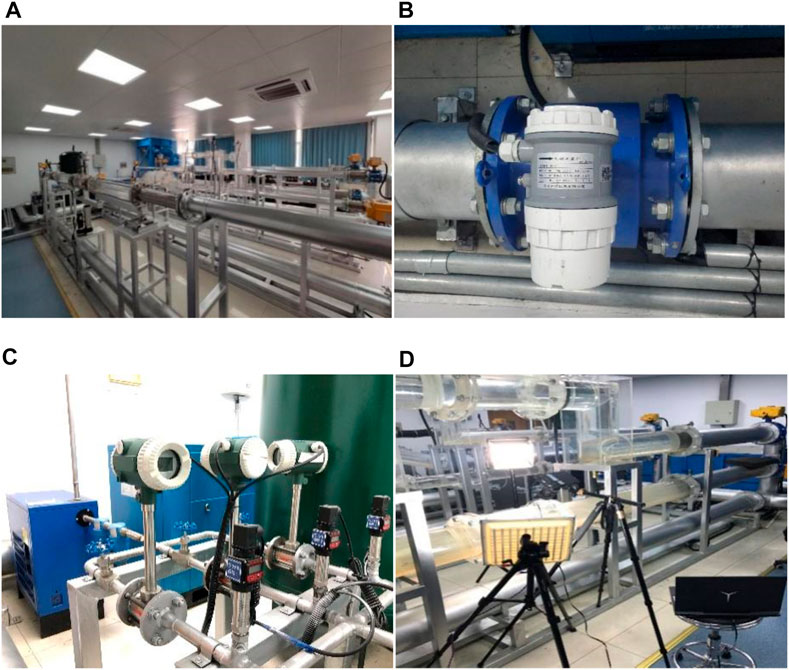
FIGURE 2. Experimental facilities: (A) the panoramagram of the facilities, (B) the electromagnetic flowmeter, (C) the air flow measurement assembly, (D) image acquisition system.
The high-speed camera collected images with a frequency of 500 frames per second. The velocity of air bubbles can be determined by using the distance and time interval between different frames of images, where the difference between the bubble and water flow velocity is the slip velocity vs, and the ratio of bubble velocity to water flow velocity is the slip velocity ratio Ks.
where vs is the slip velocity (m/s), vw is the water velocity in the pipe (m/s), vb is the bubble velocity (m/s), and Ks is the slip ratio.
In addition, to study the effect of the diameter of pipeline on the sweeping velocity of air bubbles, the DN100 and DN200 pipelines were used. Both of them are horizontal pipelines with a length of 2 m. The diameter of the DN200 pipeline is 0.2 m, and the diameter of the DN100 pipeline is 0.1 m.
3.2 Experimental results
This experiment mainly investigated the sweeping velocity of bubbles in horizontal water pipelines. Using different pipe diameters (DN100 and DN200), horizontally arranged pipes, and bubbles of different sizes, we collected data using the image acquisition system and data acquisition system, and explored the sweeping velocity of air bubbles under different conditions. We then analyzed the sweeping velocity of air bubbles and influence of trapped air in combination with the theoretical analysis, and determined the pressure, flow rate, and other data in the pipeline. In the numerical simulation and theoretical analysis, the case of one bubble was studied. However, in the experimental part, due to the limitation of the experimental facility, several bubbles were produced in the pipe. We neglected the potential errors result from the interaction among bubbles.
For the DN100 and DN200 horizontal pipelines, the bubble sweeping velocity tests under different working conditions were carried out by controlling the parameters including the long axis of the bubble, the bubble volume, the dimensionless bubble volume, the bubble velocity, the slip velocity, and the slip ratio Table 1 shows the results of experiments conducted using the DN100 pipeline. The results of experiments conducted using the DN200 pipeline are listed in Table 2.
The variations of the sweeping velocity of air bubbles to the bubble volume and dimensionless bubble volume n under two different pipeline diameters (DN100 and DN200) are shown in Figure 3. In this study, the bubble volume varies within the range of 0 to
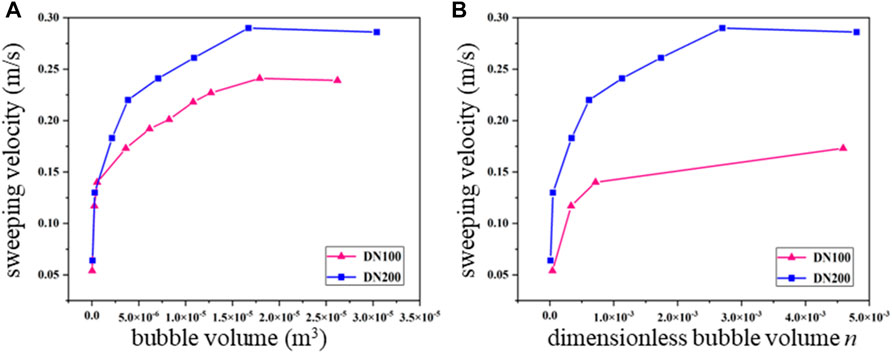
FIGURE 3. Variations of the sweeping velocity of air bubbles to the (A) bubble volume and (B) dimensionless bubble volume obtained from experiments conducted using DN100 and DN200 pipelines.
4 Numerical simulation
We established a three-dimensional horizontal pipeline numerical model using the same parameters as physical model experiments, including the velocity of water in the pipeline, the parameters of air bubbles, etc. The schematic diagram of the three-dimensional numerical model is shown in Figure 4. Same as the experimental part of this study, the diameter of the pipeline is 0.2 m for DN200 and 0.1 m for DN100.
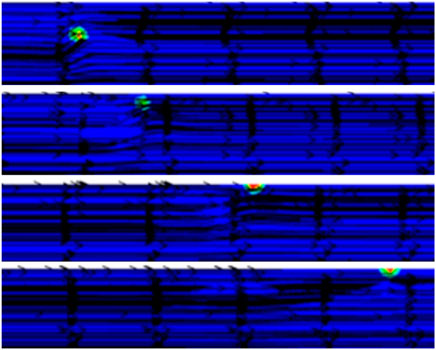
By processing the calculation results of the numerical simulation, the bubble sweeping velocity, bubble moving pattern, and bubble shape changes with different pipe diameters and bubble parameters in the horizontal pipeline were analyzed. The fluid dynamics at the cross-section of the pipeline were obtained from the three-dimensional numerical model. Figure 5 shows the motion of the air bubble obtained from the numerical simulation, where the blue part indicates the water phase, and the red part indicates the air phase.
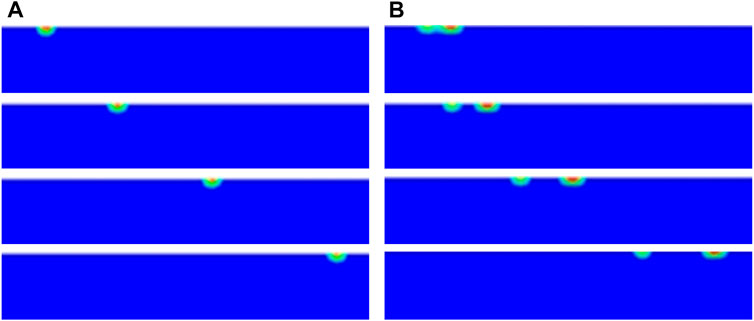
FIGURE 5. Process diagram of bubbles starting to move in the DN200 pipeline diagram. (A) under the conditions of long axis is 0.012 m, middle axis is 0.012 m, and short axis is 0.008 m; (B) under the conditions of long axis is 0.067 m, middle axis is 0.026 m, and short axis is 0.024 m.
Figure 5A shows the initiation process of air bubbles in the DN200 horizontal pipeline under the conditions of long axis is 0.012 m, middle axis is 0.012 m, and short axis is 0.008 m. At the initial stage, the fraction of the water-phase volume is 1, and the velocity of water is 0.05 m/s. A bubble was introduced into the front end of the observation section. At this time, the bubble was mainly affected by the buoyancy force and the drag force. The bubble moves to the vicinity of the side wall of the pipeline, and then approaches the side wall under the influence of the surface tension and the friction resistance of pipeline. Henceforth, the bubble tended to be stable. After the bubble was stable, we increased the water flow rate gradually, with the increase rate not exceeding 0.02 m/s each time. After the water flow became steady, we increased the flow rate again until the bubble moved. When the velocity of water reaches 0.196 m/s, the bubble was sweeping slowly, and the bubble slip velocity was slow in the initial stage before increasing slowly until it was washed out of the observation section by the water flow. The bubbles moved close to the side wall of the pipeline throughout the whole process.
Figure 5B shows the start of the bubbles’ movement process in the DN200 horizontal pipeline, under the conditions of long axis is 0.067 m, middle axis is 0.026 m, and short axis is 0.024 m. When the flow rate increased to 0.274 m/s, two bubbles (after bubble splitting) were washed out of the observation section by the water flow at different flow velocities and accelerations.
Figure 6 shows the streamline of the DN200 horizontal pipeline under the conditions of long axis is 0.024 m, middle axis is 0.026 m, and short axis is 0.024 m, where the blue part is the water phase, the red part is the air phase, and black is the streamline. After the initiation of the bubble, the flow field around the bubble changes, and the water flows around and through the bubble. The streamline above the bubble’s front end is sparse, and the streamline below the bubble’s front end has a high density. We think the reason is that the overflow section area is hindered when the bubble is close to the wall, resulting in the sparse streamline above the bubble’s front end and the dense streamline below the bubble’s front end. Then, the water flow bypasses the bubble, and the back end of the bubble gradually returns to a uniform flow field. When the bubble is washed out of the observation section by the water flow, the whole flow field returns to a uniform flow field, and the flow field under other working conditions is similar to that under this working condition.
In order to simplify the observation of the air bubble, the shape of moving air bubbles under different working conditions as shown in Figure 7, where the black part is the bubble and the light blue part is the water phase. After the bubble is filled into the pipe, it becomes oval due to the influence of surface tension and other forces. During the period near the pipe wall, the shape is constantly changing; the short axis becomes longer and the long axis becomes shorter. Near the pipe wall, the bubble profile changes from oval to semi-oval. During the forward movement of the air bubbles adsorbed on the pipe wall, the long axis of the air bubbles changes slightly, but the overall shape remains semi-oval until it rushes out of the observation section.

FIGURE 7. The shape of moving air bubbles in the DN200 horizontal pipeline. (A) under the conditions of long axis is 0.064 m, middle axis is 0.064 m, and short axis is 0.064 m; (B) under the conditions of long axis is 0.012 m, middle axis is 0.012 m, and short axis is 0.008 m; (C) under the conditions of long axis is 0.024 m, middle axis is 0.02 m, and short axis is 0.017 m; (D) under the conditions of long axis is 0.067 m, middle axis is 0.026 m, and short axis is 0.024 m; (E) under the conditions of long axis is 0.095 m, middle axis is 0.028 m, and short axis is 0.024 m; (F) under the conditions of long axis is 0.15 m, middle axis is 0.031 m, and short axis is 0.025 m.
In Figure 7, the initial section shape of the bubble adsorbed on the pipe wall after filling the pipe is semi-elliptical. When adsorbed on the pipe wall, the long axis is continuously elongated and the short axis is continuously shortened under the action of surface tension and buoyancy. With the increase in the drag force, the bubble gradually splits into two semi-elliptical bubbles and rushes out of the observation section at different movement rates.
For the DN100 and DN200 horizontal pipelines, numerical simulations of the bubble sweeping velocity under different working conditions were carried out. The simulation results are shown in Tables 3, 4. It can be seen from the velocity data in Tables 3, 4 that in the horizontal pipeline, the sweeping velocity of the bubbles is affected by factors such as bubble volume and pipe diameter. In the horizontal pipeline with the same diameter, the sweeping velocity of the bubbles increases with the increase in the bubble volume. When it reaches a certain critical value, the change in the bubbles’ sweeping velocity tends to be gentle.
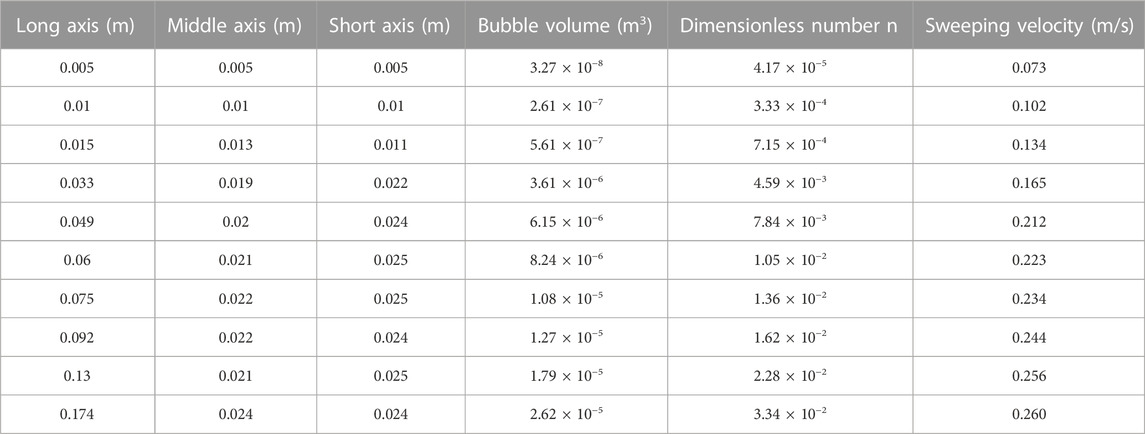
TABLE 3. The numerical simulation results of the bubbles starting to move in the DN100 horizontal pipeline.

TABLE 4. The numerical simulation results of the bubbles starting to move in the DN200 horizontal pipeline.
Figure 8 shows the variations of the sweeping velocity of air bubbles to the bubble volume and dimensionless bubble volume obtained from numerical simulation conducted with DN100 and DN200 pipelines. The results are quite similar with those obtained from physical model experiments. The sweeping velocity of air bubbles in horizontal pipeline increase with the increasing of bubble volume. In addition, the sweeping velocity of air bubbles in a large diameter pipeline is significantly higher than that in a small diameter pipeline. Estimating using the dimensionless bubble volume, the sweeping velocity of air bubbles in the DN200 pipeline is also higher than that in the DN100 pipeline.
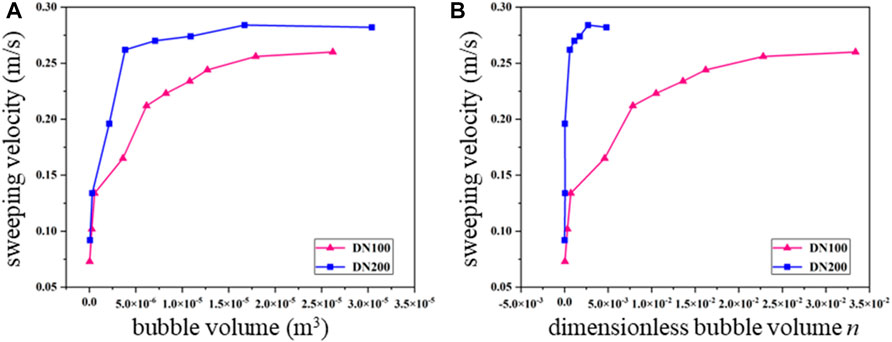
FIGURE 8. Variations of the sweeping velocity of air bubbles to the (A) bubble volume and (B) dimensionless bubble volume obtained from numerical simulation conducted with DN100 and DN200 pipelines.
5 Discussions
The numerical simulation results of the sweeping velocity of air bubbles in horizontal pipelines with different pipe diameters were compared with the results of theoretical calculation proposed in Section 2. Figures 9, 10 show the comparison of the theoretical calculation and numerical simulation results for the sweeping velocity of air bubbles in the DN100 pipeline and DN200 pipeline, respectively.
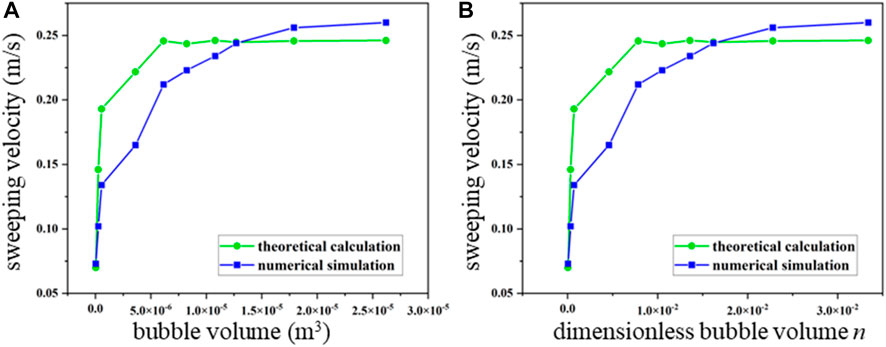
FIGURE 9. Comparison of the sweeping velocity of air bubbles to the (A) bubble volume and (B) dimensionless bubble volume obtained from DN100 horizontal pipelines conducted with theoretical calculation and numerical simulation.
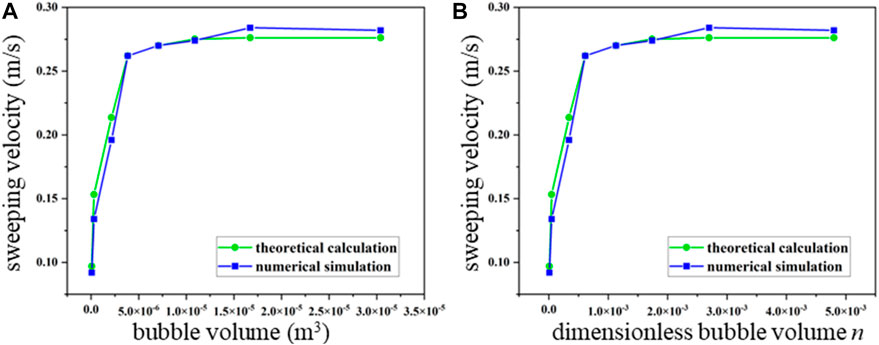
FIGURE 10. Comparison of the sweeping velocity of air bubbles to the (A) bubble volume and (B) dimensionless bubble volume obtained from DN200 horizontal pipelines conducted with theoretical calculation and numerical simulation.
As can be perceived from Figure 9, in the DN100 horizontal pipeline, when the bubble volume is less than 1.25 × 10⁻⁵, the theoretical calculation value is greater than the numerical simulation result. When the bubble volume is greater than 1.25 × 10⁻⁵, the theoretical calculation value is less than the numerical simulation result. When the n is less than 1.5 × 10⁻², the theoretical calculation value is greater than the numerical simulation result. When n is greater than 1.5 × 10⁻², the theoretical calculation values are less than the numerical simulation results. As shown in Figure 10, in the DN200 horizontal pipeline, when the bubble volume is less than 1 × 10⁻⁵, the numerical simulation results of the bubble sweeping velocity fit the theoretical calculation value; when the bubble volume is greater than 1 × 10⁻⁵, the bubble sweeping velocity in the numerical simulation is slightly larger than the theoretical calculation value, and the average error rate is less than 3%; when the n is less than 1.5 × 10⁻³, the numerical simulation results fit the theoretical calculation value; and when the n is greater than 1.5 × 10⁻³, the theoretical calculation value is less than the numerical simulation result.
The formula deduced above was used to calculate the sweeping velocity of the bubbles, which was then compared with the results measured by the physical experiments to verify the reliability of the formula. Figures 11, 12 show the comparison of experimental results and theoretical calculation results for the sweeping velocity of air bubbles in the DN100 pipeline and DN200 pipeline, respectively.
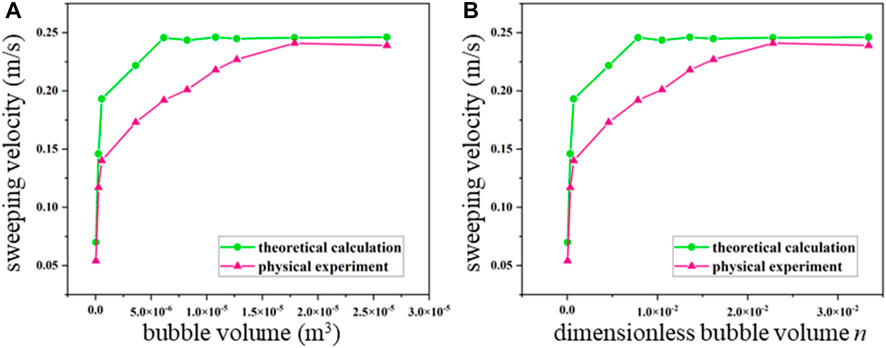
FIGURE 11. Comparison of the sweeping velocity of air bubbles to the (A) bubble volume and (B) dimensionless bubble volume obtained from DN100 horizontal pipelines conducted with physical experiment and theoretical calculation results.
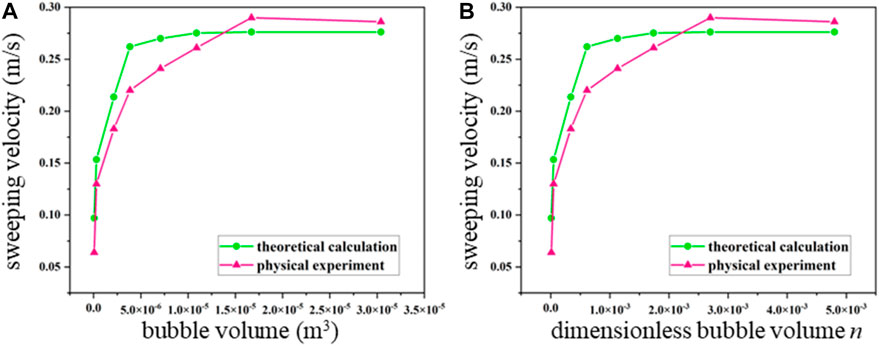
FIGURE 12. Comparison of the sweeping velocity of air bubbles to the (A) bubble volume and (B) dimensionless bubble volume obtained from DN200 horizontal pipelines conducted with physical experiment and theoretical calculation results.
It can be perceived from Figures 11, 12 that in the DN100 horizontal pipeline, when the bubble volume is less than 1 × 10⁻⁵, the experimental result is greater than the theoretical calculation value; when the bubble volume is greater than 1 × 10⁻⁵, the experimental results are in excellent agreement with the theoretical calculation values. When the dimensionless bubble volume n is less than 2 × 10⁻², the experimental results are less than the theoretical calculation value. When n is greater than 2 × 10⁻², the experimental result is in excellent agreement with the numerical simulation results. In the DN200 horizontal pipeline, when the bubble volume is less than 1.25×10⁻⁵, the experimental results are less than the theoretical calculation results. When the bubble volume is greater than 1.25 × 10⁻⁵, the experimental results are greater than the theoretical calculation results. When n is less than 2.2 × 10⁻², the experimental results are greater than the theoretical calculation results; and when n is greater than 2.2 × 10⁻², the experimental results are less than the theoretical calculation results.
The numerical simulation results in horizontal pipelines with different diameters were compared with the bubble sweeping velocity measured by experiments under the same working conditions. Figures 13, 14 show the comparison of physical experiment and numerical simulation results for the sweeping velocity of air bubbles in the DN200 horizontal pipeline, respectively. In the DN100 horizontal pipeline, when the bubble volume is less than 5 × 10⁻⁶, the experimental results are greater than the numerical simulation results; when the bubble volume is greater than 5 × 10⁻⁶, the physical experimental results are less than the numerical simulation results. When n is less than 5 × 10⁻³, the experimental results are greater than the numerical simulation results; and when n is greater than 5 × 10⁻³, the experimental results are less than the numerical simulation results. In the DN200 horizontal pipeline, when the bubble volume is less than 1.25 × 10⁻⁵, the experimental results are less than the numerical simulation results; when the bubble volume is greater than 1.25 × 10⁻⁵, the experimental results are greater than the numerical simulation results. When n is less than 2.3 × 10⁻³, the experimental results are less than the numerical simulation results; and when n is greater than 2.3 × 10⁻³, the experimental results are greater than the numerical simulation results.
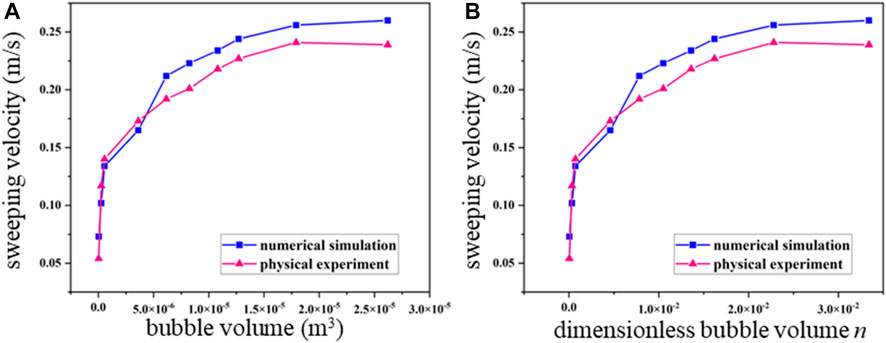
FIGURE 13. Comparison of the sweeping velocity of air bubbles to the (A) bubble volume and (B) dimensionless bubble volume obtained from DN100 horizontal pipelines conducted with physical experiment and numerical simulation results.
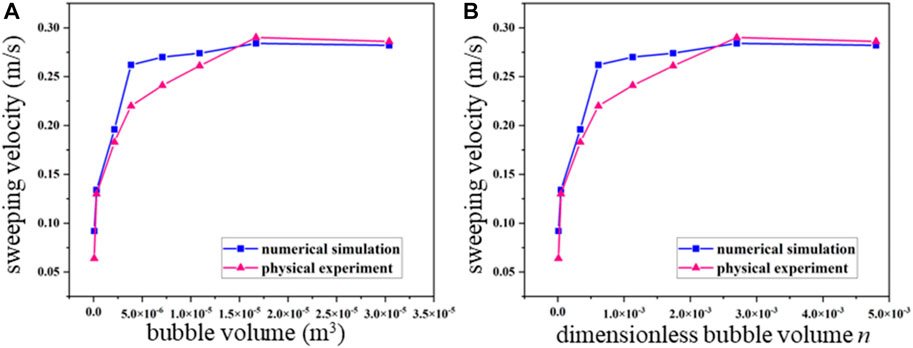
FIGURE 14. Comparison of the sweeping velocity of air bubbles to the (A) bubble volume and (B) dimensionless bubble volume obtained from DN200 horizontal pipelines conducted with physical experiment and numerical simulation results.
In general, the results of the numerical simulations fit well with the results of physical model experiments. The sweeping velocity obtained from the numerical simulations is higher than that of experimental results. In addition, the error of numerical simulation is smaller comparing with that of experiments. In general, the sweeping velocity of bubbles in pipeline increase with the increasing of the diameter of the pipeline and the dimensionless bubble volume. The results confirms the finding of previous studies that the velocity is influenced by these two factors. In addition, by comparing the theoretical results with the experimental and numerical results, the theoretical expression proposed in this study can be validate, which provide a simple way to estimate the sweeping velocity of bubbles in pipeline.
6 Conclusion
This paper gives insights to the sweeping velocity of air bubbles in horizontal pipelines in water supply system. We first analyze the forces act on a single air bubble in a horizontal pipeline, and provide a theoretical expression for calculating the sweeping velocity of the air bubble. Physical model experiments are conducted with different parameters of air bubbles and pipelines. The variations of the sweeping velocity to the bubble volume and dimensionless bubble volume are determined experimentally. We then carry out numerical simulations with the same initial settings as experiments and analyze the flow line, velocity field, as well as the sweeping velocity of the bubbles. The conclusions are as follows:
First, the sweeping velocity of air bubbles in horizontal pipelines obtained from theoretical calculation, simulated simulation, and experiments fit quite well. The results indicate that the sweeping velocity of air bubbles increases with the increase of bubble volume. When the bubble volume is less than 2.8 × 10⁻⁵ the sweeping velocity of air bubbles in the DN100 pipeline varies from 0.05 m/s to 0.23 m/s; when the bubble volume is greater than 1.8 × 10⁻⁵, the sweeping velocity reaches a steady state at 0.23 m/s. When the bubble volume is less than 3.1 × 10⁻⁵, the sweeping velocity of air bubbles in the DN200 pipeline increases from 0.06 m/s to 0.28 m/s; when the bubble volume is greater than 1.7 × 10⁻⁵, the sweeping velocity reaches a steady state at 0.28 m/s.
In addition, the moving process of air bubbles can be divided into four stages: bubble attachment, bubble sweeping, bubble slip, and bubbles breaking away from the wall. When the water velocity is low, the bubbles remain in their original shape under the multiple action of several forces. When the velocity of water increases to reach the sweeping velocity of the air bubble, the bubble shape changes, the bubble deforms significantly, and then splits into two bubbles. The mechanical equilibrium of the bubble is broken, and the bubble enters a sliding state. At this time, the bubble moves close to the up-side wall of the pipeline, and the bubble velocity is lower than water velocity. After a period of time, the bubble may break away from the wall. With the bubble velocity increasing, the bubble is washed out of the observation section by the water flow.
Data availability statement
The original contributions presented in the study are included in the article/supplementary material, further inquiries can be directed to the corresponding author.
Author contributions
Conceptualization, JH, CY, and YZ; methodology, JH, CY, and YZ; writing—original draft, JH and YZ; writing—review and editing, ZM, ML, and JZ; supervision, HS; project administration, HS; funding acquisition, JH. All authors contributed to the article and approved the submitted version.
Funding
This work was supported by the Key Joint Funds of the Zhejiang Provincial Natural Science Foundation of China (No. LZJWZ22E090004).
Acknowledgments
We are very grateful to the reviewers for their constructive comments and suggestions.
Conflict of interest
Author CY was employed by Henan Water and Power Engineering Consulting Co, Ltd.
The remaining authors declare that the research was conducted in the absence of any commercial or financial relationships that could be construed as a potential conflict of interest.
Publisher’s note
All claims expressed in this article are solely those of the authors and do not necessarily represent those of their affiliated organizations, or those of the publisher, the editors and the reviewers. Any product that may be evaluated in this article, or claim that may be made by its manufacturer, is not guaranteed or endorsed by the publisher.
References
Amin, H., and Majid Eshagh, N. (2020). A geometric mass control approach in level set method to simulate multiphase flows with complex interface topologies, case study: Oblique coalescence of gas bubbles in a liquid. P. I. Mech. Eng. E-J. Pro. 234, 56–69. doi:10.1177/0954408919883729
Bak, J., Kim, H., Jeong, J. J., Euh, D., and Yun, B. (2020). Development of bubble size correlation for adiabatic forced convective bubbly flow in low pressure condition using CFD code. Appl. Sci. 10, 5443. doi:10.3390/app10165443
Baranivignesh, P., Harisinh, P., Milinkumar, T. Shah., Vishnu, K. Pareek., Lefebvre, A., and Ranjeet, P. U. (2019). Simultaneous measurements of two phases using an optical probe. ECMF 1, 233–241. doi:10.1007/s42757-019-0025-y
Bendiksen, K. H. (1984). An experimental investigation of the motion of long bubbles in inclined tubes. Int. J. Multiphas Flow. 10, 467–483. doi:10.1016/0301-9322(84)90057-0
Benjamin T, B. (1968). Gravity currents and related phenomena. J. Fluid Mech. 31, 209–248. doi:10.1017/s0022112068000133
Deng, B., Chin, R. J., Tang, Y., Jiang, C., and Sai, H. L. (2019). New approach to predict the motion characteristics of single bubbles in still water. Appl. Sci. 9, 3981. doi:10.3390/app9193981
Escarameia, M., Rwp, M., Burrows, R., and Gahan, C. (2005). Air in pipelines – a literature review. Oxfordshire, BA, UK: HR Wallingford Limited, 15–25.
Ge, W., Jiao, Y., Wu, M., Li, Z., Wang, T., Li, W., et al. (2022). Estimating loss of life caused by dam breaches based on the simulation of floods routing and evacuation potential of population at risk. J. Hydrology 612, 128059. doi:10.1016/j.jhydrol.2022.128059
Ge, W., Qin, Y., Li, Z., Zhang, H., Gao, W., Guo, X., et al. (2020). An innovative methodology for establishing societal life risk criteria for dams: A case study to reservoir dam failure events in China. Int. J. Disaster Risk Reduct. 49, 101663. doi:10.1016/j.ijdrr.2020.101663
Giorgio, B., Pietro, B., Alberto, F., and Fabio, I. (2016). Estimation of bubble size distributions and shapes in two-phase bubble column using image analysis and optical probes. Flow. Meas. Instrum. 52, 190–207. doi:10.1016/j.flowmeasinst.2016.10.008
Himr, D. (2015). Investigation and numerical simulation of a water hammer with column separation. J. Hydra. Eng. 141, 04014080. doi:10.1061/(ASCE)HY.1943-7900.0000967
Jafari, R., and Okutucu-Özyurt, T. (2016). 3D numerical modeling of boiling in a microchannel by arbitrary Lagrangian-Eulerian (ALE) method. Appl. Math. Comput. 272, 593–603. doi:10.1016/j.amc.2015.03.042
Leila, R., Bryan, K., and Ahmad, M. (2016). Encouraging effective air management in water pipelines: A critical review. J. Water Res. Plan. Man. 142, 04016055. doi:10.1061/(ASCE)WR.1943-5452.0000695
Li, Z., Li, W., and Ge, W. (2018). Weight analysis of influencing factors of dam break risk consequences. Nat. Hazards Earth Syst. Sci. 18 (12), 3355–3362. doi:10.5194/nhess-18-3355-2018
Li, Z., Zhang, Y., Wang, J., Ge, W., Li, W., Song, H., et al. (2021). Impact evaluation of geomorphic changes caused by extreme floods on inundation area considering geomorphic variations and land use types. Sci. Total Environ. 754, 142424. doi:10.1016/j.scitotenv.2020.142424
Liu, Y., Zhang, H., Wang, S., and Wang, J. (2008). Gas–liquid interfacial friction factor for the transition from stratified to slug flow. Microgravity Sci. Technol. 20, 299–305. doi:10.1007/s12217-008-9078-4
Liu, T., Merat, A., Makhmalbaf, M. H. M., Claudia, F., and Parviz, M. (2015). Comparison between optical flow and cross-correlation methods for extraction of velocity fields from particle images. Exp. Fluids 56, 166. doi:10.1007/s00348-015-2036-1
Mohammad, A., Morteza, T., and Nowrouz Mohammad, N. (2020). Study of intermittent flow characteristics experimentally and numerically in a horizontal pipeline. J. Nat. Gas. Sci. Eng. 79, 103326. doi:10.1016/j.jngse.2020.103326
Ni, B., Luo, Z., and Zou, Z. (2008). “Thermodynamics analysis on bubble attachment to solid wall in liquid,” in Proceedings of the national symposium on physical chemistry of metallurgy (Guiyang, China), 1–4.
Pothof, I. W. M. (2011). Co-current air-water flow in downward sloping pipes. Enschede, Netherlands: Gildeprint Drukkerijen BV.
Qu, X., Guo, Q., Zhang, Y., Qi, X., and Liu, L. (2020). A new vector-based signal processing method of four-sensor probe for measuring local gas–liquid two-phase flow parameters together with its assessment against one bubbly flow. Appl. Sci. 10, 5463. doi:10.3390/app10165463
Sandsten, J., and Andersson, M. (2012). Volume flow calculations on gas leaks imaged with infrared gas-correlation. Opt. Express 20, 20318–20329. doi:10.1364/OE.20.020318
Santos, F. L. P., Ferreira, V. G., Tomé, M. F., Castelo, A., Mangiavacchi, N., and McKee, S. (2012). A marker-and-cell approach to free surface 2-D multiphase flows. Int. J. Numer. Methods. Fluids 70, 1543–1557. doi:10.1002/fld.3641
Shang, Z., Luo, J., and Li, H. (2017). Simulations of flow transitions in a vertical pipe using coupled level set and VOF method. Int. J. Comp. Meth-Sing 14, 1750013. doi:10.1142/S021987621750013X
Song, Y., Wang, C., and Ning, Z. (2011). Computation of incompressible two-phase flows by using CLSVOF method. Trans. Chin. Soc. Agric. Mach. 42, 26–31. doi:10.3969/j.issn.1000-1298.2011.07.006
Wang, Y., Liu, Z., Chang, Y., Zhao, X., and Guo, Z. (2019). Experimental study of gas-liquid two-phase wavy stratified flow in horizontal pipe at high pressure. Int. J. Heat. Mass Transf. 143, 118537. doi:10.1016/j.ijheatmasstransfer.2019.118537
Wang, T., Li, Z., Ge, W., Zhang, H., Zhang, Y., Sun, H., et al. (2023). Risk consequence assessment of dam breach in cascade reservoirs considering risk transmission and superposition. Energy 265, 126315. doi:10.1016/j.energy.2022.126315
Wang, T., Li, Z., Ge, W., Zhang, Y., Jiao, Y., Sun, H., et al. (2022). Calculation of dam risk probability of cascade reservoirs considering risk transmission and superposition. J. Hydrology 609, 127768. doi:10.1016/j.jhydrol.2022.127768
Wu, M., Wu, Z., Ge, W., Wang, H., Shen, Y., and Jiang, M. (2021). Identification of sensitivity indicators of urban rainstorm flood disasters: A case study in China. J. Hydrology 599, 126393. doi:10.1016/j.jhydrol.2021.126393
Xu, C., Wu, M., Zhou, T., Li, J., Du, W., Zhang, W., et al. (2020). Optical flow-based detection of gas leaks from pipelines using multibeam water column images. Remote Sens. 12, 119. doi:10.3390/rs12010119
Yang, G. Q., Bing, D., and Fan, L. S. (2007). Bubble formation and dynamics in gas–liquid–solid fluidization—a review. Chem. Eng. Sci. 62, 2–27. doi:10.1016/j.ces.2006.08.021
Ye, H., Chen, Y., and Kevin, M. (2020). A discrete-forcing immersed boundary method for moving bodies in air–water two-phase flows. J. Mar. Sci. Eng. 8, 809. doi:10.3390/jmse8100809
Zhai, S., Geng, S., and Jing, M. (2021). Numerical simulation of gas-water two-phase seepage flow based on level set method. IOP Conf. Ser. Earth Environ. Sci. 781, 022041. doi:10.1088/1755-1315/781/2/022041
Zhang, Y., Ge, S., and Ni, J. (2013). Study on dynamic behavior of single bubble in wedge-shaped channel. Chin. J. Hydro. 28, 307–316. doi:10.3969/j.issn1000-4874.2013.03.008
Zhang, L., Li, S., Loáiciga, H. A., Zhuang, Y., and Du, Y. (2015). Opportunities and challenges of interbasin water transfers: A literature review with bibliometric analysis. Scientometrics 105, 279–294. doi:10.1007/s11192-015-1656-9
Keywords: bubble volume, pipe diameter, force analysis, horizontal pipeline, air bubbles, water supply system, sweeping velocity
Citation: Hu J, Yang C, Zhang Y, Song H, Lu M, Meng Z and Zhang J (2023) Effect of bubble volume on the sweeping velocity of air bubbles in horizontal pipelines in water supply system. Front. Earth Sci. 11:1214713. doi: 10.3389/feart.2023.1214713
Received: 30 April 2023; Accepted: 22 May 2023;
Published: 01 June 2023.
Edited by:
Wei Ge, Zhengzhou University, ChinaReviewed by:
Yi Ji, Northeast Agricultural University, ChinaXinzhou Zhang, Nanjing Hydraulic Research Institute, China
Copyright © 2023 Hu, Yang, Zhang, Song, Lu, Meng and Zhang. This is an open-access article distributed under the terms of the Creative Commons Attribution License (CC BY). The use, distribution or reproduction in other forums is permitted, provided the original author(s) and the copyright owner(s) are credited and that the original publication in this journal is cited, in accordance with accepted academic practice. No use, distribution or reproduction is permitted which does not comply with these terms.
*Correspondence: Yuzhou Zhang, emhhbmd5emhAemp3ZXUuZWR1LmNu
 Jianyong Hu
 Chengzhi Yang3
 Yuzhou Zhang
 Zhenzhu Meng
 Jinxin Zhang