 Ashirgul Kozhagulova1,2
 Vadim Yapiyev1,3
 Leila Karabayanova1
 Antoine Dillinger1
 Vyacheslav Zavaley4,5
 Aisulu Kalitova4,5
 Emil Bayramov1John Holbrook6
 Stephen E. Grasby7
 Milovan Fustic1,8*
- 1School of Mining and Geosciences, Nazarbayev University, Astana, Kazakhstan
- 2Oil and Gas Faculty, Atyrau Oil and Gas University, Atyrau, Kazakhstan
- 3The Environment and Resource Efficiency Cluster (EREC), Nazarbayev University, Astana, Kazakhstan
- 4Department of Hydrogeology, Engineering and Oil and Gas Geology, Satbayev University, Almaty, Kazakhstan
- 5Geoterm Production Company LLP, Almaty, Kazakhstan
- 6Department of Geological Sciences, Texas Christian University, Fort Worth, TX, United States
- 7Geological Survey of Canada, Calgary, AB, Canada
- 8Department of Geosciences, University of Calgary, Calgary, AB, Canada
The Zharkent (eastern Ily) Basin is renowned for its low-salinity natural hot springs and geothermal wells, primarily utilized for recreational purposes. Despite the growing commercial interest, the geothermal system in this area is very poorly documented or understood. Accordingly, we conducted a multi-disciplinary study, focusing on the advanced characterization of waters from productive Cretaceous strata, along with the interpretation of geothermal gradients and reservoir recharge in a geological context. Conventional wisdom asserts that Ily is an intracratonic basin characterized by high geothermal heat in its central part and by geothermal aquifers that are rapidly replenished by meteoric water recharge via porous strata exposed on the basin margin. Our results argue for an alternative and expanded interpretation of these systems. Elevated geothermal gradients (with average of up to 40°C/km in the southern part of the basin and locally possibly up to 55°C/km) are likely associated with crustal thinning owing to the development of a pull-apart basin. Anomalously fresh water (<1 g/L) in the deep (up to 2850 m depth) Upper Cretaceous reservoir is charged laterally, predominantly by snowmelt waters from basin bounding mountains. Recharge includes both mountain-front recharge (MFR), where water infiltrates into outcrops of reservoir rock near the mountain fronts, and mountain-block recharge (MBR), characterized by deep groundwater flow through fractured, predominantly rhyolite basement rocks (as evidenced from their solutes in reservoir waters). The combination of elevated geothermal gradients, low salinity water chemistry, and excellent reservoir properties makes the studied reservoir horizon an attractive target for geothermal development. Our results are applicable to other geothermal systems in strike-slip settings across Central Asia, and potentially worldwide.
1 Introduction
New alternative energy resources and methods for enhancing their efficiency are imperative to mitigating the growing dangers from climate change. The global strategy to reduce CO2 emissions includes capture and sequestration of CO2, alongside the development of cleaner energy production options. Geothermal energy production is recognized as a promising alternative source of clean energy, particularly in regions with elevated geothermal gradients, with growth of up to 150 GWe by 2050 predicted (Jolie et al., 2021).
Conventional geothermal resources are found in areas with active magmatism or in warm sedimentary basins (Dipippo, 2016; Jolie et al., 2021). The latter typically exhibit moderately high temperatures (∼150°C–200°C) in basins with extensional or transtensional (i.e. pull apart basins) tectonic conditions, as observed in locations such as Salton Sea and Cerro Prietto in the Gulf of California, USA (Sutrisno et al., 2019). These geothermal fields commonly have highly permeable zones in porous sedimentary strata and/or natural fracture systems (Sutrisno et al., 2019), and they may manifest hot springs or fumaroles on the surface (Jolie et al., 2021). However, there are also blind geothermal resources that lack surface manifestations, such as in the Great Basin, western USA (Faulds et al., 2016).
The Zharkent (eastern Ily) Basin (Figure 1) is known for its natural hot springs, and hosts elevated geothermal gradients (up to 40°C/km; Jóhannesson et al., 2019). During petroleum exploration drilling in the 1950s (Filipyev, 1957; Filipyev and Rabkin, 1959) hot water (wellhead temperature ∼96°C) was discovered from Upper Cretaceous reservoirs at depths of 2682–2730 m. Similarly, the same interval in a recently drilled well (5539; depth of ∼2850 m; Figure 2A; Kalitov, 2016) produces 103°C hot water. The thickness of this highly permeable (up to eight Darcies) and productive water-bearing horizon ranges from ∼30 to 50 m across the basin (Kalitov, 2016). Cretaceous strata mainly comprise conglomerate and sandstone interlayered with minor claystone and siltstone (Figure 2B), both interpreted as fluvial and shoreface deposits of an endorheic system (Dillinger, 2021). Conglomerates comprise extraformational pebbles and gravels bonded by clay-carbonate cement, whereas sandstone is quartz-rich, medium-to coarse-grained, and weakly cemented. The Mesozoic-Cenozoic section is thickest in the central and northeastern parts of the basin (Figure 3).
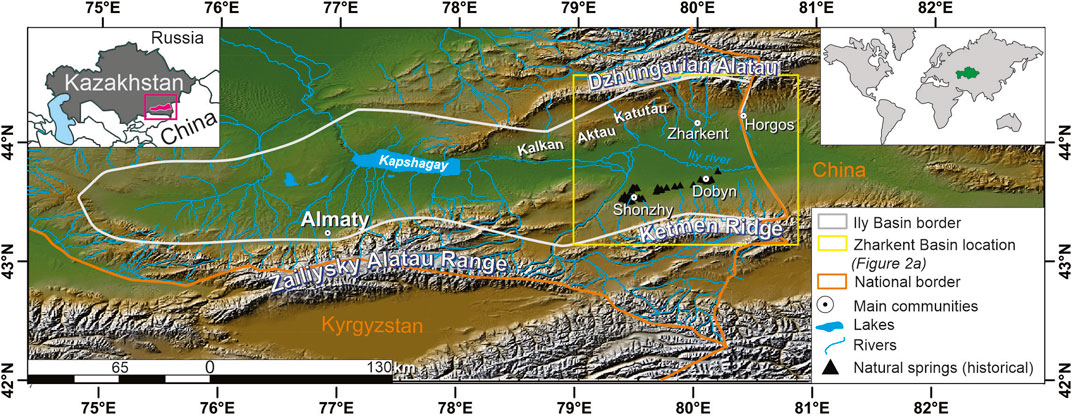
FIGURE 1. Ily Basin overview map made with GeoMapApp (www.geomapapp.org)/CC BY (Ryan et al., 2009) showing the main mountain ranges and ridges (grey colored high relief); intermountain depressions (brown and green), and drainage system. Juxtaposed are locations of main communities and natural thermal springs (historical) in the Zharkent area. Inset on the left-side shows the location of Ily Basin (magenta rectangular) within Kazakhstan, and the inset on the right-side shows the location of Kazakhstan on the world map. The yellow rectangle shows the location of Figure 2A.
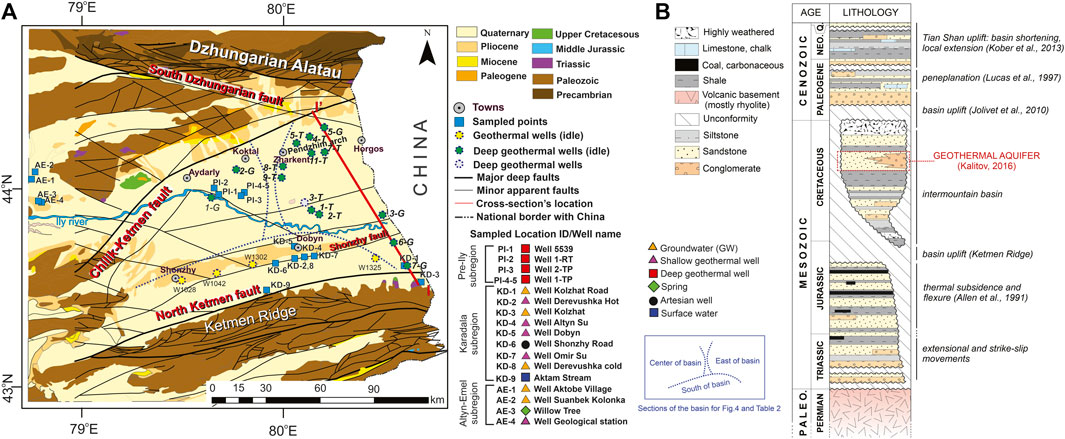
FIGURE 2. (A) Geological map of Zharkent Basin (digitized “Geological map of Kazakh SSR,” 1979) with juxtaposed locations of geothermal wells, main towns, and major faults (Line I–I′ represents the cross-section depicted in Figure 3); Note: elongated Pliocene exposures between Shonzhy and Dobyn are attributed to inferred south-dipping reverse Shonzhy fault(s) (Grützner et al., 2019); (B) Simplified Permian-to-Quaternary litho-stratigraphy along with major tectonic phases. For thickness and depths please see Figure 3.
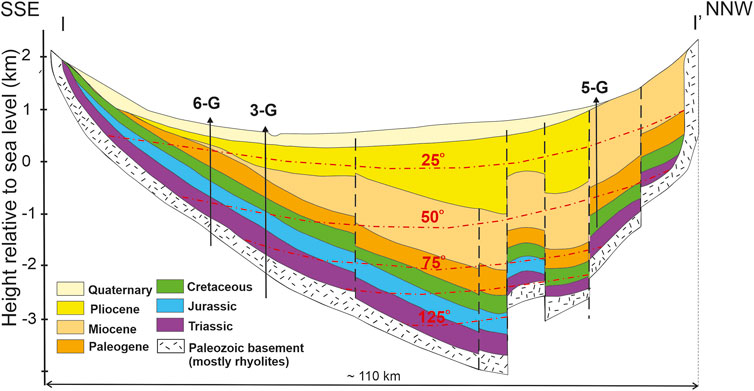
FIGURE 3. Geological cross-section I–I′ through the Zharkent Basin (please see location in Figure 2A) depicting the major stratigraphic subdivisions, inferred faults, and estimated isotherms (red dashed lines labeled 25°, 50°, 75°, 100°, and 125°C; modified after Kalitov et al., 2016). Note 1: The extent (preservation) of Triassic and Jurassic strata in other parts of the basin is limited, resulting in direct contact of Cretaceous and Cenozoic rocks with Paleozoic volcanics (Dillinger, 2021). Note 2: The shape of the basin resembles an intracratonic sag, (see Lucas et al., 1997). The limited number of faults expected in sag basins is in line with Middleton (1989); however, previous authors did not interpret faults in the context of modern plate tectonic terminology. Furthermore, locations of most faults in the basin are inferred to explain differences in depths and/or stratigraphic thicknesses between sparsely drilled well locations. The potential role of basin-bounding mountains (Figures 1, 2A) on basin formation and intra-basinal faults was also not considered in the inference of faults. This study attempts to address the above gaps.
Based on observed geothermal shows and gradients, the Zharkent Basin is identified as a promising candidate for geothermal energy production (Boguslavsky et al., 1999; Jóhannesson et al., 2019). However, these authors have not documented the subsurface geological conditions adequately to develop a geothermal play-type model that explains the origin and magnitude of the thermal resource. Moreover, recent studies by Campbell et al. (2013), Mackenzie et al. (2018), Grützner et al. (2019), and Wu et al. (2021) reveal the existence of strike-slip faults that are not included in the existing basin models, despite their crucial control on geothermal resources (Sutrisno et al., 2019).
Tectonic and sedimentary features observed in basin bounding mountains and ridges (Figure 1) are linked to sedimentation in the adjacent basin (details in Section 2.1; Huang et al., 2018; Wang et al., 2006; Kober et al., 2013; Macaulay et al., 2014; Sobel et al., 2006; Burtman, 2012; Han et al., 2004; Verestek et al., 2018; Grützner et al., 2019; Frisch et al., 2019; Hellwig et al., 2017; Lucas et al., 2000; Voigt et al., 2017). However, geothermal development is hampered by a lack of constraint on tectonic processes occurring within the basin (beneath the present-day sedimentary cover; Figures 1–3) and their potential role in: i) forming and shaping accommodation for sediments; ii) controlling the increased geothermal gradients documented by various researchers e.g. Boguslavsky et al. (1999) and Jóhannesson et al. (2019); and iii) influencing fluid flow in the basin. Additionally, structural styles described in mountains and ridges (summarized in Section 2.1) are challenging to reconcile with generalized and widely accepted basin models generated from a correlation between sparcely drilled wells (Figure 3; Kalitov, 2016), and a need for developing more modern basin tectono-stratigraphic models that integrate a wider range of data types.
The present study integrates data from geochemical, geophysical, and stratigraphic sources to present an integrated tectono-stratigraphic model for the Upper Cretaceous Zharkent geothermal trend. We utilize new hydrogeochemistry and stable water isotope results from 18 samples taken from a range of localities across the basin to gain a better understanding of the Zharkent Basin geothermal system. Furthermore, numerous previously published subsurface temperature, water chemistry data, stratigraphy, geological cross-sections and maps, gravimetry surveys, as well as recent works on the regional structural setting, have been reprocessed. Data including temperature profiles, water chemistry, stable water isotopes, tectonic history, and stratigraphy were integrated to generate a comprehensive conceptual basin model for a sediment-hosted geothermal system.
2 Geological settings
2.1 Tectono-stratigraphic framework and basin evolution
The Zharkent Basin is bordered by the Kalkan, Katutau, and Dzhungarian Alatau mountains to the north; the Ketmen Ridge to the south; and transitions to the Almaty Basin to the west (Figure 1). To the east, it extends into China as the Yili Basin (Wang et al., 2006; Huang et al., 2018). The central part of the Zharkent Basin is mainly covered by Quaternary sediments, while older Cenozoic and Mesozoic sediments crop out along the basin’s periphery (Figures 2A, 3). The sedimentary succession non-conformably overlies an extensive upper Paleozoic volcanic series characterized by an abundance of rhyolites (Mukhamedzhanov, 1989; Figure 2B). This volcanic series also largely constitutes the Dzhungarian Alatau Mountains and Ketmen Ridge on the northern and southern parts of the basin, respectively (Figure 2A).
Sedimentation in the Zharkent Basin commenced in the Middle Triassic in response to local subsidence and associated formation of an intermontane depression (Daukeev et al., 2002). Triassic to recent basin fill comprises sandstone, conglomerate, as well as lacustrine mudstones derived from locally sourced siliciclastics (Figure 2B). Extensional and/or strike-slip fault displacement in the Middle-Late Triassic, subsequent thermal subsidence and downward flexure, and a warm, humid climate in the Early Jurassic, triggered the accumulation of thick Lower Jurassic coals within otherwise clay-rich siliciclastic successions (Allen et al., 1991).
In the Late Jurassic, basin uplift associated with the development of the Ketmen Ridge (Figure 1) to the south led to local erosion of older Mesozoic deposits. Sedimentation resumed in the Early Cretaceous across much of the broader intermontane Ily Basin, including the Zharkent Basin, with sediments mostly sourced from the uplifted Ketmen Ridge to the south and the emerging Dzhungarian Alatau Mountains to the north (Figure 2B). Thermal history modeling and fission track analysis demonstrate a phase of uplift and erosion over the Chinese part of the Ketmen Ridge and Dzhungarian Alatau Mountains in the Late Cretaceous–early Paleogene time that likely affected deposition in the Ily Basin (Jolivet et al., 2010). This phase was followed by tectonic quiescence towards the middle of the Paleogene, and the Zharkent Basin became a peneplained intracratonic sag that filled with thick paleosol successions (Lucas et al., 1997).
From the Oligocene through the early Miocene, sedimentation was largely controlled by compression and left-lateral shear in response to the uplift of the Tien Shan Mountains to the south of the basin that was triggered by the collision between India and Asia (Sobel et al., 2006; Kober et al., 2013; Macaulay et al., 2014). Tectonic strain chiefly manifests as a succession of E-W-striking faults producing uplifts from basement-cored anticlines (Kober et al., 2013) and basin bounding thrust faults (flower structures), resulting in N-S shortening and basin closure in the middle-late Miocene (Han et al., 2004; Burtman, 2012; Verestek et al., 2018). Contemporaneous phases of extension in response to strike-slip displacement in a transfer zone also linked two slightly diverging thrusts in the Katutau region (Figure 1; Kober et al., 2013).
Continued NNW-directed compression led to folding, thrusting, and uplifting in the west-east oriented Kalkan and Aktau mountains from the late Miocene to the Pleistocene (Figure 1; Kober et al., 2013). More recently, Grützner et al. (2019) highlighted the importance of displacement on left-lateral strike-slip faults in the Ily basin-bounding mountain ranges, and right-lateral oblique thrust faults in the basin interior for accommodating regional N-S shortening and large-scale NE-SW shear. Throughout the Cenozoic, the central basin was filled with alluvial-lacustrine and fluvial deposits, and coarse alluvial-fan deposits and paleosols formed at the margins in dominantly hot and arid conditions (Lucas et al., 2000; Hellwig et al., 2017; Voigt et al., 2017; Frisch et al., 2019).
2.2 Hydrogeological background
The Zharkent Basin aquifers include Neogene, Paleogene, Cretaceous, Jurassic, and Triassic rocks (Figures 2A, 3; Kalitov, 2016); however, the geothermal water is thus far produced only from the Upper Cretaceous aquifer. Paleozoic formations mostly comprise porphyritic rhyolites (Figures 2A,B) (Akchulakov, 2012; Kalitov, 2016), and have been tested in some wells. Because of low flowrates (<0.3 L/s), Paleozoic rocks are considered non-productive (Table 1). Water data from both Jurassic and Triassic formations are highly variable both in terms of flow rates (from nil to about 55 L/s) and salinity (from <1 g/L to up to 15.2 g/L; Table 1; Kalitov, 2016). The tested Miocene and Pliocene formations also had low flowrates (<2 L/s). Furthermore, their high Total Dissolved Solids (TDS) content (up to 22 g/L) makes them unfavorable for geothermal water production. Waters are produced from Paleogene aquifers at both low and highly varying flowrates (ranging from 6 L/s in the basin center to 0.01 L/s in the northern part of the basin), which implies that the Paleogene layers are either not extensive or that permeability decreases northward (Mukhamedzhanov, 1989).
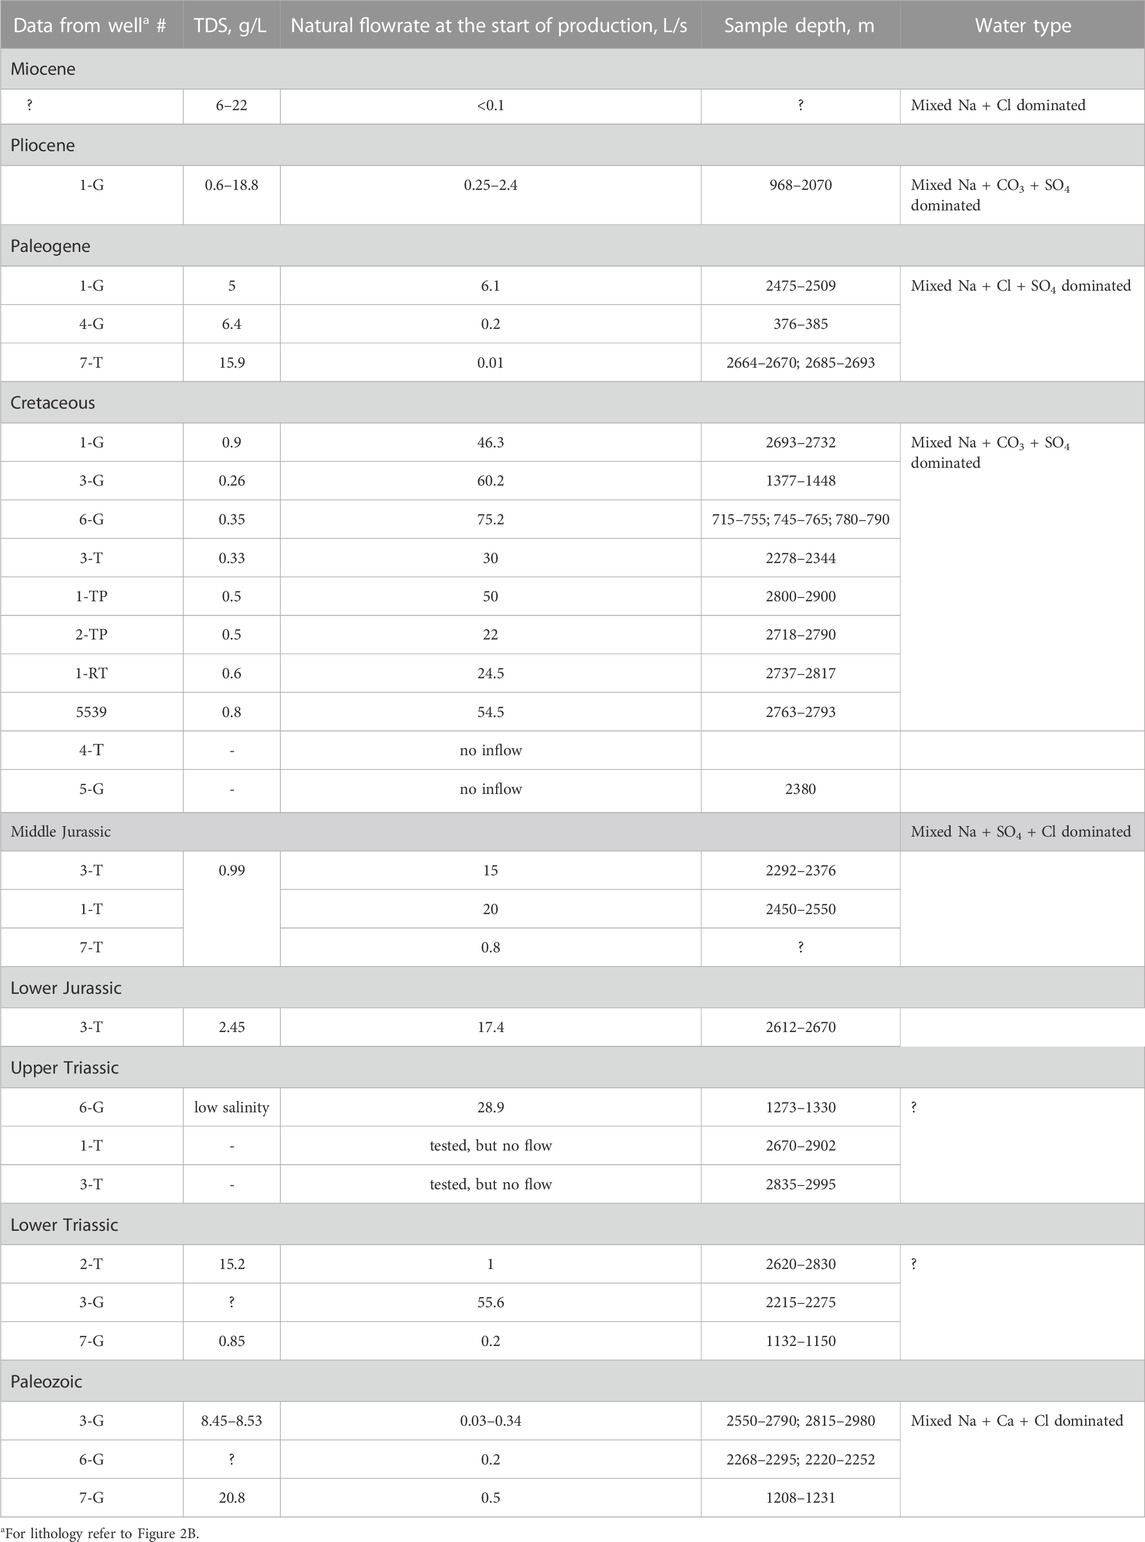
TABLE 1. Summary of water properties (historical data after Kalitov, 2016)a.
Produced geothermal water is characterized by low TDS values (less than 1 g/L), initial natural flowrates of up to 75.2 L/s, and wellhead measured water temperature as high as 96°C–102°C (Kalitov, 2016). Geothermal water has a narrow range (0.3–0.9 g/L; Table 1) of salinity variation across the basin, but natural flowrates vary up to a factor of three, and no flow is reported from well testing for the wells located in the north part of the basin.
3 Data and methods
3.1 Geothermal gradient calculations and mapping
Depth-temperature profiles were based on the temperature measurements collected directly from the geochemical sampling points as well as published temperature data (Table 2; Figure 2; Kalitov, 2016; Mukhamedzhanov, 1989). Water temperature was measured at a tap-off of the well with a portable thermometer. Inputs for calculating geothermal gradients included the measured water temperatures
where j=1,2,.,N; N is the count of input points; λj represents the coefficients from the solution of linear equations; rj is the distance from point (x,y) to the jth point; and T (x,y) and R(r) are defined as per the selected option. Moreover, to minimize extrapolation artifacts, the extent of the map is restricted to areas with reasonable well and data coverage. Generated isolines were then manually locally adjusted to account for known geologic features (i.e. the Shonzhy fault). The software-generated geothermal gradients’ divisions remained unchanged but redistributed in the NEE direction along the Shonzhy fault (c.f. Mukhamedzhanov, 1989).
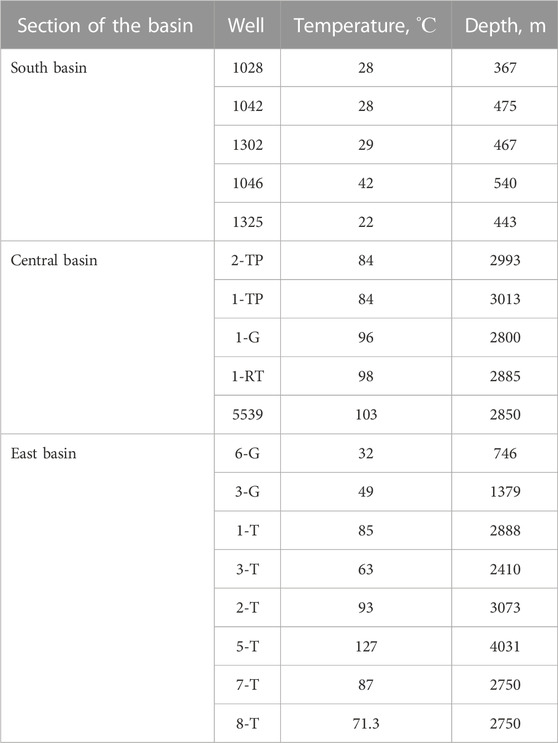
TABLE 2. Data on bottomhole temperatures vs. depths in Upper Cretaceous formations grouped in three main sections: South, Central, and East. For lithology, please refer to Figure 2B.
3.2 Hydrogeochemistry sampling and analysis
Water samples were collected during field campaigns in May-June 2021 and May-June 2022. The sampling period was constrained by weather conditions (cold and arid climate) and the associated accessibility of remote sites. The samples included water from well-heads of four deep (>2.5 km deep) geothermal wells (PI-1–4), five shallow (600–700 m deep) geothermal wells (AE-4, KD-2, KD-4, KD-5, and KD-7), four shallow (∼200 m deep) groundwater wells (AE-1, AE-2, KD-1, KD-3, and KD-8), as well as one spring (AE-3) and one artesian warm well (KD-6) (Figure 2; Table 3). We also collected one streamwater sample (KD-9) in Karadala region (Table 3; Figure 2). All deep and shallow geothermal wells produce hot water from the Upper Cretaceous aquifer(s). The depth difference is because strata are tilted toward the basin axis (Figure 3). The samples PI-4 and PI-5 (collected in 2021 and 2022 respectively, Supplementary Table S2) are sourced from the same well (1-TP at 2830 m) depth. For easier spatial referencing, sample identification numbers (ID’s) are assigned based on geographic sub-regions and distinguished in Table 3 as AE for Altyn-Emel sub-region, KD for Karadala sub-region, and PI for the deep geothermal in Pre-Ily region.
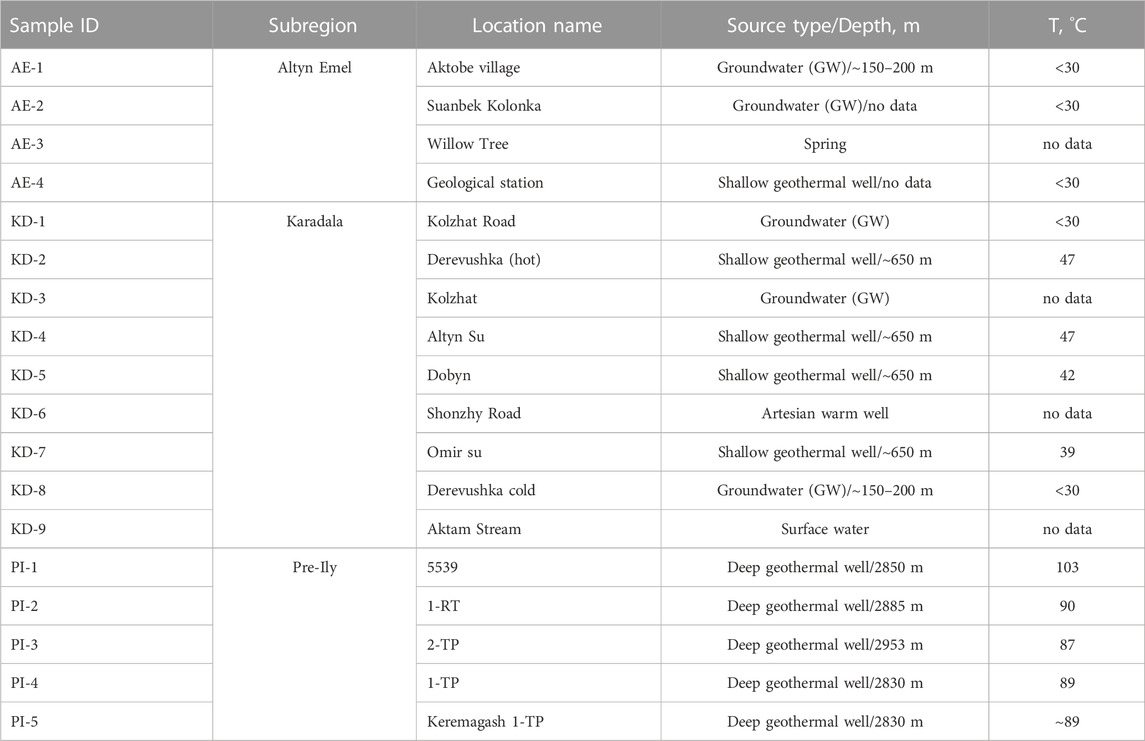
TABLE 3. Water sample locations including measured temperatures. Note: cold water refers to temperature of 30°C and less.
All samples were collected in 250 mL HDPE bottles. The bottles were sealed with scotch tape or parafilm M (Bemis Company, USA, Part no. PM-992) to prevent evaporation. The pH and electrical conductivity (EC) were measured by a multiparameter benchtop meter (inoLab Multi 9310 IDS with conductivity cell and pH electrode). TDS was determined by measuring EC and multiplying by a coefficient (0.55 for low salinity samples and 0.64 for the brackish sample (after Hubert and Wolkersdorfer, 2015) (AE-4; Table 3). The conductivity over the sum of major ions method is used because of missing carbonates content data (not measured) in some of the samples. Before analysis, the samples were filtered using standard 0.45 µm PTFE syringe filters. The major cations (Ca, Mg, Na, K), trace elements (Fe, Al, Fi, Zn, Cu, Mn, B, Ba, Sn, Sr, Cd, Co, Ni, Sb, Se, As, Pb) and silicon (Si) analysis was performed on ICP-OES (Thermo Fisher Icap 6300 DUO) with the samples spiked with nitric acid beforehand (analytical grade). The anions (Cl, SO4, and NO3) were determined by ion chromatography (Dionex ICS 6000 and Metrohm 930 Compact IC Flex) at Nazarbayev University Core Facilities. The bicarbonate ions (HCO3) were measured by titration with hydrochloric acid 0.1 mol/L with methyl red/bromcresol and phenolphthalein indicators (ISO 9963–1:1994) by a third-party laboratory. The sum of (major) ions was calculated by summing concentrations of Ca, Mg, Na, K, HCO3, Cl, SO4, and NO3 ions. In case of the absence of EC measurements, the sum of ions was also used as a TDS estimate. Silicon measurements were converted to SiO2 by dividing the concentration Si by 0.4674. Piper and mixing diagrams are constructed in Geochemist Workbench Community Edition (version 16). The trace-element compositions are presented in Supplementary Table S2.
Stable water isotope analyses were conducted on a Liquid Water Isotope analyzer (Los Gatos Research, model IWA-912) at Nazarbayev University. The samples were normalized to Vienna Standard Mean Ocean Water (VSMOW2) and Standard Light Antarctic Precipitation (SLAP2) scales, and are reported in parts per thousand (‰ or permille) (Kendall and Doctor, 2003). The analysis was conducted with two to three replicate runs to obtain reproducible results with seven measured injections using primary and secondary standards with bracketing normalization. Measurement uncertainties are ≤±0.8‰ for δ2H and ± 0.2‰ for δ18O. We also calculated the deuterium-excess:
Additionally, monthly stable water isotope data for precipitation were downloaded from waterisotopes.org (Bowen, 2022) for Ketmen Ridge (latitude 43.3109°, longitude 80.0983°, altitude 2000 m) and Dzhungar Alatau (latitude 44.5531°, longitude 79.9013°, altitude 2000 m) to distinguish the relative contribution of cold (October to March) vs. warm (April to September) seasonal precipitation to recharge. The mean values for both oxygen and hydrogen of arithmetic averages for cold and warm seasons were used for both mountain ranges.
4 Results and interpretation
4.1 Depth-temperature profiles (geothermal gradients) and map
4.1.1 Results
Geothermal gradients are in the range of 21.1°C–30.3°C/km (East of basin), 25.1°C–32.9°C/km (Center of basin), and 27.3°C–53.5°C/km (South of basin) (Figure 4). The geothermal gradient distribution is also highly variable locally across the basin with a strong positive anomaly (40°C–60°C/km) near the towns of Dobyn and Shonzhy (Figure 5). The geothermal gradients are moderately elevated (∼29.8°C/km) in the central part of the basin where wells are currently producing geothermal waters for balneology purposes at sanatorium Keremagash (well 1-TP), and greenhouse and fish-farming (wells 5539, 1-RT, 2-TP; Figures 2, 5). Data from wells 3-G and 6-G support slightly lower geothermal gradients in the eastern part of the basin is indicated by.
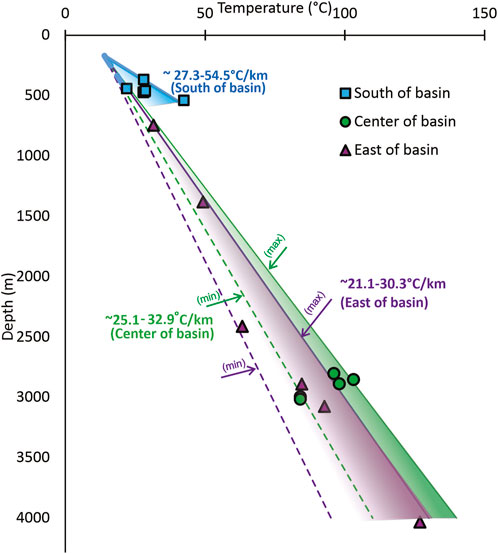
FIGURE 4. Average depth-temperature profiles and geothermal gradients of the South, Central, and East parts of the Zharkent Basin (Table 2; Figure 2A), calculated based on data from 18 wells shown in Figure 2A.
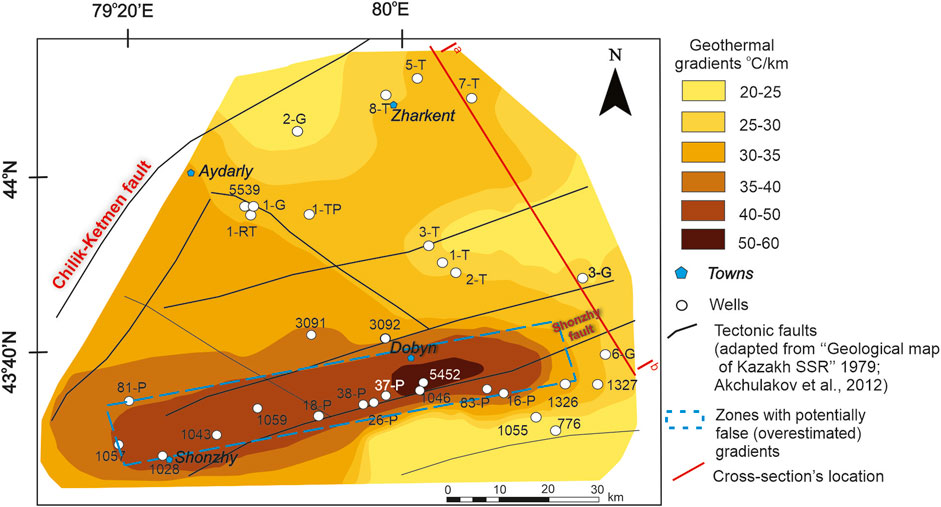
FIGURE 5. Geothermal gradient distribution with juxtaposed locations of main communities, geothermal wells and major faults. Cross-section Ia-Ib (a part of I-I′ in Figure 2A) is generated based on the data summarized in Supplementary Table S1. To minimize extrapolation artifacts, the extent of the map is restricted to areas with reasonable well and data coverage. Generated isolines were then manually adjusted locally to account for known geologic features (i.e. the Shonzhy fault). The software-generated geothermal gradient divisions remained unchanged but redistributed in NEE direction along the Shonzhy fault (c.f. Mukhamedzhanov, 1989). Note: Rectangle (blue dashed lines) indicates the area with high temperature anomaly of enigmatic origin. Scenarios proposed in this study include: i) localized gradient anomolies crustal thinning underneath a poorly defined tectonic block or structural element such as step over or relay ramp; and/or ii) false temperature gradients caused by upward flow of hot water, along faults and/or fractures, from deeper seated aquifers.
4.1.2 Interpretation
The observed variations in geothermal gradient (Figures 4, 5) are consistent with abrupt variations in crustal thickness and/or localized vertical flow of heated water along faults and fracture systems. Prior interpretations alternatively did not capture this high variability, and argued for linear alike depth-temperature gradients within a relatively uniform intracratonic sag basin (Figure 3). Potential evidence for this variability includes temperature anomalies along the Shonzhy fault trend between the towns of Shonzhy and Dobyn (Figure 5). The displacement geometry of the Shonzhy fault (Figure 3) is debatable. Most maps show it as a normal fault with the formation of an inferred graben on the South side (Figures 2, 3). However, Grützner et al. (2019) have classified the Shonzhy as an active south-dipping reverse fault characterized by about 20 m of recent vertical displacement, and an unknown amount of lateral displacement (Figure 9C in Grützner et al., 2019). The overall context of Grützner et al. (2019) thrust and strike-slip faults in the Ily Basin, argues the term “south dipping reverse fault”, and imply the fault is a part of a steeply dipping flower structured thrust fault system, where some faults are reactivated as reverse faults by compression. Yet another possibility is that the Shonzhy fault is a more discrete strike-slip fault oriented parallel to those documented in the mountains to the south and the north (Figure 2). Its location >20 km north of the North Ketmen Fault (Figure 2), and thick sedimentary cover south of it (Grützner et al., 2019), suggests possible subsidence caused by strike-slip transtentional forces, genetically related to transpression that contributed to flanking mountains, which would also result in an array of en echelon faults and together create a network of grabens, step overs, and/or relay ramps that formed pull-apart depressions (Faulds and Hinz, 2015).
The proximity of the temperature anomaly to the Shonzy fault (Figure 5) argues for a genetic relationship between the two. Potential scenarios include:
i) The normal-fault scenario inferred from Kalitov 2016 (Figure 3) implies extensional stresses generating a graben or similar depression from crustal stretching, which further implies local crustal thinning. This would force higher temperature gradients beneath the tectonically stretched block (graben). Similarly, a pull-apart depression caused by transtensional forces would cause similar crustal thinning and an analogous temperature anomaly.
ii) The flower structure scenario implies that the Pliocene exposure north of the Shonzhy fault (characterized by the absence of Quaternary sediments due to erosion or depositional hiatus (Figure 2A), is a thrust sheet which is uplifted more than the overlying thrust sheet south of the Shonzhy fault. In this context, the depressed tectonic block south of the Shonzhy fault is a localized piggyback basin. This scenario does not produce crustal thinning and thus cannot account directly for increased temperature gradient (Figures 4, 5). Increased temperature gradients instead would reflect localized and preferential fluid movement along this fault-fracture system.
Either of the above scenarios implies extensive networks of faulting and fracturing which would promote upward migration of deeper sourced hot water and its potential accumulation in highly permeable Upper Cretaceous strata in the Shonzhy-Dobyn area. This would imply that although temperature measurements are correct, the anomaly shown on the map (Figure 5) does not represent the actual gradient and is overestimated. Additional structural information coupled with geothermometry (sensu Ferguson et al., 2009) is needed to prove or rule out this scenario. Similar water chemistry of Upper Cretaceous aquifers across the basin argues against challenges to the mixing of their waters with deeper sourced brines, the evidence of thermal springs along the fault line (Figure 1) suggests that the Shonzhy fault(s) might be at least locally open to the surface. Importantly, the localized nature of Shonzhy–Dobyn anomaly suggests the potential presence of more, still undiscovered anomalies in the basin. Section 5.1 provides a detailed review and supporting evidence for intra-basinal strike-slip tectonic setting including the formation of a transtentional pull-apart basin and associated crustal thinning, faults, and fractures.
4.2 Hydrogeochemistry and stable water isotopes
Chemical and stable water isotope analyses (n=18) include samples from shallow groundwater (n=5), a natural spring (n=1), an artesian well (n=1), surface water (n=1), geothermal wells (with depth down to 650 m, n=5), and deep geothermal wells (with the depth of about 2800–3000 m, n=5) (Figures 6–8 and Tables 3, 4; see also Supplementary Table S2 for the trace elements concentrations). All waters collected from deep and shallow geothermal wells (Table 3) sample the Upper Cretaceous aquifer only, while samples from groundwater wells and Willow Tree spring (AE-3) are from undefined shallower Cenozoic strata.
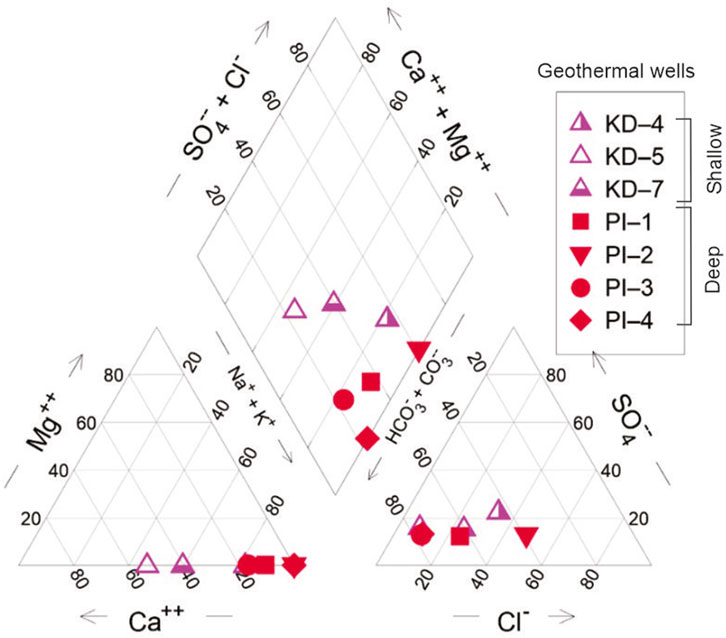
FIGURE 6. Piper diagram showing measured anion-cation ratios in samples collected from geothermal wells (Tables 3 and 4; Figure 2). Note: The data is limited to only seven samples out of 18, due to missing HCO3 and/or below detection limit of Mg data in remaining samples.
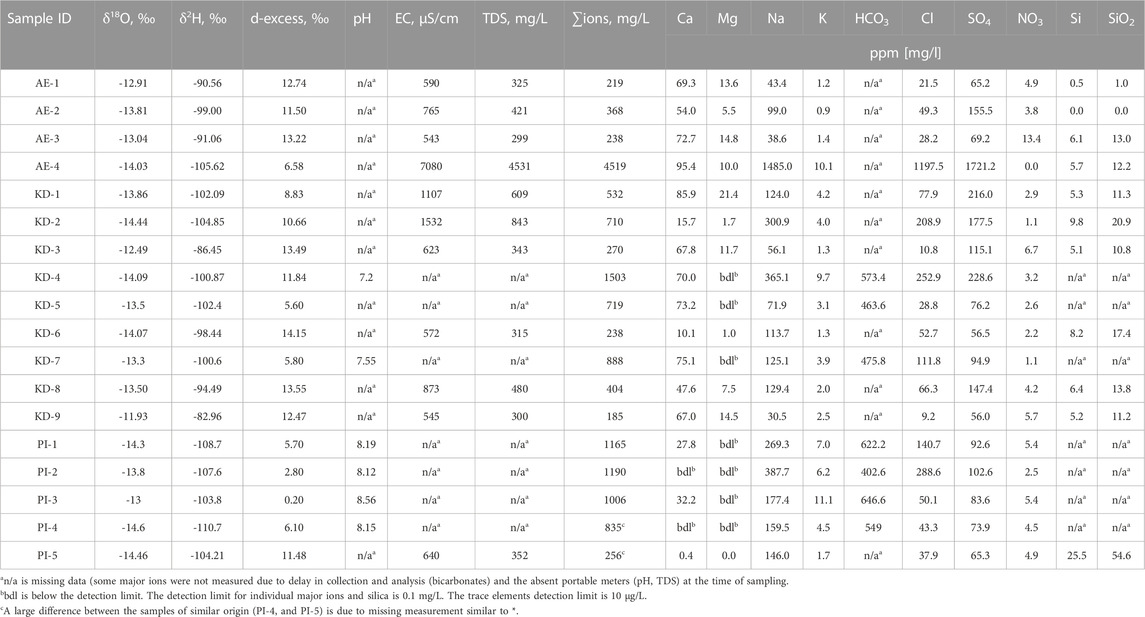
TABLE 4. The results of chemical and stable water isotope analyses.
4.2.1 Hydrogeochemistry
4.2.1.1 Results
The sum of major ions ranges from 185 to 4519 mg/L (average 847 mg/L) showing an overall low dissolved solids content (generally <1 g/L, Table 4). The highest TDS value (4531 mg/L) was measured in the warm geothermal well in Altyn Emel Park (AE-4, Table 4). Chemical analysis shows formation waters from deep geothermal wells (PI-1, PI-3, PI-4) predominantly belong to Na-HCO3 type and water from shallow geothermal wells (KD-5 and KD-7) primarily belong to Ca-Na-HCO3 type. A shallow (KD-4) and a deep (PI-2; well 1-RT) sample are characterized by Na-Cl type water (Figure 6; Table 2), with sum of ions of 1.5 and 1.2 g/L, respectively. Overall, the order of dominance (for absolute concentrations) for all samples for anions is HCO3 > Cl ≥SO4, and for cations is Na > Ca >> Mg >> K (Table 4). SiO2 concentrations range from 1 to 54.6 mg/L (Table 4) and are the highest in the deep geothermal well (sample PI-5; well 1-TP), which is also characterized by low salinity (circa 300 mg/L without HCO3). Sample PI-4 (well 1-TP) was sourced from the same depth interval (2830 m) 1 year apart, and has TDS of about 800 mg/L. PI-4 has a similar major ion speciation as PI-5 (Table 4), but silica was not measured in this sample.
4.2.1.2 Interpretation
The mixing diagrams of Na-normalized ratios of dissolved Ca, Mg, and HCO3 (Figure 7) show evidence of water-rock interaction. The natural spring (AE-3), the stream water (KD-9), several shallow groundwater wells (AE-1, KD-1, KD-3), and shallow geothermal wells (KD-5, KD-7) are characterized by Ca/Na ratios ranging from 0.69 to 1.83, pointing to silicates as the main source of dissolved ions in waters with salinity <1 g/L (Figure 7; Table 4). In contrast, two shallow groundwater wells (AE-2, KD-8), a shallow geothermal (KD-4) and a deep geothermal well 5539 (sample PI-1) have Ca/Na ratios ranging from 0.12 to 0.63 (Figure 7), which is close to the evaporate end member. Depleted Ca, Mg, and HCO3 relative to Na (Figure 7) in samples KD-4 and PI-2 (well 1-RT) are indicative of chemistry influenced by evaporite dissolution. This is corroborated by very low Mg content (<10 mg/L) in all analyzed shallow and deep geothermal wells (Table 4) compared to groundwater samples which consistently contain >10 mg/L of Mg. These magnesium ranges suggest that shallow groundwaters (AE-2, KD-8) are likely affected by evapo-concentration sourced from the surface, while deeper geothermal wells (KD-4, PI-1) derive salts most likely from the dissolution of secondary evaporites buried in the overlaying Cenozoic formations of Zharkent depression (sensu Hellwig et al., 2017).
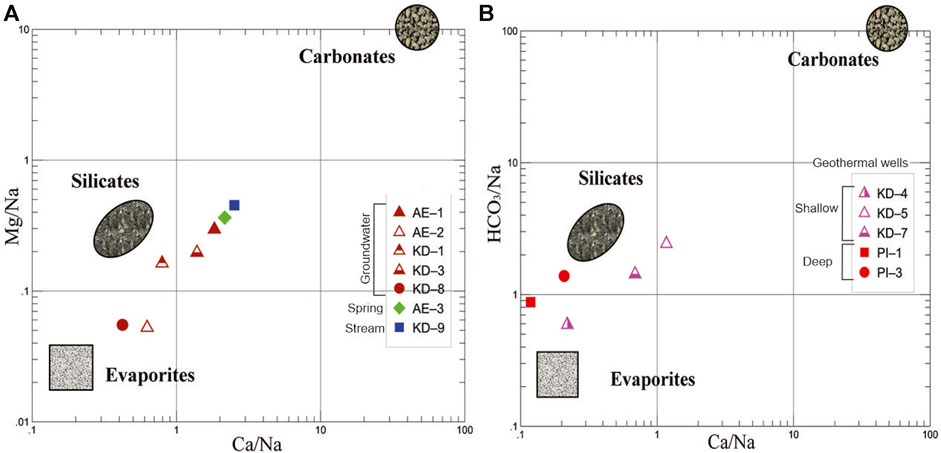
FIGURE 7. Mixing diagrams of Na-normalized log-scaled molar ratios (A) Ca/Na versus Mg/Na for stream water, a spring, and shallow GW wells, (B) Ca/Na versus HCO3/Na for sampled deep and shallow geothermal wells (Upper Cretaceous Aquifer). The color code for deep and shallow geothermal as well as shallow groundwater samples is the same as in Figure 8. The end members of carbonates, silicate and evaporate are from Gaillardet et al. (1999). The values are in mmol/L. The diagrams are limited to the samples with a full suite of measured available anions and cations (ratios).
The main dissolved silicate mineral is probably sodium feldspar (albite, NaAlSi3O8), which is present both in the mountain block (rhyolites) and rock fragments included in sandstone of the Upper Cretaceous aquifer (unpublished BSc report, Umralin, 2022). The anomalously high concentration of silica in a deep well (sample PI-5/well 1-TP) strongly suggests interdependence of burial temperatures and enhanced silica dissolution in the deep subsurface.
Two geothermal wells (AE-4, PI-5) and a warm artesian well (KD-6; Supplementary Table S2) have elevated (exceeding World Health Organization (WHO) threshold of 10 μg/L) concentrations of arsenic (As), with the highest recorded level of almost 60 μg/L (well TP-1, sample PI-5; Supplementary Table S2). Three shallow groundwater wells (AE-2, KD-1, KD-3), the stream water (KD-9), and a deep geothermal well sample have Pb concentrations over 10 μg/L (WHO threshold). Further interpretation of these findings within the drinking water standards is beyond the scope of this study; however, these should be carefully considered in future studies and are therefore included informationally in the Supplemental Material (Supplementary Table S2).
4.2.2 Stable water isotopes
4.2.2.1 Results
The mean values of stable water isotopes of all samples are -99.9‰ ± 7.61‰ for δ2H and -13.7‰ ± 0.76‰ for δ18O (Figure 8; Table 4). The mean d-excess is 9.52‰ ± 4.21‰, which is close to that of global precipitation (10‰) and almost identical to the reported intercept of the Local Meteoric Water Line (LMWL of 9.4‰; Figure 8). The deep geothermal wells (n=6) have lower isotope values of -106.56‰ ± 2.85‰ δ2H and 14.17‰ ± 0.67‰ for δ18O compared to the other water sources (Figure 8; Table 4). The isotope composition of shallower geothermal water (n=5) is -102.87‰ ± 2.28‰ for δ2H and -13.87‰ ± 0.46‰ for δ18O. The surface water sample has values of δ2H = -82.96‰, δ18O = -11.94‰ (Figure 8; Table 4). The shallow groundwater samples (n=6) are slightly more enriched than geothermal water samples for δ2H (-94.52‰ ± 6.29‰) and for δ18O (-13.32‰ ± 0.6‰), and are characterized by a higher variability for deuterium (Figure 8).
FIGURE 8. The cross plot of oxygen-hydrogen stable isotope results (in ‰ VSMOW) of all water samples collected in the Zharkent Basin (shallow groundwater wells, geothermal wells, natural spring, artesian well, streamwater; Table 3). The Global Meteoric Water Line (GMWL, black line) from Craig (1961) was chosen over the more recent one by Rozanski et al. (1993) as it is more general and less linked to specific locations of the world. The Local Meteoric Water Line (LMWL; dashed black line) for Central Asia δ2H = 7.6δ18O+9.4 is based on Saidaliyeva et al. (2021). The cold season (blue point, 140.25‰ for δ2H and 19.6‰ for δ18O) and warm season (red point, 47.2‰ for δ2H and 7.2‰ for δ18O) are based on data from Bowen et al. (2005), see section 3.2.
4.2.2.2 Interpretation
The predominance of negative water stable isotope data (Figure 8) indicates that the geothermal water is largely a mixture of mountain snow and/or glacial ice melt (based on precipitation data from Saidaliyeva et al., 2021; Figure 8).
5 Discussion
5.1 Source of heat
5.1.1 The origin of geothermal waters in zharkent basin–a critical review
The data presented in this study challenge and improve prior interpretations for the origin of geothermal gradients and waters in the Zharkent basin because of added observations, some of which include:
i) Historically, the occurrence of geothermal waters in the Zharkent Basin are interpreted to be associated with the basin-scale increased geothermal gradients (Boguslavsky et al., 1999; Jóhannesson et al., 2019) and/or upflow along interconnected fault systems (Mukhamedzhanov, 1989; Kalitov, 2016). However, the source of heat and the plate-tectonic drivers of basin growth, faults, and fluid flow patterns remain speculative.
ii) The distribution of geothermal gradients is believed to be symmetric and highly predictable across the basin (i.e. curvi-linear isotherms; Figure 3) with the highest temperatures in the central part of the basin (Figure 3). The literature does not provide explanations.
iii) The actual surface evidence of faults within the basin is very limited as they appear blind, and are most likely covered by Quaternary sediments (Figure 2). The presence of currently mapped faults is mostly inferred from subsurface data to explain abrupt changes in depths of stratigraphic units and/or stratigraphic thicknesses between sparsely drilled well locations (Figure 3). Furthermore, all faults are graphically presented as normal faults inferring extensional setting, but neither modern plate tectonic terminology nor integration with recent structural studies in basin bounding ranges and ridges (Jolivet et al., 2010; Kober et al., 2013; Grützner et al., 2019; Jia et al., 2020) was integrated into this interpretation.
iv) Vertical fluid flow (Mukhamedzhanov, 1989; Kalitov, 2016) is interpreted based on the linear occurrence of natural thermal springs close to and parallel to the interpreted Shonzhy fault (Figure 1), and the linear shape of closely spaced geothermal wells along the main highway, which uncoinsidentaly runs parallel to the fault as well (Figure 2).
Below we provide and discuss alternative interpretations for the source of heat and water in the context of presented results, recent literature, and modern tectonic principles.
5.1.2 Refined basin tectonics, accommodation space, and crustal thinning
Recent interpretations of the tectonic history of south-eastern Kazakhstan suggest that the area is in a structural domain dominated by compression and right-lateral shear which is still active today (Kober et al., 2013; Grützner et al., 2019). These processes result in simultaneous mountain building South and North of the Yili basin (eastern extension of the Ily basin in China, Figures 1, 2), and the formation of basinal accommodation for sediments between mountain chains. The post- Late Cretaceous depositional tectonic history summarized below suggests that accommodation for sediments is by basin subsidence, most likely provided by transtentional forces (“Cenozoic phase of east–west extension”; Kober et al., 2013) and formation of a localized pull-apart basin.
Prior thermochronology and tectonostratigraphic studies indicate five stages of Late Cretaceous and Cenozoic tectonic activity in the Ily Basin area (Han et al., 2004; Burtman, 2012; Jia et al., 2020) that significantly shaped the basin. These serve as a foundation for additional interpretations and include:
i) Late Cretaceous-early Paleocene: rapid and localized uplift of the Narat and Borohoro ranges, i.e. the Chinese extensions of the Ketmen Ridge and Dzhungarian Alatau, respectively. Compressional movements reactivated preexisting basin-bounding, south-dipping thrust faults, and were driven by far-field deformation of the Central Asian lithosphere (Jolivet et al., 2010; Jia et al., 2020).
ii) Late Eocene-Oligocene: the northern part of the Zharkent Basin started to uplift due to E-W low magnitude extension and N-S shortening (Kober et al., 2013), which initiated subsidence of a basinal depocenter south of the Pendzhim arch within coordinates 44°–44°15′ N and 80°–80°15′ E (Hellwig et al., 2018).
iii) Miocene: the main north and south Paleozoic strike-slip (Altyn-Emel, Southern Dzhungarian) and mega-flower-structure-related thrust (Ketmen, Shonzhy) faults (Figure 9), which define the natural boundaries of the Zharkent depression, reactivated and led to the further deepening of the basin (Grützner et al., 2019).
iv) Late Pliocene - early Pleistocene: the highest tectonic activity including extensive N-S shortening, which led to a significant uplift in the E-W thrust faults (Grützner et al., 2019).
v) Middle Pleistocene to present: characterized by a continued N-S-directed shortening trend, but at a slower pace compared to the early Pleistocene (Han et al., 2004).
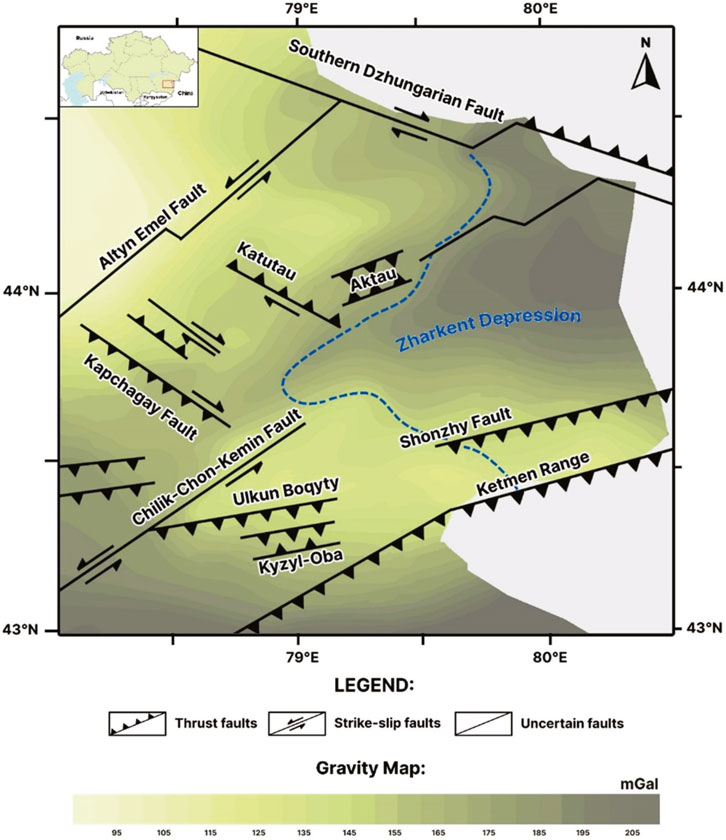
FIGURE 9. Location of main regional faults juxtaposed on the gravity map. The gravity map is modified from the Gravimetric map of the Stepanov and Yanushevich 1971. Map of tectonic faults is modified from (Campbell et al., 2013), Mackenzie et al. (2018), Grützner et al. (2019), and Wu et al. (2021). Note: Altyn-Emel and Chilik-Chon-Kemin faults are Paleozoic age strike-slip faults.
The North Tian Shan orogen trends toward pure-shear crustal shortening, which is absorbed by N-S thrust faults and N-W and N-E sinistral and dextral strike-slip faults (Wu et al., 2021). Moreover, the Zharkent Basin is simultaneously subject to overall N-S shortening and E-W extension (Grützner et al., 2019). Ongoing shear strain is expressed by numerous examples of surface expressions including dextral (Figure 1 in Grützner et al., 2019) and sinistral movements (Figures 5, 6, 9C in Grützner et al., 2019) as well as up to 500 m long, sinistral offset of streams observed on satellite images along the northern flanks of Ketmen Ridge (Figures 1, 2), between Nazgur Cavern (43°28′54.0″ N and 80°15′89.0″ E) and Sukam Village (43°29′12.10″ N and 80°10′48.52″ E) and elsewhere on the flanks of the basin. Intensive shearing observed in basin bounding ranges and ridges extends into neighboring intermontane basins in the North Tien Shan (e.g. E-W elongated depressions in Kyrgyzstan and China; Figure 1), that are defined by E-W-striking flower structures and associated thrust faults trending parallel to the mountain fronts (Kober et al., 2013; Cording et al., 2014; Grützner et al., 2019).
Simple-shear ‘bookshelf’ faulting expresses in the area between the Junggar Basin and the Kazakh Platform, within the area of geothermal interest. The clockwise rotation of the Tarim Basin relative to the stable Kazakh Plate caused a regional N-S shortening that decreases from west to east (Grützner et al., 2019). This is reflected by the left-lateral slip rate from 6.2 ± 1.8 mm/yr range in the Ili Basin to no more than 2.0 mm/yr in the Southern Dzhungarian Alatau fault (Yu et al., 2021).
We note that although thrust faults have locally formed minor (<1 km wide) micro-foreland basins (e.g. Charyn Canyon; Kober et al., 2013; their Figure 11), the geological maps (Figure 2), cross-sections (Figure 3; Kalitov, 2016), gravimetry survey (Gravimetric map of the USSR, 1971), and our field observations show a larger superimposed trend for all exposed sedimentary strata dipping towards the basin center. This implies that flower structure thrust faults illustrated by Jolivet et al. (2010) and Jia et al. (2020) are at most secondary elements in generating the accommodation for an up to 3 km thick Cenozoic sediment pile accumulated between opposing Dzhungarian Alatau and Ketmen ridge thrusts (Figures 1–3, 11). Additionally, the basin is progressively deepening towards its center, which contradicts the generation of a foreland basin by peripheral thrust loading, whereby a wedge-shaped basin geometry is expected with the thickest sediments near basin-marginal thrust loads (Figure 3). The intracratonic sag basin (Lucas et al., 1997) implies no genetic relationship with high basin bounding mountain (Figures 2, 3) which seems very unlikely. Thus, the co-occurrence of a major depocenter in the basin center between the bounding mountain belts (Figures 2, 3), but still far away from the influence of flanking flower structures, requires an alternative interpretation that favors common cause, but not cause and effect between these two structural trends.
The main strike-slip, thrust, and other undifferentiated faults overlain on a gravity map (Figure 9) show a correlation of trends. The NE-oriented gravity anomaly isolines align with the orientation of the strike-slip faults, implying that the faults play a role in the formation of the transtensional Zharkent Basin, which provided accommodation space for sediments. Crustal thinning can be inferred from large negative gravity anomalies (Figure 9), induced by the attenuation of cooler dense crust and the introduction of a hotter mantle near the surface that heated the plate and the sedimentary cover. Negative anomalies are consistent with the advent of transtensional structural trends observed and inferred within the basin. The major strike-slip faults and associated mega-flower structures are traced on the surface along the edges of Zharkent Basin (Figure 9; Grützner et al., 2019). However, most likely, there is a significant number of local strike-slip and associated en-echelon faults of Cenozoic age, which are covered by Quaternary deposits (Figure 2) and are typically difficult to localize in the subsurface (Muraoka et al., 2010).
We propose that the Zharkent Basin is regionally a transtensional pull-apart basin filled by up to 3 km of sediments (Figures 3, 9) This is consistent with substantial evidence of shallower basement and transpressional movements in Ily Basin bounding ranges that took place throughout the Cenozoic (Kober et al., 2013; Grützner et al., 2019) as additional components of this regional shearing trend. We further suggest that the proposed tectonic attenuation has significantly contributed to basin-scale crustal thinning, which in return has caused elevated geothermal gradients of up to 55.4°C/km (Figures 4, 5). The variations in temperature gradients (Figures 4, 5) suggests that crustal thinning is uneven across the basin. This phenomena is typical for pull-apart basins, such as the Salton Sea where higher temperatures were attributed to superimposed subregions of extensional to transtensional strain (Faulds and Hinz, 2015). These authors highlighted that grabens and step overs or relay ramps, typical of larger extensional and transtensional systems, are the most favorable intrabasinal areas for locally increased heat. Local heat anomalies like those observed in the Zharkent Basin are thus expected in regional transtensional systems.
Considering the sparsity of well data and the absence of seismic data, a constraint of discrete tectonic elements within the Zharkent Basin is challenging. However, the proposed pull-apart model is consistent with available structural, stratigraphic, and geophysical observations, and offers a conceptual model for assessing intrabasinal grabens and relay ramps as targets for elevated heat flow. The pull-apart interpretation offers a platform for revisiting interpretations of previously mapped faults (Figure 3). The evidence of Shonzhy-Dobyn temperature anomaly characterized by a geothermal gradient as high as 55°C/km (Figures 4, 5), and the argument that it is most likely one of perhaps many intrabasinal grabens (sensu Alexeiev et al., 2009); Section 4.1), suggests the potential for more similar thermal anomalies in the basin which have not been drilled yet. Finding such anomalies in areas where the Upper Cretaceous sandstone is buried deeper (in the Shonzhy-Dobyn area it is ∼50°C at a depth of only 600–700 m) and potentially reaching temperatures of >120°C would mean the discovery of a geothermal play suitable for direct electricity production (Lee, 2001; Dickson and Fanelli, 2003).
5.2 Basin recharge and water-rock interactions
5.2.1 The upper cretaceous aquifer
Prior workers argue that Upper Cretaceous aquifers in the Zharkent basin are charged by meteoric water sourced from the Ketmen Ridge and Dzhungarian Alatau Mountain (Figure 1) drainage system (Mukhamedzhanov, 1989; Kalitov, 2016) and partially via deep groundwater flow through fractured rocks (Kim et al., 1971). These processes are known as mountain-front recharge (MFR) and mountain-block recharge (MBR), respectively. These interpretations (Kim et al., 1971; Mukhamedzhanov, 1989; Kalitov, 2016) are based on basin configuration (e.g. enclosed basin) and analogous hydrogeological systems. We use new evidence from hydrogeochemistry and water isotopes to test these proposed recharge mechanisms.
The geothermal waters produced from the Upper Cretaceous aquifer in the Zharkent Basin are characterized by extremely low salinities ranging from about 0.3 to 0.8 g/L (Table 4) when compared to the more saline waters more typically observed at their production depths (Mcintosh, 2021) and standards for using it for agriculture and geothermal productions (Yapiyev et al., 2021). Results from a single shallow geothermal well (AE-4) indicates slightly brackish water (∼4.5 g/L), perhaps because of the localized influence of saline surface processes on water chemistry. The very low TDS values and the presence of Si, HCO3, and Na ions (Table 4) indicate that rock-water interactions are dominated by the dissolution of silicate-rich rocks such as rhyolites and feldspars which are abundant in Paleozoic rocks and derived Mesozoic fragments in the Zharkent Basin (Figures 2, 3). The source of Na and Si is commonly attributed to sodium feldspar and/or rhyolite hydrolysis by hydrogen ions donated by bicarbonate dissociation (Sharp and Tranter, 2017; Absametov et al., 2023). Such silicate dissolution is also documented elsewhere in hydrothermal systems (Shoedarto et al., 2022; Xing et al., 2022). Shoedarto et al. (2022) showed silicate weathering dominates water-rock interaction in hot springs in Southern Bandung, West Java, Indonesia. Chemical dissolution of silicate rocks is positively correlated with temperature (Gaillardet et al., 1999) and is usually low in cold climate regions (Anderson, 2007) compared to higher dissolution in the deep subsurface (Kharaka and Hanor, 2003). The high Si content, high temperature, low salinity, and predominantly quartz lithology of the Upper Cretaceous aquifer (Umralin, 2022; unpublished BSc report) suggests that the solutes in water are likely derived from silicate dissolution in deeper strata. While mixing diagrams (Figure 7) point to the potential presence of evaporates, their actual quantity is probably minimal as evidenced by low TDS (Table 4) and two to three times lower concentrations of Cl compared to Na (Table 4).
The progressive depletion in heavier isotopes with depth (Figure 8) suggests that the primary source of water in the Upper Cretaceous aquifers is the cryosphere (snow, glaciers, and permafrost) of the Tien Shan Mountains (Hoelzle et al., 2019) with snowmelt by far being the largest contributor (Kraaijenbrink et al., 2021). Snowmelt is the most isotopically depleted known water source (Beria et al., 2018), which suggests that winter precipitation in the mountains is the primary source for studied Upper Cretaceous geothermal waters (Figure 8; Table 4). The median values of δ18O in winter precipitation (December-January-February) in Central Asia are reported to be around -15 to -21‰ (Saidaliyeva et al., 2021), similar to that measured here in geothermal wells of around -14‰ (Figure 8). Summer (June-July-August) precipitation values, by contrast, are isotopically much heavier, with median values of around—5‰ (Saidaliyeva et al., 2021). The data from the global dataset of stable water isotopes in precipitation (Bowen et al., 2005) shows a higher contribution of cold-season precipitation to geothermal groundwater recharge (Figure 8). Recently, Hellwig et al. (2018) reported δ18O values of water from springs collected in eastern Ily (Altyn-Emel location) to be in the range of -12.8 to -13.6‰ which is very close to our measurements (e.g. -13.04‰ for AE-3; Figure 8). These isotope values contrast with much more enriched values more typical of rainfall signatures (-8.6 to –3.09‰, Hellwig et al., 2018).
The deviation of the isotopic composition of water in geothermal wells right of the LMWL (Figure 8), also known as the ‘oxygen isotope shift’ (Kharaka and Hanor, 2003) is commonly observed in geothermal systems (Kong et al., 2020; Mcintosh, 2021). This enrichment of δ18O is commonly caused by high-temperature exchange of formation-water with silicate minerals. This interpretation is also supported by our water chemistry data presented herein (Table 4; Section 5.2.1).
Water sample KD-9 (Figure 8), collected from a stream draining from the nival zone in Ketmen Ridge (Figure 2), is more isotopically enriched relative to subsurface samples (the springs, the artesian well shallow GW, deep and shallower geothermal wells (Figure 8; Table 3). This further demonstrates the larger influence of meltwater recharge with deeper aquifers via deeper flow paths from the mountain block. Recently (Mcintosh, 2021), used stable water isotopes to show that maximum meteoric water circulation depths vary from 1 to 5 km in North America. The deeper circulation is expected to occur in areas of greater topographic relief, like that of the Zharkent area. Jasechko et al. (2017) suggested that globally water at wells deeper than 250 m is mostly (42%–85%) ‘fossil’ groundwater, recharged by precipitation more than ∼12 000 years ago. Though, the previous preliminary results of groundwater residence time in the Zharkent basin, based on the absence of tritium detection (Kozhagulova et al., 2022) should be treated as a potential over-interpretation as the samples were analyzed without prior enrichment. A very low salinity (Figure 10) and isotopically depleted signal in deep geothermal wells (Figure 8), cumulatively points to long-duration deep groundwater flow paths from the mountain cryosphere to the Cretaceous aquifer.
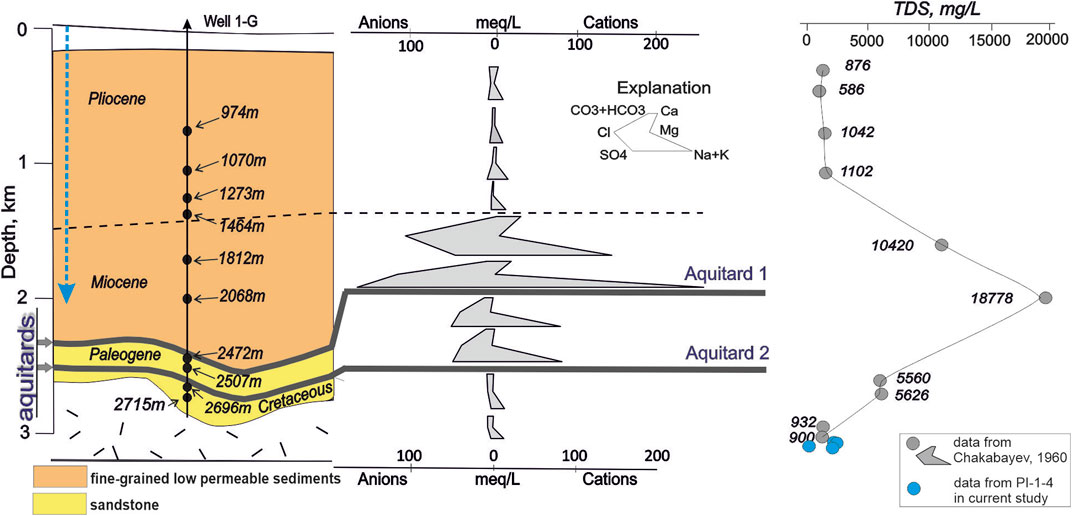
FIGURE 10. Stiff diagram of major ion composition and vertical salinity profile of the deep geothermal well 1-G (see location in Figure 2A). Input data for the TDS depth profile are from Chakabayev (1960) and from this study (blue dots). Both data sources confirm the low salinity of Cretaceous aquifer waters as well as presence of major aquitards in the overlying strata. Blue dashed arrow indicates proposed dominant recharge mechanism for non-productive and more saline Miocene and Pliocene horizons. Cretaceous groundwater is most likely charged by mountain-front and/or mountain-block recharge mechanisms (Figure 11).
Despite having relatively low variability in salinity across the basin, natural flowrates vary up to 3 times, even for the wells that are drilled in close vicinity to each other (e.g. wells 1-RT and 5539 producing 24.5 and 54.5 L/s respectively (Mukhamedzhanov, 1989). This clearly suggests variable reservoir properties controlled by depositional heterogeneity, which are a subject of ongoing research and beyond the scope of this study.
5.2.2 Cenozoic aquifers
Cenozoic aquifer lithologies are characterized by poor permeability (Figure 10) and low flow rates (Kalitov, 2016), and are not used for geothermal production. However, the integration of their water chemistry (Chakabayev, 1960 and this study) promotes a better understanding of basin recharge.
Vertical salinity variation of Cenozoic formation waters is significant (Figure 10). Water samples taken from Pliocene aquifers have low ion content (around 1 g/L), and show an abrupt rise in Miocene aquifers (with TDS values up to 19 g/L), implying that underlying sedimentary units would be characterized by even higher salinity. However, this is not the case as water gets less saline in underlying Paleogene aquifers, and becomes virtually fresh in deeper buried Upper Cretaceous aquifers (Table 4; Figure 10). These abrupt salinity shifts point to the presence of aquitards between Miocene and Paleogene, and Paleogene and Cretaceous aquifers, respectively (Figure 10). The chemical profile (Figure 10) suggests that dissolved salts (from secondary evaporates such as halite and gypsum) are mostly likely percolating from the modern-day surface (i.e. Ily River floodplains and evaporate ponds) to accumulate at the bottom of the Miocene (depth=2068 m, Na-SO4 water type, TDS ∼19 g/L; Figure 10). In contrast, the underlying less saline Paleogene formation waters (depths at 2500–2700 m, Na-SO4 water type, TDS ∼5.6 g/L; Figure 10), and essentially fresh waters in the Cretaceous layers (Na-HCO3 water type, TDS ∼0.9 g/L) implies that both the Paleogene and Cretaceous aquifers are recharged primarily by lateral groundwater flow (Figure 11), and are not in strong connectivity with the overlying more saline layers. Higher salinities in the Paleogene than in the Upper Cretaceous strata suggest a mixing of laterally charged fresh waters and saline waters that over geological time scale have percolated or diffused through the proposed aquitard 1 (Figure 10). The water chemistry of well 1G based on Chakabayev (1960) is in line with recent data (Kalitov, 2016; Table 1) as well as TDS of the recently acquired water samples presented in this study (Table 4; Figure 10). The similarity of Upper Cretaceous waters obtained from well 1G and more recent deep wells including 5539 (PI-1), 1-RT (PI-2), 2-TP (PI-3), 1-TP (PI-4 and PI-5) implies that our interpretation of historical water chemistry data presented above and proposed recharge mechanisms are likely valid across the basin.
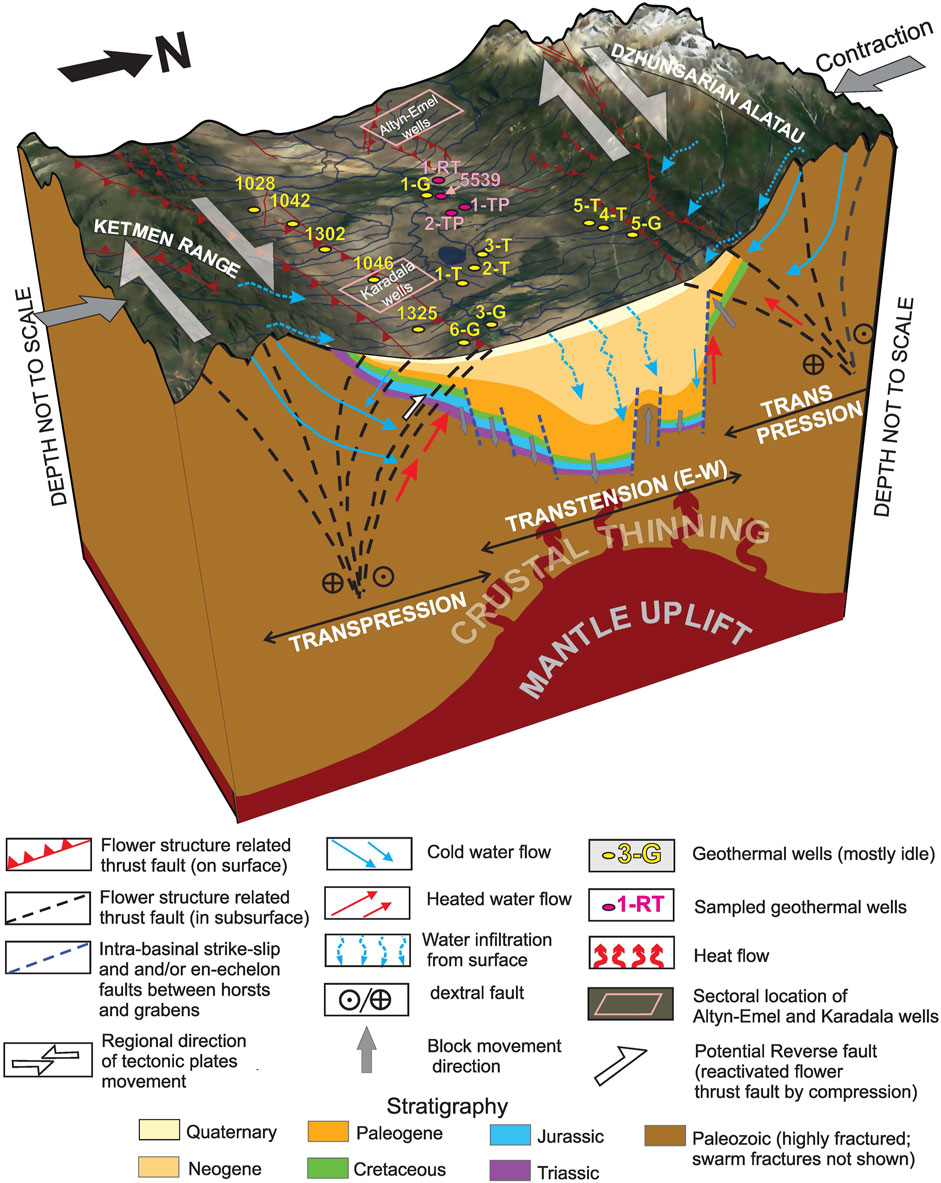
FIGURE 11. Integrated conceptual three-dimensional tectono-stratigraphic, heat, and hydrogeological model of the Zharkent Basin highlighting new evidence relevant to the geothermal system analysis proposed in this study, including: i) crustal thinning caused by recent and/or ongoing regional strike-slip faulting and formation of localized tectonic depression interpreted as a pull-apart basin (the most likely reason for basin-wide increased temperature gradients); Flower structures (steeply dipping thrust faults) on the edges of the basin are produced by transpression while intrabasinal faults are likely produced by transtension, and may include a range of features including an en-echelon network of faults and fractures and associated grabens, horsts, and relay ramps whose presence and geometries cannot be precisely recognized and mapped with available datasets; ii) complex recharge system in the context of stratigraphy and regional structures which includes the interplay of (A) gravity driven vertical water infiltration (percolation) from surface (blue wavy dashed arrows), (B) water from streams near mountain fronts directly charging porous Cretaceous aquifers (blue dashed arrows), referred as mountain-front recharge (MFR) and (C) deep groundwater flow (blue arrows) known as mountain-block recharge (MBR) mechanisms; iii) possible localized heated water upflow along the faults (red arrows). Note 1: geospatial illustration of scenarios proposed to explain geothermal gradient variations across the basin (Figures 4, 5) would require additional surveys and datasets which are currently not available. Note 2: although strike-slip arrows suggest dextral movements numerous pieces of evidence show both sinistral and dextral strike-slip faults (Grützner et al., 2019; Wu et al., 2021).
In summary, Miocene and Pliocene strata are recharged from percolation down from the overlying basin floor, and Cretaceous waters are recharged laterally from winter precipitation in the Tien Shan Mountains. Paleogene strata are likely a mixture of the two.
5.3 Revised conceptual model of the Zharkent Basin
The integration of the tectonic history of the basin coupled with stratigraphy (Figures 2, 3, 9) and interpretations based on the studied waters’ hydrogeochemistry and stable isotope data (Figures 6–8, 10) as well as geothermal gradients (Figures 4, 5) allowed for generating an integrated conceptual three-dimensional model of the Zharkent geothermal system highlighting its recharge system in the context of stratigraphy and regional structures (Figure 11).
We propose that the Upper Cretaceous aquifer is recharged primarily by deep groundwater flow in which old cryosphere water is pushed by a high hydrostatic head from the mountains by the process known as mountain-block recharge (MBR) mechanism (Manning and Solomon, 2005; Markovich et al., 2019; Somers and McKenzie, 2020). The MBR is possibly coupled with mountain-front recharge (MFR) with stream water infiltrating through the basin fill in piedmont areas of Ketmen Range and Dzhungarian Alatau (sensu Hellwig et al. (2018) and particularly through sub-cropping and outcropping Upper Cretaceous sandstone strata (Figures 2, 3, 11). This MBR component is similar to other intermontane basin aquifers recharged primarily by adjacent mountains (Manning and Solomon, 2005; Dar et al., 2022). In contrast, the shallower, Cenozoic groundwater systems are recharged from mountain front and meteoric precipitations. The infiltration velocity of groundwater is very low (Mcintosh, 2021), but the current study does not reveal the age of the water currently produced, and thus not the recharge rate. Sustainable development likely requires ongoing re-injection of produced water into the producing reservoir, which is not the current practice (Kozhagulova et al., 2022).
The complex deformation history of the Zharkent Basin during the multiple phases of major strike-slip faulting led to the formation of a regional pull-apart basin and associated localized weakening and thinning of the crust allowing for heat being transferred via conduction. Transtension and crustal thinning related to pull-apart basin development caused rapid subsidence and formed accommodation for a thick sedimentary succession as well contributed to elevated geothermal gradients (Figure 11). Some heated water might have moved towards the surface and/or accumulated in shallower reservoirs along fracture fault systems (e.g. Shonzhy–Dobyn anomaly) and therefore heat is transferred through the convection mechanism as well. However, the consistent low salinity argues it is more likely that variable geothermal gradients (Figures 4, 5) are the results of complex distribution of tectonic blocks within the larger pull-apart basin.
6 Conclusions and future work
The results of this study promote a novel interpretation of the Zharkent (Eastern Ily) basin’s tectonic setting and recharge system through a 3D model that integrates stratigraphic, structural, and geochemical data. These findings differ from prior interpretations and are of significant interest for a better understanding of the overall geothermal system. Our model argues for the following conclusions:
1) Highly variable (from ∼25.1°C up to °54.5 C) geothermal gradients are a product of strike-slip faulting which caused the formation of a pull-apart basin characterized by spatially variable crustal thinning. This conclusion is based on the integration of recent tectonic studies and gravimetric mapping as well as consideration of modern plate tectonic principles, along with well control and temperature data. Heat transfer is dominantly, if not exclusively, conductive. However, the localized contribution of convective transfer by water circulation across potentially open faults cannot be excluded.
2) Stable water isotope results from the Upper Cretaceous reservoir point to snow-melt as a predominant groundwater recharge source.
3) While water chemistry results in this study collaborate previous reports suggesting very low TDS [<1 g/L] in the Upper Cretaceous aquifer, recognition of ions indicative of silica dissolution also argues for lateral recharge by a combination of mountain block recharge (MBR; perhaps via fractured porphyritic rhyolite basement) and mountain-front recharge (MFR) by gravity-driven infiltration of surface water via outcropping reservoirs.
4) Up to 20 times higher salinity in the Paleogene and Neogene formations overlaying the Cretaceous reservoir originates from downward water percolation from the surface, including origin from modern evaporative ponds. The mixing of surface and laterally charged waters with Upper Cretaceous water is prevented by at least two major aquitards.
Further steps for testing and refining the proposed model should focus on a better understanding of the local high-temperature anomalies and their association with the faulting network in the Zharkent Basin. A more precise localization of the pull-apart features of the basin will potentially lead to a better comprehension of the spatial heat distribution, and allow for constraining more constraints for resolving heat maps. Ongoing detailed sedimentological studies focused on interpreting the depositional environments and architecture of the Upper Cretaceous reservoir will advance knowledge about reservoir connectivity and associated risks for commercial geothermal developments. Subsequent common-risk segment maps are expected to identify the most attractive areas for commercial geothermal developments. Moreover, further water sampling for groundwater age (residence time) and chemistry will aid reservoir modeling in the region and will help to refine models for the recharge source of the geothermal aquifers.
Data availability statement
The original contributions presented in the study are included in the article/Supplementary Material, further inquiries can be directed to the corresponding author.
Author contributions
AsK: Conceptualization, Methodology, Original draft preparation; VY: Methodology, Original draft preparation; LK: Conceptualization, Original draft preparation; AD: Visualization, Writing–Draft preparation, Editing; VZ: Data acquisition, Supervision; AiK: Experimental work, Data acquisition; EB: Software, Validation; SG: Supervision, Reviewing; JH: Supervision, Reviewing; MF: Conceptualization, Supervision, Writing–Reviewing and Editing. All authors contributed to the article and approved the submitted version.
Funding
Nazarbayev University (CRP Research Grant No. 021220CRP2122) for all field and laboratory research works as well as student and post-doctoral salaries. Swanson Family Foundation for Dr. Holbrook’s visit to Kazakhstan. This work is conducted with financial support from Nazarbayev University (CRP Research Grant No. 021220CRP2122) and funds from the Swanson Family Foundation. VY was also partially supported by the University of Oulu.
Acknowledgments
The authors most sincerely thank Geoterm Production Company LLP management for providing us with water samples from hard-to-access localities, Altyn-Emel National Park authorities for granting sampling permits within the park, Drs. Dulat Kalitov and Bas Den Brok for useful discussions about historical hydrogeology data and structural geology interpretation, respectively. The authors also thank Ayana Karakozhayeva for assisting with the ICP-OES analysis. The thorough reviews and constructive suggestions provided by Drs. Richeng Liu, Kun Tu, Tianran Ma, and Dr. Jianwei Tian (Editor) have greatly enhanced the final version of the manuscript, and their contributions are sincerely appreciated.
Conflict of interest
Authors VZ and AiK were employed by Geoterm Production Company LLP.
The remaining authors declare that the research was conducted in the absence of any commercial or financial relationships that could be construed as a potential conflict of interest.
Publisher’s note
All claims expressed in this article are solely those of the authors and do not necessarily represent those of their affiliated organizations, or those of the publisher, the editors and the reviewers. Any product that may be evaluated in this article, or claim that may be made by its manufacturer, is not guaranteed or endorsed by the publisher.
Supplementary material
The Supplementary Material for this article can be found online at: https://www.frontiersin.org/articles/10.3389/feart.2023.1212064/full#supplementary-material
References
Absametov, M., Sagin, J., Adenova, D., Smolyar, V., and Murtazin, E. (2023). Assessment of the groundwater for household and drinking purposes in central Kazakhstan. Groundw. Sustain. Dev. 21 (December 2022), 100907. doi:10.1016/j.gsd.2023.100907
Akchulakov, U. A. (2012). The comprehensive study of the sedimentary basins of Kazakhstan. Ily basin (book 1).
Alexeiev, D. V., Cook, H. E., Buvtyshkin, V. M., and Golub, L. Y. (2009). Structural evolution of the Ural-Tian Shan junction: a view from Karatau ridge, South Kazakhstan. Comptes Rendus - Geosci. 341 (2–3), 287–297. doi:10.1016/j.crte.2008.12.004
Allen, M. B., Windley, B. F., Chi, Z., Zhong-Yan, Z., and Guang-Rei, W. (1991). Basin evolution within and adjacent to the tien Shan range, NW China. J. Geol. Soc. 148 (2), 369–378. doi:10.1144/gsjgs.148.2.0369
Anderson, S. P. (2007). Biogeochemistry of glacial landscape systems. Annu. Rev. Earth Planet. Sci. 35 (1), 375–399. doi:10.1146/annurev.earth.35.031306.140033
Beria, H., Larsen, J. R., Ceperley, N. C., Michelon, A., Vennemann, T., and Schaefli, B. (2018). Understanding snow hydrological processes through the lens of stable water isotopes. Wiley Interdiscip. Rev. Water 5 (6), e1311. doi:10.1002/wat2.1311
Boguslavsky, E., Vainblat, A., Daukeev, G., Movchan, I., Pevzne, L., Smyslov, A., et al. (1999). Geothermal resources of sedimentary basins in the Republic of Kazakhstan. Bull. d’Hydrogelogie (17), 123–131.
Bowen, G. J. (2022). WaterIsotopes.org. version OIPC3.1http://wateriso.utah.edu/waterisotopes/pages/data_access/oipc.html.
Bowen, G. J., Wassenaar, L. I., and Hobson, K. A. (2005). Global application of stable hydrogen and oxygen isotopes to wildlife forensics. Oecologia 143 (3), 337–348. doi:10.1007/s00442-004-1813-y
Burtman, V. S. (2012). Geodymanics of tibet, Tarim, and the tien Shan in the late cenozoic. Geotectonics 46 (3), 185–211. doi:10.1134/S0016852112030028
Campbell, G. E., Walker, R. T., Abdrakhmanov, K., Schwenninger, J., Jackson, J., Elliott, J. R., et al. (2013). The Dzhungarian fault Late Quaternary tectonics and slip rate of a major right-lateral strike-slip fault in the northern Tien Shan region. J. Geophys. Res. Solid Earth 118, 5681–5698. doi:10.1002/jgrb.50367
Chakabayev, S. E. (1960). Hydrochemical and thermal conditions of the Cretaceous and Tertiary formations of the eastern part of the Ily depression (in Russian). Vestnik KazSSR Sci. Acad. 1 (38).
Cording, A., Hetzel, R., Kober, M., and Kley, J. (2014). 10Be exposure dating of river terraces at the southern mountain front of the Dzungarian Alatau (SE Kazakhstan) reveals rate of thrust faulting over the past ∼400ka. Quat. Res. (United States) 81 (1), 168–178. doi:10.1016/j.yqres.2013.10.016
Dar, T., Rai, N., and Kumar, S. (2022). Distinguishing Mountain front and mountain block recharge in an intermontane basin of the himalayan region. Groundwater 60 (4), 488–495. doi:10.1111/GWAT.13181
Daukeev, S. Z., Uzhkenov, B. S., Abdulin, A. A., Bespayev, H. A., Votsalevskiy, E. S., Lubetskiy, V. N., et al. (2002). The deep structure and mineral resources of. Kazakhstan.
Dickson, M. H., and Fanelli, M. (2003). Geothermal background. Paris: Geothermal Energy, Utilization and Technology, UNESCO, 125.
Dillinger, A. (2021). Outcrop observations in the Zharkent area (Aktam, Kolzhat, Dikan locations) (unpublished field study report), 1–33.
Faulds, J., and Hinz, N. (2015). “Favorable tectonic and structural settings of geothermal systems in the Great Basin region, western USA: Proxies for discovering blind geothermal systems,” in Proceedings World Geothermal Congress, Melbourne, Australia, April 19–25, 2015 (No. DOE-UNR-06731-02). University of Nevada, Reno: Nevada Bureau of Mines and Geology.
Faulds, J. E., Hinz, N. H., Coolbaugh, M. F., Craig, M., Siler, D. L., Shevenell, L. A., et al. (2016). Discovering geothermal systems in the Great Basin region: an integrated geologic, geochemical, and geophysical approach for establishing geothermal play fairways. 1–15.
Ferguson, G., Grasby, S. E., and Hindle, S. R. (2009). What do aqueous geothermometers really tell us? Geofluids 9 (1), 39–48. doi:10.1111/j.1468-8123.2008.00237.x
Filipyev, G. P. (1957). Report on the exploration drilling in the Ily depression, 1955–1956. (in russian).
Filipyev, G. P., and Rabkin, F. S. (1959). Report on the results of the exploration drilling in the Zharkent depression in 1957,1958 and 9 months of 1959 (in Russian).
Franke, R. (1982). Smooth interpolation of scattered data by local thin plate splines. Comput. \& Math. Appl. 8 (4), 273–281. doi:10.1016/0898-1221(82)90009-8
Frisch, K., Voigt, S., Voigt, T., Hellwig, A., Verestek, V., and Weber, Y. (2019). Extreme aridity prior to lake expansion deciphered from facies evolution in the Miocene Ili Basin, south-east Kazakhstan. Sedimentology 66 (5), 1716–1745. doi:10.1111/sed.12556
Gaillardet, J., Dupré, B., Louvat, P., and Allègre, C. J. (1999). Global silicate weathering and CO2 consumption rates deduced from the chemistry of large rivers. Chem. Geol. 159 (1–4), 3–30. doi:10.1016/S0009-2541(99)00031-5
Grützner, C., Campbell, G., Walker, R. T., Jackson, J., Mackenzie, D., Abdrakhmanov, K., et al. (2019). Shortening accommodated by thrust and strike-slip faults in the Ili Basin northern tien Shan. Tectonics 38, 2255–2274. doi:10.1029/2018TC005459
Han, X. Z., Li, S. H., Zheng, E. J., Li, X. G., Cai, Y. Q., and Chen, Z. L. (2004). Neotectonic activity characteristics of Yili Basin and its relation to the formation of sandstone-type uranium deposits. Xinjiang Geol. 22 (4), 378–381.
Hellwig, A., Voigt, S., and Mulch, A. (2018). Late Oligocene to early Miocene humidity change recorded in terrestrial sequences in the Ili Basin. south-eastern Kazakhstan , Central Asia, 517–539. doi:10.1111/sed.12390
Hellwig, A., Voigt, S., Mulch, A., Frisch, K., Bartenstein, A., Pross, J., et al. (2017). Late Oligocene to early Miocene humidity change recorded in terrestrial sequences in the Ili Basin (south-eastern Kazakhstan, Central Asia). Sedimentology 65, 517–539. doi:10.1111/sed.12390
Hoelzle, M., Barandun, M., Bolch, T., Fiddes, J., Gafurov, A., Muccione, V., et al. (2019). “The status and role of the alpine cryosphere in Central Asia,” in The Aral Sea Basin (Taylor & Francis), 100–121. doi:10.4324/9780429436475-8
Huang, H., Cawood, P. A., Ni, S., Hou, M., Shi, Z., and Hu, X. (2018). Provenance of late paleozoic strata in the Yili Basin: implications for tectonic evolution of the South tianshan orogenic belt. GSA Bull. 130 (5–6), 952–974. doi:10.1130/b31588.1
Hubert, E., and Wolkersdorfer, C. (2015). Establishing a conversion factor between electrical conductivity and total dissolved solids in South African mine waters. Water sa. 41 (4), 490–500. doi:10.4314/wsa.v41i4.08
Jasechko, S., Perrone, D., Befus, K. M., Bayani Cardenas, M., Ferguson, G., Gleeson, T., et al. (2017). Global aquifers dominated by fossil groundwaters but wells vulnerable to modern contamination. Nat. Geosci. 10 (6), 425–429. doi:10.1038/ngeo2943
Jia, Y., Sun, J., Lü, L., Pang, J., and Wang, Y. (2020). Late Oligocene-Miocene intra-continental mountain building of the Harke Mountains, southern Chinese Tian Shan: evidence from detrital AFT and AHe analysis. J. Asian Earth Sci. 191, 104198. doi:10.1016/j.jseaes.2019.104198
Jóhannesson, T., Axelsson, G., Hauksdóttir, S., Chatenay, C., Benediktsson, D. Ö., and Weisenberger, T. B. (2019). Preliminary review of geothermal resources in Kazakhstan. Final Report. May Available at: https://rfc.kegoc.kz/media/Geothermal.resources.pdf.
Jolie, E., Scott, S., Axelsson, G., Gutiérrez-negrín, L. C., Regenspurg, S., Ziegler, M., et al. (2021). Geological controls on geothermal resources for power generation. Nat. Rev. Earth Environ. 2 (May), 324–339. doi:10.1038/s43017-021-00154-y
Jolivet, M., Dominguez, S., Charreau, J., Chen, Y., Li, Y., and Wang, Q. (2010). Mesozoic and Cenozoic tectonic history of the central Chinese Tian Shan: reactivated tectonic structures and active deformation. Tectonics 29 (6), 1–30. doi:10.1029/2010TC002712
Kalitov, D. K. (2016). Exploration of geothermal groundwater at the Zharkunak site of the Zharkent basin in the Almaty region in order to assess the operational reserves of thermal groundwater for heat and power purposes (in Russian).
Kendall, C., and Doctor, D. H. (2003). Stable isotope applications in hydrologic studies. Treatise Geochem. 5–9, 319–364. doi:10.1016/B0-08-043751-6/05081-7
Kharaka, Y. K., and Hanor, J. S. (2003). Deep fluids in the continents: I. Sedimentary basins. Treatise Geochem. 5, 605.
Kim, E. K., Kondratyeva, I. M., Kaltayev, M. K., Gorlenko, N. N., Losev, D. M., Malikov, V. D., et al. (1971). Karadala groundwater field in the Uyghur district of the Almaty region (in Russian).
Kober, M., Seib, N., Kley, J., and Voigt, T. (2013). Thick-skinned thrusting in the northern Tien Shan Foreland, Kazakhstan: structural inheritance and polyphase deformation. Geol. Soc. Spec. Publ. 377 (1), 19–42. doi:10.1144/SP377.7
Kong, Y., Pang, Z., Pang, J., Li, J., Lyu, M., and Pan, S. (2020). Fault-affected fluid circulation revealed by hydrochemistry and isotopes in a large-scale utilized geothermal reservoir. Geofluids 2020, 1–13. doi:10.1155/2020/2604025
Kozhagulova, A., Yapiyev, V., Kalitova, A., Zavaley, V., Dillinger, A., Karakozhayeva, A., et al. (2022). “Low salinity upper cretaceous formation potential for geothermal energy harvesting in the eastern Ily Basin,” in 3rd EAGE Global Energy Transition Conference & Exhibition, 1–5. Kazakhstan.
Kraaijenbrink, P. D. A., Stigter, E. E., Yao, T., and Immerzeel, W. W. (2021). Climate change decisive for Asia’s snow meltwater supply. Nat. Clim. Change 11 (July), 591–597. doi:10.1038/s41558-021-01074-x
Lee, K. C. (2001). Classification of geothermal resources by exergy. Geothermics 30 (4), 431–442. doi:10.1016/S0375-6505(00)00056-0
Lucas, S. G., Aubekerov, B. Z., Dzhamangaraeva, A. K., Bayshashov, B. U., and Tyutkova, L. A. (2000). Cenozoic lacustrine deposits of the Ili Basin, southeastern Kazakhstan. Lake basins through space and time. Tulsa: American Association of Petroleum Geologists, 59–64.
Lucas, S. G., Bayshashov, B. U., Tyutkova, L. A., Zhamangara, A. K., and Aubekerov, B. Z. (1997). Mammalian biochronology of the paleogene-neogene boundary at Aktau mountain, eastern Kazakhstan. Paläontologische Z. 71 (3), 305–314. doi:10.1007/bf02988498
Macaulay, E. A., Sobel, E. R., Mikolaichuk, A., Kohn, B., and Stuart, F. M. (2014). Cenozoic deformation and exhumation history of the Central Kyrgyz Tien Shan. Tectonics 33 (2), 135–165. doi:10.1002/2013TC003376
Mackenzie, D., Walker, R., Abdrakhmatov, K., Campbell, G., Carr, A., Gruetzner, C., et al. (2018). A creeping intracontinental thrust fault: past and present slip-rates on the Northern edge of the Tien Shan, Kazakhstan. Geophys. J. Int. 215 (2), 1148–1170. doi:10.1093/GJI/GGY339
Manning, A. H., and Solomon, D. K. (2005). An integrated environmental tracer approach to characterizing groundwater circulation in a mountain block. Water Resour. Res. 41 (12), 1–18. doi:10.1029/2005WR004178
Markovich, K. H., Manning, A. H., Condon, L. E., and McIntosh, J. C. (2019). Mountain-block recharge: a review of current understanding. Water Resour. Res. 55 (11), 8278–8304. doi:10.1029/2019WR025676
Mcintosh, J. C. (2021). Deep Meteoric Water Circulation Earth ’ s Crust Geophys. Res. Lett. 1, 10. doi:10.1038/s41477-022-01198-8
Middleton, M. F. (1989). A model for the formation of intracratonic sag basins. Geophys. J. Int. 99 (3), 665–676. doi:10.1111/j.1365-246x.1989.tb02049.x
Mitáš, L., and Mitášová, H. (1988). General variational approach to the interpolation problem. Comput. \& Math. Appl. 16 (12), 983–992. doi:10.1016/0898-1221(88)90255-6
Mukhamedzhanov, S. M. (1989). Hydrogeological and geophysical data analysis of the eastern Ily geothermal basin, the geological economic apprasal of the thermal water fields (based on the 1984-1988 work) (in Russian).
Muraoka, H., Takahashi, M., Sundhoro, H., Dwipa, S., Soeda, Y., Momita, M., et al. (2010). Geothermal systems constrained by the Sumatran fault and its pull-apart basins in Sumatra, Western Indonesia. World Geotherm. Congr. 2010ermal Congr., 25–29.
Rozanski, K., Araguás-Araguás, L., and Gonfiantini, R. (1993). Isotopic patterns in modern global precipitation. Clim. Change Cont. Isotopic Rec. 78, 1–36. doi:10.1029/gm078p0001
Ryan, W. B. F., Carbotte, M. S., Coplan, J. O., O’Hara, S., Melkonian, A., Arko, R., et al. (2009). Geochem Geophys Geosyst—2009—Ryan—Global Multi-Resolution Topography synthesis. doi:10.1029/2008GC002332
Saidaliyeva, Z., Shahgedanova, M., Yapiyev, V., Wade, A., Akbarov, F., Esenaman, M., et al. (2021). Water isoscapes of central Asia. doi:10.13140/RG.2.2.18428.21127
Sharp, M., and Tranter, M. (2017). Glacier biogeochemistry. Geochem. Perspect. 6 (2), 173–339. doi:10.7185/geochempersp.6.2
Shoedarto, R. M., Tada, Y., Kashiwaya, K., Koike, K., Iskandar, I., Malik, D., et al. (2022). Advanced characterization of hydrothermal flows within recharge and discharge areas using rare Earth elements, proved through a case study of wayang windu field, West Java, Indonesia. SSRN Electron. J. 105 (April), 102507. doi:10.2139/ssrn.4085439
Sobel, E. R., Chen, J., and Heermance, R. V. (2006). Late oligocene-early Miocene initiation of shortening in the southwestern Chinese tian Shan: implications for Neogene shortening rate variations. Earth Planet. Sci. Lett. 247 (1–2), 70–81. doi:10.1016/j.epsl.2006.03.048
Somers, L. D., and McKenzie, J. M. (2020). A review of groundwater in high mountain environments. WIREs Water 7. doi:10.1002/wat2.1475
Sutrisno, L., Bonte, D., Daud, Y., Smit, J., Beekman, F., Van Wees, J. D., et al. (2019). “Assessing the role of pull-apart basins for high-temperature geothermal resources in transcurrent tectonic setting: Sumatra and California compared,” in European Geothermal Congress. June, 1–8.
Stepanov, P. P., and Yanushevich, M. A. (1971). “Gravimetric map of the USSR,” in Minstry of Geology of the USSR.
Umralin, A. (2022). Grain size, composition, and petrography of sandstone hosted geothermal aquifer: comparison of outcrop samples and drill cuttings from a deep well, Upper Cretaceous, Ily Basin, Eastern Kazakhstan (unplublished BSc field study report), 1–32.
Verestek, V., Appel, E., Voigt, S., and Frisch, K. (2018). Constrained magnetostratigraphic dating of a continental Middle Miocene section in the arid central Asia. Front. Earth Sci. 6, 49. doi:10.3389/feart.2018.00049
Voigt, S., Weber, Y., Frisch, K., Bartenstein, A., Hellwig, A., Petschick, R., et al. (2017). Climatically forced moisture supply, sediment flux and pedogenesis in Miocene mudflat deposits of south-east Kazakhstan, Central Asia. Depositional Rec. 3 (2), 209–232. doi:10.1002/dep2.34
Wang, B., Faure, M., Cluzel, D., Shu, L., Charvet, J., Meffre, S., et al. (2006). Late paleozoic tectonic evolution of the northern west Chinese tianshan belt. Geodin. Acta 19 (3–4), 237–247. doi:10.3166/ga.19.237-247
Wu, C., Wang, W., Zheng, W., Zhang, P., and Yu, Z. (2021). Opposite sense of strike-slip faulting and crustal rotation accommodating left-lateral shear between the tianshan mountains and Kazakh platform. Geophys. Res. Lett. 48 (24), 1–8. doi:10.1029/2021GL096442
Xing, Y., Yu, H., Liu, Z., Li, J., Liu, S., Han, S., et al. (2022). Study on chemical genesis of deep geothermal fluid in gaoyang geothermal field. Front. Earth Sci. 9, 1321. doi:10.3389/feart.2021.787222
Yapiyev, V., Wade, A. J., Shahgedanova, M., Saidaliyeva, Z., Madibekov, A., and Severskiy, I. (2021). The hydrochemistry and water quality of glacierized catchments in Central Asia: a review of the current status and anticipated change. J. Hydrology Regional Stud. 38 (November), 100960. doi:10.1016/j.ejrh.2021.100960
Keywords: geothermal energy, Zharkent Basin, hydrogeochemistry, pull apart basin, groundwater
Citation: Kozhagulova A, Yapiyev V, Karabayanova L, Dillinger A, Zavaley V, Kalitova A, Bayramov E, Holbrook J, Grasby SE and Fustic M (2023) Geological controls on the geothermal system and hydrogeochemistry of the deep low-salinity Upper Cretaceous aquifers in the Zharkent (eastern Ily) Basin, south-eastern Kazakhstan. Front. Earth Sci. 11:1212064. doi: 10.3389/feart.2023.1212064
Received: 25 April 2023; Accepted: 06 November 2023;
Published: 22 November 2023.
Edited by:
Jianwei Tian, Technical University of Denmark, DenmarkReviewed by:
Richeng Liu, China University of Mining and Technology, ChinaKun Tu, China University of Mining and Technology, China
Tianran Ma, China University of Mining and Technology, China
Copyright © 2023 Kozhagulova, Yapiyev, Karabayanova, Dillinger, Zavaley, Kalitova, Bayramov, Holbrook, Grasby and Fustic. This is an open-access article distributed under the terms of the Creative Commons Attribution License (CC BY). The use, distribution or reproduction in other forums is permitted, provided the original author(s) and the copyright owner(s) are credited and that the original publication in this journal is cited, in accordance with accepted academic practice. No use, distribution or reproduction is permitted which does not comply with these terms.
*Correspondence: Milovan Fustic, bWlsb3Zhbi5mdXN0aWNAbnUuZWR1Lmt6