
95% of researchers rate our articles as excellent or good
Learn more about the work of our research integrity team to safeguard the quality of each article we publish.
Find out more
ORIGINAL RESEARCH article
Front. Earth Sci. , 28 June 2023
Sec. Biogeoscience
Volume 11 - 2023 | https://doi.org/10.3389/feart.2023.1210213
This article is part of the Research Topic The Oceanic Particle Flux and its Cycling Within the Deep Water Column- Volume II View all 6 articles
 I. Salter1,2*
 E. Bauerfeind2
 K. Fahl2
 M. H. Iversen2,3
 C. Lalande4†
 S. Ramondenc2,3
 W.-J. Von Appen2
 C. Wekerle2
 E.-M. Nöthig2
The Fram Strait connects the Atlantic and Arctic Oceans and is a key conduit for sea ice advected southward by the Transpolar Drift and northward inflow of warm Atlantic Waters. Continued sea ice decline and “Atlantification” are expected to influence pelagic–benthic coupling in the Fram Strait and Arctic as a whole. However, interannual variability and the impact of changing ice conditions on deepwater particle fluxes in the Arctic remain poorly characterized. Here, we present long-term sediment trap records (2000–2013) from mesopelagic (200 m) and bathypelagic (2,300 m) depths at two locations (HGIV and HGN) in the Fram Strait subjected to variable ice conditions. Sediment trap catchment areas were estimated and combined with remote sensing data and a high-resolution model to determine the ice cover, chlorophyll concentration, and prevailing stratification regimes. Surface chlorophyll increased between 2000 and 2013, but there was no corresponding increase in POC flux, suggesting a shift in the efficiency of the biological carbon pump. A decrease in particulate biogenic Si flux, %opal, Si:POC, and Si:PIC at mesopelagic depths indicates a shift away from diatom-dominated export as a feasible explanation. Biogenic components accounted for 72% ± 16% of mass flux at 200 m, but were reduced to 34% ± 11% at 2,300 m, substituted by a residual (lithogenic) material. Total mass fluxes of biogenic components, including POC, were higher in the bathypelagic. Biomarkers and ∂13C values suggest both lateral advection and ice-rafted material contribute to benthic carbon input, although constraining their precise contribution remains challenging. The decadal time series was used to describe two end-members of catchment area conditions representing the maximum temperatures of Atlantic inflow water in 2005 at HGIV and high ice coverage and a meltwater stratification regime at HGN in 2007. Despite similar chlorophyll concentrations, bathypelagic POC flux, Si flux, Si:POC, and Si:PIC were higher and POC:PIC was lower in the high-ice/meltwater regime. Our findings suggest that ice concentration and associated meltwater regimes cause higher diatom flux. It is possible this will increase in the future Arctic as meltwater regimes increase, but it is likely to be a transient feature that will disappear when no ice remains.
Ice conditions in the Arctic Ocean are undergoing rapid changes. There has been a steady and continuous decline in the mean areal extent (Parkinson et al., 1999; Comiso et al., 2017) and sea ice thickness (Kwok, 2018; Belter et al., 2021) over recent decades. The loss of Arctic sea ice is accompanied by a reduced fraction of second-year ice and multi-year ice (MYI) resulting in large reductions of the sea ice volume (Kwok, 2018; Spreen et al., 2020). The vast majority of sea ice exported from the Arctic to the subarctic North Atlantic occurs through the Fram Strait (Serreze et al., 2006; Haine et al., 2015), and thus, sea ice characteristics in the region are considered to be representative of the Arctic basin as a whole (Hansen et al., 2013; Krumpen et al., 2016). Substantial reductions in the volume and thickness of ice exported through the Fram Strait have been reported (Hansen et al., 2013; Renner et al., 2014; Spreen et al., 2020), with a regime shift in 2007 from thicker and deformed to thinner and more uniform ice cover (Sumata et al., 2023). Modifications of Arctic sea ice characteristics impact source regions and transport rates of ice drift and associated ice-rafted matter through the Fram Strait (Krumpen et al., 2019; Spreen et al., 2020).
Related to the ongoing changes of Arctic sea ice thickness is the expansion of warm Atlantic Water (AW) into the Arctic Basin (Polyakov et al., 2017; Lind et al., 2018), the so-called “Atlantification” (Årthun et al., 2012). The decline in the sea ice extent increases ventilation and weakens stratification (Polyakov et al., 2017), resulting in an upward heat flux from underlying AWs that promotes further sea ice melt through a positive feedback loop (Polyakov et al., 2020). Century scale records indicate rapid Atlantification has occurred in the West Spitsbergen Current (WSC), a component of AW directed northward on the eastern side of the Fram Strait (Tesi et al., 2021). Shorter-term records indicate periodic warm anomalies associated with Atlantic inflows have occurred in the Fram Strait, notably in 2005 (Beszczynska-Möller et al., 2012), and a general warming of AW between 1997 and 2015 (Wang et al., 2020).
Interannual variability in sea ice and AW inflow properties in the Fram Strait are connected to long-term trends and transitions in ecosystem features (Soltwedel et al., 2016). Satellite-derived and in situ summertime chlorophyll concentrations in the WSC have shown a trend toward higher values (Cherkasheva et al., 2014; Nöthig et al., 2015; Soltwedel et al., 2016). Following the 2004–2006 warm anomaly (WA) (Beszczynska-Möller et al., 2012), phytoplankton composition in summer shifted from diatom to Phaeocystis sp. dominated (Nöthig et al., 2015). Less ice cover and higher water temperatures also appear to favor smaller phytoplankton (Vernet et al., 2017) such as Micromonas spp. (Kilias et al., 2013). Export fluxes of particulate biogenic Si (pbSi) also decreased in association with the WA (Bauerfeind et al., 2009; Lalande et al., 2013), and long-term declines in the upper-ocean particulate organic carbon (POC) and POC:TOC (total organic carbon) ratios document higher portioning of organic carbon into the dissolved phase (Engel et al., 2019) indicative of a more retentive ecosystem. An increase in the flux of pteropods was observed after the WA, including a shift from the cold-water-adapted Limacina helacina to more boreal Limacina retroversa (Bauerfeind et al., 2014; Busch et al., 2015). Similarly, increases in amphipod abundance have been documented with increasing importance of the sub-Arctic species Thermisto compressa (Kraft et al., 2011; 2013; Schröter et al., 2019). A more recent analysis shows that interannual variability, and in particular, distance to the sea ice edge, influences zooplankton swimmer composition in sediment traps (Ramondenc et al., 2022).
The reduction and thinning of Arctic sea ice leads to enhanced light penetration (Katlein et al., 2019) manifested as changes in the frequency, extent, and duration of phytoplankton blooms (Arrigo et al., 2008; Assmy et al., 2017; Horvat et al., 2020). Steady increases in Arctic primary production are attributed, at least in part, to declines in sea ice thickness and extent (Arrigo and van Dijken, 2015; Lalande et al., 2019; Ardyna and Arrigo, 2020). Furthermore, dynamics of sea ice melt are known to influence the timing (Ji et al., 2013; Janout et al., 2016; Oziel et al., 2017; von Appen et al., 2021) and size (Arrigo et al., 2012; Dybwad et al., 2021) of phytoplankton blooms. POC export tends to increase with a decline in the distance to the sea ice edge (Dybwad et al., 2021; Fadeev et al., 2021). There is a strong association of diatom-driven export in association with sea ice. Recent observations have highlighted larger annual POC export in ice-free sites influenced by AW at some distance from the ice edge (von Appen et al., 2021; Dybwad et al., 2022), although higher diatom fluxes occur in spring in association with ice edges (Lalande et al., 2016; Dybwad et al., 2022). Vertical POC flux tends to be larger when associated with diatom-derived export compared to that of Phaeocystis (Fadeev et al., 2021; Dybwad et al., 2022) and results in more effective transport to the deep ocean (Fadeev et al., 2021).
The vertical flux of POC to the deep Arctic Ocean is an important food supply for benthic communities (Wegner et al., 2020; Wiedmann et al., 2020), although long-term records of the bathypelagic flux under changing ice conditions are sparse. It is well acknowledged that changes in Arctic sea ice dynamics will exert an impact on pelagic–benthic coupling (Lalande et al., 2009; Wassmann and Reigstad, 2011), specifically through changes in cryopelagic coupling (Scott et al., 1999; Søreide et al., 2006) that is related to mass deposits of sea ice aggregates (Boetius et al., 2013; Bienhold et al., 2022), characteristic under-ice fauna (Ehrlich et al., 2021), grazer interactions (Kohlbach et al., 2016), and aggregate composition (Fadeev et al., 2021). The variable contribution of terrestrially derived organic carbon to downward flux has been documented from various systems in the Arctic (Fahl and Nöthig, 2007; Forest et al., 2007; Bauerfeind et al., 2009; Hwang et al., 2015; Nöthig et al., 2020) and may increase with depth (Sanchez-Vidal et al., 2015; Lalande et al., 2016). Regional carbon budgets suggest that lateral input is probably required to meet the benthic carbon demand (Wiedmann et al., 2020). Lateral advection (Lalande et al., 2016; Rogge et al., 2023) and transport of ice-rafted debris (Wegner et al., 2017; Krumpen et al., 2019) are both likely important mechanisms in the supply of POC to the deep ocean.
The overall aim of the present work is to describe the interannual (2000–2013) patterns in mesopelagic (200 m) and bathypelagic (2,300 m) particle fluxes at two sites of the HAUSGARTEN observatory (HGIV and HGN; Figure 1) in the eastern Fram Strait. The specific objectives were to examine 1) spatial variability in sediment trap catchment area properties, 2) interannual variability and trends between surface ocean properties and particle fluxes, 3) spatial and temporal variability in particle composition and fluxes, and 4) the impact of variable ice cover and stratification regimes on deepwater particle flux.
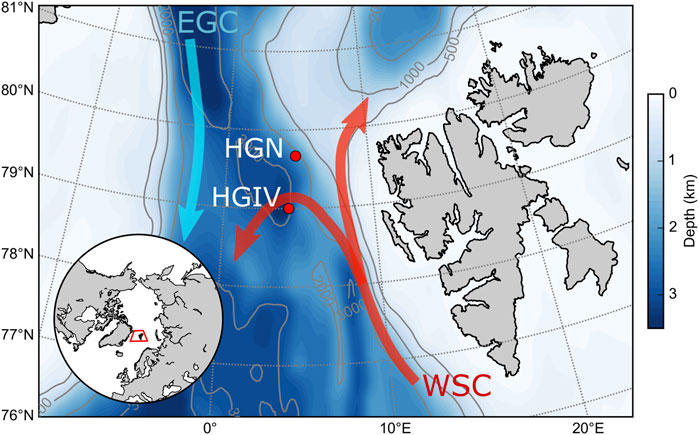
FIGURE 1. Study area. Map of the HAUSGARTEN LTER study area in the Fram Strait showing the location of the two sediment trap moorings HGIV and HGN. Red arrows show the major branches of the West Spitsbergen Current and the light blue arrow the East Greenland Current. Inset shows the position of the Fram Strait in relation to the North Atlantic and Arctic basins.
The Fram Strait is positioned between Greenland and Svalbard and is the only deepwater connection between the Nordic seas and the central Arctic Ocean, with a sill depth of approximately 2,600 m (Soltwedel et al., 2016). There are two main current systems in the Fram Strait (Figure 1). The WSC heads north along the shelf slope on the eastern part of the strait and transports warm, nutrient-rich Atlantic waters to the central Arctic Ocean (Beszczynska-Möller et al., 2012). On the western side of the strait, the East Greenland current transports cold, surface polar waters and ice southward (Smedsrud et al., 2017). It has been estimated that 90% of sea ice exported from the Arctic Ocean to the subarctic North Atlantic occurs through the Fram Strait (Serreze et al., 2006; Haine et al., 2015) such that the regional sea ice characteristics are representative of the Arctic basin as a whole (Krumpen et al., 2016; Belter et al., 2021). HAUSGARTEN is a Long-Term Ecological Research (LTER) in the Fram Strait established by the Alfred Wegner Institute, Helmholtz-Centre for Polar and Marine Research (AWI) (Soltwedel et al., 2016). As part of the LTER, AWI has maintained sediment trap moorings at some stations. In the present study, we report data from long-term 200 and 2,300 m sediment trap data from two stations (HGIV and HGN) subjected to regional variations in ice concentration (Wekerle et al., 2018).
Sinking particles were collected with modified cone-shaped automatic Kiel sediment traps (K/MT, sampling area ∼0.5 m2), each equipped with 20 collecting cups. All moorings were deployed and recovered on board RV Polarstern during summer expeditions to the Fram Strait. Sediment traps were deployed at two mooring locations positioned at approximately 79°N, 4°E (HGIV) and 79.5°N, 5°E (HGN). A total of 29 annual sediment trap deployments were collected during the study period: twelve at HGIV-200 m, nine at HGIV-2300 m, four at HGN-200 m, and four at HGN-2300 m (Supplementary Table S1). The traps were programmed to collect at high temporal resolution (7–17 days) during the productive summer season (May to September) and in longer intervals (up to 2 months) during winter. The sample collection cups were filled with filtered sterile North Sea water that was adjusted to a salinity of 40 psu through the addition of NaCl. The hypersaline seawater medium was poisoned with HgCl2 to achieve a final concentration of 0.14% (Bauerfeind et al., 2009).
Temperature and salinity sensors from Sea-bird Electronics Inc. (SBE37 and SBE16) were deployed on moorings at HGIV and HGN. The temperature measurements used in the present study are taken from instrumentation deployed at 250 m on the HGIV mooring, the level of the Atlantic Water layer flowing into the Fram Strait (Beszczynska-Möller et al., 2012).
After the recovery of the moorings, the samples were stored in a refrigerator until further processing in the laboratory. The samples were split using a wet splitting procedure (von Bodungen et al., 1991). Before splitting of samples, swimmers >0.5 mm were manually removed under a dissecting microscope at a magnification of 20–50. Pteropods were removed from the samples and the total number of individuals enumerated, differentiating between sinkers and swimmers. Organisms with no clearly visible organic content were regarded as sinkers, whereas others with intact wings and bodies were classed as swimmers. For the calculation of pteropod aragonite, shells were rinsed to remove salt and mercury chloride and weighed following precombustion at 500°C for 24 h to remove the residual organic material. A weighted mean was calculated for the shells and used to calculate the CaCO3 content of those pteropods classified as sinkers. Full details are provided in the study of Bauerfeind et al. (2014).
Subsamples of the remaining material were filtered for the subsequent analyses of bulk components (von Bodungen et al., 1991). The subsamples for total particulate matter (TPM) measurements were filtered onto pre-weighed GF/F filters (nominal pore size: 0.7 μm; 25 mm ø), rinsed with distilled water to remove salt, dried at 60°C, and weighed on a microbalance. The subsamples for CaCO3 measurements were filtered onto additional pre-weighed GF/F filters (nominal pore size: 0.7 μm; 25 mm ø) and treated like TMF filters, after which the filters were soaked in 0.1N HCl to remove inorganic CaCO3, rinsed and dried at 60°C, and weighed again on a microbalance, with the carbonate fraction representing the difference between the TPM and dissolved CaCO3. The subsamples for POC measurements were filtered onto GF/F filters (nominal pore size: 0.7 μm; 25 mm ø, pre-combusted at 500°C for 4 h), then soaked in 0.1N HCl for the removal of inorganic carbon, and dried at 60°C. POC measurements were conducted on a Carlo Erba CHN elemental analyzer and should be considered as minimum values as they were not corrected for the dissolution of organic material in the collecting cups. The subsamples for biogenic particulate silica measurements were filtered on cellulose acetate filters (pore size: 0.8 μm), processed using the wet-alkaline method (pre-treated 12 h at 85°C in an oven), and extracted for 2 h at 85°C in a shaking water bath. The flux of biogenic matter representing TPM was calculated according to the following equation:
where Fbio, FPOC, FCaCO3, and FOpal indicate the mass fluxes of biogenic matter, POC, CaCO3, and Opal, respectively. The conversion of POC to POM requires a scaling factor, which ranges from 1.8–2.3 in the literature (Boyd and Trull, 2007). In the present study, we used a lower estimate of 1.8 and it should thus be considered as a conservative estimate of POM. The calculations of residual flux and its approximation to lithogenic flux are similar to those employed and validated in previous studies (Jickells et al., 1998; Salter et al., 2010). Previous studies comparing the minimum (1.8) and maximum (2.1) scaling factors for POC to POM occasionally yield negative residual fluxes (Salter et al., 2010), and therefore, we selected the minimum value. The factor of 2.1 for pbSi is a conversion that accounts for the atomic mass of elemental Si and SiO2.
The subsamples for biomarker analyses of brassicasterol (24-methylcholesta-5, 22E-dien-3β-ol), campesterol (24-methylcholest-5-en-3β-ol), β-sitosterol (24-ethylcholest-5-en-3β-ol), and IP25 were extracted with dichloromethane/methanol (1:1, v/v) and dichloromethane using separating funnels. For the quantification of lipid compounds, the internal standards, 7-hexylnonadecane, C36 n-alkane, and androstanol (5α-androstan-3β-ol, 20 μL/sample), were added prior to further analytical steps. The different compounds (IP25 and sterols) were separated via open column chromatography (SiO2) using n-hexane (for the hydrocarbons) and ethyl acetate/n-hexane (20:80 v/v for sterols) as an eluent.
The individual sterols were silylated with 500 μL BSTFA (bis-trimethylsilyl-trifluoroacet-amide) at 60°C for 2 h. After extraction with hexane, analyses were carried out by gas chromatography–mass spectrometry (GC–MS) using an Agilent 6850 GC (30 m HP-5 MS column, 0.25 mm inner diameter, and 0.25 μm film thickness) coupled to an Agilent 5975 C VL mass selective detector. The GC oven was heated from 60°C to 150°C (rate: 15°C/min) and at 3°C/min to 320°C (20 min isothermal) for sterols and at 10°C/min to 320°C (15 min isothermal) for IP25. Helium was used as a carrier gas. Individual compound identification was based on comparisons of their retention times with that of reference compounds and on comparisons of their mass spectra with the published data (Boon et al., 1979; Volkman, 1986; Belt et al., 2007). IP25 was quantified using its molecular ion m/z 350 in relation to the abundant fragment ion m/z 266 of 7-hexylnonadecane and by means of an external calibration curve (R2 = 0.9989) to balance the different responses of the used ions (for further details, see the work of Fahl and Stein (2012)). Brassicasterol, campesterol, and ß-sitosterol were quantified as trimethylsilyl ethers using the molecular ions m/z 470, m/z 472, and m/z 486, respectively, in relation to the molecular ion m/z 348 of androstanol.
Subsamples for measurements of ∂13C were filtered on pre-combusted GF/F filters. The filters were then treated with HCL fume (24 h) to remove inorganic carbonate and were rinsed with distilled water after the treatment, dried at 60°C, and stored in a desiccator until measurement. The stable carbon isotope ratio in organic matter on the filters was determined with an isotope ratio mass spectrometer (Delta Plus Thermo-Finnigan) coupled to an elemental analyzer (NC 2500 Carlo Erba) at the Humboldt Innovation—GmbH, Berlin, and elemental contents (weight % C and N) were determined on the same sample. Isotope ratios are expressed in the δ notation with Vienna Pee Dee Belemnite (VPDB) as a reference standard for carbon. Stable isotope values are expressed in ‰ deviation relative to the standard, according to the conventional formula δ13C = [Rsample/Rstandard − 1] × 103, where R is the ratio 13C/12C.
In this study, we make use of the catchment area of sediment traps HGIV and HGN deployed in 200 m and 2,300 m depths that was determined by Wekerle et al. (2018). The catchment area of the four traps was estimated with a Lagrangian particle tracking algorithm. The particles were released once per day during the time period 2002–2009 at the depth of the trap, advected with a constant sinking velocity of 60 m d-1 and the daily mean horizontal velocity field of an ocean sea ice model, and tracked until they reached the sea surface. A sinking velocity of 60 m d-1 was selected based on the measured settling rates of marine aggregates collected in the Fram Strait (Wekerle et al., 2018). The velocity field used for back tracking was taken from a FESOM1.4 setup configured for the Fram Strait, with 1 km mesh resolution in the region 20°W-20°E/76°N-82.5°N (Wekerle et al., 2017). Particle positions at the sea surface were binned into a spatial grid and then divided by the total number of particles to determine the fraction of collected particles originating from each grid box. This resulted in a climatological two-dimensional probability distribution for the particle origin.
We calculated a time series of environmental parameters representative for the catchment areas, such as sea ice and chlorophyll-a concentrations, by weighting the concentrations with the probability distribution for the particle origin. The monthly mean sea ice concentration provided by CERSAT has been used, which is available for years 2000–2013. It is based on 85 GHz SSM/I brightness temperatures, applying the ARTIST Sea Ice (ASI) algorithm, and is available on a 12.5 × 12.5 km grid. Chlorophyll-a concentration was computed from the ESA Ocean Color CCI Remote Sensing Reflectance (merged, bias-corrected) data. It has a spatial resolution of 1 km2 and also covers years 2000–2013. More details can be found in the study of Wekerle et al. (2018). The temperature of the AW layer flowing into the Fram Strait was taken from mooring instrumentation deployed at 250 m in the core of the AW layer.
We computed the stratification regimes present in the four catchment areas based on daily mean salinity fields and mixed layer depth (MLD; defined as the shallowest depth where the deviation from surface density exceeds 0.03 kg m-3) from the ocean–sea ice model FESOM1.4. Here, an update of the model described by Wekerle et al. (2017) has been used, with the atmospheric force replaced by the ERA-interim dataset and the simulation now covering the time period 1990–2018. As in the study by von Appen et al. (2021), we distinguished between three cases: the unstratified regime (US) is defined by MLD>50 m, the mixed layer regime (ML) is defined by MLD< 50 m and a salinity difference between surface and 100 m (DS) below 1, and the meltwater regime (MW) is defined by MLD<50 m and DS >1. Each of the three criteria was computed every day during the time period 2000–2014. As described for sea ice concentration and chlorophyll-a, the different stratification regimes were weighted with the probability distribution for particle origin to obtain an estimate for the catchment areas.
Residual fluxes were calculated as the difference between TPM flux and the analytically determined biogenic fluxes according to the following equation:
where FLith is the assumed flux of the lithogenic matter, FRes is the residual mass flux, FTPM is the total particulate mass flux, FPOM (FPOC * 1.8) is the particulate organic matter flux, FOpal (pbSi * 2.1) is the flux of SiO2, and FCaCO3 is the calcium carbonate flux. Equation 1 shows the explanation of the scaling factors.
Sediment trap data were wrangled to calculate the flux values for each individual month by taking into consideration the variable opening periods between different deployments and seasons. In those instances, when multiple opening periods occurred within the same month, the daily flux values were weighted based on the proportional coverage comprising each sampling cup.
where Fmonth is the daily flux over a given month (mmol m−2 d−1), Fx is the daily flux (mmol m−2 d−1), and Ix is the sampling interval (days) of sediment trap sampling cup x. Fy and Iy correspond to sampling cup y within the same month, and n (= Ix + Iy) is the number of days in a month. Annual fluxes were calculated by integrating the daily flux values from each month. In the case that some days were missing from a given month, data were extrapolated based on the daily flux values for the given month. Deployment coverage periods are documented in Supplementary Table S1.
Flux stability indices (FSIs) were calculated by ranking each month within a sampling year in descending order and assessing the accumulation of monthly flux as a function of year day. FSI was determined as the year day when 50% of the cumulative annual flux occurred (Lampitt et al., 2001).
Modeled particle trajectories (sinking velocity = 60 m d-1) arriving in sediment traps at HGIV and HGN predominantly originated from southeast of the moorings (Figure 2). At both mooring positions, the catchment area was larger for 2,300 m deployments than 200 m deployments. Average particle trajectory lengths were 38 km and 45 km at HGIV-200 m and HGN-200 m compared to 195 km and 193 km at HGIV-2300 m and HGN-2300 m, respectively.
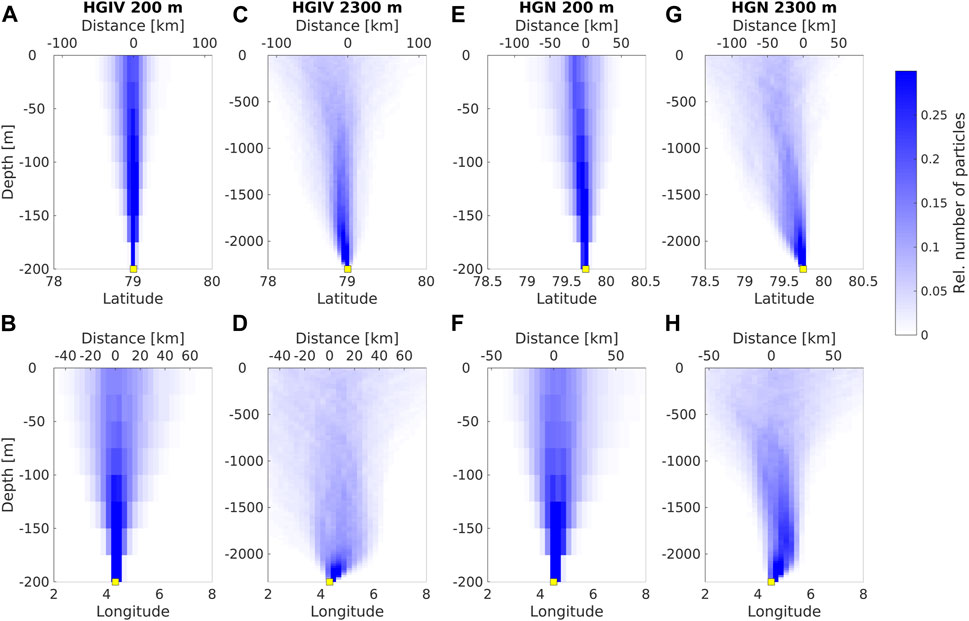
FIGURE 2. Simulated catchment areas of sediment trap moorings. Upper panels show the modeled trajectories of particles arriving at the 200 m (mesopelagic) traps at HGIV (A, B) and HGN (E, F) and at 2,300 m (bathypelagic) at HGIV (C, D) and HGN (G, H). (A, B, E, G) Latitudinal and (B, D, F, H) and longitudinal displacement of particle trajectories from the sediment trap deployment depth.
Temperature measurements are derived from the Aanderaa current meter deployed at the mesopelagic trap depth (∼200 m) and correspond to the Atlantic Water layer. There was notable variability in the temperature of the Atlantic inflow water (Figure 3) in the eastern Fram Strait with no significant long-term trend over the observation period (Tables 1, 2). The highest temperatures were observed from August to October. There was a period of enhanced warming from 2004 to 2006, with annual temperature averages ranging from 2.8–3.3°C, compared to <2.7°C during other years.
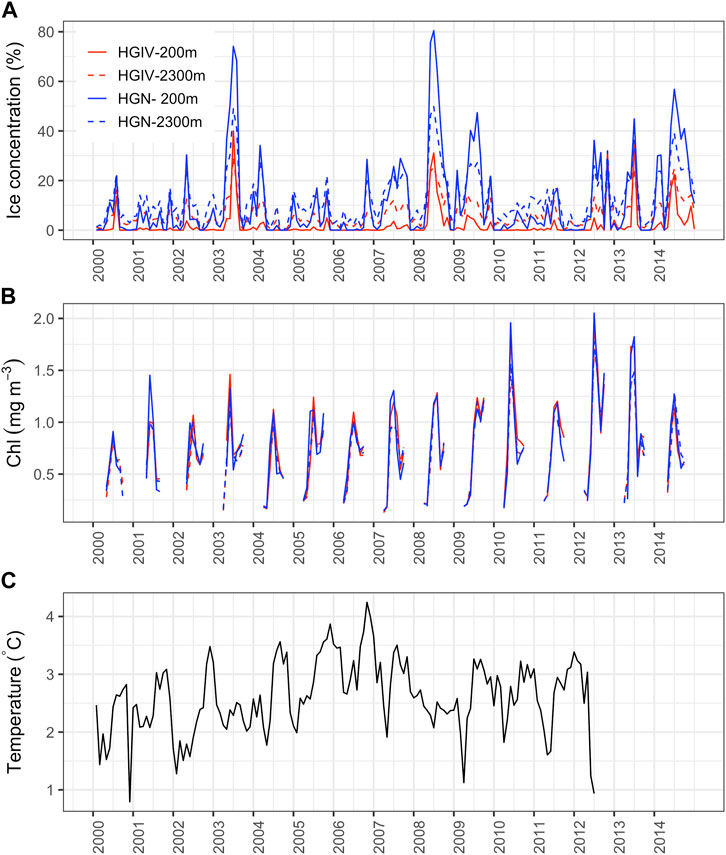
FIGURE 3. Temporal trends of environmental conditions in the Fram Strait. Line plots of monthly integrated values of environmental parameters. (A, B) Remote sensing data obtained from the four simulated sediment trap catchment areas: HGIV-200 m (solid red line), HGIV-2,300 m (dashed red line), HGN-200 m (solid blue line), and HGN-2,300 m (dashed blue line). Correlations between catchment area conditions are in Supplementary Figure S1. (C) Temperature data taken from mooring instrumentation deployed at 250 m at HGIV to measure changes in the temperature in AW inflow to the Fram Strait (Beszczynska-Möller et al., 2012).
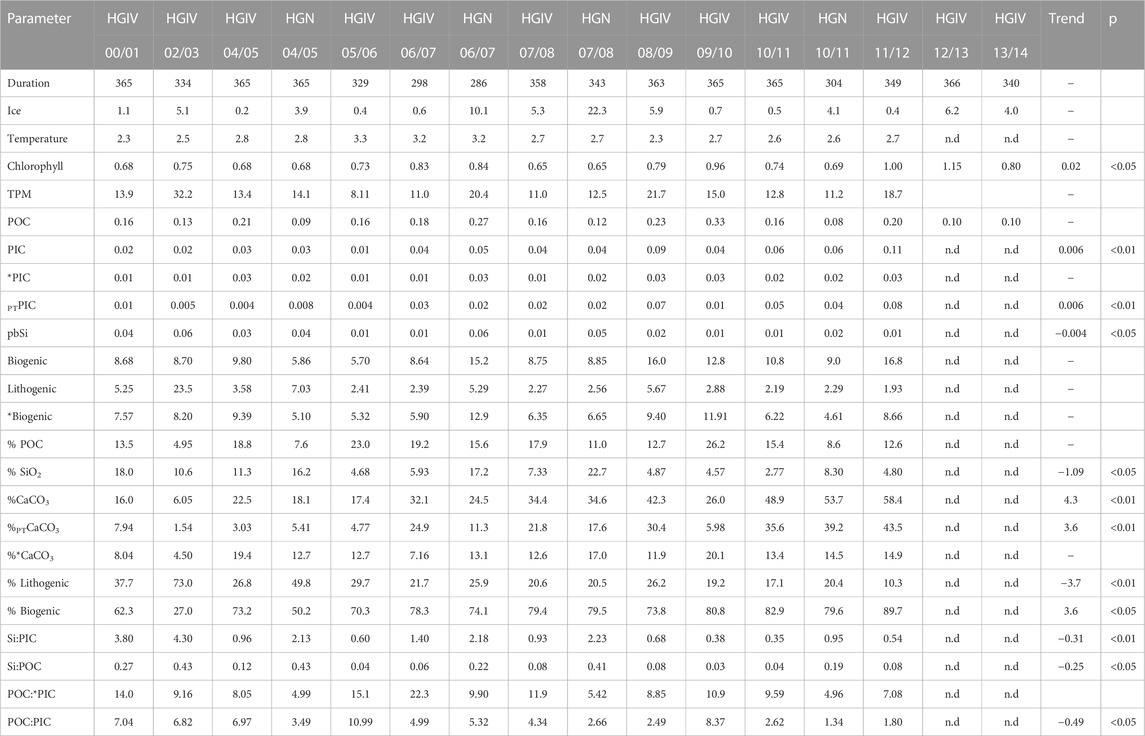
TABLE 1. Annually integrated values of flux data from mesopelagic sediment trap deployments. Ice cover and chlorophyll (Chl) are annual averages within catchment areas. Temperature (Temp.) data are taken from instrumentation deployed at 250 m on HGIV mooring and are taken as a representative of Atlantic inflow to the Fram Strait. All fluxes are in mol m-2 yr-1, except TPM, biogenic, and lithogenic fluxes, which are in g m-2 yr-1. *PIC is particulate inorganic carbon fluxes excluding the contribution of pteropods, and PTPIC is the pteropod-derived contribution to particulate inorganic carbon. Parameters separated by a colon are stoichiometric molar ratios. Temporal trends with year are classified either as no trend (dash), increasing (positive), or decreasing (negative) with time. p values are significance levels of linear regressions.

TABLE 2. Same as Table 1 for bathypelagic deployments.
Satellite-derived surface chlorophyll values in catchment areas were comparable between HGIV and HGN (Supplementary Figure S1) and between mesopelagic and bathypelagic catchment areas (Figure 3). There was a significant increase (p<0.05) in the surface chlorophyll values between 2000 and 2014 in both mesopelagic and bathypelagic catchment areas (Tables 1, 2). A maximum annual average of chlorophyll of 1.15 mg m-3 was observed during the 2012–2013 sampling period, compared to 0.68 mg m-3 in 2000–2001 (HGIV-200 m). The monthly chlorophyll concentrations peaked in May and June with late summer peaks occasionally occurring in September (Figure 3).
Ice concentration in the sediment trap catchment areas exhibited strong regional and interannual variability (Figure 3). The annually averaged ice concentration was higher at HGN than HGIV Supplementary Figure S1. In the 200 m catchment areas, annual ice concentration averages were 12.1% ± 8.6% at HGN and 2.0% ± 2.4% at HGIV (p<0.01). At HGIV, ice concentration was higher in the bathypelagic catchment areas. At HGIV 2,300 m, the average annual ice concentration was 7.9% ± 2.9% and 11.9% ± 5.1% at HGN (not significant) (Table 3). Annual ice coverage was consistently higher at HGN than HGIV at both mesopelagic and bathypelagic depths (Supplementary Figure S1). In all catchment areas, sea ice concentration displayed strong seasonal variability, with the highest ice coverage typically occurring in June. Years with the highest sea ice concentration in catchment areas occurred in 2003, 2008, and 2014 (Figure 3; Tables 1, 2).
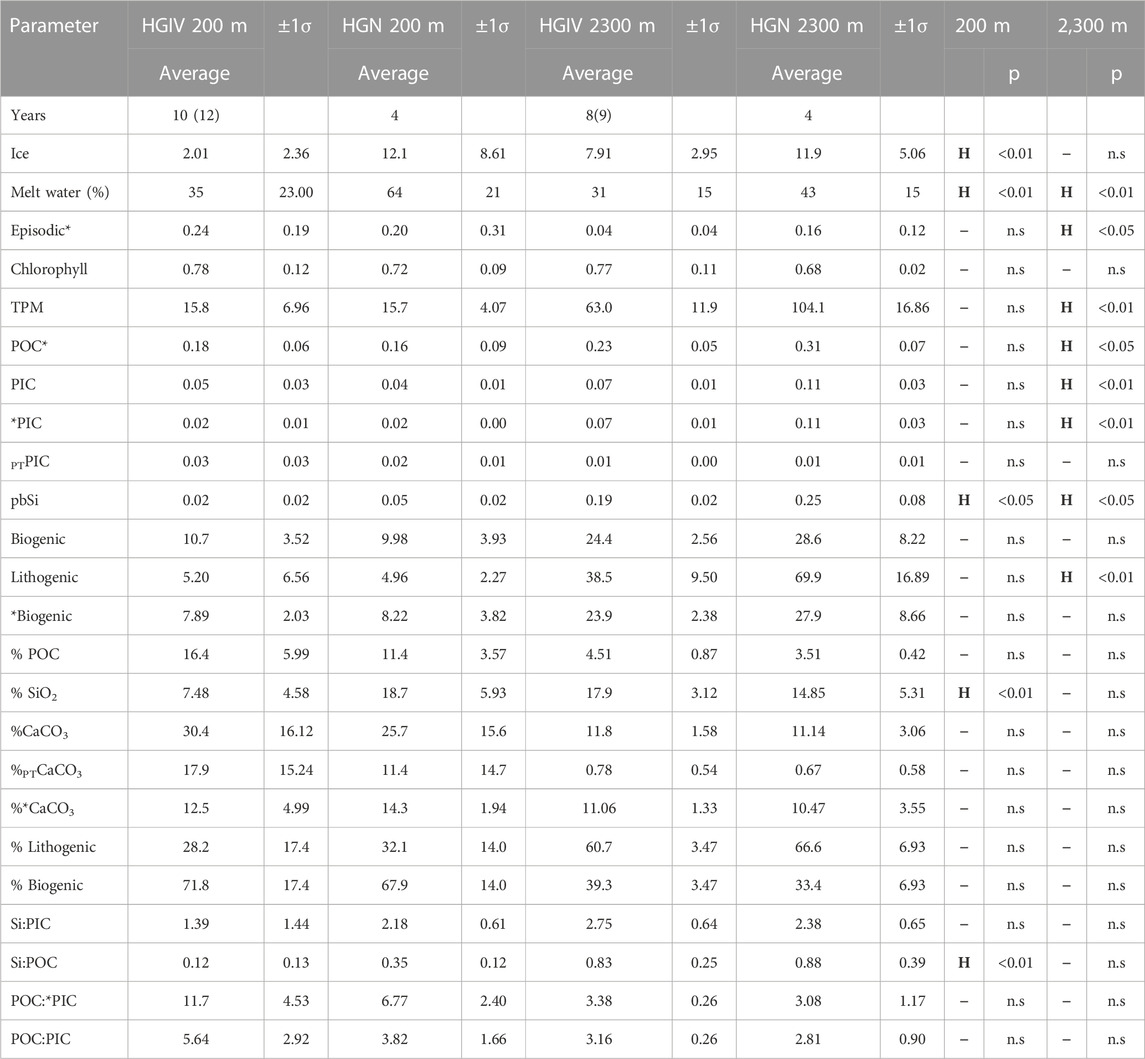
TABLE 3. Annual averages and standard deviation of sediment trap flux parameters and environmental variables in catchment areas for mesopelagic deployments (200 m) and bathypelagic deployments (2,300 m). The number of years comprising each average is documented in the first data row, whereby the number in parentheses corresponds to those parameters marked by *. Units are same as those described in Tables 2, 3. Two-tailed t-tests were carried out to compare averages between HGN and HGIV sediment trap locations. If a parameter is significantly larger at HGN, it is marked by a “H” and lower by an “L” or a dash if not significant. Statistical significance is reported as p-values.
The model output of mixed layer depth and salinity profiles within the sediment trap catchment areas were used to define three different physical regimes: 1) an unstratified regime (US), 2) a mixed layer regime (ML), and 3) a melt water regime (MW) (section 2.7). The average proportion of mesopelagic catchment areas comprised by a MW regime at HGN was 64%, compared to 35% at HGIV (Figures 4A,B). The bathypelagic catchment areas were typically characterized by a lower proportion of MW regime (Figures 4C,D), although it was higher at HGN (43%) than HGIV (31%). There was significant interannual variability in catchment areas characterized as MW regimes at HGN and HGIV, with maxima occurring at both mesopelagic and bathypelagic depths in 2003, 2008, and 2014. The proportion of catchment area represented by MW regimes was consistently higher at HGN than HGIV at mesopelagic and bathypelagic depths (Supplementary Figure S1) and differences in annual means were statistically significant at both depths (Table 3).
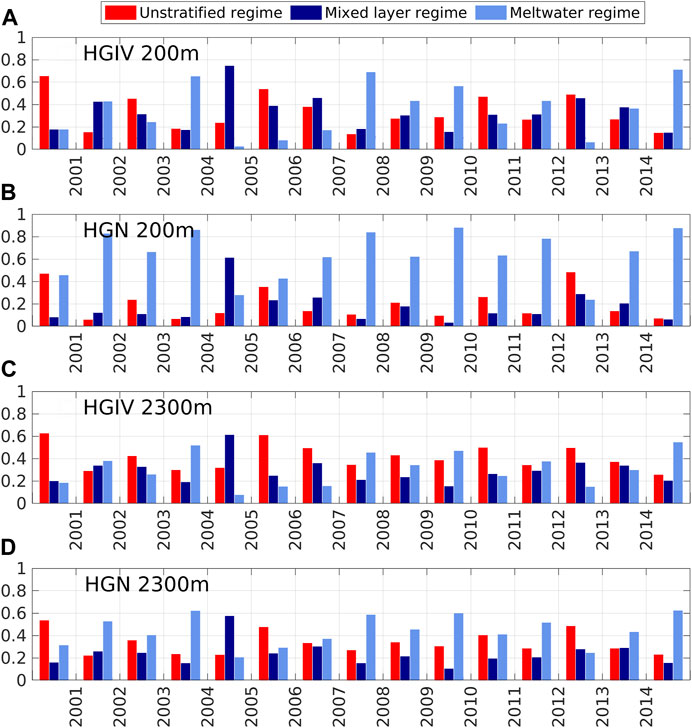
FIGURE 4. Temporal trends of modeled stratification regimes in catchment areas. Bar charts of different stratification regimes modeled in simulated catchment areas for moorings HGIV (A, C) and HGN (B, D) deployed in water depths of 200 m and 2,300 m. Values are averaged over spring (March–May) of each year from 2000 to 2014, computed from salinity and mixed layer depth output of the ocean sea ice model FESOM1.4. Red, dark blue, and light blue colors indicate the fractions of an unstratified regime (MLD>50 m), a mixed layer regime (MLD<50 m and (S100 m - S0m)<1), and a meltwater regime (MLD>50 m and (S100 m - S0m)>1), respectively.
Particulate matter composition at 200 m was dominated by biogenic flux components, accounting for 72% ± 17% (HGIV) and 68% ± 14% (HGN) of the average annual TPM fluxes (Table 3). Although highly variable (Figure 5), average %POM and %CaCO3, either as total or pteropod-derived inorganic carbon, were not statistically different between the two sediment trap positions HGN and HGIV (Table 3). The mass contribution of biogenic opal (SiO2) was approximately two-fold higher (p<0.05) at HGN (19% ± 6%) than at HGIV (8% ± 5%). There was a notable shift in composition between 200 m and 2,300 m depth, with approximately two-fold higher (>60%) contribution of the residual mass (Figure 5; Table 3). The particulate matter composition of biogenic material at 2,300 m (POC, CaCO3, and SiO2) was similar at the two sites. There were three-fold reductions in the contribution of POC and CaCO3 between 200–2,300 m and pteropod-derived CaCO3 decreased from 11–18% at 200 m to <1% at 2,300 m (Table 3).
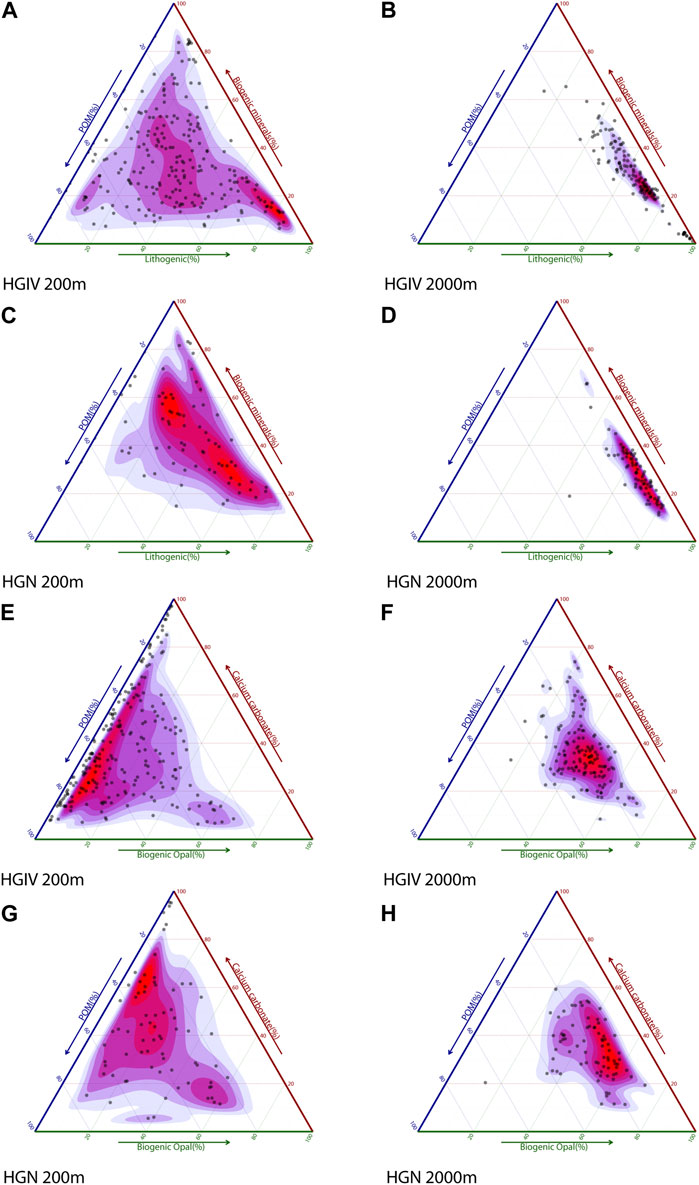
FIGURE 5. Composition of the total particulate matter flux. Ternary plots of relative particle composition in sediment traps. (A–D) TPM composition expressed as POM, biogenic minerals (SiO2 and CaCO3), and lithogenic fluxes. (E–H) Composition of the biogenic fraction (TPM minus lithogenic flux) expressed as POM, biogenic opal (SiO2), and calcium carbonate (CaCO3).
Average annual TPM fluxes (Table 3) at 200 m were similar at both stations: 16 ± 7 and 16 ± 4 g m-2 yr-1 at HGIV and HGN, respectively. Annual TPM at 2,300 m increased four-fold at HGIV (63 ± 12 g m-2 yr-1) and six-fold at HGN (104 ± 17 g m-2 yr-1). These increases were driven both by biogenic and residual fluxes (Table 3), although the increase in residual flux was considerably larger (33–65 g m-2 yr-1) than biogenic flux (14–19 g m-2 yr-1). Average annual residual flux at 2,300 m was higher at HGN than at HGIV (p<0.01). At 200 m at HGIV, an anomalously large residual flux of 402 mg m-2 d-1 was observed in May 2003 (Figure 6A).
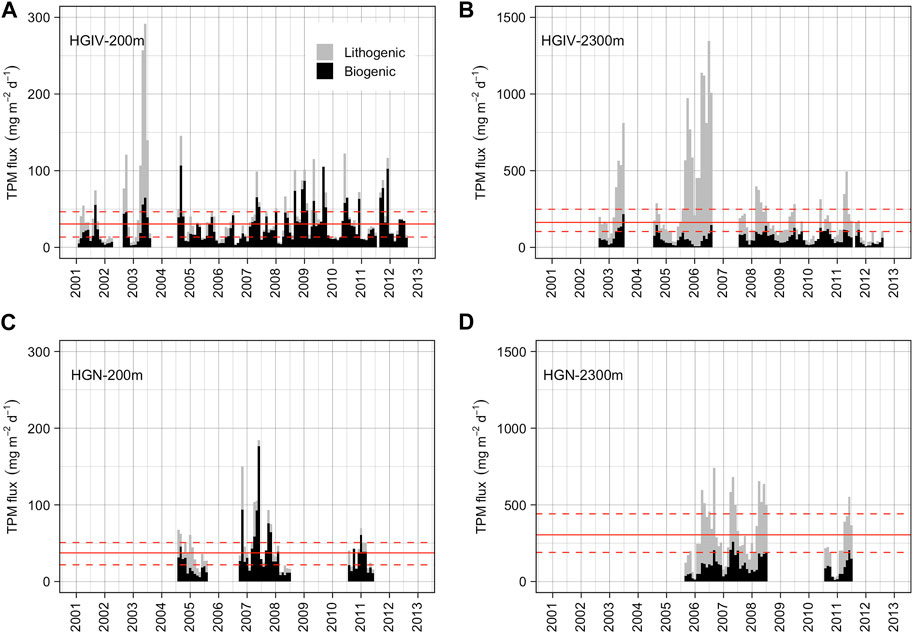
FIGURE 6. Total particulate mass flux. Monthly integrated values of TPM flux at HGIV (A, B) and HGN (C, D) at mesopelagic (A, C) and bathypelagic (B, D) deployment depths. Black bars are the sum of biogenic material (POM, SiO2, and CaCO3) and grey bars lithogenic (residual) fluxes. Solid red line is the arithmetic mean across the time series, and dashed red lines are ±1 standard deviation.
Average annual POC fluxes at 200 m were similar at both stations: 0.18 ± 0.06 and 0.16 ± 0.09 mol m-2 yr-1 at HGIV and HGN, respectively (Table 3). Average daily flux values were also similar: 0.49 ± 0.52 and 0.46 ± 0.69 mmol m-2 d-1, respectively (Figures 7A,C). At both sites, POC fluxes exhibited a bimodal flux pattern with a spring export event typically occurring in April or May and a subsequent summer export event occurring in August or September (Figure 8A). Annual POC fluxes were enhanced at 2,300 m compared to 200 m, notably at HGN where it was two-fold higher (p<0.05) (Table 3). Average daily POC fluxes were significantly larger at 2,300 m depths at both sites (Figures 7A–D), increasing to 0.62 ± 0.55 mmol m-2 d-1 at HGIV (p<0.05) and 0.91 ± 0.50 mmol m-2 d-1 at HGN (p<0.01). Unlike at 200 m, average daily POC flux at 2,300 m was significantly larger at HGN (p<0.01). POC flux at 2,300 m exhibited a broad unimodal flux pattern with enhanced fluxes occurring from March to September (Figure 8B) and notably higher monthly flux averages during the spring period at HGN.
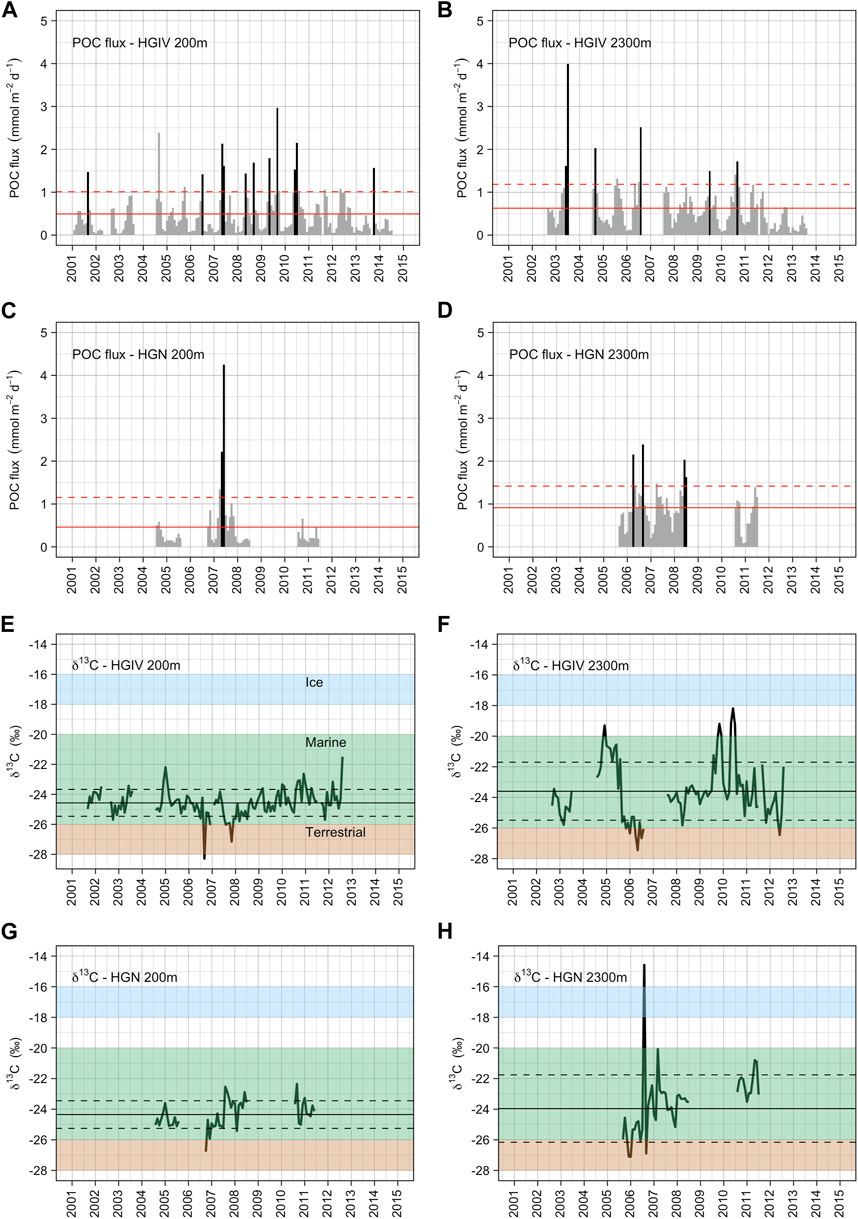
FIGURE 7. Particulate organic carbon flux and 13C isotopic signature of POC. Monthly integrated values of POC flux at HGIV (A, B) and HGN (C, D) at mesopelagic (A, C) and bathypelagic (B, D) deployment depths. Black bars are monthly fluxes defined as episodic flux events (see methods), and grey bars are normal (non-episodic) fluxes. Solid red line is the arithmetic mean across the time series, and the dashed red line is +1 standard deviation. Stable carbon isotope values (∂13C) of POC flux at HGIV (E, F) and HGN (G, H) at mesopelagic (E, G) and bathypelagic (F, H) deployment depths. Shaded boxes correspond to typical literature values for ice-, marine-, and terrestrial-derived organic carbon. Black line is the arithmetic mean across the time series, and dashed black lines are ±1 standard deviation.
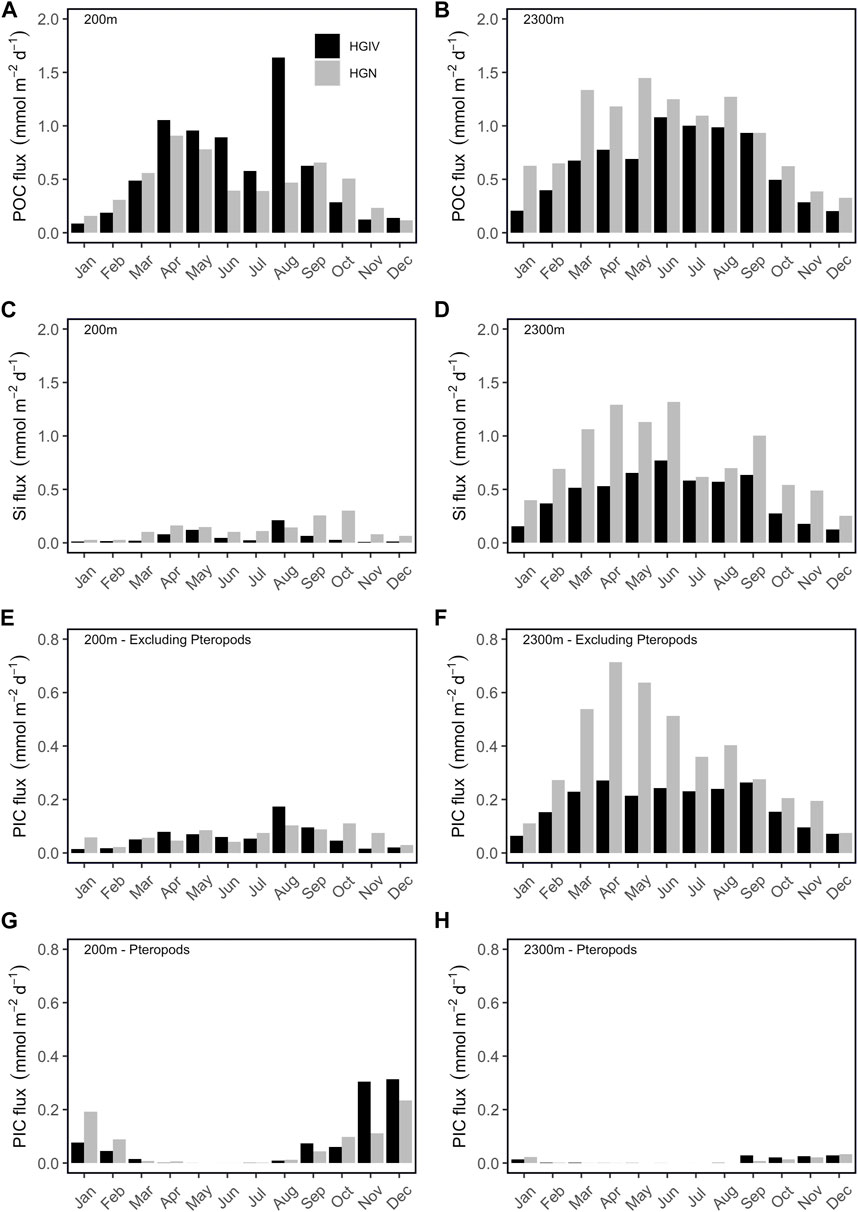
FIGURE 8. Monthly flux climatologies. Monthly climatologies of selected flux parameters at HGIV and HGN at mesopelagic (200 m) and bathypelagic (2,300 m) depths. (A, B) Particulate organic carbon flux, (C, D) particulate biogenic silicon flux, (E, F) particulate inorganic carbon flux excluding the contribution of pteropods, and (G, H) pteropod-derived inorganic carbon flux.
The relative proportion of monthly averaged POC fluxes categorized as episodic events (greater than 1.5x standard deviation of the long-term mean) was similar between HGIV and HGN at both 200 m (4–8%) and 2,300 m (5–9%). The longer time series at HGIV indicates a decrease in episodicity with an increase in depth (Figures 7A,B). FSIs calculated from monthly POC flux climatologies (Figures 8A,B) were lower at 200 m, 95 and 101 days, than at 2,300 m, 107 and 126 days, at HGIV and HGN, respectively.
∂13C isotope values displayed significant temporal and regional variability (Figures 7E–H). The average daily flux value was similar at both stations: −24.6‰ ± 0.9‰ and −24.4‰ ± 0.9‰ at HGIV and HGN, respectively. In the deeper samples, ∂13C values were slightly enriched at both stations: −23.6‰ ± 1.9‰ and −23.9‰ ± 2.2‰, respectively. Values at 200 m were not enriched beyond −21.5‰, in contrast to 2,300 m samples where the values were occasionally greater than −20‰, reaching a maximum enrichment of −18.2‰ and −14.6‰ at HGIV and HGN, respectively (Figures 7E–H). At both stations, ∂13C were depleted to minimum values < −26‰ in 2006 at both 200 and 2,300 m.
The average annual pbSi flux at 200 m was significantly higher (p<0.05) at HGN (0.05 ± 0.02 mol Si m-2 yr-1) than at HGIV (0.02 ± 0.02 mol Si m-2 yr-1) (Table 3). The average daily flux at HGN of 0.12 ± 0.16 mmol Si m-2 d-1 was approximately double that at HGIV (Figures 9A,B). At both sediment trap deployment locations, 200 m pbSi fluxes exhibited a bimodal pattern (Figure 8C), peaking in March to May at HGIV and HGN and from August to September at HGIV and from September to October at HGN. The annual pbSi mesopelagic fluxes in the Fram Strait displayed a significant (p<0.05) decrease over the observation period (Table 1). At 2,300 m, pbSi fluxes were enhanced compared to 200 m (Figures 9C,D). The annual fluxes at 2,300 m were a factor of 10 (0.19 ± 0.02 mol Si m-2 yr-1) and 5 (0.25 ± 0.08 mol Si m-2 yr-1) higher at HGIV and HGN, respectively (Table 3). Similarly, average daily fluxes of 0.42 ± 0.32 mmol Si m-2 d-1 at HGIV and 0.77 ± 0.50 mmol Si m-2 d-1 at HGN were higher at 2,300 m (Figures 9A–D) than at 200 m. The bimodal flux patterns in pbSi fluxes observed at 200 m were also evident at 2,300 m (Figure 8D), although spring fluxes (March to June) were notably higher at HGN. At both 200 m and 2,300 m, the annual pbSi fluxes were significantly higher (p<0.05) at HGN than at HGIV (Table 3).
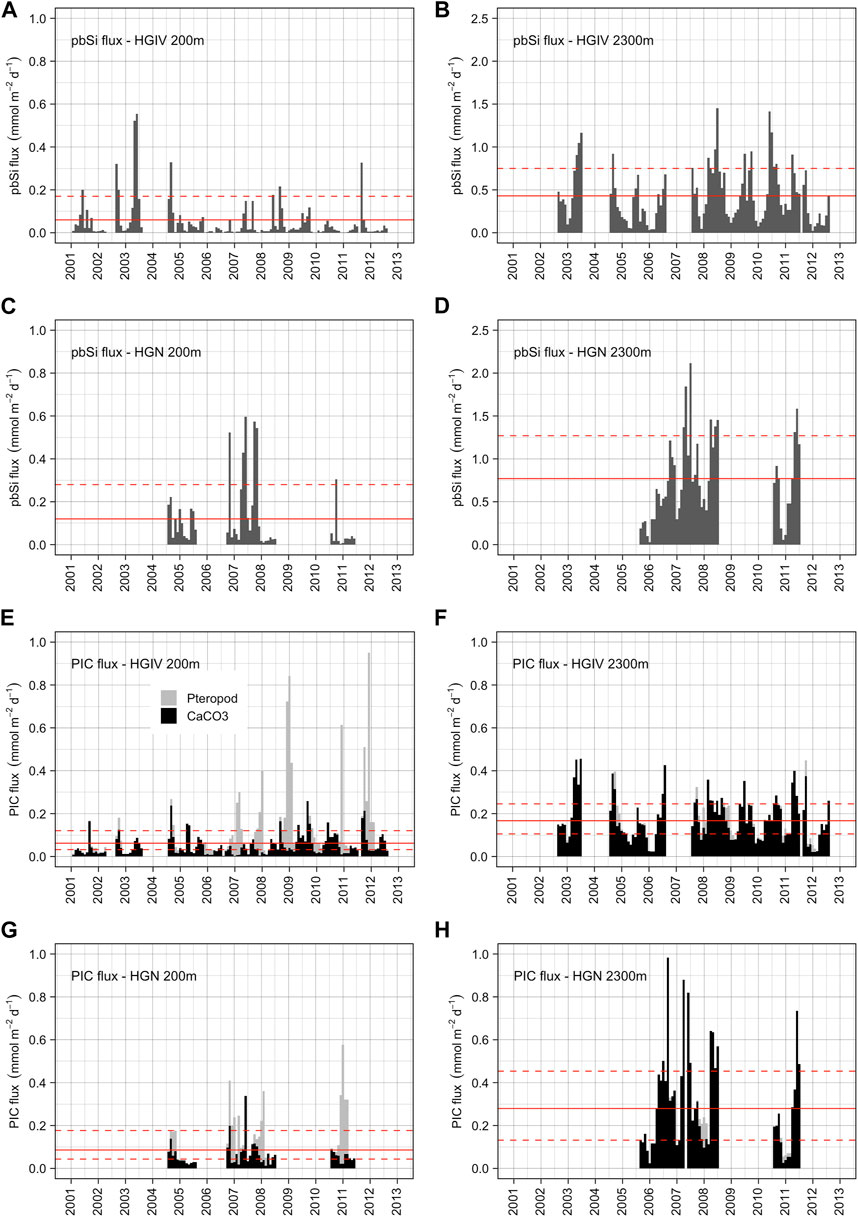
FIGURE 9. Biogenic mineral fluxes. Monthly integrated values of pbSi fluxes at HGIV (A, B) and HGN (C, D) at mesopelagic (A, C) and bathypelagic (B, D) deployment depths. Solid red line is the arithmetic mean across the time series, and dashed red lines are ±1 standard deviation. Monthly integrated values of PIC (CaCO3) fluxes at HGIV (E, F) and HGN (G, H) at mesopelagic (E, G) and bathypelagic (F, H) depths. Black bars are CaCO3 fluxes excluding the contribution of pteropods, and grey bars are CaCO3 fluxes attributed to pteropod aragonite. Solid red line is the arithmetic mean across the time series, and dashed red lines are ±1 standard deviation.
Average annual PIC flux at 200 m was similar: 0.05 ± 0.03 and 0.04 ± 0.01 mol C m-2 yr-1 at HGIV and HGN, respectively (Table 3). The partitioning of the total PIC average daily fluxes between pteropod-derived (PTPIC) and non-pteropod (*PIC) was 0.06 ± 0.15 cf. 0.05 ± 0.05 mmol C m-2 d-1 at HGIV and 0.07 ± 0.12 cf. 0.06 ± 0.05 mmol C m-2 d-1 at HGN (Figures 9E–H). Approximately 50% partitioning between the two CaCO3 components was analogous for annual flux averages (Table 3). The larger relative errors for PTPIC are due to a strong temporal trend that displays an increase in the mesopelagic over the observation period (Table 1). The pteropod-CaCO3 (PTPIC) fluxes at 200 m showed a strong seasonal signal, peaking in the period of September to February (Figure 8G). At HGIV, PTPIC fluxes peaked in November and December and slightly later in December and January at HGN. Non-pteropod (*PIC) fluxes showed a characteristic bimodal pattern, with higher fluxes observed during late summer (August to September) (Figure 8E). There were no significant differences in any PIC flux components between the high-ice (HGN) and low-ice (HGIV) catchment areas (Table 3). PTPIC fluxes were substantially reduced at 2,300 m, and annual averages accounted for approximately 17% of those measured at 200 m at both HGIV and HGN (Table 3). *PIC flux at 2,300 m was significantly higher than at 200 m.
Annual Si:POC molar ratios at 200 m were significantly higher at HGN (0.35 ± 0.12) than HGIV (0.12 ± 0.13) and were 3–6 times higher at 2,300 m (Table 3). At 200 m, there was a statistically significant decrease (p<0.05) in Si:POC and Si:PIC from 2000 to 2013 (Table 1). Si:PIC ratios were similar at HGIV and HGN and approximately two-fold higher at bathypelagic depths (Table 3). POC:PIC ratios were calculated both including and excluding the contribution from pteropod-derived aragonite. Including aragonite lowered the POC:PIC ratios by approximately half at 200 m, but had a negligible effect at 2,300 m (Table 3). At 200 m, the POC:PIC ratios were approximately double at HGIV (11.7 ± 4.5) compared to HGN (6.8 ± 2.4).
Due to a paucity of data (Figure 10), sites HGIV and HGN were grouped for the comparison of biomarker fluxes and comparisons made explicitly between mesopelagic and bathypelagic depths. The average daily flux of terrestrial sterols was higher at 200 m than at 2,300 m, 5.0 ± 11.6 and 2.4 ± 2.7 μg m-2 d-1, respectively (Figure 10A), although not significantly different. Organic carbon-normalized concentrations of terrestrial sterols were significantly higher (p<0.001) at 200 m (558 ± 583 μg gC-1) than at 2,300 m (217 ± 179 μg gC-1) (Figure 10B). The average flux of the sea ice diatom biomarker IP25 was comparable at 2,300 m (1.6 ± 1.4 ng m-2 d-1) and 200 m (1.1 ± 3.1 ng m-2 d-1), and organic carbon-normalized concentrations were also similar: 174 ± 143 at 2,300 m and 196 ± 462 ng gC-1 at 200 m (Figures 10C,D). The flux and organic carbon-normalized concentration of diatom specific fatty acids (Figures 10E,F) were both significantly higher (p<0.001) at 200 m than at 2,300 m: 525 ± 1095 cf. 16 ± 22 μg m-2 d-1 and 49 x 103 ± 56 x 103 cf. 1.6 x 10³ ± 1.9 x 10³ μg gC-1, respectively. The flux and organic carbon-normalized concentration of dinoflagellate specific fatty acids (Figures 10G,H) were both significantly higher (p<0.001) at 200 m than at 2,300 m: 138 ± 367 cf. 0.3 ± 0.4 μg m-2 d-1 and 12 x 103 ± 19 x 103 cf. 0.03 x 10³ ± 0.04 x 10³ μg gC-1, respectively. At 2,300 m, dinoflagellate-specific fatty acid concentrations (normalized to organic carbon) were 0.23% of those measured at 200 m, compared to 3.2% for diatom-specific fatty acids. The longest biomarker record at HGIV shows a significant increase in the concentration of diatom-specific (28.9 μg/gC) and dinoflagellate-specific fatty acids (9.3 μg/gC) over a period from 2000–2009 (Figures 10F,H).
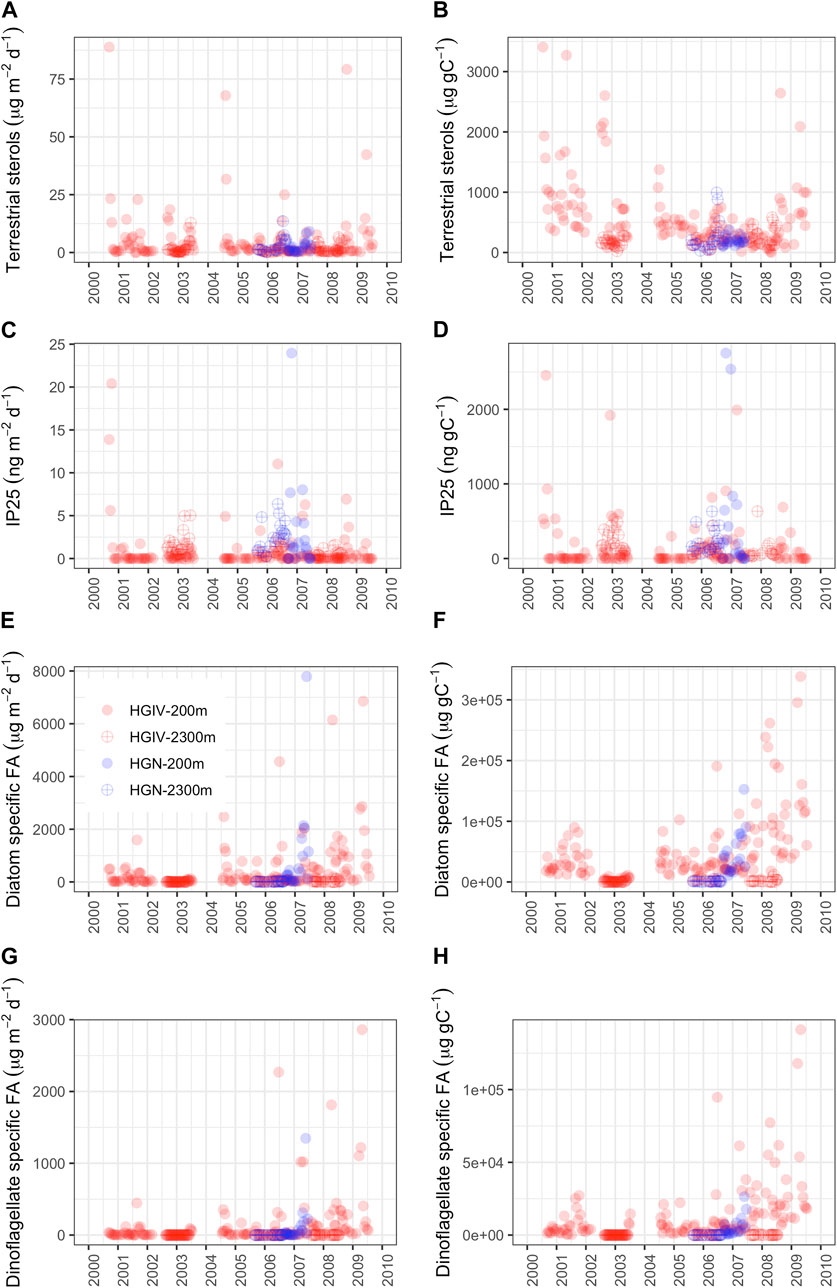
FIGURE 10. Biomarker data from sediment trap samples. Colored symbols represent the different sediment traps at HGIV 200 m (red closed), HGIV 2,300 m (red open), HGN 200 m (blue closed), and HGN 2,300 m (blue open). (A, C, E, G) Absolute fluxes and (B, D, F, H) particulate organic carbon-normalized concentrations. (A, B) Sum of terrestrial sterol biomarkers campesterol and ß-sitoserol, (C, D) sea ice diatom biomarker IP25, (E, F) diatom-specific fatty acids 16:1(n-5), 16:1(n-7), and 20:5, and (G, H) dinoflagellate-specific fatty acids 18:4 and 22:6.
The sediment trap datasets were used to construct two annual records of bathypelagic particle flux, corresponding to those obtained during high-temperature/low-ice (HGIV-2005) and low-temperature/high-ice (HGN-2007) (Figures 11A,D). Comparison of these two end-members in fluxes and catchment area conditions allowed us to explore the impact of varying ice and temperature on particle flux parameters to the deep ocean. HGN-2007 catchment areas were characterized by higher ice cover (Figure 11A) and a greater proportion of meltwater regimes (Figure 11G), and HGIV-2005 catchment areas were characterized by higher temperatures (Figure 11D). Seasonal progression and chlorophyll concentrations were similar in both end-member situations (Figure 11B). Annually integrated fluxes of POC, PIC, and pbSi were enhanced 1.5, 4, and 4 times, respectively, in the high-ice HGN-2007 end-member (Table 4). Monthly flux values showed that these biogenic flux components in HGN-2007 were notably elevated from February to May (Figures 11E,H,K). The Si:POC ratios were consistently higher in the high-ice catchment area. In contrast, the POC:PIC ratios were notably lower under enhanced ice cover (Figure 11I), resulting in an annual ratio of 2 at HGN-2007, compared to 5 at HGIV-2005 (Table 4).
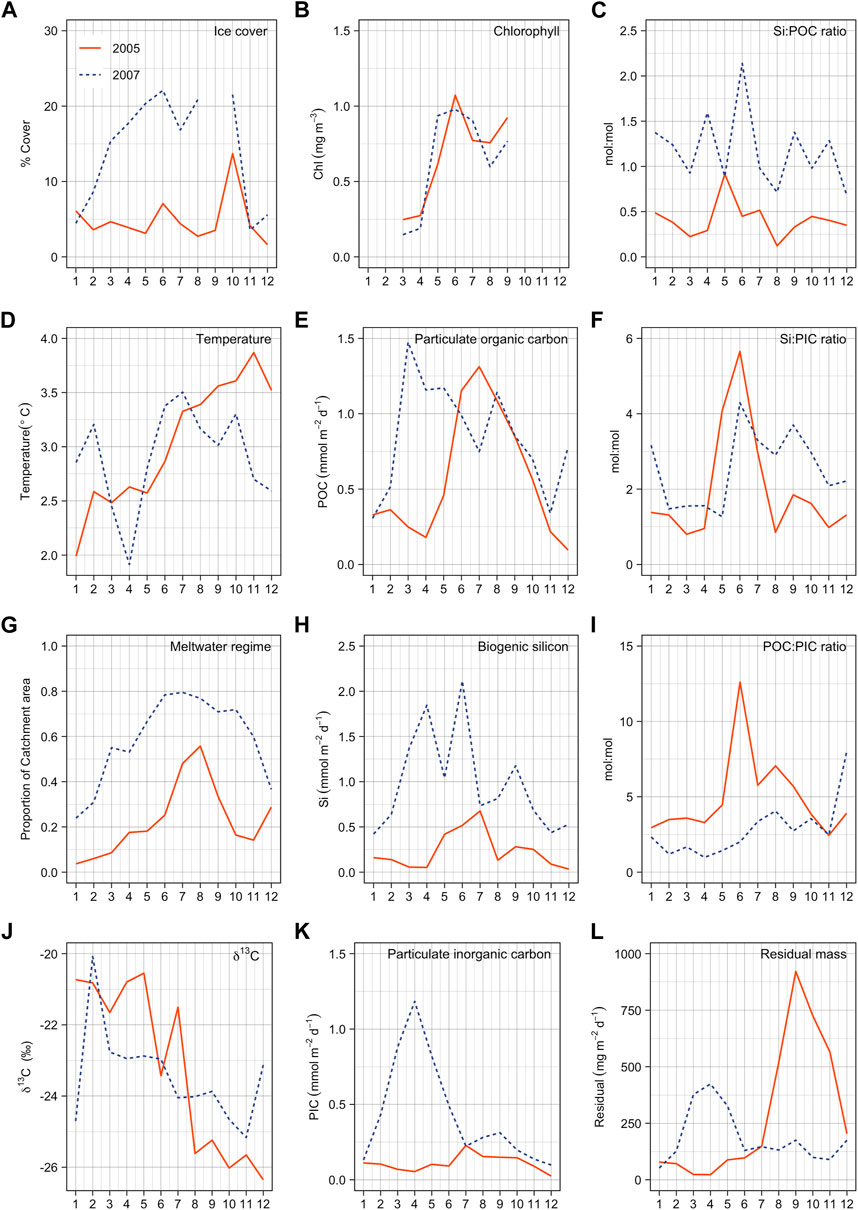
FIGURE 11. Monthly environmental and bathypelagic flux parameters for two example years. Colored lines correspond to different extremes of environmental forcing within the sediment trap catchment areas. Red line (HGIV 2005) is the maximum temperature and blue-dashed line (HGN 2007) the high-ice year. Parameters are noted in the upper right corner of panels. Integrated annual fluxes are reported in Table 4. Temperature (Temp.) data are taken from instrumentation deployed at 250 m on HGIV mooring and is taken as a representative of Atlantic inflow to the Fram Strait. Panel (A) is % ice cover, (B) chlorophyll and (G) proportion of meltwater regime in sediment trap catchment area. (D) is temperature measured at 250 m from instrumentation on HGIV mooring. (E, H, K, L) are fluxes in sediment traps. (C, F, I) are molar stoichiometric ratios. (J) is stable isotope values of POC.
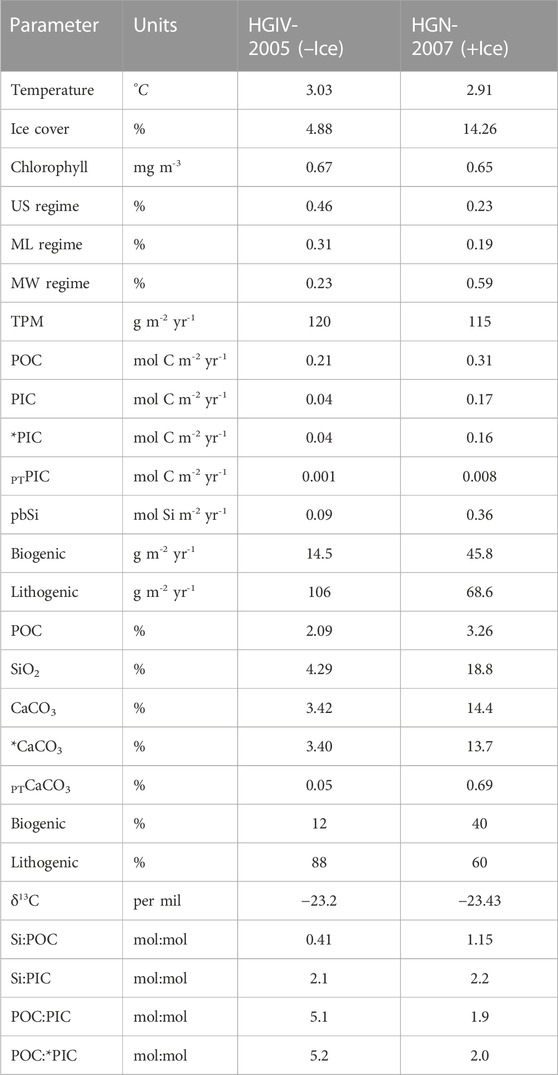
TABLE 4. Annual flux values from +Ice and –Ice end-members. Units are same as described in Table 2. US, ML, and MW are unstratified, mixed layer, and melt water regimes, respectively. The percentage value for regimes corresponds to the proportion of the simulated sediment trap catchment area represented by each regime.
The primary objective of the present study was to compare mesopelagic and bathypelagic fluxes in two locations characterized by different environmental conditions in sediment trap catchment areas. Satellite-derived ice coverage shows that both mooring positions are located in a marginal ice zone (MIZ). Despite considerable interannual variability over the observation period, monthly and annual ice cover was consistently higher at HGN than HGIV (Figure 3; Supplementary Figure S1), although only significantly different in mesopelagic catchment areas (Table 3). The more northerly position and, thus, northward-displaced catchment areas at HGN (Wekerle et al., 2018) resulted in a higher proportion of particles originating in surface waters intersecting the pathway of southward (transpolar drift) ice export from the Siberian shelves (Krumpen et al., 2019). Variable ice export and subsequent melting in the Fram Strait influence the prevailing stratification regimes (Figure 4). Building on previous work (von Appen et al., 2021), we employed an eddy-resolving sea ice ocean model (Wekerle et al., 2017) to estimate the proportion of sediment trap catchment areas that were represented by MW and ML stratification regimes. Consistent with higher ice coverage, HGN was characterized by a higher proportion of MW regimes, with significant interannual variability corresponding to changes in sea ice export through the Fram Strait (Min et al., 2019). Fundamental differences in the ice properties of sediment trap catchment areas were used as a basis to examine the impact of variable ice cover, temperature, and MW regimes on mesopelagic and bathypelagic flux characteristics.
An increase in phytoplankton biomass has been reported in the Fram Strait over the observation period (2000–2013). Increases in satellite-derived chlorophyll concentrations (Chl) at HGIV were statistically significant in both mesopelagic and bathypelagic catchment areas (Tables 1, 2), and long-term trends are significantly correlated at HGN and HGIV (Supplementary Figure S1). Previous studies in the Fram Strait have reported increasing Chl concentrations from both in situ (Nöthig et al., 2015) and remote sensing data (Cherkasheva et al., 2014; Wekerle et al., 2018). The warming of AW entering the Fram Strait (Beszczynska-Möller et al., 2012) may explain increasing Chl concentrations (Nöthig et al., 2015), potentially mediated through enhanced sea ice melt and stratification (Cherkasheva et al., 2014). Validation of this trend in sediment trap catchment areas from different depths provides an opportunity to examine the resulting impact of this increasing productivity on POC fluxes. Our data show that annual POC fluxes have not increased in line with Chl concentrations at either mesopelagic or bathypelagic depths. In contrast, there was some indication of decreasing values of POC flux, although these are not statistically significant (Tables 1, 2).
Our findings indicate that despite the general pattern of increasing productivity in the Fram Strait, there is a corresponding decrease in the apparent efficiency of the biological carbon pump. Logically, this must be related to changes in plankton dynamics regulating the export of organic carbon out of the surface layer. At mesopelagic depths, a decrease in pbSi and an increase in PIC fluxes were observed, the latter mediated primarily through an increase in pteropod aragonite (Table 1). From 1998 to 2011, summertime surface plankton assemblages have shifted from a dominance of diatoms Thalassiosira, Chaetoceros, and Fragilariopsis spp. to a dominance of Phaeocystis pouchetti, pico-, and nanoflagellate communities (Nöthig et al., 2015) following a well-documented warming anomaly (Beszczynska-Möller et al., 2012). Similarly, the analysis of zooplankton in sediment trap samples indicates an increase in the abundance of North Atlantic amphipod species Themisto compressa (Kraft et al., 2013; Schröter et al., 2019) and an increasing occurrence of the pteropod Limacina retroversa (Bauerfeind et al., 2015; Busch et al., 2015) and general shifts in zooplankton community composition (Ramondenc et al., 2022). Changes in phytoplankton communities, as a result of warming, have been previously linked to decreasing pbSi fluxes in the mesopelagic at HGIV (Bauerfeind et al., 2009; Lalande et al., 2013), and our data confirm that changes in pbSi are observed further north in the Fram Strait at HGN. Here, we document that decreases in Si:POC and Si:PIC ratios were statistically significant at mesopelagic depths (Table 1). These stoichiometric shifts suggest a decrease in the contribution of diatoms to POC flux, and a decrease relative to calcifying organisms may partly explain a weakened biological carbon pump in spite of increasing surface productivity.
Contrary to mesopelagic depths, decreases in pbSi fluxes were not observed at bathypelagic depths since there was no significant change in pbSi fluxes, Si:POC, or Si:PIC ratios over the observation period (Table 2). The much lower concentration of diatom biomarkers (Figure 10) and elevated Si:POC ratios in the bathypelagic in comparison to the mesopelagic catchment areas imply significant attenuation of diatom-derived organic carbon with depth. However, concentrations of diatom-specific biomarkers in the bathypelagic are 3% of those in the mesopelagic depths, compared to 0.3% for dinoflagellates, indicating diatom-derived carbon is more effectively transferred to the deep ocean than that of dinoflagellates. Higher pbSi fluxes are observed at bathypelagic than mesopelagic depths, thus probably mostly representing aged siliceous material derived from lateral advection of shelf sediments and released from ice melt. Unfortunately, these particularities of particle dynamics in the Fram Strait render it difficult to correctly interpret how declining mesopelagic fluxes of siliceous communities impact the associated delivery of diatom-derived organic carbon to benthic communities.
The strong increase in pteropod aragonite to CaCO3 fluxes over the observation period at mesopelagic depths was not evident at bathypelagic depths (Table 2). Sediment trap data (Bauerfeind et al., 2014; Boeuf et al., 2019; Dong et al., 2019), sediment analysis (Sulpis et al., 2022), and modelling studies (Buitenhuis et al., 2019) show that pteropod aragonite can reach and impact bathypelagic depths. Our data in the Fram Strait show that annually integrated pteropod aragonite only accounted for 10% of CaCO3 fluxes at 2,300 m compared to approximately 50% at 200 m. The strong dissolution of aragonite with depth and associated breakdown of organic matter (Oakes et al., 2019) implies a minor contribution to bathypelagic POC flux on annual scales. However, both mesopelagic and bathypelagic results show high seasonal pteropod aragonite fluxes during winter (Figure 8) that may represent a source of POC to the benthos during a time of otherwise low flux (Bauerfeind et al., 2014). Enhanced fluxes of calcifying zooplankton serve to strengthen the carbonate counter-pump (parameterized through the POC:PIC ratio) and reduce the overall efficiency of ocean carbon sequestration (Salter et al., 2014; Manno et al., 2018). The inclusion of pteropod aragonite at mesopelagic depths reduces the POC:PIC molar ratio by 3–6, but only 0.3 at bathypelagic depths (Table 3). The increasing trend of pteropod fluxes observed in the Fram Strait, thus, has a negligible effect on the strength of the carbonate counter-pump in the deep ocean due to the dissolution of aragonite during sinking.
A large change in particle composition was observed between mesopelagic and bathypelagic depths at both sites (Figure 5). Most notable is a strong shift from biogenic to lithogenic flux components at 2,300 m. Observed decreases in the proportion of POM with depth are consistent with open ocean remineralization length scales (Martin et al., 1987; Dunne et al., 2007). The decrease in total CaCO3 content was largely due to the loss of pteropod-derived aragonite, a form more susceptible to dissolution (Orr et al., 2005; Dong et al., 2019; Sulpis et al., 2022). The average and annual fluxes of residual material were an order of magnitude higher at depth, indicating that the observed increase in bathypelagic mass fluxes may be largely accounted for by a source of lithogenic material (Table 3). The annual fluxes of all biogenic mineral components were greater in the bathypelagic, notably for pbSi, somewhat contrary to what might be expected from depth-dependent remineralization of biogenic opal (Nelson et al., 1995; Van Cappellen et al., 2002) and calcite (Milliman, 1993; Sulpis et al., 2021) during sinking. Deep-ocean sediment trap studies frequently report higher fluxes in the bathypelagic depth (Conte et al., 2001; Lampitt et al., 2001; Fischer et al., 2020), including the Fram Strait (Lalande et al., 2016), potentially due to higher horizontal current velocities and decreased trapping efficiency in upper-ocean sediment trap deployments (Gardner, 1980; Gust et al., 1992; Lalande et al., 2016) and potential modification by swimmer activity (Lee et al., 1988; Micheals et al., 1990), and the latter is typically higher in mesopelagic rather than bathypelagic traps (Ramondenc et al., 2022). Local resuspension from sediments could enhance fluxes in the deeper traps, depending on the thickness of the turbid bottom boundary layer. In the present study, sediment traps were typically deployed >150 m from the bottom such that significant resuspension seems to be unlikely, although we cannot account for it completely.
The enhanced lithogenic and biogenic fluxes in the bathypelagic zone of the eastern Fram Strait have previously been linked to lateral transport from the Svalbard region or the Barents Sea with the intermediate or deep nepheloid layer (Lalande et al., 2016), supported by enhanced fluxes of terrestrial and plankton biomarkers. The simulation of sediment trap catchment areas indicates that few particles originated from shallow areas (0–500 m), which encompasses the Svalbard Shelf, suggesting the WSC could serve as a barrier for shelf particles reaching the central Fram Strait (Wekerle et al., 2018). However, the downslope transport of resuspended shelf sediments deeper than 200 m (Sanchez-Vidal et al., 2015) may be laterally advected to the bathypelagic in the Fram Strait, contributing to enhanced fluxes. In addition, ice melting in the Fram Strait may release lithogenic and biogeochemical material entrained during suspension freezing, as has been documented on the Siberian shelves (Dethleff and Kempema, 2007), and enhanced fluxes of terrestrial biomarkers in the presence of ice (Lalande et al., 2016).
The contributions of terrigenous material to organic carbon arriving in the bathypelagic areas are notoriously difficult to constrain. There is a clear increase in the lithogenic contribution to TPM fluxes from mesopelagic to bathypelagic depths (Figure 6), which should correspond to an increase in associated terrigenous organic matter. Previous studies have attempted to estimate the provenance of POC from the mass balance of ∂13C signatures (Hedges et al., 1988; Goñi et al., 2000). Isotope mass balance approaches require a clear constraint of isotopic end-members. Terrigenous POC (∂13CTerr) values from carbon (C3) fixation of Arctic plants are reasonably well constrained at values of −26−28‰ (Goñi et al., 2000; Hop et al., 2006; Sanchez-Vidal et al., 2015). However, marine POC (∂13CMar) values in the Arctic Ocean are highly dynamic (−18−26‰) due to variable phytoplankton community composition, ice cover, and CO2 concentrations in surface waters (Schubert and Calvert, 2001; Zhang et al., 2012). For consistency with a previous study on the Spitsbergen continental shelf, we assigned a ∂13CMar value of −21‰ and ∂13CTerr value of −27‰ (Sanchez-Vidal et al., 2015). Using a two-end linear mixing model (Hedges et al., 1988; Goñi et al., 2000) and average ∂13C from this study, we estimated terrigenous contributions to POC at 56–60% in the mesopelagic and 43–39% in the bathypelagic areas.
The higher contribution of terrigenous-derived organic carbon in the mesopelagic derived from isotope mass balance are inconsistent with the observed increase in lithogenic fluxes in the bathypelagic resulting simply from lateral advection of terrigenous material (Lalande et al., 2016). However, isotope mass balance calculations were in agreement with biomarker data, typically showing higher organic carbon-normalized concentrations of terrigenous biomarkers (campesterol and ß-sitosterol) in the mesopelagic compared to the bathypelagic. It remains elusive to fully characterize the contribution of terrigenous carbon to the bathypelagic in the Fram Strait. The relative contributions of laterally advected and ice-derived terrigenous matter to POC flux in the deep Fram Strait and their potential role in fueling benthic carbon demand (Wiedmann et al., 2020), thus, remain ill constrained.
One of the main objectives of the present manuscript was to examine the impact of varying ice cover on bathypelagic fluxes. To address this objective, we compiled flux records from two end-members of sediment trap catchment area conditions in the Fram Strait: 1) –Ice end-member: samples from HGIV in 2005, a year with enhanced temperatures of AW, previously characterized as a warm anomaly (Beszczynska-Möller et al., 2012; Lalande et al., 2013), considered representative of future “Atlantification” scenario in the eastern Arctic Ocean (Polykov et al., 2017). 2) +Ice end-member: a sample from HGN in 2007, a year with higher ice-area export through the Fram Strait (von Appen et al., 2021) and site with typically smaller distances to the ice edge (Wekerle et al., 2018; Fadeev et al., 2021). Due to truncated flux records, it was necessary to extrapolate daily flux averages within months for 15 days in July 2005 and 25 days in August 2005 at HGIV and 10 days in June 2007 and 17 days in July 2007 at HGN. Differences in bathypelagic deployment depths may also serve to confound comparisons of the end-members. These limitations should be taken into account in the following data interpretation.
In the +Ice end-member, ice concentrations were higher throughout the entire year resulting in a dominant melt water (MW) regime (>50% of catchment area) already present in early spring (Figures 11A,G). This led to spring peaks in biogenic flux components, with almost half of the annual flux (1.7 g POC m-2, Figure 11E) arriving at the seafloor by the end of May, compared to only 20% over the same period in the–Ice end-member (0.6 g POC m-2). The timing of POC fluxes to the deep is considered to be an important aspect of pelagic benthic coupling that impacts benthic communities (Wolff et al., 2011; Ruhl et al., 2020; Wiedmann et al., 2020). Peak Chl concentrations occurred 1 month prior in the +Ice end-member (Figure 11B), concomitant with maximum coverage of meltwater in the catchment area. It is widely observed that ice melt stratification in marginal ice zones can initiate and support phytoplankton blooms (Wu et al., 2007; Cherkasheva et al., 2014). Average ∂13C isotope values were enriched from February to May compared to the July–November period (Figure 11J). The onset of peak bathypelagic carbon flux occurred in March, prior to any notable increase in remote sensing chl concentrations, although it is known that low light and high ice concentrations at this time may hamper reliable remote sensing data during this period (Wekerle et al., 2018). Discrepancies between chlorophyll concentrations and bathypelagic carbon flux are also observed in open ocean systems such as the North-eastern Atlantic (Salter, 2008; Lampitt et al., 2010) and remain enigmatic. In the Arctic, light penetration through leads in fragmented ice can stimulate under-ice phytoplankton blooms (Assmy et al., 2017) that are obscured from detection by remote sensing.
In the +Ice end-member, there was a corresponding spring peak in lithogenic fluxes (Figure 11L) which may have ballasted organic carbon sedimentation through an abiotic flux pump (Ittekkot, 1993; Salter et al., 2010). High pbSi fluxes and elevated Si:POC ratios seem to indicate that diatoms were an important component of spring bathypelagic organic carbon flux in the +Ice end-member (Figures 11C,H). However, CaCO3 fluxes were also elevated, and Si:PIC ratios were low (Figures 11F,K). Negligible pteropod fluxes (Table 4) suggest that other calcareous plankton mediated deepwater PIC fluxes. Previous studies have highlighted the importance of cold-water-adapted coccolithophores (Coccolithus pelagicus) to deepwater PIC fluxes in the Fram Strait (Samtleben and Bickert, 1990). Similarly, foraminifera fluxes are typically higher in deeper sediment traps in the Fram Strait (Ramondenc et al., 2022) and biogenic calcite export from the sea-ice-associated species Neogloboquadrina pachyderma is of known importance in the Arctic (Tell et al., 2022).
In the –Ice end-member, peak POC fluxes occurred during summer with an approximate 1-month delay from peak Chl values, comparable to recent estimates from the ML regime at HGIV (von Appen et al., 2021). In the present comparison, the –ice catchment areas during summer were dominated by an ML regime, despite a regional peak in strong MW coverage. Summer POC fluxes (July to September) in the –Ice end-member occurred previously and were larger and more episodic than the +Ice end-member, accounting for 65% rather than 36% of annual POC export, broadly consistent with the previous findings (von Appen et al., 2021). Enhanced pbSi fluxes and high Si:POC and Si:PIC indicated that diatoms rather than calcareous plankton dominated summer bathypelagic POC fluxes in the –Ice end-member. The peak in lithogenic flux in the –Ice end-member was dissociated from the biogenic flux but corresponded to enhanced ice in the catchment area and to the inflow of warmest Atlantic water. This pattern could reflect the release of lithogenic material entrained from suspension freezing (Dethleff and Kempema, 2007) as sea ice exported through the Fram Strait (Smedsrud et al., 2017) in late summer comes in contact with warm AW. This process could also explain the higher annual lithogenic flux in the –Ice end-member with elevated AW temperatures than in the +Ice end-member (Table 4).
Annual bathypelagic POC flux was 50% higher in the +Ice end-member, implying a stronger, though slower (von Appen et al., 2021), and perhaps more efficient, biological carbon pump resulting from stratified MW regimes compared to more weakly stratified open water. Despite significant interannual variability and challenges of non-overlapping sediment trap deployments, a similar enhancement of deepwater POC flux was observed at HGN (larger proportion of stratified MW regimes) from comparing annual flux averages across the decadal time series (Table 3). In this regard, our findings are in contrast with a recent comparison of stratification regimes in the Fram Strait which showed higher annual POC fluxes in ML regimes (von Appen et al., 2021), although von Appen et al. (2021) could not account for the fate of direct sea ice algal production and export early in the year, which appears to be an important component of annual POC flux in +Ice end-member scenario. In this context, it is likely that distance to the ice edge in MIZ areas has an important effect on particle export. Enhanced export mechanisms in close proximity to locations where ice quickly melts result from enhanced sinking velocities (Fadeev et al., 2021), deposition of algal biomass from melting Arctic sea ice (Boetius et al., 2013; Assmy et al., 2017), and ballasting from cryogenic mineral phases (Wollenburg et al., 2018). It is also challenging to compare different years since variation in the source area of ice exported through the Fram Strait are likely to influence the transfer of ice-rafted material (Krumpen et al., 2019), which may be an important component of deepwater POC fluxes at HGN. Despite these complications, higher summertime POC flux in ML regimes and a more efficient biological carbon pump in MW regimes appear to be a consistent feature across our datasets in the Fram Strait.
The analysis of our dataset and information from previous studies (Sanchez-Vidal et al., 2015; Lalande et al., 2016) indicate that laterally advected materials may contribute to bathypelagic fluxes in the Fram Strait. This could confound interpretations related to changes in ice cover, although particle trajectory modelling shows relatively consistent catchment areas (Wekerle et al., 2018). Marginal ice zones in the Fram Strait arise through sea ice export (Krumpen et al., 2019) rather than retreating ice as encountered in the central Arctic Ocean. Nevertheless, differences in bathypelagic fluxes between HGIV and HGN and +Ice and–Ice end-member comparison offer some useful insights into the potential impacts of ongoing “Atlantification” and transition of MIZ in the future Arctic. Our data suggest modifications in quantity, biogeochemical composition, phenology, and episodicity of deepwater particle fluxes that may all change the nature of pelagic–benthic coupling.
Mesopelagic and bathypelagic particle fluxes in the Fram Strait displayed regional and interannual variability over the observation period. There was a gradual increase in the catchment area chlorophyll values but not annual POC flux, suggesting a decrease in the efficiency of the biological carbon pump. Reductions in mesopelagic pbSi flux and particulate matter stoichiometry suggest a transition away from diatom-dominated production and export as a feasible explanation. Lithogenic fluxes were considerably higher at bathypelagic depths, suggesting terrigenous material as an important component fueling benthic carbon demand. However, constraining the precise contribution remains challenging. A comparison of sites with differences in the catchment area ice properties shows differences in the timing, composition, and magnitude of bathypelagic particle flux. Our study suggests that future climate scenarios of “Atlantification” and reduced ice concentrations in the Arctic Ocean will impact the nature of pelagic–benthic coupling.
The datasets presented in this study can be found in online repositories. The names of the repository/repositories and accession number(s) can be found at: https://www.pangaea.de/.
SI analyzed the data and wrote the manuscript. BE, IM, NE, LC, and SI have been responsible for maintaining the sediment trap mooring program in the Fram Strait. FK performed analyses for biomarker data. BE and NE managed the laboratories and performed the chemical analyses. WC and VW performed sediment trap catchment area analyses and stratification model output. SI, BE, FK, IM, LC, RS, WC, and NE contributed intellectually to the writing and editing of the manuscript. SI prepared all figures and tables, except for Figures 1, 2, and 4 that were prepared by WC. All authors contributed to the article and approved the submitted version.
This work was supported by institutional funding from the Alfred Wegner Institute, Helmholtz Center for Polar and Marine Research, and the Helmholty infrastructure program FRAM (FRontiers in Arctic Monitoring). Open-access publication fees were supported in part by the Faroese Research Council (Granskingar raðið).
The authors thank N. Knüppel, C. Lorenzen, and E. Bonk (Alfred Wegener Institute Helmholtz Centre for Polar and Marine Research) for laboratory assistance and the tedious work of swimmers picking. They also thank all the helpers picking out swimmers from the traps. They would also like to thank the AWI Physical Oceanography section, the AWI Deep Sea group and captains and crews of RV Polarstern, and RV Maria S. Merian for their support during service of the HAUSGARTEN Observatory. This work was conducted in the framework of the HGF Infrastructure Program FRAM of the Alfred-Wegener-Institute Helmholtz Center for Polar and Marine Research.
The authors declare that the research was conducted in the absence of any commercial or financial relationships that could be construed as a potential conflict of interest.
All claims expressed in this article are solely those of the authors and do not necessarily represent those of their affiliated organizations, or those of the publisher, the editors, and the reviewers. Any product that may be evaluated in this article, or claim that may be made by its manufacturer, is not guaranteed or endorsed by the publisher.
The Supplementary Material for this article can be found online at: https://www.frontiersin.org/articles/10.3389/feart.2023.1210213/full#supplementary-material
Ardyna, M., and Arrigo, K. R. (2020). Phytoplankton dynamics in a changing Arctic Ocean. Nat. Clim. Chang. 10, 892–903. doi:10.1038/s41558-020-0905-y
Arrigo, K. R., Perovich, D. K., Pickart, R. S., Brown, Z. W., Van Dijken, G. L., Lowry, K. E., et al. (2012). Massive phytoplankton blooms under arctic Sea Ice. Science 80. 1408. doi:10.1126/science.1215065
Arrigo, K. R., and van Dijken, G. L. (2015). Continued increases in Arctic Ocean primary production. Prog. Oceanogr. 136, 60–70. doi:10.1016/j.pocean.2015.05.002
Arrigo, K. R., van Dijken, G., and Pabi, S. (2008). Impact of a shrinking Arctic ice cover on marine primary production. Geophys. Res. Lett. 35. L19603. doi:10.1029/2008GL035028
Årthun, M., Eldevik, T., Smedsrud, L. H., Skagsethand, Ø, and Ingvaldsen, R. B. (2012). Quantifying the influence of atlantic heat on barents sea ice variability and retreat. J. Clim. 25, 4736–4743. doi:10.1175/JCLI-D-11-00466.1
Assmy, P., Fernández-Méndez, M., Duarte, P., Meyer, A., Randelhoff, A., Mundy, C. J., et al. (2017). Leads in Arctic pack ice enable early phytoplankton blooms below snow-covered sea ice. Sci. Rep. 7, 40850. doi:10.1038/srep40850
Bauerfeind, E., Beszczynska-Möller, A., von Appen, W.-J., Soltwedel, T., Sablotny, B., and Lochthofen, N. (2015). Physical oceanography and current meter data from moorings at HAUSGARTEN, 2001-2014. Germany: PANGEA.
Bauerfeind, E., Nöthig, E.-M., Pauls, B., Kraft, A., and Beszczynska-Möller, A. (2014). Variability in pteropod sedimentation and corresponding aragonite flux at the Arctic deep-sea long-term observatory HAUSGARTEN in the eastern Fram Strait from 2000 to 2009. J. Mar. Syst. 132, 95–105. doi:10.1016/j.jmarsys.2013.12.006
Bauerfeind, E., Nöthig, E. M., Beszczynska, A., Fahl, K., Kaleschke, L., Kreker, K., et al. (2009). Particle sedimentation patterns in the eastern Fram Strait during 2000-2005: Results from the Arctic long-term observatory HAUSGARTEN. Deep. Res. Part I Oceanogr. Res. Pap. 56, 1471–1487. doi:10.1016/j.dsr.2009.04.011
Belt, S. T., Massé, G., Rowland, S. J., Poulin, M., Michel, C., and LeBlanc, B. (2007). A novel chemical fossil of palaeo sea ice: IP25. Org. Geochem. 38, 16–27. doi:10.1016/j.orggeochem.2006.09.013
Belter, H. J., Krumpen, T., von Albedyll, L., Alekseeva, T. A., Birnbaum, G., Frolov, S. V., et al. (2021). Interannual variability in Transpolar Drift summer sea ice thickness and potential impact of Atlantification. Cryosph 15, 2575–2591. doi:10.5194/tc-15-2575-2021
Beszczynska-Möller, A., Fahrbach, E., Schauer, U., and Hansen, E. (2012). Variability in Atlantic water temperature and transport at the entrance to the Arctic Ocean, 1997–2010. ICES J. Mar. Sci. 69, 852–863. doi:10.1093/icesjms/fss056
Bienhold, C., Schourup-Kristensen, V., Krumpen, T., Nöthig, E.-M., Wenzhöfer, F., Korhonen, M., et al. (2022). Effects of sea ice retreat and ocean warming on the Laptev Sea continental slope ecosystem (1993 vs 2012). Front. Mar. Sci. 9. doi:10.3389/fmars.2022.1004959
Boetius, A., Albrecht, S., Bakker, K., Bienhold, C., Felden, J., Mar, F-M., et al. (2013). Export of algal biomass from the melting arctic Sea Ice. Science 80, 1430–1432. doi:10.1594/PANGAEA.803293
Boeuf, D., Edwards, B. R., Eppley, J. M., Hu, S. K., Poff, K. E., Romano, A. E., et al. (2019). Biological composition and microbial dynamics of sinking particulate organic matter at abyssal depths in the oligotrophic open ocean. Proc. Natl. Acad. Sci. 116, 11824–11832. doi:10.1073/pnas.1903080116
Boon, J. J., Rijpstra, W. I., De Lange, F., De Leeuw, J. W., Yoshioka, M., and Shimizu, Y. (1979). Black Sea sterol—A molecular fossil for dinoflagellate blooms. Nature 277, 125–127. doi:10.1038/277125a0
Boyd, P. W., and Trull, T. W. (2007). Understanding the export of biogenic particles in oceanic waters: Is there consensus? Prog. Oceanogr. 72, 276–312. doi:10.1016/j.pocean.2006.10.007
Buitenhuis, E. T., Le Quéré, C., Bednaršek, N., and Schiebel, R. (2019). Large contribution of pteropods to shallow CaCO 3 export. Glob. Biogeochem. Cycles 33, 458–468. doi:10.1029/2018GB006110
Busch, K., Bauerfeind, E., and Nöthig, E.-M. (2015). Pteropod sedimentation patterns in different water depths observed with moored sediment traps over a 4-year period at the LTER station HAUSGARTEN in eastern Fram Strait. Polar Biol. 38, 845–859. doi:10.1007/s00300-015-1644-9
Cherkasheva, A., Bracher, A., Melsheimer, C., Köberle, C., Gerdes, R., Nöthig, E.-M., et al. (2014). Influence of the physical environment on polar phytoplankton blooms: A case study in the Fram Strait. J. Mar. Syst. 132, 196–207. doi:10.1016/j.jmarsys.2013.11.008
Comiso, J. C., Meier, W. N., and Gersten, R. (2017). Variability and trends in the A rctic S ea ice cover: Results from different techniques. J. Geophys. Res. Ocean. 122, 6883–6900. doi:10.1002/2017JC012768
Conte, M. H., Ralph, N., and Ross, E. H. (2001). Seasonal and interannual variability in deep ocean particle fluxes at the oceanic flux program (OFP)/Bermuda atlantic time series (BATS) site in the Western sargasso sea near Bermuda. Deep Sea Res. Part II Top. Stud. Oceanogr. 48, 1471–1505. doi:10.1016/S0967-0645(00)00150-8
Dethleff, D., and Kempema, E. W. (2007). Langmuir circulation driving sediment entrainment into newly formed ice: Tank experiment results with application to nature (Lake Hattie, United States; Kara Sea, Siberia). J. Geophys. Res. 112, C02004. doi:10.1029/2005JC003259
Dong, S., Berelson, W. M., Rollins, N. E., Subhas, A. V., Naviaux, J. D., Celestian, A. J., et al. (2019). Aragonite dissolution kinetics and calcite/aragonite ratios in sinking and suspended particles in the North Pacific. Earth Planet. Sci. Lett. 515, 1–12. doi:10.1016/j.epsl.2019.03.016
Dunne, J. P., Sarmiento, J. L., and Gnanadesikan, A. (2007). A synthesis of global particle export from the surface ocean and cycling through the ocean interior and on the seafloor. Glob. Biogeochem. Cycles 21. doi:10.1029/2006GB002907
Dybwad, C., Assmy, P., Olsen, L. M., Peeken, I., Nikolopoulos, A., Krumpen, T., et al. (2021). Carbon export in the seasonal Sea Ice zone north of svalbard from winter to late summer. Front. Mar. Sci. 7. doi:10.3389/fmars.2020.525800
Dybwad, C., Lalande, C., Bodur, Y. V., Henley, S. F., Cottier, F., Ershova, E. A., et al. (2022). The influence of Sea Ice cover and atlantic water advection on annual particle export north of svalbard. J. Geophys. Res. Ocean. 127. doi:10.1029/2022JC018897
Ehrlich, J., Bluhm, B. A., Peeken, I., Massicotte, P., Schaafsma, F. L., Castellani, G., et al. (2021). Sea-ice associated carbon flux in Arctic spring. Elem. Sci. Anthr. 9. doi:10.1525/elementa.2020.00169
Engel, A., Bracher, A., Dinter, T., Endres, S., Grosse, J., Metfies, K., et al. (2019). Inter-annual variability of organic carbon concentration in the eastern Fram Strait during summer (2009–2017). Front. Mar. Sci. 6. doi:10.3389/fmars.2019.00187
Fadeev, E., Rogge, A., Ramondenc, S., Nöthig, E. M., Wekerle, C., Bienhold, C., et al. (2021). Sea ice presence is linked to higher carbon export and vertical microbial connectivity in the Eurasian Arctic Ocean. Commun. Biol. 4, 1255. doi:10.1038/s42003-021-02776-w
Fahl, K., and Nöthig, E.-M. (2007). Lithogenic and biogenic particle fluxes on the Lomonosov Ridge (central Arctic Ocean) and their relevance for sediment accumulation: Vertical vs. lateral transport. Deep Sea Res. Part I Oceanogr. Res. Pap. 54, 1256–1272. doi:10.1016/j.dsr.2007.04.014
Fahl, K., and Stein, R. (2012). Modern seasonal variability and deglacial/Holocene change of central Arctic Ocean sea-ice cover: New insights from biomarker proxy records. Earth Planet. Sci. Lett. 351– 352, 123–133. doi:10.1016/j.epsl.2012.07.009
Fischer, G., Neuer, S., Ramondenc, S., Müller, T. J., Donner, B., Ruhland, G., et al. (2020). Long-term changes of particle flux in the canary basin between 1991 and 2009 and comparison to sediment trap records off Mauritania. Front. Earth Sci. 8. doi:10.3389/feart.2020.00280
Forest, A., Sampei, M., Hattori, H., Makabe, R., Sasaki, H., Fukuchi, M., et al. (2007). Particulate organic carbon fluxes on the slope of the Mackenzie Shelf (Beaufort Sea): Physical and biological forcing of shelf-basin exchanges. J. Mar. Syst. 68, 39–54. doi:10.1016/j.jmarsys.2006.10.008
Gardner, W. D. (1980). Sediment trap dynamics and calibration: A laboratory evaluation. J. Mar. Res. 38, 17–39.
Goñi, M. A., Yunker, M. B., Macdonald, R. W., and Eglinton, T. I. (2000). Distribution and sources of organic biomarkers in arctic sediments from the Mackenzie River and Beaufort Shelf. Mar. Chem. 71, 23–51. doi:10.1016/S0304-4203(00)00037-2
Gust, G., Byrne, R., Bernstein, R., Betzer, P., and Bowles, W. (1992). Particle fluxes and moving fluids: Experience from synchronous trap collections in the sargasso sea. Deep. Res. I 41, 831–857.
Haine, T. W. N., Curry, B., Gerdes, R., Hansen, E., Karcher, M., Lee, C., et al. (2015). Arctic freshwater export: Status, mechanisms, and prospects. Glob. Planet. Change 125, 13–35. doi:10.1016/j.gloplacha.2014.11.013
Hansen, E., Gerland, S., Granskog, M. A., Pavlova, O., Renner, A. H. H., Haapala, J., et al. (2013). Thinning of arctic sea ice observed in Fram Strait: 1990-2011. J. Geophys. Res. Ocean. 118, 5202–5221. doi:10.1002/jgrc.20393
Hedges, J. I., Clark, W. A., and Come, G. L. (1988). Organic matter sources to the water column and surficial sediments of a marine bay. Limnol. Oceanogr. 33, 1116–1136. doi:10.4319/lo.1988.33.5.1116
Hop, H., Falk-Petersen, S., Svendsen, H., Kwasniewski, S., Pavlov, V., Pavlova, O., et al. (2006). Physical and biological characteristics of the pelagic system across Fram Strait to Kongsfjorden. Prog. Oceanogr. 71, 182–231. doi:10.1016/j.pocean.2006.09.007
Horvat, C., Flocco, D., Rees Jones, D. W., Roach, L., and Golden, K. M. (2020). The effect of melt pond geometry on the distribution of solar energy under first-year Sea Ice. Geophys. Res. Lett. 47. doi:10.1029/2019GL085956
Hwang, J., Kim, M., Manganini, S. J., McIntyre, C. P., Haghipour, N., Park, J., et al. (2015). Temporal and spatial variability of particle transport in the deep A rctic C anada B asin. J. Geophys. Res. Ocean. 120, 2784–2799. doi:10.1002/2014JC010643
Ittekkot, V. (1993). The abiotically driven biological pump in the ocean and short-term fluctuations in atmospheric CO2 contents. Glob. Planet. Change 8, 17–25. doi:10.1016/0921-8181(93)90060-2
Janout, M. A., Hölemann, J., Waite, A. M., Krumpen, T., Appen, W., and Martynov, F. (2016). Sea-ice retreat controls timing of summer plankton blooms in the Eastern Arctic Ocean. Geophys. Res. Lett. 43. doi:10.1002/2016GL071232
Ji, R., Jin, M., and Varpe, Ø. (2013). Sea ice phenology and timing of primary production pulses in the Arctic Ocean. Glob. Chang. Biol. 19, 734–741. doi:10.1111/gcb.12074
Jickells, T. D., Dorling, S., Deuser, W. G., Church, T. M., Arimoto, R., and Prospero, J. M. (1998). Air-borne dust fluxes to a deep water sediment trap in the Sargasso Sea. Glob. Biogeochem. Cycles 12, 311–320. doi:10.1029/97GB03368
Katlein, C., Arndt, S., Belter, H. J., Castellani, G., and Nicolaus, M. (2019). Seasonal evolution of light transmission distributions through arctic Sea Ice. J. Geophys. Res. Ocean. 124, 5418–5435. doi:10.1029/2018JC014833
Kilias, E., Wolf, C., Nöthig, E.-M., Peeken, I., and Metfies, K. (2013). Protist distribution in the Western Fram Strait in summer 2010 based on 454-pyrosequencing of 18S rDNA. J. Phycol. 49, 996–1010. doi:10.1111/jpy.12109
Kohlbach, D., Graeve, M., Lange, A., David, C., Peeken, I., and Flores, H. (2016). The importance of ice algae-produced carbon in the central Arctic Ocean ecosystem: Food web relationships revealed by lipid and stable isotope analyses. Limnol. Oceanogr. 61, 2027–2044. doi:10.1002/lno.10351
Kraft, A., Bauerfeind, E., and Nöthig, E. M. (2011). Amphipod abundance in sediment trap samples at the long-term observatory HAUSGARTEN (Fram Strait, ∼79°N/4°E). Variability in species community patterns. Mar. Biodivers. 41, 353–364. doi:10.1007/s12526-010-0052-1
Kraft, A., Berge, J., Varpe, Ø., and Falk-Petersen, S. (2013). Feeding in arctic darkness: Mid-winter diet of the pelagic amphipods Themisto abyssorum and T. libellula. Mar. Biol. 160, 241–248. doi:10.1007/s00227-012-2065-8
Krumpen, T., Belter, H. J., Boetius, A., Damm, E., Haas, C., Hendricks, S., et al. (2019). Arctic warming interrupts the Transpolar Drift and affects long-range transport of sea ice and ice-rafted matter. Sci. Rep. 9, 5459. doi:10.1038/s41598-019-41456-y
Krumpen, T., Gerdes, R., Haas, C., Hendricks, S., Herber, A., Selyuzhenok, V., et al. (2016). Recent summer sea ice thickness surveys in Fram Strait and associated ice volume fluxes. Cryosph 10, 523–534. doi:10.5194/tc-10-523-2016
Kwok, R. (2018). Arctic sea ice thickness, volume, and multiyear ice coverage: Losses and coupled variability (1958–2018). Environ. Res. Lett. 13, 105005. doi:10.1088/1748-9326/aae3ec
Lalande, C., Bauerfeind, E., Nöthig, E. M., and Beszczynska-Möller, A. (2013). Impact of a warm anomaly on export fluxes of biogenic matter in the eastern Fram Strait. Prog. Oceanogr. 109, 70–77. doi:10.1016/j.pocean.2012.09.006
Lalande, C., Bélanger, S., and Fortier, L. (2009). Impact of a decreasing sea ice cover on the vertical export of particulate organic carbon in the northern Laptev Sea, Siberian Arctic Ocean. Geophys. Res. Lett. 36, L21604. doi:10.1029/2009GL040570
Lalande, C., Nöthig, E. M., Bauerfeind, E., Hardge, K., Beszczynska-Möller, A., and Fahl, K. (2016). Lateral supply and downward export of particulate matter from upper waters to the seafloor in the deep eastern Fram Strait. Deep. Res. Part I Oceanogr. Res. Pap. 114, 78–89. doi:10.1016/j.dsr.2016.04.014
Lalande, C., Nöthig, E. M., and Fortier, L. (2019). Algal export in the Arctic Ocean in times of global warming. Geophys. Res. Lett. 46, 5959–5967. doi:10.1029/2019GL083167
Lampitt, R., Bett, B., Kiriakoulakis, K., Popova, E., Ragueneau, O., Vangriesheim, A., et al. (2001). Material supply to the abyssal seafloor in the Northeast Atlantic. Prog. Oceanogr. 50, 27–63. doi:10.1016/S0079-6611(01)00047-7
Lampitt, R. S., Salter, I., de Cuevas, B. A., Hartman, S., Larkin, K. E., and Pebody, C. A. (2010). Long-term variability of downward particle flux in the deep northeast Atlantic: Causes and trends. Deep. Res. Part II Top. Stud. Oceanogr. 57, 1346–1361. doi:10.1016/j.dsr2.2010.01.011
Lee, C., Wakeham, S., and Hedges, J. (1988). The measurement of oceanic particle fluxes—Are swimmers a problem? Oceanography 1, 234–236.
Lind, S., Ingvaldsen, R. B., and Furevik, T. (2018). Arctic warming hotspot in the northern Barents Sea linked to declining sea-ice import. Nat. Clim. Chang. 8, 634–639. doi:10.1038/s41558-018-0205-y
Manno, C., Giglio, F., Stowasser, G., Fielding, S., Enderlein, P., and Tarling, G. A. (2018). Threatened species drive the strength of the carbonate pump in the northern Scotia Sea. Nat. Commun. 9, 4592. doi:10.1038/s41467-018-07088-y
Martin, J. H., Knauer, G. A., Karl, D. M., and Broenkow, W. W. (1987). Vertex: Carbon cycling in the northeast pacific. Deep Sea Res. Part A. Oceanogr. Res. Pap. 34, 267–285. doi:10.1016/0198-0149(87)90086-0
Micheals, A., Silver, M., Gowing, M., and Knauer, G. (1990). Cryptic zooplankton “‘swimmers’” in upper ocean sediment traps. Deep. Res. 37, 1285–1296. doi:10.1016/0198-0149(90)90043-u
Milliman, J. D. (1993). Production and accumulation of calcium carbonate in the ocean: Budget of a nonsteady state. Glob. Biogeochem. Cycles 7, 927–957. doi:10.1029/93GB02524
Min, C., Mu, L., Yang, Q., Ricker, R., Shi, Q., Han, B., et al. (2019). Sea ice export through the Fram Strait derived from a combined model and satellite data set. Cryosph 13, 3209–3224. doi:10.5194/tc-13-3209-2019
Nelson, D. M., Tréguer, P., Brzezinski, M. A., Leynaert, A., and Quéguiner, B. (1995). Production and dissolution of biogenic silica in the ocean: Revised global estimates, comparison with regional data and relationship to biogenic sedimentation. Glob. Biogeochem. Cycles 9, 359–372. doi:10.1029/95GB01070
Nöthig, E. M., Bracher, A., Engel, A., Metfies, K., Niehoff, B., Peeken, I., et al. (2015). Summertime plankton ecology in fram strait-a compilation of long-and short-term observations. Polar Res. 34, 23349. doi:10.3402/polar.v34.23349
Nöthig, E. M., Lalande, C., Fahl, K., Metfies, K., Salter, I., and Bauerfeind, E. (2020). Annual cycle of downward particle fluxes on each side of the gakkel ridge in the central Arctic Ocean: Particle fluxes in central Arctic Ocean. Philos. Trans. R. Soc. A Math. Phys. Eng. Sci. 378, 20190368. doi:10.1098/rsta.2019.0368
Oakes, R. L., Peck, V. L., Manno, C., and Bralower, T. J. (2019). Degradation of internal organic matter is the main control on pteropod shell dissolution after death. Glob. Biogeochem. Cycles 33, 749–760. doi:10.1029/2019GB006223
Orr, J. C., Fabry, V. J., Aumont, O., Bopp, L., Doney, S. C., Feely, R. A., et al. (2005). Anthropogenic ocean acidification over the twenty-first century and its impact on calcifying organisms. Nature 437, 681–686. doi:10.1038/nature04095
Oziel, L., Neukermans, G., Ardyna, M., Lancelot, C., Tison, J. L., Wassmann, P., et al. (2017). Role for Atlantic inflows and sea ice loss on shifting phytoplankton blooms in the Barents Sea. J. Geophys. Res. Ocean. 122, 5121–5139. doi:10.1002/2016JC012582
Parkinson, C. L., Cavalieri, D. J., Gloersen, P., Zwally, H. J., and Comiso, J. C. (1999). Arctic sea ice extents, areas, and trends, 1978-1996. J. Geophys. Res. 104, 20837–20856. doi:10.1029/1999JC900082
Polyakov, I. V., Alkire, M. B., Bluhm, B. A., Brown, K. A., Carmack, E. C., Chierici, M., et al. (2020). Borealization of the Arctic Ocean in response to anomalous advection from sub-arctic seas. Front. Mar. Sci. 7. doi:10.3389/fmars.2020.00491
Polyakov, I. V., Pnyushkov, A. V., Alkire, M. B., Ashik, I. M., Baumann, T. M., Carmack, E. C., et al. (2017). Greater role for atlantic inflows on sea-ice loss in the eurasian basin of the Arctic Ocean. Sci. (80-. ) 356, 285–291. doi:10.1126/science.aai8204
Ramondenc, S., Nöthig, E., Hufnagel, L., Bauerfeind, E., Busch, K., Knüppel, N., et al. (2022). Effects of Atlantification and changing sea-ice dynamics on zooplankton community structure and carbon flux between 2000 and 2016 in the eastern Fram Strait. Limnol. Oceanogr. doi:10.1002/lno.12192
Renner, A. H. H., Gerland, S., Haas, C., Spreen, G., Beckers, J. F., Hansen, E., et al. (2014). Evidence of Arctic sea ice thinning from direct observations. Geophys. Res. Lett. 41, 5029–5036. doi:10.1002/2014GL060369
Rogge, A., Janout, M., Loginova, N., Trudnowska, E., Hörstmann, C., Wekerle, C., et al. (2023). Carbon dioxide sink in the Arctic Ocean from cross-shelf transport of dense Barents Sea water. Nat. Geosci. 16, 82–88. doi:10.1038/s41561-022-01069-z
Ruhl, H. A., Bahr, F. L., Henson, S. A., Hosking, W. B., Espinola, W. B., Kahru, M., et al. (2020). Understanding the remote influences of ocean weather on the episodic pulses of particulate organic carbon flux. Deep. Res. Part II 173, 104741. doi:10.1016/j.dsr2.2020.104741
Salter, I., Kemp, A. E. S., Lampitt, R. S., and Gledhill, M. (2010). The association between biogenic and inorganic minerals and the amino acid composition of settling particles. Limnol. Oceanogr. 55, 2207–2218. doi:10.4319/lo.2010.55.5.2207
Salter, I. (2008). Particle flux in the northeast Atlantic and Southern Ocean. School of Ocean and Earth Science, University of Southampton, 363.
Salter, I., Schiebel, R., Ziveri, P., Movellan, A., Lampitt, R., and Woll, G. A. (2014). Carbonate counter pump stimulated by natural iron fertilization in the Polar Frontal Zone. Nat. Geosci. 7. doi:10.1038/NGEO2285
Samtleben, C., and Bickert, T. (1990). Coccoliths in sediment traps from the Norwegian Sea. Mar. Micropaleontol. 16, 39–64. doi:10.1016/0377-8398(90)90028-K
Sanchez-Vidal, A., Veres, O., Langone, L., Ferré, B., Calafat, A., Canals, M., et al. (2015). Particle sources and downward fluxes in the eastern Fram strait under the influence of the west Spitsbergen current. Deep. Res. Part I Oceanogr. Res. Pap. 103, 49–63. doi:10.1016/j.dsr.2015.06.002
Schröter, F., Havermans, C., Kraft, A., Knüppel, N., Beszczynska-Möller, A., Bauerfeind, E., et al. (2019). Pelagic amphipods in the eastern fram strait with continuing presence of Themisto compressa based on sediment trap time series. Front. Mar. Sci. 6, 311. doi:10.3389/fmars.2019.00311
Schubert, C. J., and Calvert, S. E. (2001). Nitrogen and carbon isotopic composition of marine and terrestrial organic matter in Arctic Ocean sediments. Deep Sea Res. Part I Oceanogr. Res. Pap. 48, 789–810. doi:10.1016/S0967-0637(00)00069-8
Scott, C. L., Falk-Petersen, S., Sargent, J. R., Hop, H., Lønne, O. J., and Poltermann, M. (1999). Lipids and trophic interactions of ice fauna and pelagic zooplankton in the marginal ice zone of the Barents Sea. Polar Biol. 21, 65–70. doi:10.1007/s003000050335
Serreze, M. C., Barrett, A. P., Slater, A. G., Woodgate, R. A., Aagaard, K., Lammers, R. B., et al. (2006). The large-scale freshwater cycle of the Arctic. J. Geophys. Res. 111, C11010. doi:10.1029/2005JC003424
Smedsrud, L. H., Halvorsen, M. H., Stroeve, J. C., Zhang, R., and Kloster, K. (2017). Fram Strait sea ice export variability and September Arctic sea ice extent over the last 80 years. Cryosph 11, 65–79. doi:10.5194/tc-11-65-2017
Soltwedel, T., Bauerfeind, E., Bergmann, M., Bracher, A., Budaeva, N., Busch, K., et al. (2016). Natural variability or anthropogenically-induced variation? Insights from 15 years of multidisciplinary observations at the arctic marine LTER site HAUSGARTEN. Ecol. Indic. 65, 89–102. doi:10.1016/j.ecolind.2015.10.001
Søreide, J. E., Hop, H., Carroll, M. L., Falk-Petersen, S., and Hegseth, E. N. (2006). Seasonal food web structures and sympagic–pelagic coupling in the European Arctic revealed by stable isotopes and a two-source food web model. Prog. Oceanogr. 71, 59–87. doi:10.1016/j.pocean.2006.06.001
Spreen, G., de Steur, L., Divine, D., Gerland, S., Hansen, E., and Kwok, R. (2020). Arctic Sea ice volume export through Fram Strait from 1992 to 2014. J. Geophys. Res. Ocean. 125. doi:10.1029/2019JC016039
Sulpis, O., Agrawal, P., Wolthers, M., Munhoven, G., Walker, M., and Middelburg, J. J. (2022). Aragonite dissolution protects calcite at the seafloor. Nat. Commun. 13, 1104. doi:10.1038/s41467-022-28711-z
Sulpis, O., Jeansson, E., Dinauer, A., Lauvset, S. K., and Middelburg, J. J. (2021). Calcium carbonate dissolution patterns in the ocean. Nat. Geosci. 14, 423–428. doi:10.1038/s41561-021-00743-y
Sumata, H., de Steur, L., Divine, D. V., Granskog, M. A., and Gerland, S. (2023). Regime shift in Arctic Ocean sea ice thickness. Nature 615, 443–449. doi:10.1038/s41586-022-05686-x
Tell, F., Jonkers, L., Meilland, J., and Kucera, M. (2022). Upper-ocean flux of biogenic calcite produced by the Arctic planktonic foraminifera Neogloboquadrina pachyderma. Biogeosciences 19, 4903–4927. doi:10.5194/bg-19-4903-2022
Tesi, T., Muschitiello, F., Mollenhauer, G., Miserocchi, S., Langone, L., Ceccarelli, C., et al. (2021). Rapid atlantification along the Fram Strait at the beginning of the 20th century. Sci. Adv. 7, eabj2946. doi:10.1126/sciadv.abj2946
Van Cappellen, P., Dixit, S., and van Beusekom, J. (2002). Biogenic silica dissolution in the oceans: Reconciling experimental and field-based dissolution rates. Glob. Biogeochem. Cycles 16, 23-1–23-10. doi:10.1029/2001GB001431
Vernet, M., Richardson, T. L., Metfies, K., Nöthig, E.-M., and Peeken, I. (2017). Models of plankton community changes during a warm water anomaly in arctic waters show altered trophic pathways with minimal changes in carbon export. Front. Mar. Sci. 4. doi:10.3389/fmars.2017.00160
Volkman, J. K. (1986). A review of sterol markers for marine and terrigenous organic matter. Org. Geochem. 9, 83–99. doi:10.1016/0146-6380(86)90089-6
von Appen, W. J., Waite, A. M., Bergmann, M., Bienhold, C., Boebel, O., Bracher, A., et al. (2021). Sea-Ice derived meltwater stratification slows the biological carbon pump: Results from continuous observations. Nat. Commun. 12, 7309. doi:10.1038/s41467-021-26943-z
von Bodungen, B., Wunsch, M., and Fürderer, H. (1991). “Sampling and analysis of suspended particles in the northern north Atlantic,” in Marine particles and characterisation. Editors D. C. Hurd, and D. W. Spencer (United Kingdom: Geophysical Monograph), 47–56.
Wang, Q., Wekerle, C., Wang, X., Danilov, S., Koldunov, N., Sein, D., et al. (2020). Intensification of the atlantic water supply to the Arctic Ocean through Fram Strait induced by arctic Sea Ice decline. Geophys. Res. Lett. 47. doi:10.1029/2019GL086682
Wassmann, P., and Reigstad, M. (2011). Future Arctic Ocean seasonal ice zones and implications for pelagic-benthic coupling. Oceanography 24, 220–231. doi:10.5670/oceanog.2011.74
Wegner, C., Brown, T. A., Lalande, C., Grebmeier, L., and Cooper, L. W. (2020). “Utilization and importance of Sea Ice derived organic carbon to benthic communities of the chukchi sea: Evidence from highly branched isoprenoid biomarkers,” in Ocean sciences meeting (San Diego: AGU).
Wegner, C., Wittbrodt, K., Hölemann, J. A., Janout, M. A., Krumpen, T., Selyuzhenok, V., et al. (2017). Sediment entrainment into sea ice and transport in the transpolar drift: A case study from the Laptev Sea in winter 2011/2012. Cont. Shelf Res. 141, 1–10. doi:10.1016/j.csr.2017.04.010
Wekerle, C., Krumpen, T., Dinter, T., von Appen, W. J., Iversen, M. H., and Salter, I. (2018). Properties of sediment trap catchment areas in fram strait: Results from Lagrangian modeling and remote sensing. Front. Mar. Sci. 9. doi:10.3389/fmars.2018.00407
Wekerle, C., Wang, Q., von Appen, W.-J., Danilov, S., Schourup-Kristensen, V., and Jung, T. (2017). Eddy-resolving simulation of the atlantic water circulation in the Fram Strait with focus on the seasonal cycle. J. Geophys. Res. Ocean. 122, 8385–8405. doi:10.1002/2017JC012974
Wiedmann, I., Ershova, E., Bluhm, B. A., Nöthig, E.-M., Gradinger, R. R., Kosobokova, K., et al. (2020). What feeds the benthos in the arctic basins? Assembling a carbon budget for the deep Arctic Ocean. Front. Mar. Sci. 7. doi:10.3389/fmars.2020.00224
Wolff, G. A., Billett, D. S. M., Bett, B. J., Holtvoeth, J., FitzGeorge-Balfour, T., Fisher, E. H., et al. (2011). The effects of natural iron fertilisation on deep-sea ecology: The Crozet Plateau, southern Indian ocean. PLoS One 6, e20697. doi:10.1371/journal.pone.0020697
Wollenburg, J. E., Katlein, C., Nehrke, G., Nöthig, E.-M., Matthiessen, J., Wolf- Gladrow, D. A., et al. (2018). Ballasting by cryogenic gypsum enhances carbon export in a Phaeocystis under-ice bloom. Sci. Rep. 8, 7703. doi:10.1038/s41598-018-26016-0
Wu, Y., Peterson, I. K., Tang, C. C. L., Platt, T., Sathyendranath, S., and Fuentes-Yaco, C. (2007). The impact of sea ice on the initiation of the spring bloom on the Newfoundland and Labrador Shelves. J. Plankton Res. 29, 509–514. doi:10.1093/plankt/fbm035
Keywords: sediment trap, Arctic, Fram Strait, biological carbon pump, bathypelagic, sea ice (Arctic), Atlantification
Citation: Salter I, Bauerfeind E, Fahl K, Iversen MH, Lalande C, Ramondenc S, Von Appen W-J, Wekerle C and Nöthig E-M (2023) Interannual variability (2000–2013) of mesopelagic and bathypelagic particle fluxes in relation to variable sea ice cover in the eastern Fram Strait. Front. Earth Sci. 11:1210213. doi: 10.3389/feart.2023.1210213
Received: 21 April 2023; Accepted: 14 June 2023;
Published: 28 June 2023.
Edited by:
Makio Honda, Japan Agency for Marine-Earth Science and Technology (JAMSTEC), JapanReviewed by:
Yoshihisa Mino, Nagoya University, JapanCopyright © 2023 Salter, Bauerfeind, Fahl, Iversen, Lalande, Ramondenc, Von Appen, Wekerle and Nöthig. This is an open-access article distributed under the terms of the Creative Commons Attribution License (CC BY). The use, distribution or reproduction in other forums is permitted, provided the original author(s) and the copyright owner(s) are credited and that the original publication in this journal is cited, in accordance with accepted academic practice. No use, distribution or reproduction is permitted which does not comply with these terms.
*Correspondence: I. Salter, aWFuc0BoYXYuZm8=
†Present address: C. Lalande, Division of Polar Ocean Science, Korea Research Polar Institute, Incheon, Republic of Korea
Disclaimer: All claims expressed in this article are solely those of the authors and do not necessarily represent those of their affiliated organizations, or those of the publisher, the editors and the reviewers. Any product that may be evaluated in this article or claim that may be made by its manufacturer is not guaranteed or endorsed by the publisher.
Research integrity at Frontiers
Learn more about the work of our research integrity team to safeguard the quality of each article we publish.