 Rentian Shu
 Jingyi Xiao1,2*
- 1Qinghai Normal University, School of Geographical Sciences, Xining, Qinghai, China
- 2Key Laboratory of Natural Geography and Environmental Processes of Qinghai Province, Xining, Qinghai, China
- 3Qinghai Normal University, School of History, Xining, Qinghai, China
Introduction: High-level tourist attractions (HLTAs) are essential components of high-quality tourism development in the Yellow River Basin. In the context of holistic tourism and mass tourism, it is necessary to re-examine the spatial pattern of HLTAs.
Methods: Selecting the Qing–Gan–Ning region of the Yellow River Basin as a case study site, based on the data on 590 high-level tourist attractions in 2009, 2015, and 2021, and with the help of ArcGIS10.8 spatial analysis tools, the nearest neighbor index, kernel density analysis, and standard deviation ellipse methods, such as ellipse and ESDA spatial exploratory analysis, were used to analyze the spatiotemporal pattern of the spatial distribution of high-level tourist attractions in the study area from the aspects of type, density, and spatial autocorrelation. Overlay analysis, buffer analysis, and other methods were used to select the influencing factors, and finally, the influencing factors were verified with the help of GeoDetector.
Conclusions: The conclusions are as follows: the NNI values for the Qing–Gan–Ning area of the Yellow River Basin are 0.699, 0.7, and 0.618, and the spatial structure type was clustered. The distribution density showed an evolutionary trend of point-like agglomeration and linear expansion, with the provincial capital as the core and the Yellow River as the axis. The distribution density of high-level tourist attractions is 27, 44, and 74 per 10,000 km2. In terms of the dynamic distribution direction of the center of mass, there was little interannual variation, showing a northeast–southwest direction, which is consistent with the flow direction of the Yellow River in the region. Furthermore, the analysis of Moran’s I index showed clear spatial autocorrelation at the county scale. HLTAs exhibited clustering and wider distribution in H–H and L–L zones, while the L–H and H–L zones displayed a more dispersed and narrower distribution. The order of factors affecting the spatial distribution of HLTAs was economic factors (0.5257) > social factors (0.5235) > natural factors (0.491), and interactive detection showed that there were two-factor enhancements and nonlinear enhancements in the factors.
Dicussions: This study contributes to the conservation development and sustainable development of ecotourism resources in the Yellow River Basin.
1 Introduction
1.1 Research background and literature review
As an important ecological function zone and economic zone in China, the Yellow River Basin is an important focal point for economic and social development, and ecological construction in the new era. It is also a key area for establishing a modern economic system, in which people and nature coexist harmoniously (Yang et al., 2021). In 2019, ecological conservation and high-quality development in the Yellow River Basin (YB conservation and development) were identified as important national strategies. The development of the tourism industry in the basin is of great significance to the transformation of the development mode, economic structure optimization, and sustainable development of the Yellow River Basin. It is also an effective way to realize ecological protection and high-quality development of the basin, and plays an important role in the green ecological corridor of the Yellow River and the construction of an ecological civilization.
A-level tourist attractions are a comprehensive assessment method for the quality of tourist attractions in China (Wu et al., 2009), classifying them as 1A–5A. Attractions of 3A and above are of high standards in terms of infrastructure, resource attractiveness, management, and reception capacity, and are tourist destinations with high visitor arrival rates. The development status of level 3A and above is a barometer of tourism development in a region and has become an important reference for tourists’ choice of tourist destinations and the government’s integration planning of tourism resources. Zhang et al. (2018), Wang et al. (2020), Liao and Zhang (2021), and Qiu et al. (2021) define tourist attractions of 3A and above as high-level tourist attractions (MA XF, 2019; Li et al., 2020), whose number and spatial distribution largely determine the spatial pattern of tourism in the region.
Overseas research on high-level tourist attractions (HLTAs) has mostly been conducted in the case of national parks (Weber and Sultana, 2013) and World Heritage Sites (Jaafar et al., 2015), especially covering accessibility (Weber and Sultana, 2013), recreational behavior (Grayson and Martinec, 2004), demand forecasting (Samitas et al., 2018), and visitor perception (Fyall et al., 2017). Chinese scholars have mainly researched scenic planning and development (Zhan and Zhu, 2019), management models and economic benefits (Yuan et al., 2015; Cheng and Niu, 2016), spatial structure and distribution characteristics (Wu and Chen, 2022), economic value assessment (Zha and Qiu, 2015), and scenic capacity (ZHANG and WANG, 2007). In terms of the research timeframe, scholars mostly use single-year cross-sectional data to explore the spatial differentiation patterns and characteristics of scenic spots from a static perspective (Wu et al., 2017; Li et al., 2020); research methods are mostly qualitative analysis (Lin et al., 2014), AHP (Gu et al., 2015), and location entropy (Li et al., 2013). In recent years, mathematical and spatial analysis has become the mainstream method for exploring spatial distribution patterns (Yao et al., 2019) and correlation analysis (Wu et al., 2013; Wu et al., 2017). The geographical linkage rate (Xinyue and Juanjuan, 2016) and the GWR model (Zhu et al., 2017) have been used to study the influencing factors. Case studies cover countries (Zhu and Chen, 2008; Guedes and Jiménez, 2015; Kang et al., 2018), regions (Ma et al., 2013; Tang et al., 2019; Yang et al., 2019; Zhu et al., 2022), provinces (Wu et al., 2013; Xinyue and Juanjuan, 2016; Qiu et al., 2021; Bao et al., 2023), and municipalities (Liu et al., 2014); they include the Yangtze River Economic Belt (Zhang et al., 2018), Pearl River Delta (Chen et al., 2011), and Poyang Lake Ecological Economic Zone (Guo et al., 2012).
Existing studies in related fields have made advancements; however, there are still some shortcomings. First, in terms of research time frame, few scholars have studied the spatiotemporal evolution characteristics of the spatial distribution of HLTAs under long time series based on panel data. Second, in terms of research methods, mathematical models and spatial analysis are not linked closely enough, and there is a lack of spatial econometric analysis based on GIS visualization. Third, GeoDetectors are not adequately used in the study of influencing factors, and most of the use of GeoDetectors usage is focused on single-factor detection (Tang et al., 2019; Yao et al., 2019). Multifactor interaction detection is lacking. Finally, there are few basin-based studies (Li et al., 2019; Zhang et al., 2021) and even fewer results for the Yellow River Basin (Zhang C. et al., 2020; Li et al., 2020). In summary, there is a lack of quantitative analysis of spatial patterns and their influencing factors at long timescales based on panel data, spatial visualization analysis, and GeoDetector interaction detection for HLTAs in the Yellow River Basin regions.
The Qing–Gan–Ning region of the Yellow River Basin is located at the intersection of the Upper Yellow River Economic Belt and the Silk Road Economic Belt, with connected geography and humanities, and close social, economic, and cultural ties (Xiaoxiao et al., 2018). This area is also an important ecological barrier and a typical zone for high-quality development in the Upper Yellow River area. Based on this finding, this study uses spatial analysis, mathematical statistics, and other methods to analyze the basic features and evolutionary laws of spatial pattern changes in HLTAs, and uses GIS spatial analysis and GeoDetectors to determine the influencing factors. This approach helps identify the spatial structure of tourism resources with a view of providing a decision basis for the optimal layout and business mode enhancement of cross-regional high-level tourist attractions, which has theoretical and practical significance for the coordinated, high-quality, and sustainable development of the cultural tourism belt in the Yellow River Basin.
1.2 Study area overview
The Qing–Gan–Ning region in the Yellow River Basin refers to the basin area of the Yellow River from Maduo in Qinghai to Huinong in Ningxia. It is in the upper reaches of the Yellow River. The geographical range is 95°57′–108°46′E and 32°55′–39°18′N, with a basin area of 359,300 km2, covering 22 cities and autonomous prefectures in three provinces of Qinghai, Gansu, and Ningxia. The terrain is dominated by plateaus, and the overall presentation is high in the west and low in the east. It mainly flows through the Qinghai–Tibet Plateau, Loess Plateau, loop plain, and other geomorphic units. The complex geographical environment has bred rich natural and cultural tourism resources. It belongs to the transition zone of the Qinghai–Tibet alpine region and the eastern monsoon region, and is an important water connotation and recharge area of the Yellow River Basin, as well as an important ecological barrier in the northwest (Figure 1).
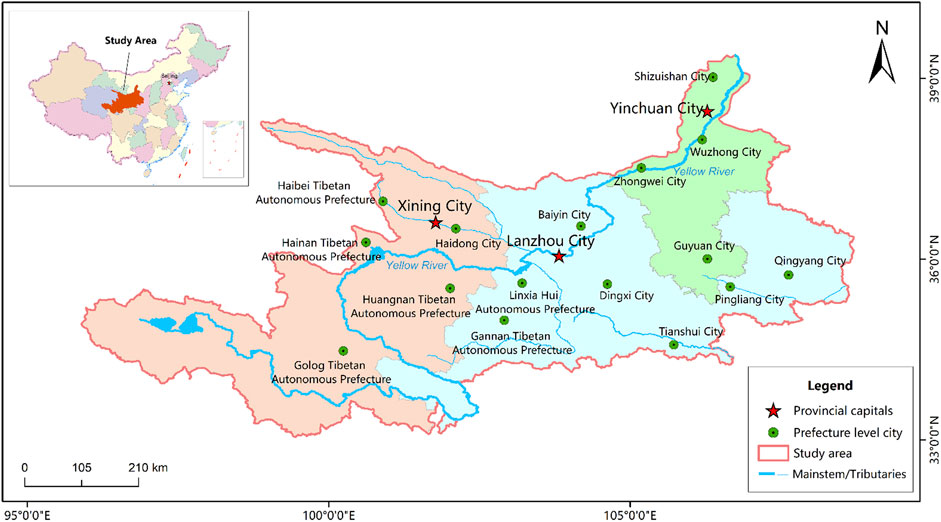
FIGURE 1. Yellow River Basin Qing–Gan–Ning region map.
The Yellow River Basin Qing–Gan–Ning region (hereinafter referred to as “the region”) has a long history and culture, where multiple ethnic cultures are intertwined, the mountains and waters are connected, and the cultures are close to each other and connected. Natural and humanistic environments are similar and exhibit regional cultural characteristics. In 2009, the three regions of Qing, Gan, and Ning received 0.483 billion tourist trips and 28,035 billion yuan in tourism revenue. In 2021, 352 million people received a tourism revenue of 247,868 billion yuan, and the tourism revenue accounted for a GDP increase from 4.83% to 13.69%. The tourism industry has become a strong engine of economic growth in this region. As of November 2021, there are 475 high-level tourist attractions ranked 3A and above in the Qing–Gan–Ning region, including 14 5A-, 160 4A-, and 301 3A-level tourist attractions.
2 Data sources and research methods
2.1 Data sources
Since high-level tourist attractions are stable and may not change significantly in adjacent years (Gan and Wang, 2021), 594 high-level tourist attractions in 3 years (i.e., 2009, 2015, and 2021) were selected for this study over a span of 6 years. In terms of geographic base data, the tourist attractions’ catalogs were obtained from the lists of 2009, 2015, and 2021 A-class tourism scenic spots published on the official websites of the Department of Culture and Tourism of Qinghai, Gansu, and Ningxia provinces (autonomous regions); the coordinate data on the scenic spots were obtained from the Baidu Map API, and the coordinates were picked up one by one to build the database by year. The vector data (e.g., elevation DEM, river data, road data, etc.) were obtained from the Institute of Geography and Environment, Chinese Academy of Sciences (https://www.resdc.cn/). Socio-economic data such as population data, GDP data, per capita disposable income data, and fiscal expenditure data were obtained from 2009 to 2021 provincial and regional statistical yearbooks, statistical bulletins, government work reports, and China’s economic and social big data platform (https://data.cnki.net/).
2.2 Research methodology
2.2.1 Clustering analysis method for spatial distribution
The nearest neighbor index (NNI) is the ratio of the observed nearest neighbor distance to the theoretical nearest neighbor distance. It is used to express the type of distribution of point-like elements in geospatial space.
Here, R denotes the nearest neighbor index, R1 denotes the observed distance, RE denotes the theoretical distance, n denotes the number of points, A is the total area of the region, and di is the distance from point i to its nearest neighbor. When the value of R is close to 1, the point elements are randomly distributed; when R > 1, the distribution is discrete; and when R < 1, the distribution is coalescent.
2.2.2 Morphological analysis method of spatial distribution
2.2.2.1 Kernel density
Kernel density was used to estimate the spatial distribution of the geographic elements and visualize the spatial agglomeration state. The higher the kernel density value is, the higher the probability of event occurrence and the denser the points.
Here,
2.2.2.2 Standard deviation ellipse
The standard deviation ellipse (SDE) quantitatively explains the characteristics of aggregation, spreading, direction, and spatial patterns of the spatial distribution of geographical elements from the perspective of global space. The parameters include the position of the center of the ellipse and the distance between the long and short axes. The change in the position of the center of the ellipse intuitively reflects the spatial change in the center of gravity of tourist attractions.
2.2.3 ESDA exploratory space analysis
The ESDA spatial exploratory analysis method integrates various techniques. Global autocorrelation uses global Moran’s I to describe the overall trend and variability of spatial correlation of the geographic element attribute values across the region, and the local spatial autocorrelation uses the local Moran’s I index to further reveal the heterogeneity of elements at the spatial scale. All of the aforementioned steps can be calculated using the spatial autocorrelation tool in the ArcGIS spatial statistics module.
2.2.4 GeoDetector
GeoDetector was used to detect spatial heterogeneity, explain the degree of the differential driving forces behind its influencing factors, and reveal factor interactions. In this study, we use the function of the factor and interaction detectors to clarify the explanatory strength of each influencing factor on the spatial distribution of tourism scenery and to detect the interaction between each influencing factor indicator.
Here, q is the intensity detection value of the influencing factor on the spatial pattern, N and Nh are the number of samples contained in the whole area and sub-region of the detection factor, respectively, and
2.3 Theoretical framework
The point-axis theory was proposed by the Chinese geographer Lu Daodao in 1984. Based on the central place theory, spatial diffusion theory, and growth pole theory, this theory illustrates the objective rules of spatial development of geographical elements. The point-axis theory provides a theoretical basis for the study of regional tourism development and planning, and the optimization of tourism spatial patterns. Spatiotemporal thinking is one of the characteristics of geography research. The organic combination of spatial thinking and temporal thinking reflects the unity of ephemerality and co-occurrence. This paper uses spatiotemporal thinking to help improve the depth and science of research on issues such as spatial evolution and chronological studies. In 1980, Butler proposed a model of the life cycle evolution of tourist places, which helps study the development stages of tourist places, predicts the development trend of tourist destinations, and guides the optimization of the spatial pattern of high-level scenic spots and the formulation of tourism development ideas.
In order to study the spatial pattern evolution characteristics and influencing factors of high-level scenic areas, this study first puts forward hypothesis H1H2 based on the point-axis theory, spatiotemporal thinking theory, and tourism place life cycle theory. Second, the correctness of hypothesis H1H2 is verified by using geospatial statistical methods, correlation analysis, and geographic probes (Figure 2).
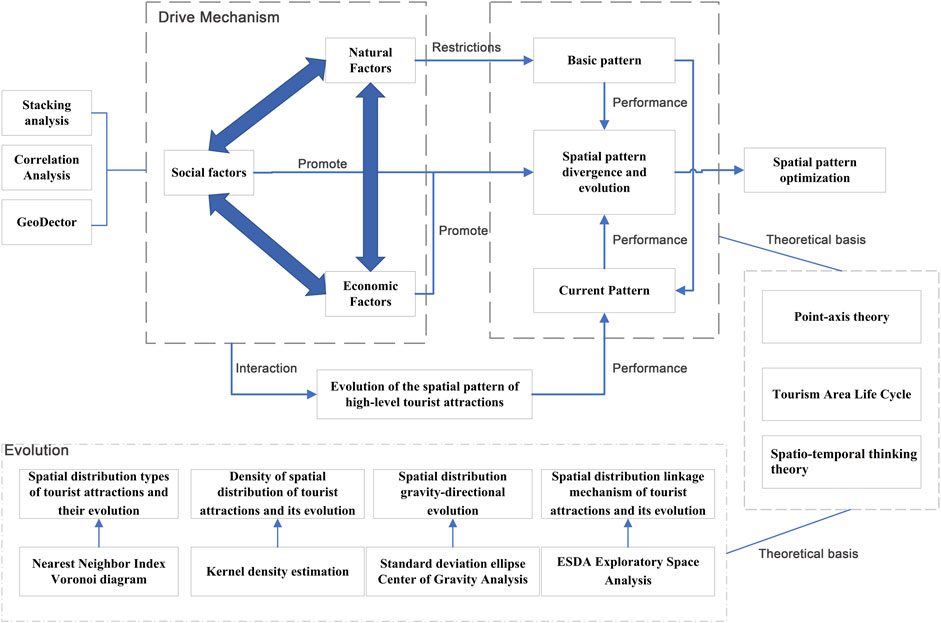
FIGURE 2. Theoretical framework.
H1. The high-level scenic spots in the Qing–Gan–Ning area of the Yellow River Basin have significant divergent characteristics in spatial and temporal distribution.
H2. Natural, economic, and social factors have a significant impact on the spatial pattern of high-level scenic spots.
3 Spatial distribution characteristics of tourist attractions and their evolution
3.1 Spatial distribution types of tourist attractions and their evolution
The mean nearest neighbor analysis tool was used to calculate the NNI of high-level tourist attractions in the area (Table 1); the NNI values of the spatial distribution of HLTAs from 2009 to 2021 were all less than 1, passed the Z-test and confidence test, and had a clustered spatial structure type. The NNI value first showed growth and then declined, indicating that the spatial agglomeration of HLTAs was first mildly weakened and tended to be uniformly distributed, and then, the agglomeration was strengthened.
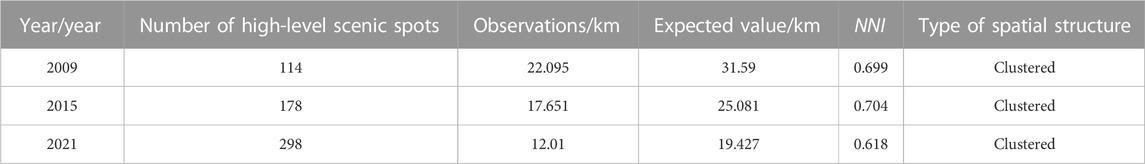
TABLE 1. NNI index and spatial structure type of HLTAs in the area from 2009 to 2021.
To eliminate the interference of administrative boundaries (Weng et al., 2021), the coefficient of variation (CV) of the Tyson polygon was used to measure the degree of agglomeration. The Cv values of the Tyson polygon were 131.8%, 161.4%, and 203.5% from 2009 to 2021, and the Cv value increased steadily during the period. When the Cv values are all greater than 64%, it shows an aggregation distribution, and higher Cvs represent a more obvious aggregation (Duyckaerts et al., 2000). The Cv values based on the Voronoi diagram area further verified the conclusion that the HLTAs in the area showed a clustered distribution trend.
3.2 Density of spatial distribution of tourist attractions and their evolution
After using ArcGIS 10.8 to analyze the Kernel density of HLTAs, the resultant values were graded, and distribution maps were generated according to the natural break method. The Kernel densities of HLTAs in the area were 2.7, 4.4, and 7.4 per 10,000 km2 in 2009, 2015, and 2021, respectively. The Kernel density gradually increased, and the degree of agglomeration continued to improve (Figure 3).
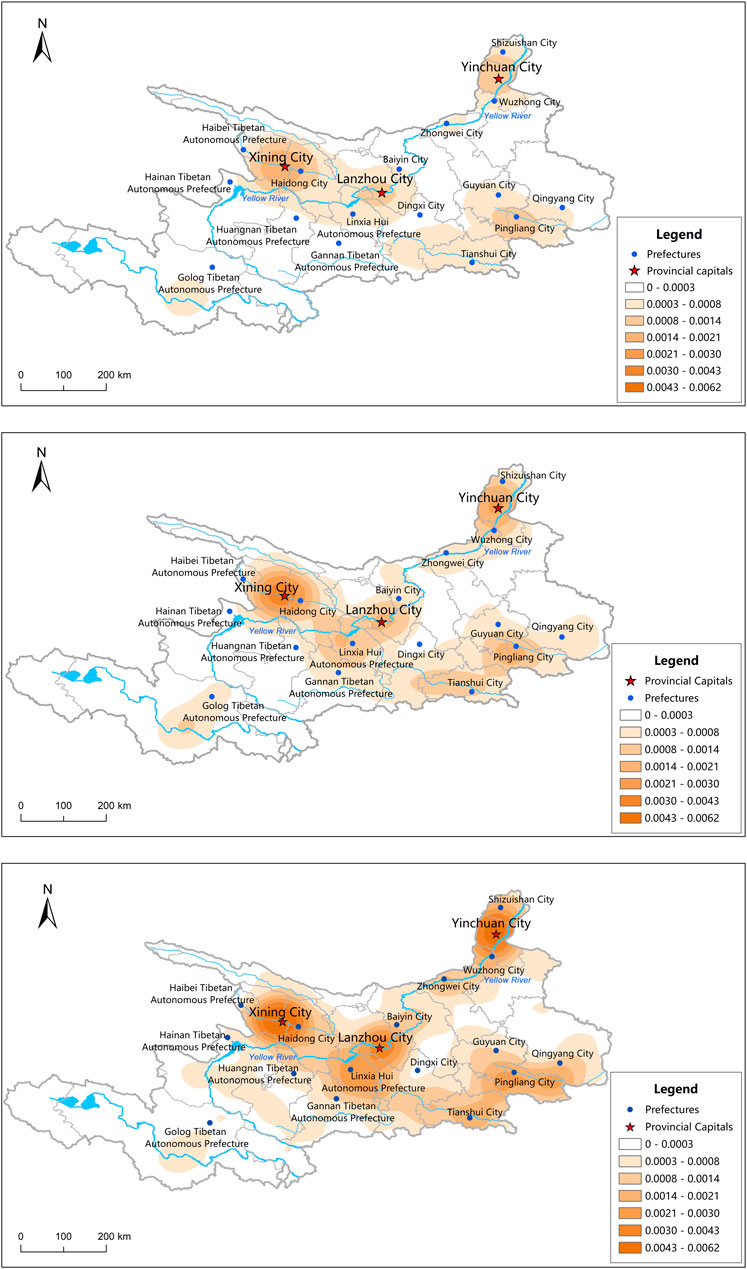
FIGURE 3. (A) is 2009’s distribution of high-level tourist attcations kernel density in the region. (B) is 2015’s distribution of high-level tourist attcations kernel density in the region. (C) is 2021’s distribution of high-level tourist attcations kernel density in the region.
The areas with the highest Kernel density in 2009 were near Lan-Xi-Yin and Pingliang. The Kernel density was highest in Lanxi along the yellow urban agglomeration area, the southeast area of Gansu, and the northern area of Ningxia, and it was lower in other areas. In 2015, the core cities were further strengthened and the Kernel density of secondary centers was extended to the southeast and northeast. The areas in Lanxi along the yellow urban agglomeration area and the southeast area of Gansu were connected as one and tended to be connected with the area of Ningxia. In 2021, with a further increase in the number of HLTAs, the three areas were concentrated and connected into one large area. In particular, along the yellow urban agglomeration area, the Kernel density grows rapidly. Overall, the spatiotemporal pattern of high-level tourist attractions shows a spatiotemporal evolution, with the provincial capital city as the core, key cities as sub-centers, and the Yellow River as the axis, with point-like clustering and belt-like extension coexisting.
The distribution of the Kernel density of HLTAs in the area had a more evident hierarchical nature. Lanzhou, Xining, and Yinchuan form the three cores, whereas Pingliang, Linxia, and Haidong in Qinghai, and Zhongwei in Ningxia form several sub-centers. The core area core density was above 43 per 10,000 km2, and the sub-center distribution density was above 30 per 10,000 km2. In addition, the medium-value area was distributed along the Yellow River and its tributaries, with a distribution density of more than 14 per 10,000 km2. The low-value areas are mainly distributed in the Yushu and Guoluo provinces of Qinghai Province, Dingxi City, Qingyang City of Gansu Province, and the loess hills and ravines of southeastern Ningxia Province. This may be related to the distribution of nature reserves, fragile natural geographical environments, ecological protection policies, transportation accessibility, population density, and socioeconomic development levels in some areas.
3.3 Spatial distribution center of gravity of tourist attractions and their directional evolution
The spatial distribution of HLTAs in the area from 2009 to 2021 was analyzed using standard deviation ellipse analysis to study the changes in their shapes, distribution directions, and the mobility of the center of mass (Figure 4). In 2021, the mean center of mass shifted to the east by approximately 16′ and to the north by approximately 6′. The center of mass is now located in Lanzhou City within Yuzhong County. Considering the Qing–Gan–Ning region of the Yellow River Basin as a whole, the distribution of HLTAs extends in the northeast direction as a whole; in other words, the development of HLTAs is faster in the northeastern part of the study area. The standard deviation ellipse has some significance for the balanced development of regional tourism and for avoiding bifurcation.
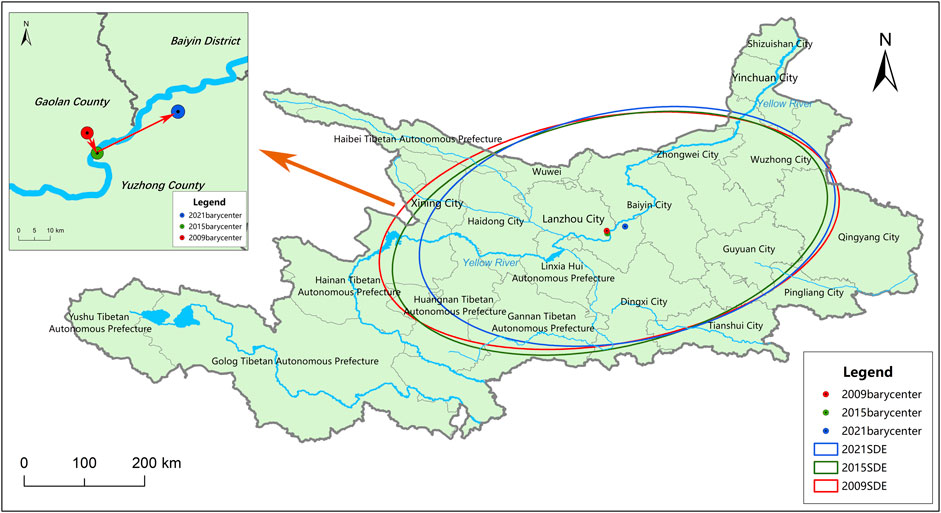
FIGURE 4. 2009–2021 slice of high-level scenic spatial distribution of the center of mass and standard deviation ellipse.
From 2009 to 2021, the area of the standard deviation ellipse decreased annually from 190,864 km2 to 174,647 km2. When the area of the ellipse decreases, the same proportion of high-level tourist attractions is distributed in smaller ellipses and the clustering of scenic spots in the ellipse increases. From 2009 to 2021, the long axis of the ellipse shortened from 320,969 km to 291,141 km, and the short axis remained almost the same. When the flatness of the standard deviation ellipse was smaller, the polarization in the direction of the long axis was weaker, and the standard deviation ellipse tended to be more positive; thus, the directionality of the distribution of the HLTAs was weaker. From the angle of deflection of the standard deviation, the angle of deflection of the ellipse decreased from 83.169° to 78.768° and then increased to 80.282°; the angle of deflection first decreased and then increased. The overall distribution pattern of the high-level tourist attractions was first deflected toward the northeast and then southeast. In general, the standard deviation of the elliptical area changed significantly; however, the morphology did not. The distribution direction of HLTA was northeast–southwest, which is consistent with the flow direction of the Yellow River in the region. It is assumed that the spatial distribution direction of HLTAs may be closely related to the flow direction of the Yellow River and the distribution of the water systems, which will be discussed later.
3.4 Spatial distribution linkage mechanism of tourist attractions and their evolution
The prefectural and county scales from 2009 to 2021 were subjected to ESDA exploratory spatial analysis (Table 2). The global Moran’s I index of HLTA in this area was obtained. At the prefectural scale, HLTAs are not statistically significantly spatially autocorrelated under the municipal unit. Under the county unit, Moran’s I indices for 2009, 2015, and 2021 were 0.1121, 0.1564, and 0.1218, respectively. Indices > 0, p-values passing the 0.05 significance test, and normal statistical Z-scores > 1.96 indicate that at the 95% confidence level, HLTAs have spatial autocorrelation under the county unit. From 2009 to 2015, Moran’s I index increased from 0.1121 to 0.1864, indicating that the spatial agglomeration of tourism tourist attraction neighborhoods increased, and spatial differences gradually became significant. From 2015 to 2021, Moran’s I index decreased to 0.1218, indicating that the spatial agglomeration of tourism tourist attraction neighborhoods weakened. The overall inter-neighborhood differences were first enhanced and then weakened. Spatial autocorrelation and neighborhood agglomeration in HLTAs are closely related to the development status of the tourism industry in the region and in each domain area, which will be discussed later.
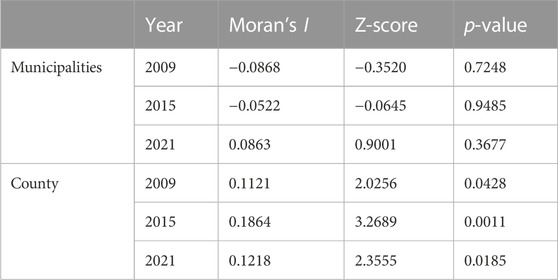
TABLE 2. Slice high-level landscape municipal county-scale global Moran’s I Index from 2009 to 2021.
Using the Anselin Local Moran’s index, a local indicator of spatial association (LISA) clustering map of the HLTA at the county scale was obtained (Figure 5). H–H areas from 2009 to 2021 were mainly concentrated in Xining City and Yinchuan City. After 2015, L–L areas began to appear, especially in the Qilian Mountains, Sanjiangyuan, and Gannan regions. The distribution of negatively correlated types was low, and the H–L areas showed a decreasing trend from 2009 to 2021, whereas the L–H areas showed an increase and then a decrease. The positively correlated H–H and L–L zones exhibited clustering and were widely distributed. The negatively correlated L–H and H–L zones show a point distribution that is more dispersed and smaller in scope.
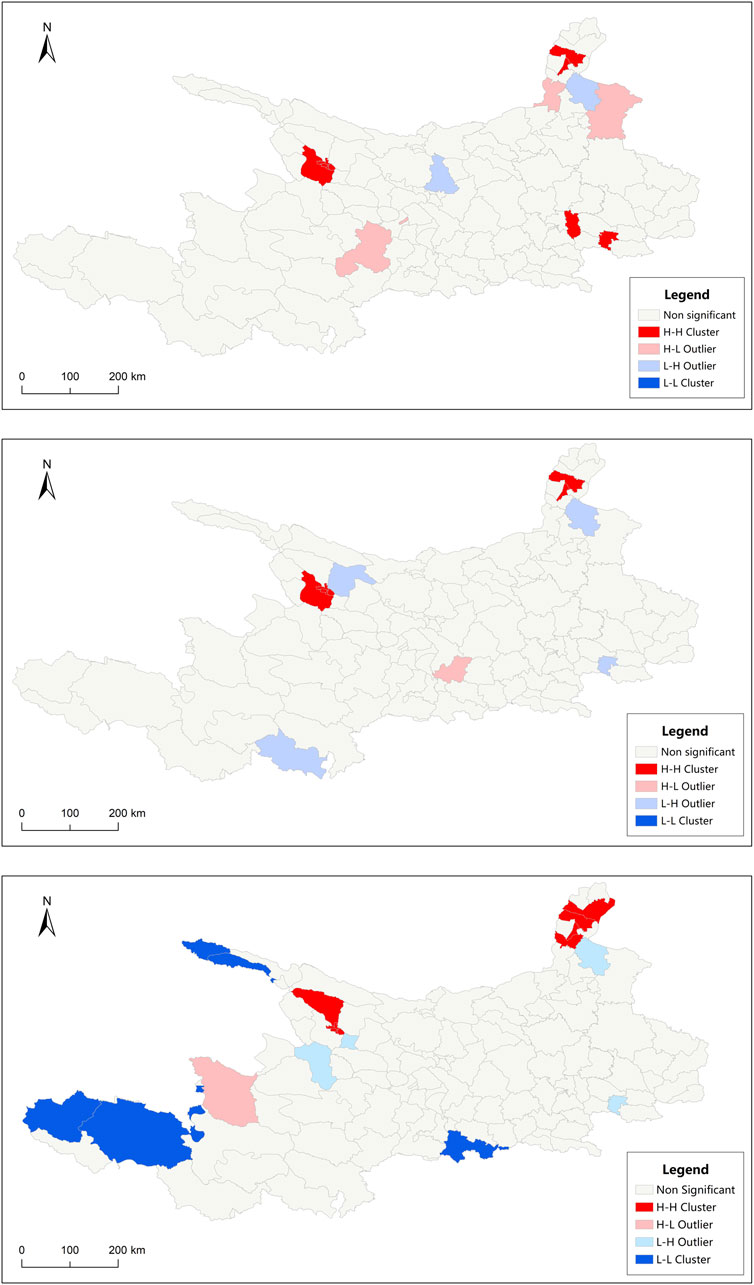
FIGURE 5. (A) is 2009’s local spatial autocorrelation LISA map of the slice counties. (B) is 2015’s local spatial autocorrelation LISA map of the slice counties. (C) is 2021’s local spatial autocorrelation LISA map of the slice counties.
The local spatial autocorrelation of eight counties, including Qinghai Huzhu County, changed from significant to non-significant, indicating that the spatial autocorrelation between the counties and surrounding counties weakened. Chongxin County in Gansu changed from an H–H area to an L–H area, and Ping’an District in Qinghai changed from a non-significant area to an L–H area, indicating that the surrounding HLTAs developed faster and lagged behind the surrounding areas due to the siphoning effect. Pingluo County and Yongning County in Ningxia changed from non-significant areas to H–H areas, indicating that the spatial distribution of HLTA in these two areas developed rapidly. Xinghai County of Qinghai changed from a non-significant area to an H–L area, indicating that the HLTA is developing well but does not significantly drive the development of the surrounding areas. The change from non-significant to L–L in Gangcha, Tianjun, Maduo, and Qumalai counties in Qinghai and Minxian in Gansu indicates that the density of HLTAs in and around the region is low and the development of HLTA is lagging in relation, which may be related to the ecological protection measures implemented in Sanjiangyuan National Park, Qilian Mountain National Park, and other nature reserves (Hao et al., 2022).
4 Influencing factor selection
This study explored the influencing factors, aiming to address the following questions: (1) “why is the distribution along the Yellow River?” (2) “Why does it show spatial and temporal divergence?” and (3) “Why does it show spatial autocorrelation?”. Many factors affect the spatial distribution of HLTAs in the Yellow River Basin area of Qing, Gansu, and Ningxia. The basin is a special geographical unit. Based on Wu et al. (2017), Zhang et al. (2018), Zhang S. et al. (2020), Li et al. (2020), and Wang et al. (2020), the following three major categories were selected as the factors affecting the distribution of HLTAs to reflect the common features and individual characteristics of the influencing factors. Natural factors are difficult for humans to change and are the basic and limiting factors in the spatial distribution of HLTAs. Areas with superior natural conditions are excellent for the development of HLTAs, and this study explored the influencing factors from three perspectives: river hydrology, resource endowment, and topography. Social and economic factors are important driving factors for the spatial pattern of HLTAs and their evolution, as well as one of the important factors for spatiotemporal pattern divergence. Examples include economic development, transportation accessibility, and visitor markets.
4.1 Natural factors
4.1.1 River system
The river system is an important element in the landscape and is the circulatory system of the watershed. Diverse water distribution conditions offer advantages as important carriers of tourism development in the Yellow River Basin. Tourism in the Yellow River Basin in Qing–Gan–Ning has developed and flourished because of water, which not only provides for the life and productivity of the coastal population but also provides high-quality resources for nature and humans. ArcGIS 10.8 was used to analyze the buffer zone of the main stream of the Qing–Gan–Ning Yellow River and its main tributaries (Duan et al., 2021). The analysis showed that the number of tourist attractions falling within the 3 km buffer zone was the highest, and the least number of locations fell within the 5-km buffer zone. From 2009 to 2021, 84, 140, and 204 locations fell into the three-level buffer zone on both sides of the main Yellow River and its major tributaries, accounting for 73.68%, 77.78%, and 68%, respectively. The remaining tourist attractions did not fall within the 10-km buffer zone. Combined with the nuclear density analysis in Figure 2 and the buffer zone analysis in Figure 6, it can be concluded that the spatial distribution of HLTAs in the Yellow River Basin has a strong connection with the distribution of river systems, which reflects a certain “hydrophilicity” and is one of the factors for the distribution of HLTAs along the Yellow River and the linear expansion along the Yellow River (Duan et al., 2019).
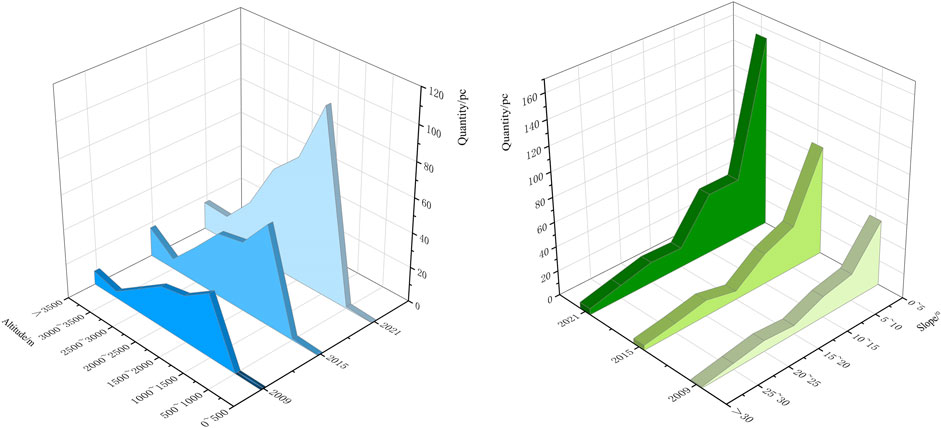
FIGURE 6. Elevation and slope distribution of HLTAs in the Qing–Gan–Ning region of the Yellow River Basin.
4.1.2 Resource endowment
Tourism resource endowment is the basis for the high-quality development of tourism in the Yellow River Basin. The spatial pattern of the HLTAs is an objective reflection of the elements of tourism resources in a region (Qin et al., 2022). The Yellow River Basin in Qing–Gan–Ning is located in the transition zone between the second and the third terrain in China, with mountains, hills, and plains. The area has 155 basic types of distribution: grasslands, forests, lakes, rivers, wetlands, deserts, glaciers, and other crisscrossed natural landscapes. It is also the intersection area of multi-ethnic and multi-cultural heritage with deep historical and cultural heritage. The tourism resources of the three regions have continuity, correlation, and complementarity in spatial distribution with better resource endowment. There are primarily world natural cultural heritage sites, national parks, national natural parks, national tourist attractions, national historical and cultural cities, and other high-quality tourism resources. Resource endowment is also an important factor influencing the spatial and temporal patterns of HLTAs, as shown by the possible spatial clustering of HLTAs of the same type.
4.1.3 Topographical features
Topography is the basic skeleton of tourism tourist attractions (Qiu et al., 2021) and determines the type and distribution of tourist attractions to a certain extent. In ArcGIS 10.8, 2009, 2015, and 2021 high-level tourist attraction data were superimposed onto the watershed area digital elevation model (DEM) to obtain elevation and slope data for each high-level tourist attraction (Figure 6). In terms of slope, HLTAs are mostly distributed in areas with a slope of 0°–10°, accounting for 67.34% of all HLTAs. In terms of altitude, 88.55% of HLTAs are distributed in areas with an altitude of 1,000 m–3000 m, and only 11.11% are distributed in high-altitude areas above 3,000 m. In other words, HLTAs are mostly distributed in areas with relatively low altitudes and flat terrain in the Loess Plateau, Qinghai–Tibet Plateau, and Loop Plain. The flat terrain is conducive to the layout and development of HLTAs.
4.2 Economic factors
4.2.1 Economic basis
Tourism is an economic activity that is directly impacted by the level of economic development. First, the economic base is important for the stable and healthy development of HLTAs. The economic base provides the necessary financial support for the planning, operation, product system construction, infrastructure, and talent introduction to the HLTA. In contrast, the rapid development of the regional tourism economy promotes the emergence of HLTAs and spatial agglomeration, which helps bring into play the radiation-driven role of tourism and deepens regional tourism cooperation, thus accelerating the growth of high-quality tourist attractions. The development and construction of HLTAs, and their spatial agglomeration, in turn, drive the development of the regional tourism economy.
4.2.2 Income level
The income level provides material guarantees for residents to travel and is an important driving force for the evolution of tourism spatial patterns. Between 2009 and 2021, with the rapid economic development of the Qing–Gan–Ning region, the living standards of residents improved significantly, and people had a higher pursuit of spiritual and cultural life. This brings about a change in consumption, which increases tourism demand, the willingness to travel, and tourism consumption expenditure to significantly increase and promote the development of tourism. In the context of mass tourism, the income level of residents has a profound impact on the layout of HLTAs and tourism development.
4.2.3 Industry development level
The tourism industry’s development level is an external expression of the evolution of regional tourism spatial patterns (Gan and Wang, 2021) and an important factor that constrains the high-quality development of tourism. The tourism development level is an important indicator of the level of utilization of tourism resources in a region. A good tourism industry foundation can promote the development of regional food, housing, transportation, tourism, shopping, entertainment, and related industries, which drive each other and, thus, promote the benign development of tourist attractions and bring about industrial agglomeration. In addition, a HLTA has high recreational value and attractiveness and often develops into key tourism development nuclei, which further influence the spatial pattern characteristics of tourist attractions. The level of industrial development is also an important factor affecting the spatial autocorrelation in HLTAs. When the industrial development of each region is separate and lacks linkage, the industrial development status is further stretched, and there is no positive correlation in space.
Table 3 Using GDP per capita, disposable income per capita, and tourism income as measurement factors, the results show that the Pearson correlation was ≥ 0.3 and passed the significance test. The selected factors show moderate or higher correlation with the number of HLTAs. In summary, the spatiotemporal pattern of HLTAs is significantly influenced by economic factors.
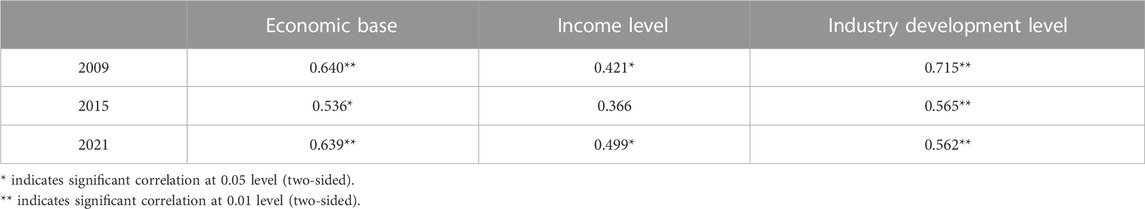
TABLE 3. Analysis of the number of HLTAs in the region and economic factors, and correlations from 2009 to 2021.
4.3 Social factors
4.3.1 Policy support
Government orientation is an external regulatory force for the evolution of the tourism spatial structure. On one hand, the dynamic management mechanisms and policy guidance of tourist attractions have a direct impact on the spatial pattern of HLTAs. On the other hand, dynamic management mechanisms and policy guidance exert an impact by making tourism development plans, improving tourism-supporting facilities, broadening tourism investment and financing channels, deepening regional tourism cooperation, helping to create a diversified HLTA, providing policy support for tourism development, and realizing high-quality tourism development. The number of HLTAs is increasing, the types of HLTAs are becoming richer, the spatial layout is more reasonable, and financial investment and policy support from governments at all levels are indispensable.
4.3.2 Traffic network
The transportation network is a channel linking tourist sources and destinations, which enhances the accessibility of tourist locations by reducing the spatial and temporal distance effects, and, thus, the psychological distance of tourists from tourist locations, enhancing tourists’ willingness to travel (38). It also has an important impact on the development and construction of tourism resources and the spatial distribution of HLTAs, and is the “blood vessel” for the evolution of the spatial and temporal patterns of HLTAs. Improving transportation networks improves the spatial agglomeration and spatial diffusion of HLTAs, and promotes the transformation of HLTAs into “point-line surfaces.” Buffer zone analysis was conducted on the main national and provincial roads in the area. Buffer zone analysis showed that the number of HLTAs within the buffer zone of major highways in 2009, 2015, and 2021 was 97, 151, and 257, respectively, accounting for 84.9%, 83.8%, and 85.6% of all HLTAs in the area (Figure 7).
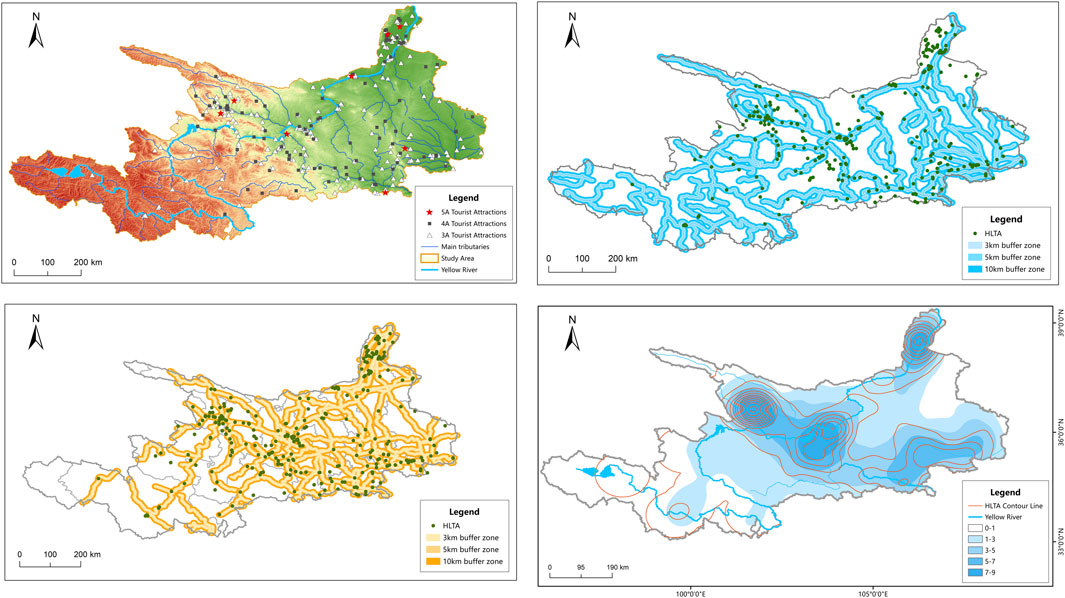
FIGURE 7. (A) is landforms overlay analysis of the impact factors of HLTAs. (B) is water system overlay analysis of the impact factors of HLTAs. (C) is road network overlay analysis of the impact factors of HLTAs. (D) is cities overlay analysis of the impact factors of HLTAs.
4.3.3 Guest market
Tourists influence the production and development of tourist attractions. As an important tourist destination, the spatial layout of the HLTA is closely related to the source market and population distribution. With the development of mass tourism and tourism demand, residents of tourist attractions have become an important source of tourists for such locations. The resident population influences the scale of the local tourism market and the scale of related tourism practitioners to meet the operational needs of tourist attractions and also brings consumer groups and passenger flow support for tourist attractions. Represented by urban areas with a high population size and consumption levels in the area, contours are generated based on the spatial distribution density of HLTAs and superimposed with the distribution density of municipal and county administrative centers in the area. The area with a high tourist attraction value distribution density has significant spatial coupling characteristics with the area with a high town distribution density. The trend of HLTAs in the Yellow River Basin relying on the town source market distribution is obvious. In addition, the distribution of towns and populations tends to be water-based and mostly distributed along rivers.
5 Geo-probe-based impact factor detection and interaction detection
5.1 Factor detection
These factors are verified using a GeoDetector. The data were clustered and discretized using the Jenks natural break method to generate the data type, and the influencing factors were introduced into the geographic probe to measure the influence of q-values and analyze the explanatory power of the factors influencing the spatial distribution pattern of HLTAs in Qing–Gan–Ning. Referring to the research results of scholars and the actual situation in the Qing–Gan–Ning region (Tang et al., 2019; Yao et al., 2019; Min et al., 2021), three major categories and 12 index systems were established. For this approach, X, Y, and Z are natural, economic, and social factors, respectively; X1 is the resource endowment, X2 is the altitude of the tourist attractions, X3 is the distance from rivers, X4 is the slope of the tourist attractions, Y1 is the proportion of the three industries, Y2 is the tourism income, Y3 is the per capita disposable income, Y4 is the urbanization rate, Z1 is the resident population, Z2 is tourism trips, Z3 is fiscal policy support, and Z4 is the distance from the traffic line. Yellow River Basin 2009 to 2021 HLTA factors in the order of the size of explanatory factor q are tourism industry income (0.7274) > tourism trips (0.6743) > scenic slope (0.62) > scenic distance from road (0.52) > per capita disposable income of residents (0.5) > fiscal policy support (0.489) > tertiary industry share (0.471) > distance from river (0.462) > resource endowment (0.441) > tourist attraction elevation (0.44) > resident population (0.411) > urbanization rate (0.404). After classification, economic (0.5257), social (0.5235), and natural factors (0.491) were identified (Table 4).
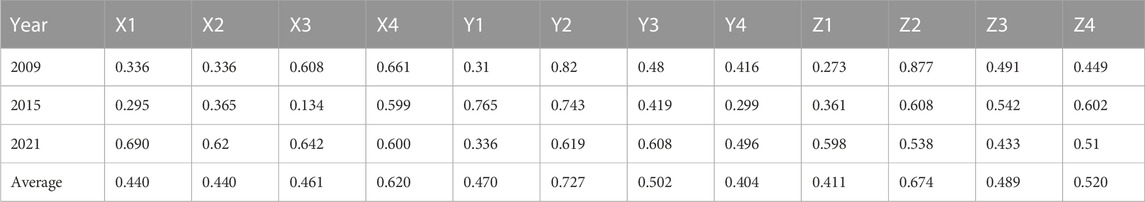
TABLE 4. Detection results of factors influencing the distribution of HLTAs in the Qing–Gan–Ning region of the Yellow River Basin from 2009 to 2021.
The q-values varied from year to year. From 2009 to 2021, the q-values of nine out of 12 factors affecting the spatial distribution of HLTAs showed an increase, indicating that the explanatory power of the influencing factors on the number of HLTAs is increasing. Three factors show a decline in both the q-value and the X4 slope factor, indicating that the topography of the HLTAs is becoming richer and more diverse. The Y2 disposable income of residents has less explanatory power for HLTAs, indicating that an increasing number of groups with average income participate in tourism, and the trend of mass tourism is significant. Z2 tourist trips show a decline in the q-value, indicating that more tourists are no longer consuming tickets, and the consumption per unit tourist increased, indicating the gradual development of in-depth tourism that emphasizes the experience and the feeling.
5.2 Interaction detection
Interaction detection mainly analyzes whether there is an interaction effect between factors in the spatial distribution of HLTAs. When q(x1∩x2) < Min(q(x1), q(x2)), the interaction shows nonlinear weakening; if Min(q(x1), q(x2)) < q(x1∩x2) < Max(q(x1), q(x2)), the interaction shows single-factor nonlinear weakening; when q(x1∩x2) > Max(q(x1), q(x2)), the interaction shows one-factor nonlinear weakening; when q(x1∩x2) > Max(q(x1), q(x2)), the interaction shows one-factor nonlinear weakening. When q(x1∩x2) > Max(q(x1), q(x2)), the two show a two-factor enhancement, when q(x1∩x2) = q(x1) + q(x2), they show independence, and finally, when q(x1∩x2)) > q(x1) + q(x2), they show a nonlinear enhancement.
Among the combinations of interaction probes (Table 5), the four groups that showed nonlinear enhancement were (X4∩Y1), (Y1∩Y4), (Y1∩Z2), and (Y1∩Z4), where Y1 showed nonlinear enhancement with the other four factors. The interactions among the remaining 74 groups of factors showed a two-factor enhancement.
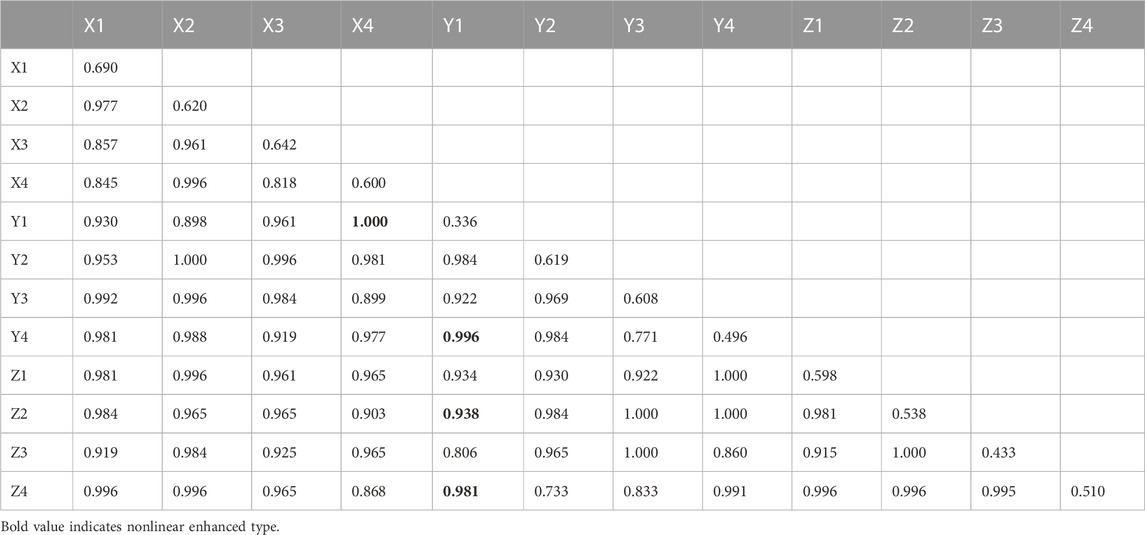
TABLE 5. Interaction detection results of factors influencing the spatial distribution of HLTAs in the Qing–Gan–Ning region of the Yellow River Basin from 2009 to 2021.
The results of interaction detection show that there is an interaction between any two influencing factors, which enhances the explanation of the spatial distribution of HLTAs. This indicates that the spatial and temporal evolution of the spatial pattern of HLTAs in the area is not only influenced by the natural environment, society, and economy but also that each factor interacts with the others to form the spatial distribution pattern of HLTAs.
6 Discussion
(1) From the viewpoint of natural influencing factors, the spatial distribution pattern of HLTAs is influenced by natural factors such as resource endowment, topography, geomorphology, and hydrology. Therefore, regarding tour operators and tourist attractions, scientific and systematic planning and development of HLTAs should be conducted, and the development mode of tourist attractions should be changed to promote the rational allocation of resources oriented to the resource–product–market brand (Xiao et al., 2011).
(2) From the perspective of economic and social factors, governments and policy-making authorities should first improve the construction of tourism-supporting infrastructure, establish a hierarchical transportation network, strengthen spatial connections, and enhance the accessibility and convenience of tourist attractions, continuing to promote overall economic and societal development. We should also raise income levels to increase the potential for residents’ tourism consumption and provide a source market for HLTAs. Simultaneously, high-quality and comprehensive talent should be cultivated in the fields of culture and tourism to enhance the level of tourism services.
(3) From the current regional development, the H–H areas can adopt the agglomeration-line diffusion development mode to create a high-standard demonstration area. The L–H and H–L areas can adopt the growth pole diffusion mode with bigger and more advantageous tourist attractions. The L–L areas can adopt the ecological-common promotion development mode with ecological priority and cross-area cooperation, a point to lead the line, a point to become a line, and a line to lead the surface, and break the low–low agglomeration situation, promoting the upgrade of tourism scenic spots to high-level tourism scenic spots (Chang et al., 2023).
(4) We should establish cross-regional linkage development and tourism cooperation mechanism, give full play to the advantages of complementary resources, geographical proximity, and cultural commonality, and strengthen the linkage development between provinces, high-level scenic spots, and high-level scenic spots in the upper, middle, and lower reaches of the Yellow River. At the same time, we should actively cultivate the Internet + new tourism industry, accelerate the construction of high-level scenic site informationization, actively build intelligent scenic spots, and optimize intelligent information systems. In addition, we should actively explore the creation of the Yellow River National Cultural Park brand, digging deeper into the local characteristics of culture, the Yellow River culture, ethnic culture, and promote the organic integration of cultural tourism.
(5) Taking the Silk Road Economic Belt as an opportunity, with “one axis, two wings, three cores, and ten districts” as the blueprint, we suggest building the Yellow River Basin into a world-class golden cultural tourism belt to achieve high-quality tourism development (Yu and Chen, 2022).
“One axis” is the main development axis of the Yellow River. The Yellow River was used as a link to establish a cross-regional cooperation mechanism. The linkage development between provinces, HLTAs, and HLTAs on the Yellow River should be strengthened to realize the complementary advantages of regional tourism resources and the mutual delivery of tourists.
The “two wings” of the Yellow River are formed by its four first-class tributaries (i.e., Huangshui–Datong River and Weihe–Daxia River development wings). We suggest building the Yellow River–Silk Road intelligent tourism belt, including online and offline synergistic promotion and active cultivation of the “Internet + tourism” industry, enrichment of online tourism activity, and actively carrying out online and offline multiple image shaping, marketing, and intelligent tourist attraction construction (Figure 8).
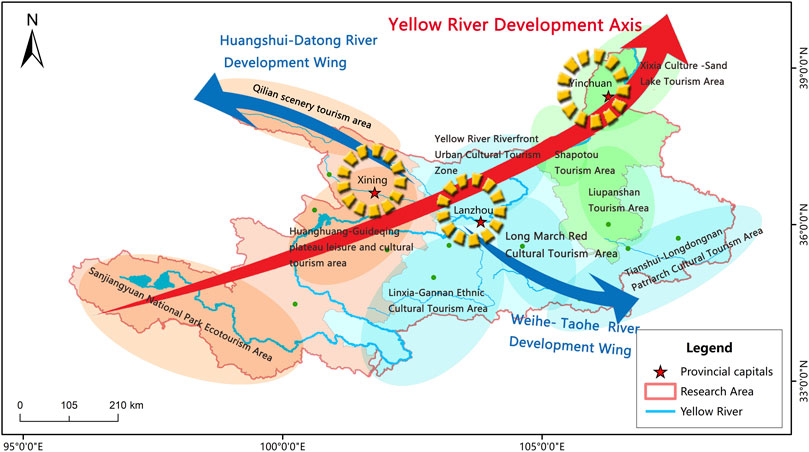
FIGURE 8. Spatial pattern of tourism in the Qing–Gan–Ning region of the Yellow River Basin.
The “three cores” are the provincial capitals of Qinghai, Gansu, and Ningxia (the capital). Xining, Lanzhou, and Yinchuan are the three major growth poles. The central city played a leading role in enhancing the radiation functions of the core area. In contrast, secondary tourism cities, such as Qinghai Haidong, Gansu Linxia, and Tianshui, should be developed to achieve an orderly and efficient tourism node in the hierarchical system.
The “ten districts” form the Qing–Gan–Ning 10 key tourism function board. We suggest enrichment and improvement of the product system. The Yellow River-theme tourism brands include Chinese civilization exploration, world heritage, ecological culture, non-foreign heritage culture, red gene inheritance, Yellow River peace, grotto culture, ancient capital new cities, and rural revitalization.
There are some shortcomings and uncertainties in this study. First, we selected the Qing–Gan–Ning region of the Yellow River Basin as the research area and the scope of the research area is relatively small. Future work should compare and analyze the HLTAs in the upper, middle, and lower reaches of the Yellow River. From the data source perspective, the social statistics are mostly from the municipal level, and the accuracy of the research on the micro level is poor. In terms of the influencing factors, the factors selected in this paper are not broad enough, and the influencing factors will vary from time to time and place to place. This study shows that the spatial pattern of high-level tourist attractions is formed by the interaction of natural, economic, and social factors, so there is uncertainty whether the high-level tourist attractions in the Qing–Gan–Ning region will continue to maintain the evolution of “point-like clustering and belt-like extension” in the next 6 years. Second, this study abstracts all the tourist attractions as “point-like elements,” and there is uncertainty whether the abstraction as point-like elements will affect the accuracy of the research conclusions.
In the future, we will further study the influence mechanism based on microscale data, such as counties, to improve the accuracy of the research results and provide a scientific reference for the high-quality development of HLTAs in the Yellow River Basin.
7 Conclusion
This study investigated the spatial distribution and influencing factors of premium tourist attractions in the Qing–Gan–Ning region of the Yellow River Basin from 2009 to 2021. The main findings are the following. (1) Distribution type: in the nodal years, the premium scenic spots in the basin exhibited a cohesive distribution pattern. The nearest neighbor index values were 0.699, 0.70, and 0.618, with a coefficient of variation of Tyson polygons ranging from 131.8% to 203.5%. (2) Density and evolutionary trend: the density of premium sites per 10,000 km2 during the nodal years was 27, 44, and 74, respectively. These sites showed a trend of point-like clustering and linear expansion, with the provincial capital and the Yellow River as the central elements. (3) Distribution center of mass and direction: the distribution center of mass for premium scenic spots was located in Yuzhong County, Gansu Province. The deflection angles ranged from 83.169° to 80.282°, aligning with the flow direction of the Yellow River. (4) Spatial autocorrelation: at the county scale, the distribution of premium scenic spots exhibited a piecewise pattern. The positively correlated areas had a wide distribution range, while the negatively correlated areas showed a point-like distribution. (5) Influencing factors: economic factors (0.5257) had the greatest impact on the spatial distribution of high-level scenic spots, followed by social factors (0.5235) and natural factors (0.491). The interaction among these factors demonstrated two-factor enhancement and nonlinear enhancement, shaping the final spatial distribution pattern of premium tourist attractions.
Data availability statement
The raw data supporting the conclusion of this article will be made available by the authors, without undue reservation.
Author contributions
Conceptualization: RS. Formal analysis: RS. Methodology: RS and YY. Investigation: RS. and YY. Writing—original draft preparation: RS and YY. Writing—review and editing: JX and XK. Visualization: RS and YY. Supervision: JX. Funding acquisition: JX. All authors contributed to the article and approved the submitted version.
Funding
This research was supported by the Social Science Planning Project of Qinghai Province (grant No. 2022Y012), the Social Science Planning Project of Qinghai Province (grant No. 2022ZCY033), and the Applied Basic Project of Qinghai Science and Technology Department (grant No. 2018-ZJ-789).
Acknowledgments
The researchers would like to express their gratitude to the reviewers. Their valuable suggestions to improve the quality of this paper are appreciated. We thank Editage for its linguistic assistance during the preparation of this manuscript.
Conflict of interest
The authors declare that the research was conducted in the absence of any commercial or financial relationships that could be construed as a potential conflict of interest.
Publisher’s note
All claims expressed in this article are solely those of the authors and do not necessarily represent those of their affiliated organizations, or those of the publisher, the editors, and the reviewers. Any product that may be evaluated in this article, or claim that may be made by its manufacturer, is not guaranteed or endorsed by the publisher.
References
Bao, Y. F., Jiang, H. J., Ma, E., Sun, Z., and Xu, L. H. (2023). A longitudinal spatial-temporal analysis of ancient village tourism development in zhejiang, China. Sustainability 15, 143. doi:10.3390/su15010143
Chang, B. R., Ding, X. J., Xi, J. C., Zhang, R. Y., and Lv, X. H. (2023). Spatial-temporal distribution pattern and tourism utilization potential of intangible cultural heritage resources in the yellow river basin. Sustainability 15, 2611. doi:10.3390/su15032611
Chen, H., Lu, L., and Zheng, S. T. (2011). The tourism spatial pattern evolution of the pearl river delta. Acta Geogr. Sin. 66, 1427–1437. doi:10.3724/SP.J.1011.2011.00415
Cheng, Z. H., and Niu, L. Q. (2016). Measurement on the attitude of ecotourists towards the management means of scenic resort based on the environmental cognition. Hum. Geogr. 31, 136–144. doi:10.13959/j.issn.1003-2398.2016.02.021
Duyckaerts, C., and Godefroy, G. (2000). Voronoi tessellation to study the numerical density and the spatial distribution of neurons. J. Chem. Neuroanat. 20, 83–92. doi:10.1016/S0891-0618(00)00064-8
Duan, W. L., Chen, Y. N., Zou, S., and Nover, D. (2019). Managing the water-climate- food nexus for sustainable development in Turkmenistan. J. Clean. Prod. 220, 212–224. doi:10.1016/j.jclepro.2019.02.040
Duan, W. L., Maskey, S., Chaffe, P., Luo, P. P., He, B., Wu, Y., et al. (2021). Recent advancement in remote sensing technology for hydrology analysis and water resources management. Remote Sens. 13, 1097. doi:10.3390/rs13061097
Fyall, A., Leask, A., Barron, P., and Ladkin, A. (2017). Managing Asian attractions, generation y and face. J. Hosp. Tour. Manag. 32, 35–44. doi:10.1016/j.jhtm.2017.04.006
Gan, C., and Wang, K. (2021). Spatial distribution pattern and influencing factors of high-quality tourist attractions in wuling moun-tains area. Resour. Environ. Yangtze Basin 30, 2115–2125. doi:10.11870/cjlyzyyhj202109007
Grayson, K., and Martinec, R. (2004). Consumer perceptions of iconicity and indexicality and their influence on assessments of authentic market offerings. J. Consumer Res. 31, 296–312. doi:10.1086/422109
Gu, Y. Q., Yang, J., Feng, X. L., Li, C., and Li, X. M. (2015). Spatial differentiation of human settlement environment suitability in Chinese typical tourist cities. Sci. Geogr. Sin. 35, 410–418. doi:10.13249/j.cnki.sgs.2015.04.410
Guedes, A. S., and Jiménez, M. I. M. (2015). Spatial patterns of cultural tourism in Portugal. Tour. Manag. Perspect. 16, 107–115. doi:10.1016/j.tmp.2015.07.010
Guo, Q., Zhong, Y., Li, J., Wang, Q., and Huang, Z. (2012). The research on the spatial structure of a-grade tourist districts in poyang lake eco-economic zone. J. Jiangxi Normal Univ. Sci. Ed. 36, 646–652. doi:10.16357/j.cnki.issn1000-5862.2012.06.002
Hao, Z., Ye, D., Hui, W., Han, Z. L., and Wang, H. Y. (2022). An empirical analysis of tourism eco-efficiency in ecological protection priority areas based on the dpsir-sbm model: A case study of the yellow river basin, China. Ecol. Inf. 70, 101720. doi:10.1016/j.ecoinf.2022.101720
Jaafar, M., Noor, S. M., and Rasoolimanesh, S. M. (2015). Perception of young local residents toward sustainable conservation programmes: A case study of the lenggong world cultural heritage site. Tour. Manag. 48, 154–163. doi:10.1016/j.tourman.2014.10.018
Kang, S., Lee, G., Kim, J., and Park, D. (2018). Identifying the spatial structure of the tourist attraction system in South Korea using gis and network analysis: An application of anchor-point theory. J. Destination Mark. Manag. 9, 358–370. doi:10.1016/j.jdmm.2018.04.001
Li, D. H., Zhang, X. Y., Lu, L., Zhang, X., and Li, L. (2020). Spatial distribution characteristics and influencing factors of high-level tourist attractions in the yellow river basin. Econ. Geogr. 40, 70–80. doi:10.15957/j.cnki.jjdl.2020.05.008
Li, Y., Caixia, S., and Binggeng, X. (2019). Temporal and spatial pattern evolution characteristics and driving factors of national wetland parks in the yangtze river basin. Econ. Geogr. 39, 194–202. doi:10.15957/j.cnki.jjdl.2019.11.023
Li, Y. J., Chen, T., and Wang, J. (2013). Spatial structure of tourism attractions in qiandongnan prefecture. Resour. Sci. 35, 858–867.
Liao, Z. J., and Zhang, L. J. (2021). Spatial distribution evolution and accessibility of a-level scenic spots in guangdong province from the perspective of quantitative geography. Plos One 16, e0257400. doi:10.1371/journal.pone.0257400
Lin, C. H., Chen, J. Y., Hsu, S. S., and Chung, Y. H. (2014). Automatic tourist attraction and representative icon determination for tourist map generation. Inf. Vis. 13, 18–28. doi:10.1177/1473871612472177
Liu, D. J., Hu, J., and Chen, J. Z. (2014). The spatial structure and disparities of leisure tourism destinations in wuhan. Econ. Geogr. 34, 176–181. doi:10.15957/j.cnki.jjdl.2014.03.028
Ma, L., Ma, Y. F., and Lin, Z. H. (2013). A comparative study of the spatial structure of 100 tourism attractions. Resour. Sci. 35, 296–303.
Ma Xf, Y. X. (2019). Spatio-temporal distribution of high-level tourist attractions and spatial heterogeneity of its influencing factors in Western hunan. J. Nat. Resour. 34, 1902–1916. doi:10.31497/zrzyxb.20190908
Min, W., Mei, H., Guozhong, C., Lixin, T., and Xianglun, K. (2021). Spatial distribution changes and influencing factors of A-level tourist attractions based on geodetector. Chinese J. Popul. Resour. Environ. 31 (8), 166–176. doi:10.12062/cpre.20210436
Qin, J. X., Duan, W. L., Chen, Y. N., Dukhovny, V. A., Sorokin, D., Li, Y., et al. (2022). Comprehensive evaluation and sustainable development of water-energy-food-ecology systems in central Asia. Renew. Sustain. Energy Rev. 157, 112061. doi:10.1016/j.rser.2021.112061
Qiu, Y. H., Yin, J., Zhang, T., Du, Y. M., and Zhang, B. (2021). Spatiotemporal dynamic analysis of a-level scenic spots in guizhou province, China. Isprs Int. J. Geo-Information 10, 568. doi:10.3390/ijgi10080568
Samitas, A., Asteriou, D., Polyzos, S., and Kenourgios, D. (2018). Terrorist incidents and tourism demand: Evidence from Greece. Tour. Manag. Perspect. 25, 23–28. doi:10.1016/j.tmp.2017.10.005
Tang, C. C., Sun, M. Y., and Wan, Z. W. (2019). Spatial distribution characteristics of high-level scenic spots and its influencing factors in beijing-tianjin-hebei urban agglomeration. Econ. Geogr. 39, 204–213. doi:10.15957/j.cnki.jjdl.2019.10.025
Wang, T., Wang, L., and Ning, Z. Z. (2020). Spatial pattern of tourist attractions and its influencing factors in China. J. Spatial Sci. 65, 327–344. doi:10.1080/14498596.2018.1494058
Weber, J., and Sultana, S. (2013). Why do so few minority people visit national parks? Visitation and the accessibility of “America's best idea”. Ann. Assoc. Am. Geogr. 103, 437–464. doi:10.1080/00045608.2012.689240
Weng, G. M., Shen, K., and Pan, Y. (2021). Spatial differentiation characteristics and formation mechanism of rural tourism destinations in China:based on 1000 key rural tourism villages. Geogr. Geo-Information Sci. 37, 99–105. doi:10.3969/j.issn.1672-0504.2021.04.014
Wu, L. M., Huang, Z. F., Zhou, W., and Fang, Y. L. (2013). The spatiotemporal evolution and dynamic mechanism of a-grade tourist attractions in jiangsu province. Econ. Geogr. 33, 1158–1164. doi:10.15957/j.cnki.jjdl.2013.08.027
Wu, Q., Li, X. G., Wu, L., and Chen, S. (2017). Distribution pattern and spatial correlation of a-grade tourist attractions in hunan province. Econ. Geogr. 37, 193–200. doi:10.15957/j.cnki.jjdl.2017.02.026
Wu, T. H., Zhang, J., and Li, W. J. (2009). The spatial pattern evolution of the inbound tourism economic development level and the causes in China—Based on the inbound tourism economic entropy analysis. J. Arid Land Resour. Environ. 23, 189–194. doi:10.13448/j.cnki.jalre.2009.05.037
Wu, X. Y., and Chen, C. Y. (2022). Spatial distribution and accessibility of high level scenic spots in inner Mongolia. Sustainability 14, 7329. doi:10.3390/su14127329
Xiao, J., Cao, G., Hou, G., Zhao, R., Fang, Y., Gao, R., et al. (2011). The development of geopark ecotourism in the Qinghai-Tibet Plateau: A case study of the kanbula national geopark. Acta Geosci. Sin. 19, 225–234. doi:10.1007/s10577-011-9192-9
Xiaoxiao, L., Peiji, S., and Ruidong, Z. (2018). Spatial network structure and optimization of self-help tourism in gansu-qinghai-ningxia region. J. Arid Land Resour. Environ. 32, 197–203. doi:10.13448/j.cnki.jalre.2018.387
Xinyue, W., and Juanjuan, H. (2016). Spatial distribution features and influence factors of rural leisure tourism destinations in shandong province. Sci. Geogr. Sin. 36, 1706–1714. doi:10.13249/j.cnki.sgs.2016.11.013
Yang, Z., Tian, J., Li, W., Su, W., Guo, R., et al. (2021). Spatio-temporal pattern and evolution trend of ecological environment quality in the yellow river basin. Acta Ecol. Sin. 41, 7627–7636. doi:10.5846/stxb202012083131
Yang, Z., Yin, M., Xu, J., and Lin, W. (2019). Spatial evolution model of tourist destinations based on complex adaptive system theory: A case study of southern anhui, China. J. Geogr. Sci. 29, 1411–1434. doi:10.1007/s11442-019-1669-z
Yao, Y. J., Jing, H., and Liu, D. J. (2019). Spatial evolution and influence mechanism of a-level scenic spots in urban agglomeration in the middle reaches of the yangtze river. Econ. Geogr. 39, 198–206. doi:10.15957/j.cnki.jjdl.2019.01.024
Yu, X., and Chen, H. X. (2022). Study on coupling coordination of the human settlement environment and tourism industry in the yellow river basin. Front. Environ. Sci. 10. doi:10.3389/fenvs.2022.1016839
Yuan, C., Hou, Z., and Chen, J. (2015). Biocompatibility of Mn0.4Zn0.6Fe2O4 magnetic nanoparticles and their thermotherapy on VX2-carcinoma-induced liver tumors. Areal Reseach Dev. 32, 74–84. doi:10.1166/jnn.2015.9150
Zha, A., and Qiu, J. (2015). Recreational value assessment on hangzhou west lake scenic area based on travel cost. Tour. Sci. 29, 366–373. doi:10.16323/j.cnki.lykx.2015.05.004
Zhan, M. S., and Zhu, J. H. (2019). Spatial planning of qingyun mountain scenic spot in benxi, northeast China based on ecological sensitivity assessment. Ying Yong Sheng Tai Xue Bao= J. Appl. Ecol. 30, 2352–2360. doi:10.13287/j.1001-9332.201907.037
Zhang, C., Weng, S., and Bao, J. (2020a). The changes in the geographical patterns of China’s tourism in 1978–2018: Characteristics and underlying factors. J. Geogr. Sci. 30, 487–507. doi:10.1007/s11442-020-1739-2
Zhang, H., Duan, Y., and Han, Z. (2021). Research on spatial patterns and sustainable development of rural tourism destinations in the yellow river basin of China. Land 10, 849. doi:10.3390/land10080849
Zhang, J. S., and Wang, F. F. (2007). Principles and application of using entropy-weight-based multiple-destination travel cost method to evaluate the tourism value of recreation resources: A case study of wuyishan. J. Nat. Resour. 22, 28–36. doi:10.3321/j.issn:1000-3037.2007.01.004
Zhang, S., Zhang, G., and Ju, H. (2020b). The spatial pattern and influencing factors of tourism development in the yellow river basin of China. Plos One 15, e0242029. doi:10.1371/journal.pone.0242029
Zhang, X., Cheng, S., and Sun, Y. (2018). Spatial distribution characteristics and influence factors of high-grade tourism resources in yangtze river economic belt. Areal Res. Dev. doi:10.3969/j.issn.1003-2363.2018.05.017
Zhu, H., and Chen, X. L. (2008). Space distribution structure of a-grade scenic spot in China. Sci. Geogr. Sin. 28, 607–615. doi:10.13249/j.cnki.sgs.2008.05.607
Zhu, S. D., Bai, Z. Y., Gan, Z. T., Jin, S. L., Zhang, C., and Wang, J. (2022). Simulation of the spatial pattern of scenic spots combining optimal scale and deep learning. Front. Earth Sci. 10. doi:10.3389/feart.2022.887043
Keywords: Yellow River Basin, high-level tourist attractions, spatiotemporal pattern, influencing factors, GeoDetector, Qing–Gan–Ning region
Citation: Shu R, Xiao J, Yang Y and Kong X (2023) The evolution of spatiotemporal patterns and influencing factors of high-level tourist attractions in the Yellow River Basin. Front. Earth Sci. 11:1206716. doi: 10.3389/feart.2023.1206716
Received: 16 April 2023; Accepted: 07 July 2023;
Published: 28 July 2023.
Edited by:
Cletah Shoko, University of the Witwatersrand, South AfricaReviewed by:
I. Gusti Bagus Rai Utama, Dhyana Pura University, IndonesiaWeili Duan, Chinese Academy of Sciences (CAS), China
Copyright © 2023 Shu, Xiao, Yang and Kong. This is an open-access article distributed under the terms of the Creative Commons Attribution License (CC BY). The use, distribution or reproduction in other forums is permitted, provided the original author(s) and the copyright owner(s) are credited and that the original publication in this journal is cited, in accordance with accepted academic practice. No use, distribution or reproduction is permitted which does not comply with these terms.
*Correspondence: Jingyi Xiao, eGlhb2ppbmd5aUBxaG51LmVkdS5jbg==; Yanxia Yang, MjAyMTQ3MzMxMDE5QHN0dS5xaG51LmVkdS5jbg==