 Zixiu Qin1
 Xianjie Chen
- 1Guangxi Xinfazhan Communication Group Co., Ltd., Nanning, China
- 2College of Civil Engineering and Architecture, Guangxi University, Nanning, China
In order to achieve the highly efficient and accurate identification of fracture modes including tension or shear fractures during rock failure, an intelligent identification method based on Wigner-Ville distribution (WVD) spectrogram features of acoustic emission (AE) signals was proposed. This method was mainly constructed by the following steps: Firstly, AE hits corre-sponding to tension and shear fractures were obtained through conducting the Brazilian disc test (tension fracture) and direct shear test (shear fracture) of limestone. Secondly, the WVD spectro-grams of these tensile-type and shear-type AE hits were respectively extracted and then trans-formed into the image features of relatively low-dimension as the sample set based on the gray-level cooccurrence matrix (GLCM) and histogram of oriented gradient (HOG). Finally, on the basis of the processed and classified sample set of the WVD spectrogram features, an identifica-tion model of rock fracture modes was established by a support vector machine (SVM) learning algorithm. To verify this method, the fracture modes of limestone subjected to biaxial compres-sion were identified by the method. The results showed that the method not only can greatly re-veal the fracture modes change from tension-dominated to shear-dominated fractures, but also has advantages over the RA-AF value method, such as applicability, accuracy and practicality.
1 Introduction
Geological hazards such as landslides, rock collapses (Figure 1A) and rockbursts (Figure 1B) are rock destabilization phenomena caused by the evolution of rock fracture. The types of rock fractures can be mainly divided into tensile fracture, extensional shear fracture and compressional shear fracture (Etheridge, 1983; Zhou et al., 2022).
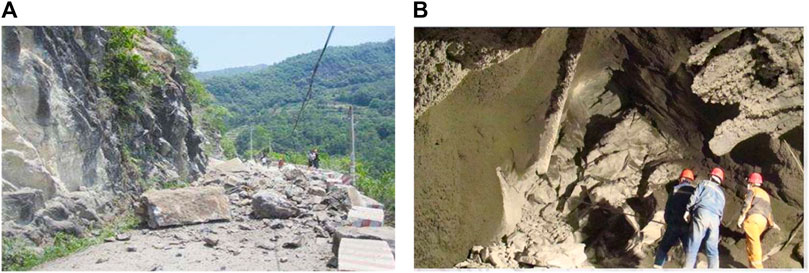
FIGURE 1. (A) Rock collapse in Guilin, China, (B) rockburst at Jinping Hydropower Station in China.
These fracture characteristics can be descripted as the following: tensile fracture is characterized by the maximum tensile stress perpendicular to the fracture surface; extensional shear fracture, also known as a mixed fracture, is composed of tension and shear stresses existing with the fracture surface; compressional shear fracture (equal to shear fracture) is consists of compressive and shear stresses distributed with the fracture surface (Zhou et al., 2016). Moreover, a series of research found there are the distinguished change (from tension-dominated fracture to shear-dominated fracture) of the fracture modes in the rock failure processes (Hou et al., 2009; Sagong et al., 2011). Therefore, the identification of rock fracture modes (tension/shear fracture) can provide useful information for accurately predicting destabilization of rocks.
There are many randomly distributed microcracks inside the rocks. When rock is subjected to external loads, the microcracks inside the rocks are continuously generated, expanded, and finally penetrated to form rock fractures. To study the mechanical behaviour and fracture modes of rock damage processes, technical means of numerical simulation (Niu et al., 2023a), nuclear magnetic resonance (NMR) (Bi et al., 2023), X-ray computed tomography (CT) (Xiao et al., 2021; Xiao et al., 2022) are used, while rock-like materials are also in focus (Bi et al., 2020). In addition, rock damage processes will release local energy in the form of elastic waves inside the rocks, which is called rock acoustic emission (AE) phenomenon (Hardy, 1972). In recent years, AE monitoring has been used to record the cracking process in flawed rocks (Zhang and Zhou, 2020; Niu et al., 2023b), to record the fracture process in shales under anisotropic stresses (Niu et al., 2023c), and to forecast time-of-instability in rocks under complex stress conditions based on the spatio-temporal AE technique (Niu and Zhou, 2021). AE monitoring has emerged as an acoustic tool capable of monitoring rock damage processes. It has been studied that the AE signals generated by tensile fracture and shear fracture have different characteristics (Ohno and Ohtsu, 2010; Wang et al., 2018). According to these different characteristics, the AE signals can be divided into tensile-type signals and shear-type signals. Therefore, the evolution of rock fracture modes can be analyzed by identifying the types of AE signals during rock fracture.
The common AE-based methods currently used to identify rock fracture modes are AE parameter-based method (Ohno and Ohtsu, 2010) and the moment tensor analysis (Gilbert, 1971). The AE parameter-based method refers to using the parameters of AE in the process of rock fracture to discriminate the fracture types of rocks, in which the most widely used discrimination method is the proportion of the rise angle (RA) and the average frequency (AF) (hereinafter referred to as the RA-AF value method) (Shiotani et al., 2001). Ohno and Ohtsu compared the gradual transition of cracks from tension to shear using the RA-AF value method and the simplified Green’s function for moment tensor analysis (SiGMA), and the analysis showed that the results of the two methods were in high agreement (Ohno and Ohtsu, 2010). Aggiles used the AE parameter-based method to analyze the AE signals generated during the fracture of concrete, marble and granite, respectively (Aggelis, 2011; Aggelis et al., 2013), and he obtained the fracture mechanism of these materials from tensile microcracking to brittle macroscopic cracking and summarized the respective waveform characteristics of AE tension and shear signals (Li et al., 2022). By analyzing the parametric characteristics of AE signals in a series of three-point bending tests and straight shear tests, Wang et al. concluded that tensile-type AE signals are characterized by higher AF and lower RA (Wang et al., 2016). In comparison, shear-type AE signals are characterized by lower AF and higher RA (Wang et al., 2016). Although this method is simple to calculate, it considerably relies on the ratio k, which affects the accuracy of fracture type identification.
The moment tensor analysis was first applied to AE signal analysis by Gilbert (1971) and was widely adopted because of its ability to describe more objectively the fracture modes. Ohtsu (1995) combined the deconvolution analysis and moment tensor analysis to analyze and determine the location and fracture type of AE sources in 3D elastomers. Chang and Lee (2004) analyzed the cracking damage mechanism of rocks under triaxial compression based on the moment tensor analysis of AE signal-based method. It was shown that the shearing effect of rocks under triaxial compression conditions becomes more pronounced as the surrounding pressure increases. Ren et al. (2019) analyzed the AE signals using an improved time-difference localization algorithm and moment tensor theory to reveal the fine view crack expansion mechanism of tensile fractures, such as crack location, type, and expansion direction in the Brazilian disc test. Wang (2017) analyzed the AE signals of the fracture extensile process in different brittle shale fractures to reveal the extensile laws of tensile-type fracture, shear-type fracture and mixed-type fracture in brittle shale, then and established the AE propagation fluctuation equation and moment tensor discrimination method for crack propagation. The moment tensor analysis can identify rock fracture modes and reveal the crack propagation. However, it is more demanding in terms of sensor arrangement and cumbersome in terms of calculation.
The above studies show that although all two methods, with the help of AE technology, can analyze the fracture modes of rocks and their crack propagation, each has its drawbacks. Therefore, it is essential to propose new methods to identify rock fracture modes.
This paper proposes an intelligent identification method of rock tension and shear fractures based on WVD spectrogram features of AE signals and SVM machine learning algorithm. The main contribution of this study can be summarized as follows: In Section 2, AE signals produced during tension and shear fractures during the Brazilian disc test and direct shear test of limestone are acquired and analyzed; In Section 3, the WVD spectrogram features processed by GLCM and HOG algorithms are extracted, and then the identification model for rock fracture modes by SVM machine learning algorithm is established. The feasibility and advancement of the proposed method are systematically demonstrated by a case study of limestone failure subjected to biaxial compression, compared with the RA-AF value method in Section 4; Section 5 concludes the main efforts.
2 Test
2.1 Rock samples
The rock samples were made of limestone from Wuhan Hanyang stone factory. Before the laboratory tests, the samples were strictly screened and polished in accordance with the rules of rock mechanics experiments, and the processed samples are shown in Figures 2A, B.
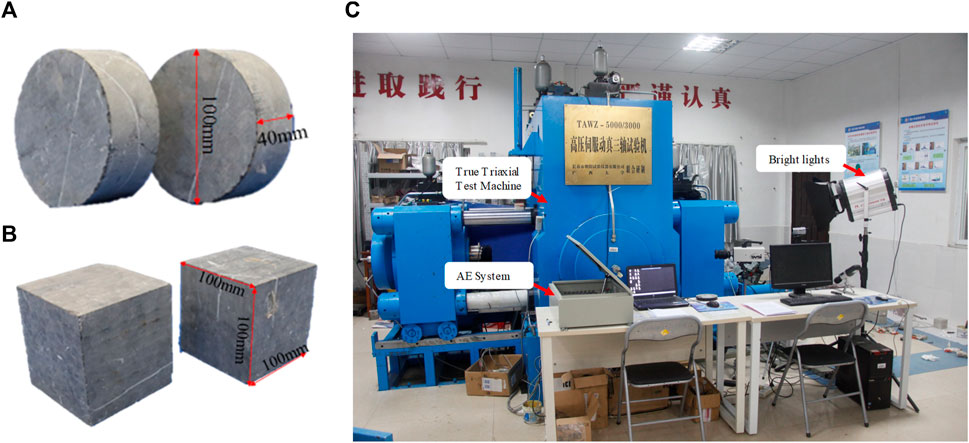
FIGURE 2. (A) Brazilian disc samples, (B) direct shear test samples, (C) the true triaxial test system.
2.2 Test system
To obtain the AE signals generated by rock tensile fracture and shear fracture, the Brazilian disc test and the direct shear test of limestone were carried out using the true triaxial test system shown in Figure 2C. The test system mainly includes high-pressure servo-controlled true triaxial test machine (independently developed by Guangxi University), bright lights, and deformation meter, etc.
2.3 Test scheme
Brazilian disc test loading scheme: Firstly, the rock sample is placed on a specially designed Brazilian disc test fixture. Then, the σz direction is pre-pressurized by 3 MPa. After the test equipment is modulated perfectly, the AE system and test machine loading devices were turned on simultaneously. Finally, the sample is loaded at a rate of 100 N/s until it is destroyed, as described in Figure 3A.
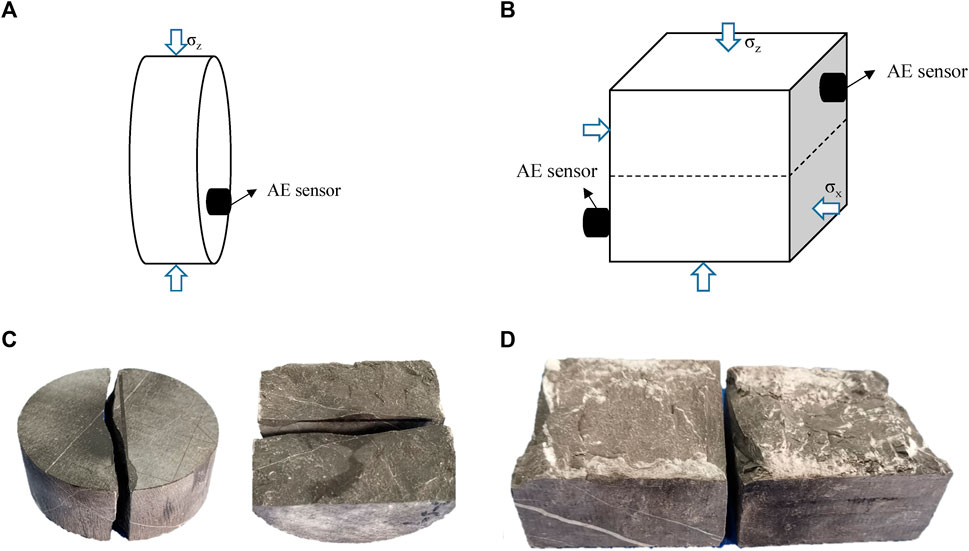
FIGURE 3. Schematic diagram of sensor arrangement and rock sample loading methods: (A) the Brazilian disc test, (B) the direct shear test. (C) Typical fracture sample of the Brazilian disc test, (D) Typical fracture sample of the direct shear test.
The direct shear test loading scheme: A rock sample of 1 MPa is first applied in the σz direction and loaded at a rate of 100 N/s in the σx direction until the sample is destroyed, as shown in Figure 3B.
2.4 AE signals acquisition
The AE acquisition device is the third generation of the AE system produced by PAC, which consists of a power supply, main board, processor and eight acquisition channels, each of which can automatically display, record and store AE signals. The AE sensors are R1.5I-LP-AST type sensors with a center frequency of 14 kHz and a frequency range of 5–20 kHz. The preamplifier is a 2/4/6 type amplifier manufactured by PAC, which has three stages and can amplify the AE signals by 20 dB, 40 dB and 60 dB, respectively. To accurately obtain abundant AE signals, the AE sensor (e.g., 1 sensor in Brazilian disc test and 2 sensors in direct shear test) was arranged as the Figures 3C, D. With reference to some studies of the rock mechanics studies using AE monitoring, the parameters of the AE system were set as shown in Table 1 (Su et al., 2020; Su et al., 2023).

TABLE 1. Parameter setting of AE system.
2.5 Test results
The fracture modes of rock samples and their resulting AE signals were obtained from the above two types of tests, which were used to further analyze the AE signals of tension and shear and compare the difference between both.
Figures 3C, D shows typical fracture surfaces of rock samples after the Brazilian disc test and the direct shear test. From the knowledge of elastic mechanics, it is known that the Brazilian disc test is a kind of indirect tensile test in which the rock sample is damaged by the internal action of tensile force. The disc is subjected to pressure applied from above and below. Since the tensile strength of the rock is much less than the compressive strength, the disc will be destructed by the tensile stress exceeding the tensile strength. In this test, the rock sample was fractured into two semi-circles under the tension action, and the fracture surfaces with rough and uneven have not any particles of debris. In contrast, in the direct shear test, the rock sample was divided into two halves under the action of horizontal shear, and the fracture surfaces showed undulating gullies with a large amount of white powder-like particles, caused by considerable friction action.
AE hits, one of the key parameters used in the analysis of AE signals, are defined as exceeding a threshold and causing a channel to acquire data in the AE system, and can be used to greatly reveal the activity during rock failure process (Ohno and Ohtsu, 2010; Unnþórsson, 2013).
In the Brazilian disc test, the AE hits were close to zero, indicating that there was almost no crack generation inside the rock sample at the beginning of loading. When the tensile stress applied in the rock sample continually increased, the AE hits gradually raised, and dramatically surged to a high level caused by the sudden macroscopic fracture of the rock sample as the loading stress exceeded the tensile strength (Figures 4A, B). In the direct shear test, the AE hits were low active, revealing that slight cracks were generated with the beginning loading of the rock sample. With the increasing shear force, the activity of AE hits was gradually enhanced, and a sudden increase occurred in the AE hits as the shear force reached the shear strength (Figures 4C, D).
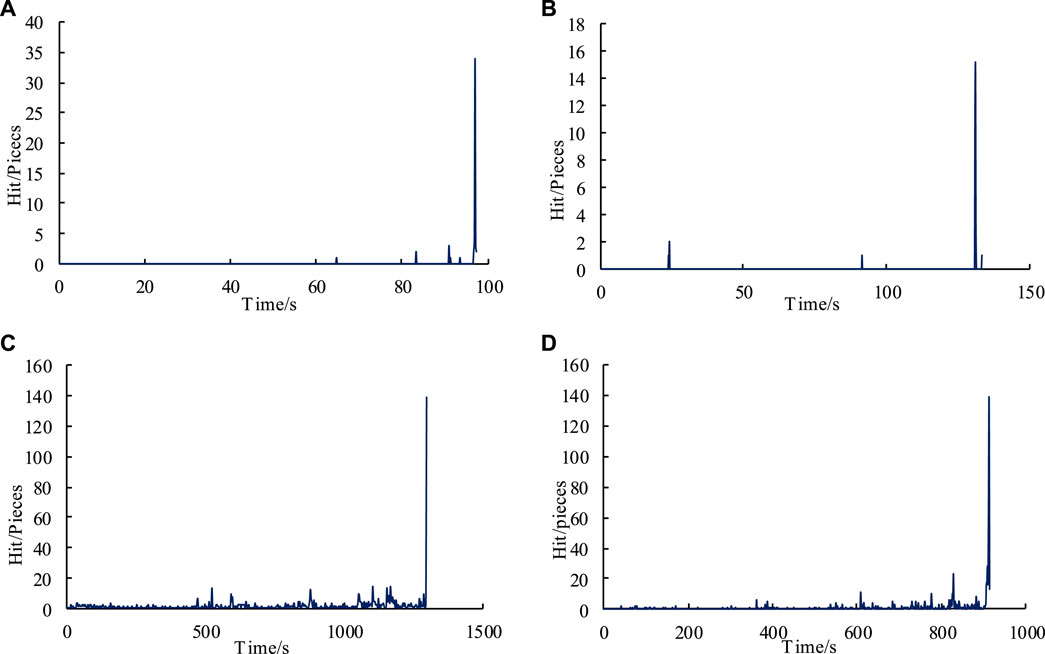
FIGURE 4. AE hit evolution: (A) LBD-S-1 in the Brazilian disc tests, (B) LBD-S-2 in the Brazilian disc tests, (C) LDS-1 in the direct shear tests, (D) LDS-2 in the direct shear tests.
In summary, the number of AE hits in the Brazilian disc test was low at the beginning, and there was a sudden increase in AE hits at the time of rock failure, indicating that rock tensile fracture is an immediate brittle fracture. On the contrary, the AE hits were continuously generated throughout the direct shear test, and a sudden increase appears in AE hits at the time of rock failure, suggesting that shear fracture was a form of fracture in which cracks are continuously generated, expanded and eventually formed on a large scale.
3 The proposed method
3.1 WVD spectrogram features
3.1.1 Principle of WVD
The concept of the WVD, originate from the field of quantum mechanics, was introduced by Wigner in 1932. In 1948, Ville (1948) first applied it to signal analysis. In the time-frequency domain analysis of signals, it is essential for selecting a rational window function, which should not be too long or short, respectively resulting in no condition of the smooth assumption of signals within the window and the deterioration of the resolution of the frequency domain, and further decreasing the analysis accuracy. The WVD combines the one-dimensional time and frequency functions into a two-dimensional function that can reflect the signal characteristics (such as the frequency and energy versus time) from the perspective of time and frequency. Therefore, this algorithm contributes to solving the problem of difficultly selecting a rational window function in time-frequency domain analysis.
Let the continuous time signal be
where t denotes time and ω denotes frequency. The definition is expressed as the signal of a past moment multiplied by the signal of a future moment and then the Fourier transform of its time difference τ, which overcomes the shortcomings of contradiction between time and frequency resolutions.
3.1.2 WVD spectrogram
The AE data collected during the test is the original DTA file. The process of generating the WVD spectrogram using the DTA file is as follows. Firstly, import it into AEwin, an AE processing software, to replay it. Secondly, use the conversion function of AEwin software to convert it into TXT files of waveform stream and export it. Finally, apply the prepared WVD program to process the TXT file in the MATLAB platform and plot it into WVD spectrogram. One typical WVD spectrogram in each Brazilian disc and each direct shear test is selected as the detailed description as illustrated in Figure 5.
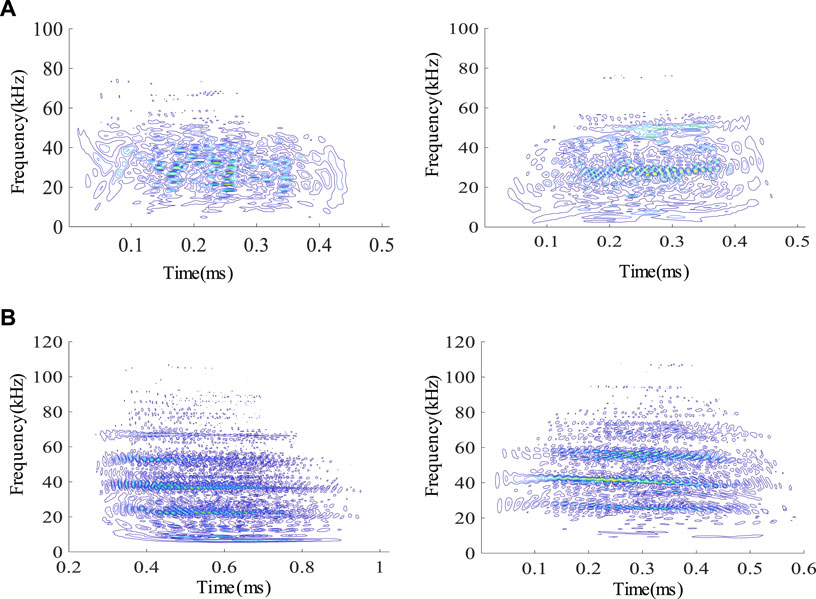
FIGURE 5. WVD spectrograms: (A) the Brazilian disc test, (B) the direct shear test.
From Figure 5, it can be seen that in the Brazilian disc test, the frequency band of the WVD spectrogram of the tensile signals was concentrated in the range of 0–80 kHz, with lower amplitude and irregularity shape overall. In the direct shear test, the frequency band of the WVD spectrogram of the shear signals was distributed in the range of 10–100 kHz, with higher amplitude and layered shape overall.
3.1.3 GLCM and HOG features of WVD spectrogram
Texture features of images, as a visual feature reflecting homogeneous phenomena in images, can be used to distinguish different kinds of images. HOG is a feature description algorithm commonly used in the field of image processing and recognition to obtains the local variation of the image texture by constructing a gradient directional histogram over a local area, reflecting the shape and edge information of the image (Qu et al., 2011). There are significant differences in the shape and edge information of the WVD spectrogram of the tension and shear signals are significantly different and the HOG feature helps in image differentiation. GLCM is an image texture feature that converts gray-level values into texture information. The GLCM is defined as the joint probability density of two positional pixels, which is a second-order statistical feature of the image that characterizes the distribution of pixels at the same gray-level in terms of adjacent direction, interval distance, and amplitude variation. Thus, the GLCM is able to reflect information about the texture variation of the diagram (Liu et al., 2016). GLCM features combined with HOG features can further improve the robustness of the WVD spectrogram classification.
3.2 SVM machine learning
SVM is a statistical learning model built on the principles of VC dimensional theory and structural risk minimization. These principles aim to optimize the best balance (achieve a model with strong generalization ability) between model complexity and learning ability by using a small number of samples. The theoretical basis of SVM is statistical learning theory, whereas different from traditional statistical methods, the SVM method need not to process the traditional induction and deduction, rather than directly implements the predictions on testing samples using training samples, which simplifies the classification and regression problems (Hearst et al., 1998). Thus, SVM possesses advantages, characterized by the ability to obtain globally optimal solutions, good adaptability to complex problems of high dimensionality, small samples, and nonlinearity, and high generalization ability. In addition, above-mentioned advantages in SVM can considerably overcome the limitation of insufficient data in this paper.
The algorithm ideal of SVM machine learning is detailly descried as follows: to separate the two types of data, the means of the inner product kernel function in support vector machine is applied for transforming vector dimensions from low to higher, and then construct two parallel hyperplanes for the separation of both data; moreover, When the distance between these two hyperplanes is maximum, a new hyperplane (namely, the maximum spacing hyperplane) parallel to these two planes is established through their maximum distance midpoints.
Furthermore, SVM implementation mainly includes: suppose there are data set (x1,y1)…(x1,y1)…(xi,yi)…(xn,yn), where xi is a p-dimensional real vector. To distinguish the classes to which xi belongs, we define yi as either 1 or -1, where xi with yi =1 belongs to one class, and yi =-1 belongs to the other. SVM is able to find the “maximum spacing hyperplane” that separates two different types of data points and then maximize the distance between the hyperplane and the nearest point xi. Consequently, any hyperplane can be represented as:
where w is the normal vector of this hyperplane and the parameter
Using ∣w•x+b∣=1 to denote these two hyperplanes parallel to each other, the distance between the two hyperplanes is
3.3 The RA-AF value method
The RA-AF value method provides accurate and quantifiable identification of rock fracture modes and has been included in the Japanese code for concrete AE monitoring (JCMS-III B5706) (Author Anonymous, 2003).
An effective AE signal waveform and parameter characteristics are shown in Figure 6A.When the rock undergoes tensile fracture, the rise time of the AE signal waveform is short, the rise angle is large, and its RA value is small. When the rock generates shear fracture, the AE waveform has a short time to reach the maximum point of amplitude (i.e., short rise time), the rise angle is small, and its RA value is large (Siracusano et al., 2016; Liu et al., 2020).
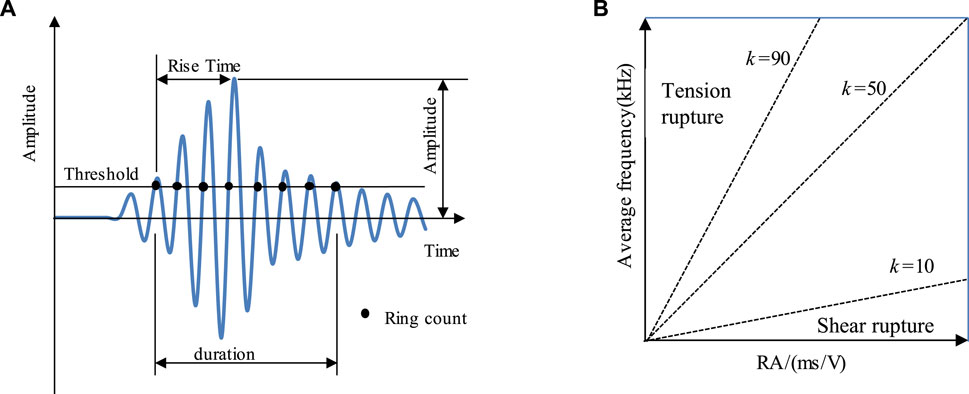
FIGURE 6. (A) Schematic diagram of AE waveform and parameter characteristics, (B) The schematic diagram of identification for rock fracture modes (tension/shear) using the RA-AF value method.
The equation for the RA value of AE signals is defined as:
where RT is the rise time of the AE waveform, ms; A is the amplitude of the AE waveform, V; RA is the reciprocal of the tangent of the rise angle, ms/V (Yu et al., 2022).
The AF can be calculated by the following equation:
where AF is the average frequency of the AE signal, C is the ring counts and D is the duration of the AE signal.
As shown in Figure 6B, the identification principle of the types (tension/shear) of rock fracture in the RA-AF value method can be characterized by which the AE signal is shear fracture when the signal lies below the demarcation line k (k=RA/AF) and tension fracture when it lies above the demarcation line k. Therefore, the choice of the demarcation line k has a significant influence on the identification results. The commonly used demarcation lines are k=10, 50 and 90.
3.4 Implementation steps of the proposed method
The proposed method is implemented in the following steps:
1. AE signals acquisition: Brazilian disc test and direct shear test of rocks are carried out to acquire AE hits for tension and shear fractures, and selected as original sample data, respectively;
2. WVD spectrogram calculation: The WVD spectrograms of the AE signals are obtained by the WVD principle;
3. Spectrogram features extraction: Based on the WVD spectrograms, the GLCM and HOG features are extracted as the image texture samples for training and testing SVM classification model (Haralick et al., 1973; Dalal and Triggs, 2005);
4. Training SVM model: The SVM model is trained by the training samples on the basis of parameters set, such as kernel functions, the penalty parameter C and the kernel function parameter σ;
5. Model Verification: In this paper, the SVM classification model is verified by using the testing samples. If the accuracy of the classification model meets the requirements, the model is saved. On the contrary, the model needs to be constructed according to steps 1 to 4, and further the verification.
The flow chart of rock tension and shear identification method is shown in Figure 7.
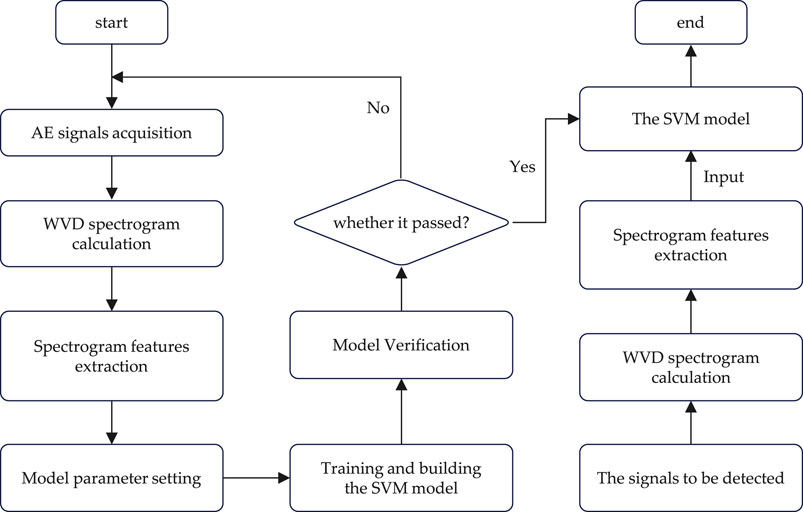
FIGURE 7. Flow chart of rock tension and shear identification method (Liu et al., 2019).
3.5 Validation of the proposed method
The method in this paper is verified by the following steps:
6. AE signals acquisition: Several AE hit signals for tension and shear fractures were obtained using the AE signals collected in the Brazilian disc test of LBD-S-1 and LBD-S-2 and the direct shear test of LDS-1 and LDS-2 (Figure 8);
7. WVD spectrogram calculation: The signal processing toolbox in MATLAB was used to process the AE hit signals during the fracture phase and to plot the WVD spectrogram. WVD spectrograms (65 each) of the Brazilian disc test numbered LBD-S-1 (fracture phase: 90–98 s) and the direct shear test numbered LDS-1 (fracture phase: 1,230–1,300 s) were selected for calculation. In addition, WVD spectrograms (50 each) of the Brazilian disc test numbered LBD-S-2 (fracture phase: 125–133 s) and the direct shear test numbered LDS-2 (fracture phase: 876–916 s) were selected for calculation. Figure 8 shows part of the WVD spectrograms for the tension and shear fracture phases;
8. Spectrogram features extraction: The GLCM and HOG features based on the WVD spectrograms from the above tests were extracted as the training (e.g., LBD-S-1 and LDS-1) and testing (e.g., LBD-S-2 and LDS-2) samples of the SVM model;
9. Training SVM model: The kernel function of radial basis function (RBF) was selected, the kernel function parameter σ was set to 128, and the penalty parameter C was set to 32. Based on the training samples composed of the GLCM and HOG features, the automatical model for identifying fracture modes of rock was established by the SVM learning algorithm;
10. Model verification: The effectiveness of the SVM classification model depended on whether its classification accuracy can meet the requirements. The established SVM classification model was validated using the 100 testing samples (50 each in tension and shear samples) created. The validation results showed that 48 and 47 samples in tension and shear test were successfully identified, respectively, and those accuracy rates were individually reached to 96.0% and 94.0%. Therefore, the overall accuracy of the SVM model is a high level of 95%.
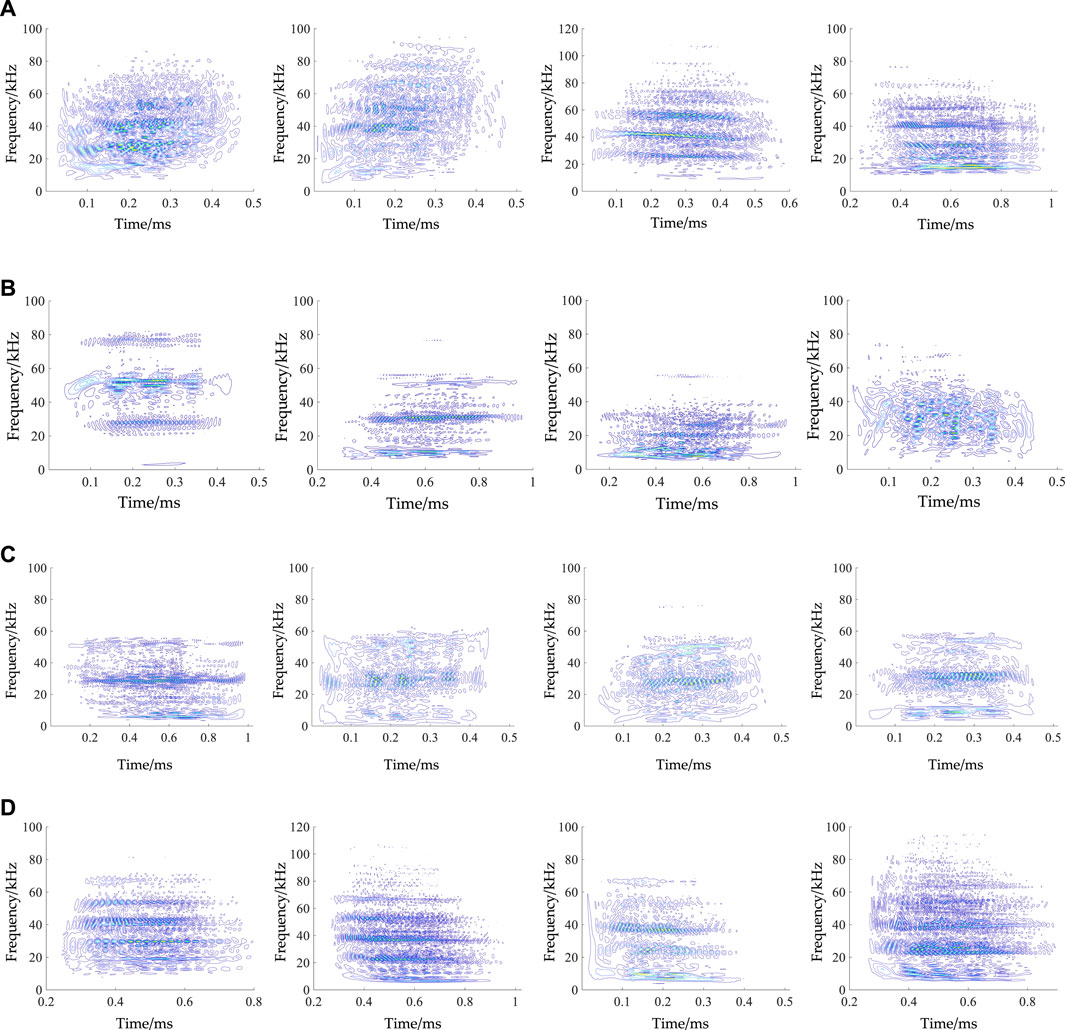
FIGURE 8. WVD spectrograms in the tension and shear fractures: (A) tension fracture from LBD-S-1, (B) tension fracture from LBD-S-2, (C) shear fracture from LDS-1, (D) shear fracture from LDS-2.
Among rock tension and shear fracture identification methods based on the AE signals, the parametric analysis method based on the RA-AF value method is the most widely used. In this section, the identification method described in this paper and the RA-AF value method were used to identify the tension and shear fractures of the AE hit signals collected throughout the Brazilian disc test (LBD-S-2), respectively. The identification results of the above two methods are shown in Table 2. Comparing the results of the two methods, the method described in this paper does not depend on the choice of k value (k=AF/RA), and its recognition accuracy is higher than the RA-AF value. Therefore, the method is more advanced and superior.
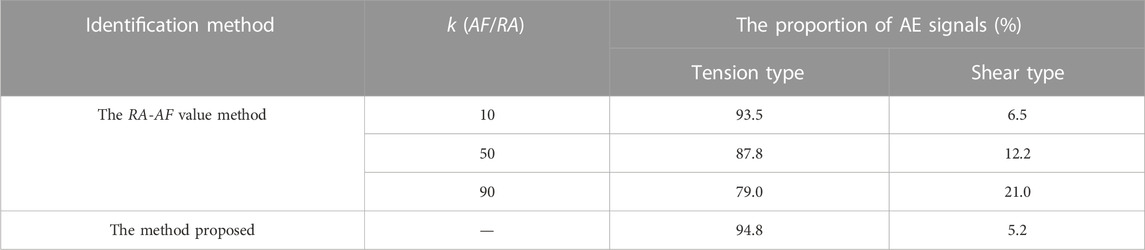
TABLE 2. Results comparison based on the proposed method and the RA-AF value method in the Brazilian disc test (LBD-S-2).
4 A case study
The stress state of underground rocks can be classified into uniaxial, biaxial and triaxial state (Cai et al., 2020). In underground projects, the unexcavated rock is in a triaxial stress state (Zhang et al., 2023). During excavation, the stresses in the rock at the project boundary are redistributed and are in a static biaxial stress state, i.e., the minimum principal stress σ3 drops to zero (Wang et al., 2019; Du et al., 2021). The rocks at the project boundary are highly susceptible to rock failure due to construction effects. Therefore, the studies of the failure behaviour of biaxial rocks are important for the understanding and prevention of rock hazards. It has been shown that during the biaxial compression test of rocks, the rock fracture in the early stage of the test is dominated by tensile fracture, and the AE signals collected at this time is mainly the tensile signals (Hou et al., 2009; Sagong et al., 2011). With the increasing load, the form of rock fracture gradually transforms from tension-dominated fracture to shear-dominated fracture. When the load reaches its maximum value, the rock undergoes final failure caused by shear crack penetration, and the AE signals generated at the time is mainly the shear signals. To further verifying the advancement of the method proposed in this paper, the fracture process of intact rock during the biaxial compression test is identified using the method and the RA-AF value method.
4.1 Test scheme
The biaxial compression test was carried out using the high-pressure servo-controlled true triaxial test system (Figure 2C). The rock samples were limestone processed at Hanyang stone factory in Wuhan, with dimensions of 100 mm × 100 mm × 200 mm (L × W × H). The type of AE sensors for the test was R1.5I-LP-AST. The arrangement of the sensors, the loading method and the loading path for this test are shown in Figure 9. The intermediate principal stress σ2 is 30 MPa, and the maximum principal stress σ1 is loaded at a rate of 0.5 MPa/s.
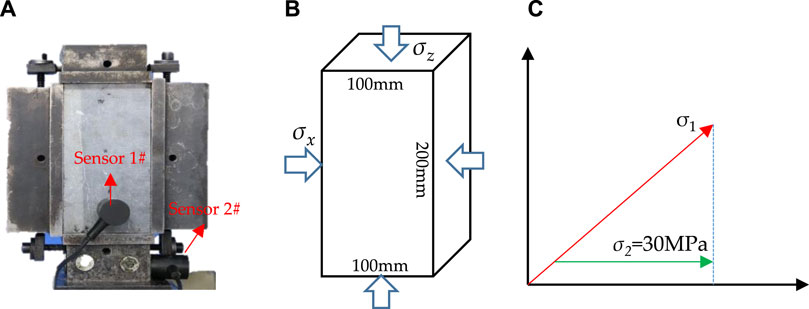
FIGURE 9. The biaxial compression test of limestone: (A) arrangement of sensors, (B) loading method, (C) loading path.
4.2 Test results
Figure 10 visualises the fracture development process during the biaxial compression test of limestone. Sample fracture occurred mainly in the vicinity of the free surface at the early stage of loading, dominated by tensile cracks parallel to the free surface. At the middle stage of loading, the tensile cracks were expanding inward with the increasing load, and the tensile cracks formed a certain small angle with the free surface, and the tensile cracks were still dominant at this time. At the late stage of the test, the sample fracture changed from tension-dominated to shear-dominated, and the shear cracking of the sample increased significantly. Until the load reached its maximum value, the shear crack penetrated a macroscopic fracture, leading to rock failure.
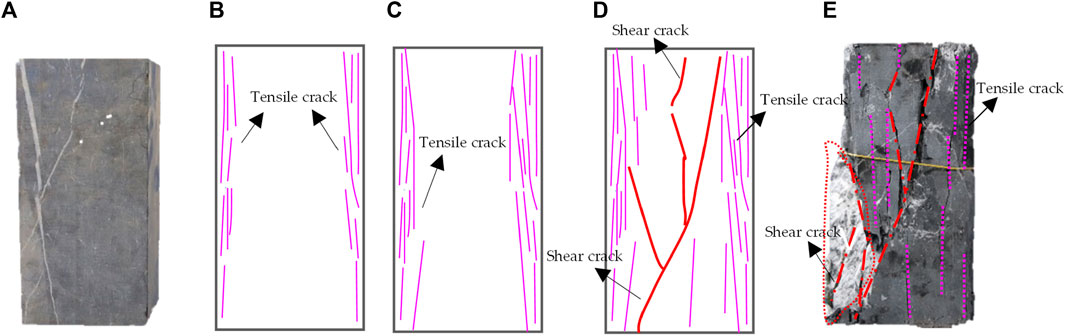
FIGURE 10. The fracture process of limestone during the biaxial compression: (A) sample before test, (B) tension fracture generation in the early stage of the test, (C) tension crack extension in the middle stage of the test, (D) transformation of tension fracture to shear fracture in the later stage of the test, (E) rock sample failure.
4.3 Fracture modes identification
After Understanding the evolution of fracture modes in biaxial compression tests of limestone, the method of this paper and the RA-AF value method be used to identify fracture modes of this test and compare the identification results of both. Three tests under the same conditions were carried out and the most representative set of results was selected for analysis.
4.3.1 The RA-AF value method
Given there not is a reference for the demarcation line of rocks during biaxial compression, k=50 was chosen as the demarcation line in this paper. The classification results of the AE signals of limestone subjected to the biaxial compression test are depicted in Figure 11.
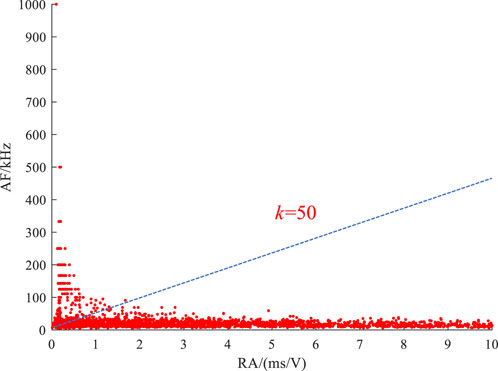
FIGURE 11. The classification results of the AE signals of limestone subjected to biaxial compression test.
The identification results of the rock fracture modes based on the RA-AF value method were divided into 5 s as a period, the percentage of identified tension/shear signals to overall signals in each period was calculated to obtain the evolution of the tension and shear fracture of the rock. The statistical results are shown in Figure 13A.
As shown in Figure 13A, the identified AE signals in the early stage of limestone failure subjected to biaxial compression test were dominated by the tensile type signals, which account for about 90% of the total signals, and the shear type signals are only about 10%. With the increase of load, the percentage of tensile type signals decreased rapidly, and after 40 s, the percentage of shear type signals was more than half and still increasing. Subsequently, the percentage of shear signals was greater than that of tension signals, and the percentage of tension signals increased slightly in the late period of test.
4.3.2 The proposed method
The AE signals from the limestone failure under biaxial compression were used to generate WVD spectrograms. And then, the GLCM and HOG features of the WVD spectrogram were extracted and input to a trained SVM classification model for identification and classification. Figure 12 shows the WVD spectrogram and the identification results of the AE signals at 2.08 s, 21.29 s, 61.75 s, 109.84 s, 135.47 s, 143.75 s, 146.11 s, and 148.70 s, respectively.
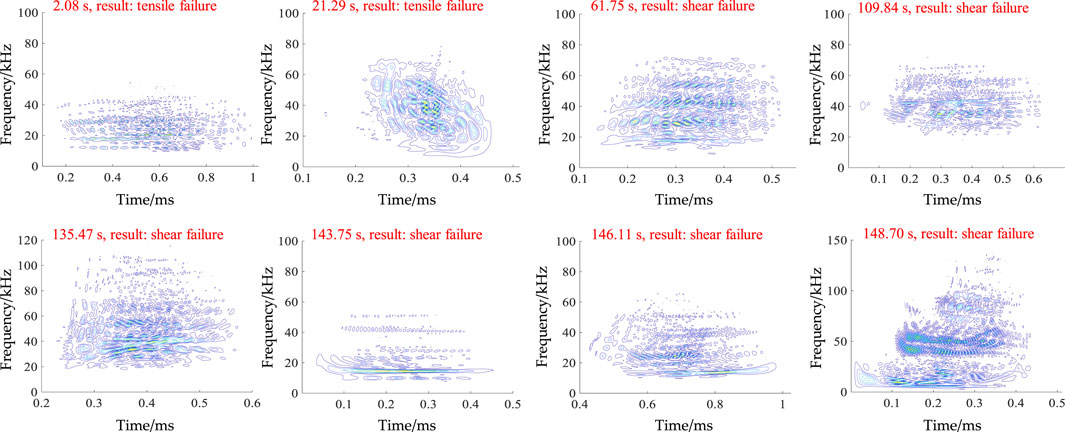
FIGURE 12. Classification results of WVD spectrogram at different time in the biaxial compression test.
As illustrated in Figure 12. In the early stage of test, the identified AE signals were tensile, indicating the rock tension fractures. In the late stage of test, the identified AE signals were shear, correlated with the rock shear fractures. In order to reflect the change trend of tension and shear fractures more directly, the percentage evolution of identified tension/shear signals to overall signals in each period of 5 s was analyzed, as shown in Figure 13B.
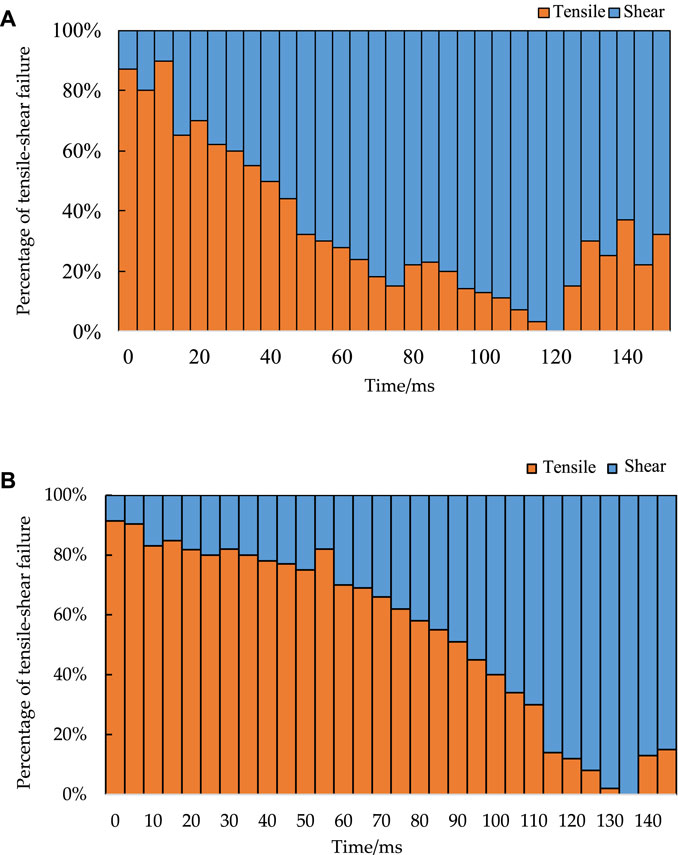
FIGURE 13. Evolution of the percentage of tension and shear signals identified using (A) the RA-AF value method, (B) the proposed method.
Figure 13B shows the evolution of the percentage of tension and shear signals identified using the proposed method. In the early stage of test, the identified AE signals are dominated by the tensile type signals, which account for about 90% of the total signals. As the load increased, the percentage of tensile type signals decreased, but it was still dominated. After 90 s, the percentage of shear type signals was more than half and increasing continuously. When 135 s, all of the AE signals were shear signals. On the eve of sample failure, the proportion of tension signals increased, but that of shear signals was still greater than 80%.
4.3.3 Method comparison
Comparing the evolution of the proportion of AE signal types (tension/shear) identified by the above two methods, it can be concluded that both of them are capable of the description of the fracture modes of rocks subjected to biaxial compression, especially for a gradual change from tension-dominated fracture to shear-dominated fracture. Moreover, the evolutionary characteristics of the rock failure described are consistent with the phenomena observed in the test and previous studies (Hou et al., 2009; Sagong et al., 2011). However, there is a slight difference in the fracture modes identification between the two methods. Based on the method proposed in this paper, the period dominated by the tensile signals is 0–90 s, i.e., the early and middle periods of the test. Applied for the RA-AF value method, the period dominated by the tensile type signals is 0–40 s, i.e., the early stage of the test. According to previous research, rock fractures are dominated by tension fracture in the middle stage of rock failure under biaxial compression, and then the rock fracture modes gradually change from tension to shear fracture in the later stage, corralled with the transform of rock mechanics behavior from elastic to elastoplastic. Therefore, compared with the RA-AF value method, the method in this paper has higher recognition accuracy and superior performance.
5 Conclusion
To achieve the accurate and effective identification of the rock fracture modes (tension/shear) by AE monitoring technology, this paper proposed a SVM-based method for identifying fracture modes of rocks based on WVD spectrogram features (processed by CLCM and HOG) of AE signals acquired by the Brazilian disc test (tension fracture) and the direct shear test (shear fracture). The following conclusions can be drawn:
WVD spectrogram is 3-dimensional information about time, frequency and energy, capable of a good description for non-steady AE signals. The AE-based WVD spectrograms of rock tension and shear fractures are significantly different. The results showed that there are essential distinguishments in the distribution shape of both WVD spectrograms, such as the tension with lower amplitude and irregular shape overall and the shear with higher amplitude and layered shape overall. Additionally, it is indicated that WVD spectrogram features, processed by the GLCM and HOG methods for the dimensional decrease of features from three to two under the slight loss of important information, can greatly characterize and classify the difference between two-types AE signals produced by tension and shear fractures of rocks.
A SVM-based method for identifying fracture modes of rocks using the WVD spectrogram features of AE signals is feasible. This method proposed was systematically verified and compared with the RA-AF value method, and then results showed that the proportion of AE signals (identified by the proposed method) produced by tension fracture in the Brazilian disc test reached 94.8%, higher than the RA-AF value method. Moreover, the percentage evolution of tension-shear fractures of this method was more well correlated (later transition from tension-dominated to shear-dominated fractures) with the failure process from elasticity to plasticity of rocks subjected to biaxial compression, compared with the RA-AF value method. Therefore, the proposed method has advantages over the RA-AF value method, helpfully advancing the more accurate and early warning for rock failure related to the transform of tension-shear fractures.
This proposed method can achieve the accurate identification for the fracture modes of rocks, then improve the prediction and warning of rock failure. However, for the method, there are a series of section improved in the future, i.e., types of rocks and engineering applications.
Data availability statement
The datasets presented in this article are not readily available because Rock mechanics experimental data and acoustic emission signal data. Requests to access the datasets should be directed toMjAxMDM5MTE1M0BzdC5neHUuZWR1LmNu.
Author contributions
ZQ, XC, and ZL contributed to conception and design of the study. YY and ZW conducted tests and organized the database. ZQ and YY performed the statistical analysis. ZL and ZW validated the method. ZQ and XC wrote the first draft of the manuscript. YY and ZL wrote sections of the manuscript. All authors contributed to the article and approved the submitted version.
Funding
This research was funded by the National Natural Science Foundation of China for financial support (Grant No. 51708136) and Scientific Research and Technology Development Program of Guangxi (Grant No. AD19245153).
Conflict of interest
ZQ and YY were employed by Guangxi Xinfazhan Transportation Group Co., Ltd. and ZL was employed by Guangxi Xinfazhan Communications Group.
The remaining authors declare that the research was conducted in the absence of any commercial or financial relationships that could be construed as a potential conflict of interest.
Publisher’s note
All claims expressed in this article are solely those of the authors and do not necessarily represent those of their affiliated organizations, or those of the publisher, the editors and the reviewers. Any product that may be evaluated in this article, or claim that may be made by its manufacturer, is not guaranteed or endorsed by the publisher.
References
Aggelis, D. G. (2011). Classification of cracking mode in concrete by acoustic emission parameters. Mech. Res. Commun. 38, 153–157. doi:10.1016/j.mechrescom.2011.03.007
Aggelis, D. G., Mpalaskas, A. C., and Matikas, T. E. (2013). Acoustic signature of different fracture modes in marble and cementitious materials under flexural load. Mech. Res. Commun. 47, 39–43. doi:10.1016/j.mechrescom.2012.11.007
Author Anonymous (2003). Monitoring method for active cracks in concrete by acoustic emission. Japan: Federation of Construction Material Industries, 23–28.
Bi, J., Liu, P., and Gan, F. (2020). Effects of the cooling treatment on the dynamic behavior of ordinary concrete exposed to high temperatures. Constr. Build. Mater. 248, 118688. doi:10.1016/j.conbuildmat.2020.118688
Bi, J., Ning, L., Zhao, Y., Wu, Z., and Wang, C. (2023). Analysis of the microscopic evolution of rock damage based on real-time nuclear magnetic resonance. Rock Mech. Rock Eng. 56, 3399–3411. doi:10.1007/s00603-023-03238-x
Cai, X., Zhou, Z., and Du, X. (2020). Water-induced variations in dynamic behavior and failure characteristics of sandstone subjected to simulated geo-stress. Int. J. Rock Mech. Min. Sci. 130, 104339. doi:10.1016/j.ijrmms.2020.104339
Chang, S., and Lee, C. (2004). Estimation of cracking and damage mechanisms in rock under triaxial compression by moment tensor analysis of acoustic emission. Int. J. Rock Mech. Min. 41, 1069–1086. doi:10.1016/j.ijrmms.2004.04.006
Du, K., Liu, M., Yang, C., Tao, M., Feng, F., and Wang, S. (2021). Mechanical and acoustic emission (AE) characteristics of rocks under biaxial confinements. Appl. Sci. 11, 769. doi:10.3390/app11020769
Etheridge, M. A. (1983). Differential stress magnitudes during regional deformation and metamorphism: Upper bound imposed by tensile fracturing. Geology 11, 231–234. doi:10.1130/0091-7613(1983)11<231:DSMDRD>2.0.CO;2
Gilbert, F. (1971). Excitation of the normal modes of the Earth by earthquake sources. Geophys. J. Int. 22, 223–226. doi:10.1111/j.1365-246X.1971.tb03593.x
Haralick, R. M., Shanmugam, K., and Dinstein, I. H. (1973). Textural features for image classification. IEEE Trans. Syst. man, Cybern. 22, 610–621. doi:10.1109/TSMC.1973.4309314
Hearst, M. A., Dumais, S. T., Osuna, E., Platt, J., and Scholkopf, B. (1998). Support vector machines. IEEE Intelligent Syst. their Appl. 13, 18–28. doi:10.1109/5254.708428
Hou, A., Yang, X., Yun, X., and Zhang, Q. (2009). Experimental investigation on mechanical behaviors of different Loaded Limestone. Wuhan, China: Journal of Wuhan University of Technology, 143–146.
Li, K., Yu, H., Xu, Y., and Luo, X. (2022). Detection of oil spills based on gray level co-occurrence matrix and support vector machine. Front. Environ. Sci. 10, 2486. doi:10.3389/fenvs.2022.1049880
Liu, J., Teng, Q., Wang, Z., and He, X. (2016). Rock classification of multi-feature fusion based on collaborative representation. J. Comput. Appl. 36, 5. doi:10.11772/j.issn.1001-9081.2016.03.854
Liu, K., Xiao, H., Wang, X., Li, L., and Feng, Y. (2019). Design of swimming crab sorting manipulator control system based on HOG+SVM image recognition. Mech. Eng. 5.
Liu, X., Liu, Z., Li, X., Gong, F., and Du, K. (2020). Experimental study on the effect of strain rate on rock acoustic emission characteristics. Int. J. Rock Mech. Min. 133, 104420. doi:10.1016/j.ijrmms.2020.104420
Niu, Y., Hu, Y., and Wang, J. (2023c). Cracking characteristics and damage assessment of filled rocks using acoustic emission technology. Int. J. Geomech. 23, 04023013. doi:10.1061/IJGNAI.GMENG-8034
Niu, Y., Liu, P., Zhang, C., Hu, Y., and Wang, J. (2023a). Mechanical properties and dynamic multifractal characteristics of shale under anisotropic stress using AE technology. Geoenergy Sci. Eng. 226, 211748. doi:10.1016/j.geoen.2023.211748
Niu, Y., Wang, J. G., Wang, X. K., Hu, Y. J., Zhang, J. Z., Zhang, R. R., et al. (2023b). Numerical study on cracking behavior and fracture failure mechanism of flawed rock materials under uniaxial compression. Fatigue Fract. Eng. Mater. Struct. doi:10.1111/ffe.13983
Niu, Y., and Zhou, X. (2021). Forecast of time-of-instability in rocks under complex stress conditions using spatial precursory AE response rate. Int. J. Rock Mech. Min. Sci. 147, 104908. doi:10.1016/j.ijrmms.2021.104908
Ohno, K., and Ohtsu, M. (2010). Crack classification in concrete based on acoustic emission. Constr. Build. Mater. 24, 2339–2346. doi:10.1016/j.conbuildmat.2010.05.004
Ohtsu, M. (1995). Acoustic emission theory for moment tensor analysis. Res. Nondestruct. Eval. 6, 169–184. doi:10.1007/BF01606380
Qu, Y., Liu, Q., Guo, J., and Zhou, S. (2011). HOG and color based pedestrian detection. J. Wuhan Univ. Technol. 33, 5.
Ren, H., Ning, J., Song, S., and Wang, Z. (2019). Investigation on crack growth in concrete by moment tensor analysis of acoustic emission. Chin. J. Theor. Appl. Mech. 51, 11. doi:10.6052/0459-1879-19-170
Sagong, M., Park, D., Yoo, J., and Lee, J. S. (2011). Experimental and numerical analyses of an opening in a jointed rock mass under biaxial compression. Int. J. Rock Mech. Min. 48, 1055–1067. doi:10.1016/j.ijrmms.2011.09.001
Shiotani, T., Ohtsu, M., and Ikeda, K. (2001). Detection and evaluation of AE waves due to rock deformation. Constr. Build. Mater. 15, 235–246. doi:10.1016/S0950-0618(00)00073-8
Siracusano, G., Lamonaca, F., Tomasello, R., Garescì, F., La Corte, A., Carnì, D. L., et al. (2016). A framework for the damage evaluation of acoustic emission signals through Hilbert–Huang transform. Mech. Syst. Signal Pr. 75, 109–122. doi:10.1016/j.ymssp.2015.12.004
Su, G., Chen, X., Sun, G., Chen, B., and Zhao, G. (2023). Experimental study on the evolutionary characteristics of acoustic signals produced by granite damage under uniaxial compression. Int. J. Damage Mech. 32, 715–745. doi:10.1177/10567895231158147
Su, G., Gan, W., Zhai, S., and Zhao, G. (2020). Acoustic emission precursors of static and dynamic instability for coarse-grained hard rock. J. Cent. South Univ. 27, 2883–2898. doi:10.1007/s11771-020-4516-6
Wang, H., Liu, D., Cui, Z., Cheng, C., and Jian, Z. (2016). Investigation of the fracture modes of red sandstone using XFEM and acoustic emissions. Theor. Appl. Fract. Mec. 85, 283–293. doi:10.1016/j.tafmec.2016.03.012
Wang, S., Li, X., Yao, J., Gong, F., Li, X., Du, K., et al. (2019). Experimental investigation of rock breakage by a conical pick and its application to non-explosive mechanized mining in deep hard rock. Int. J. Rock Mech. Min. Sci. 122, 104063. doi:10.1016/j.ijrmms.2019.104063
Wang, T. (2017). Evolution mode on shale fracture based on acoustic emission behavior. Daqing, China: Northeast Petroleum University.
Wang, X., Wang, E., Liu, X., Li, X., Wang, H., and Li, D. (2018). Macro-crack propagation process and corresponding AE behaviors of fractured sandstone under different loading rates. Chin. J. Rock Mech. Eng. 37, 13. doi:10.13722/j.cnki.jrme.2017.1672
Xiao, N., Zhou, X., and Berto, F. (2021). Fracture analysis of rock reconstruction models based on cooling–solidification annealing algorithms. Fatigue Fract. Eng. Mater. Struct. 44, 2503–2523. doi:10.1111/ffe.13531
Xiao, N., Zhou, X., and Ling, T. (2022). Novel cooling–solidification annealing reconstruction of rock models. Acta Geotech. 17, 1785–1802. doi:10.1007/s11440-021-01307-5
Yu, H., Wang, G., Zhang, Z., Niu, R., and Cheng, G. (2022). Experimental study on the effect of prefabricated fissures on the creep mechanical properties and acoustic emission characteristics of sandstone under uniaxial compression. Front. Earth Sci. 10. doi:10.3389/feart.2022.1019716
Zhang, J., and Zhou, X. (2020). AE event rate characteristics of flawed granite: From damage stress to ultimate failure. Geophys. J. Int. 222, 795–814. doi:10.1093/gji/ggaa207
Zhang, J., Zhou, X., and Du, Y. (2023). Cracking behaviors and acoustic emission characteristics in brittle failure of flawed sandstone: A true triaxial experiment investigation. Rock Mech. Rock Eng. 56, 167–182. doi:10.1007/s00603-022-03087-0
Zhou, H., Lu, J., Xu, R., Zhang, C., Chen, J., and Meng, F. (2016). Research on tension-shear failure characteristics and yield criterion of hard brittle marble. Rock Soil Mech. 37, 11. doi:10.16285/j.rsm.2016.02.001
Zhou, X., Wang, R., Du, Z., Wu, J., Wu, Z., Ding, W., et al. (2022). Characteristics and main controlling factors of fractures within highly-evolved marine shale reservoir in strong deformation zone. Front. Earth Sci. 10, 212. doi:10.3389/feart.2022.832104
Keywords: rock fracture modes, acoustic emission, Wigner-Ville distribution, support vector Machine, biaxial compression
Citation: Qin Z, Chen X, Yan Y, Liu Z and Wang Z (2023) A SVM-based method for identifying fracture modes of rock using WVD spectrogram features of AE signals. Front. Earth Sci. 11:1206269. doi: 10.3389/feart.2023.1206269
Received: 15 April 2023; Accepted: 22 May 2023;
Published: 07 June 2023.
Edited by:
Xiaoping Zhou, Chongqing University, ChinaReviewed by:
Yong Niu, Shaoxing University, ChinaJing Bi, Guizhou University, China
Jian-Zhi Zhang, Fuzhou University, China
Copyright © 2023 Qin, Chen, Yan, Liu and Wang. This is an open-access article distributed under the terms of the Creative Commons Attribution License (CC BY). The use, distribution or reproduction in other forums is permitted, provided the original author(s) and the copyright owner(s) are credited and that the original publication in this journal is cited, in accordance with accepted academic practice. No use, distribution or reproduction is permitted which does not comply with these terms.
*Correspondence: Zonghui Liu, bHpoOEBneHUuZWR1LmNu