
94% of researchers rate our articles as excellent or good
Learn more about the work of our research integrity team to safeguard the quality of each article we publish.
Find out more
ORIGINAL RESEARCH article
Front. Earth Sci., 14 June 2023
Sec. Environmental Informatics and Remote Sensing
Volume 11 - 2023 | https://doi.org/10.3389/feart.2023.1204082
 Songyang Gao1Hucheng Deng2,3*Weilin Yan1Shujun Yin1Jiayu Zhou1Zheng Wen1
 Yunfei Guo3Bo Zhang1Chuang Li1Xiaolei Yang1Wenhao Xia1
 Tao Huang3*
Introduction: The Xujiahe Formation in the Yingshan-Longgang area of the Sichuan Basin has abundant tight oil and gas resources. However, the complex geological conditions and insufficient understanding of the magnitude and direction of in-situ stresses severely limit exploration and development of oil and gas resources in the region. This has made it difficult to carry out hydraulic fracturing and horizontal well deployment in the region.
Methods: Based on experimental analyses, including acoustic emission experiments, wave velocity anisotropy experiments, and paleomagnetic experiments, this study evaluated the magnitude and direction of in-situ stresses, while also combining electrical imaging logging and acoustic wave logging data. This provides a basis for hydraulic fracturing in the research area.
Results and Discussion: The experimental results indicate that the three-way stress state of the Xujiahe Formation is a strike-slip stress state, and the three-way stress value gradually increases with increasing burial depth. The Longgang area is particularly affected by the depth. The average azimuth angle of the maximum horizontal principal stress in the study area is N100°E, while tectonic deformation may cause a counterclockwise deviation of the maximum horizontal principal stress azimuth in the Yingshan area. Considering the influence of changes in the magnitude of in situ stress in the longitudinal direction on hydraulic fracturing extension mode, it is recommended to select the middle and upper sections of the Xu II for fracturing and transformation. Similarly, considering the distribution of natural fractures and the direction of the in situ stresses, it is suggested that the deployment azimuth angle for horizontal wells be between N20°–30°E.
With the rapidly increasing demand for new sources of energy, unconventional sources of oil and gas extracted from tight sandstones have attracted many scholars worldwide. In this regard, developing large-scale and efficient methods to extract these abundant resources is of great strategic significance (Jia et al, 2012; Qiu et al, 2013). Geological surveys indicate that the Sichuan Basin has abundant continental tight sandstone gas resources, but the rate of proven reserves is low. These resources are mainly distributed in the Upper Triassic Xujiahe Formation and Jurassic. The Xujiahe Formation has a large area with gas-bearing characteristics. It is one of the main strata with high development potential for exploring and developing tight sandstone gas reservoirs in the Sichuan Basin (Dai et al, 2012). It is worth noting that the efficient development of tight sandstone gas is inseparable from fracturing and horizontal well technologies, which are closely related to in situ stress analysis. The state of in situ stress determines the shape and distribution of hydraulic fractures and affects the fracturing stimulation. The analysis of in situ stress has a guiding significance for determining parameters such as perforation section and borehole orientation of horizontal wells (Cao et al, 2022; Liu et al, 1994).
A review of the literature indicates that numerous methods have been developed to investigate in situ stresses. These methods can be mainly divided into direct and indirect measurement methods. The direct measurement method refers to the use of measuring instruments to directly measure the compensation stress, equilibrium stress, and other stresses. Then the magnitude of in situ stress can be obtained according to the relationship between these stresses and the original rock stress. The most widely used methods are the flat jack method (Wang, 2014), the hydraulic fracturing method (Hou et al, 2003), and the acoustic emission method (Jiang et al, 2005). On the other hand, the indirect measurement method refers to measuring the mass-related physical quantities such as Poisson’s ratio, acoustic time difference, and rock density. These physical quantities are used to calculate the actual in situ stress. In this regard, the most commonly used methods are the core stress relief method (Cai, 1993) and the strain recovery method (Zhang et al, 2012). The direction of in situ stress is mainly determined through the core test and indirect data analysis. In the core test, micro-cracks are taken out along the dominant direction after the core to propagate the acoustic wave in different directions. It should be indicated that the direction of in situ stress can be measured based on the different acoustic velocities and strains of the rock in different directions under rock stress recovery loading. The commonly used methods to determine in situ stress are the wave velocity anisotropy method (Lucier et al, 2011) and the differential strain analysis method (Bai et al, 2013). In indirect data analysis, seismic, logging, block displacement, and natural fracture trend are used to predict the direction of in situ stress. The commonly used methods include the microseismic monitoring method (Liu et al, 2006), wellbore caving method (Xue, 2006), fracture trend analysis method (Aadnoy, 1990), and structural deformation analysis method (Zhou et al, 2007; Deng et al, 2009). Among them, Hydraulic fracturing is currently the most widely used method for deep subsurface stress measurement due to its operational simplicity, accurate and stable test values, and not needing the elastic parameters of rocks in calculations. However, it has high costs. Acoustic emission has the advantages of being simple, intuitive, and relatively cost-effective, making it suitable for large-scale testing, but it also has the problems of low precision and difficulties in identifying Kaiser effect points for current stress measurements. Strain-gauge analysis obtains strain differences in various directions of core samples through experimental simulation, enabling determination of their stress state with high measurement accuracy, but with significant damage to the core samples during sampling. Wave velocity anisotropy experiments are among the most convenient and commonly used testing methods for determining the direction of in situ stresses and can directly reflect differences in stress directions. However, these experiments have limitations in homogeneous sandstones. The borehole breakouts method determines the direction of in situ stresses from the identified failure direction on imaging, which is simple to operate but has low precision. Fracture orientation analysis and structural deformation analysis are often used to preliminarily determine the approximate orientation of in situ stresses, but their measurement accuracy is also low.
In the present study, the in situ stress of the Xujiahe Formation in Yingshan-Longgang of central Sichuan was measured by acoustic emission experiments, and the Kaiser effect point was calibrated by combining the empirical data with hydraulic fracturing data. Meanwhile, in situ stress in the study area was predicted using conventional logging data. The direction of in situ stress was tested by combining a paleomagnetic test with wave velocity anisotropy. Meanwhile, the experimental test results were evaluated using borehole electrical imaging logging. Finally, the predicted in situ stress was applied to field construction and design of a hydraulic fracturing layer and select horizontal well orientation so as to promote the oil and gas production of tight sandstone gas in the study area.
The Yingshan Longgang area is located in the north central Sichuan Basin, spanning Yingshan, Yilong, and southern counties of Nanchong City, Sichuan Province. In terms of regional structure, it belongs to the Yilong tectonic group of the North Sichuan Paleozoic Middle Depression low gentle zone (Figure 1A), with a simple and complete structural form, and is a relatively flat, nearly NW trending low hilly long axis anticline with undeveloped faults. The Jurassic Shaximiao stratum is exposed on the ground, and there are Quaternary river beach gravels locally. The eastern section of the main structure presents a nearly east-west trend, gradually changing to a northwest west direction in the west. Multiple high points are developed from west to east, with the high points connected by a saddle. The main high point is located near Yingshan, and the two wings of the anticline are asymmetric. The north wing is slightly steeper than the south wing. There are fewer deep faults in the Yingshan structure and shallow thrust faults in the hinterland are developed, mostly in the form of fault groups, generally consisting of two faults with opposite tendencies and nearly parallel extension. On the plane, faults are distributed in a northwest or northwest direction, mainly distributed near the wing of the structure, controlling the shape of the structure. The faults in the area have a long extension (18–48 km), a large drop (440–600 km), and a large change in fault dip angle (25–60°), all of which are reverse faults.
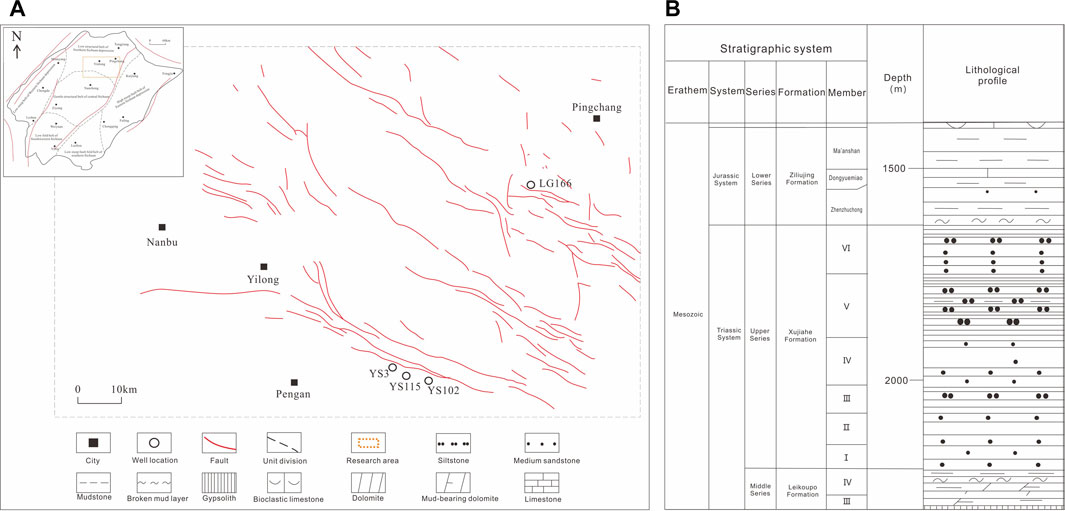
FIGURE 1. Yingshan-Longgang area location map and stratigraphic rock phase division: (A) Location of the Longgang-Yingshan area; (B) Distribution of stratigraphy and petrography in the study area.
The Xujiahe Formation is a set of inland land-derived clastic deposits, which can be divided into six sections from the bottom up (Figure 1B), with a thickness of 500–800 m. The lithology of the study area consists of massive feldspar-bearing quartz sandstones interbedded with coal seam and mudstone, with shallow lake and swampy lake phase mudstones interbedded with coal seams developing in the Xu I, Xu III, and Xu V sections, and dense sandstones in the Xu II, Xu IV and Xu VI sections developing in the submerged diversion channel and shallow beach dam phase. The Xu II section is the main gas-bearing section of the Xujiahe Formation and is characterized by thick sand bodies, thin gas layers, longitudinal multilayers, low pore density, fracture development, and strong reservoir inhomogeneity (Zhang Manlang et al, 2019). Therefore, this study will focus on the stress characteristics of the two sections, while taking into account other layers.
The samples used in this experiment were mainly obtained from coring in four wells located in the Yingshan-Longgang area. The samples were subjected to triaxial rock mechanics experiments, rock acoustic emission experiments, wave velocity anisotropy experiments, and paleomagnetic testing. Table 1 presents information on the source of each sample including the location of the wells, as well as the number of samples used for each test."
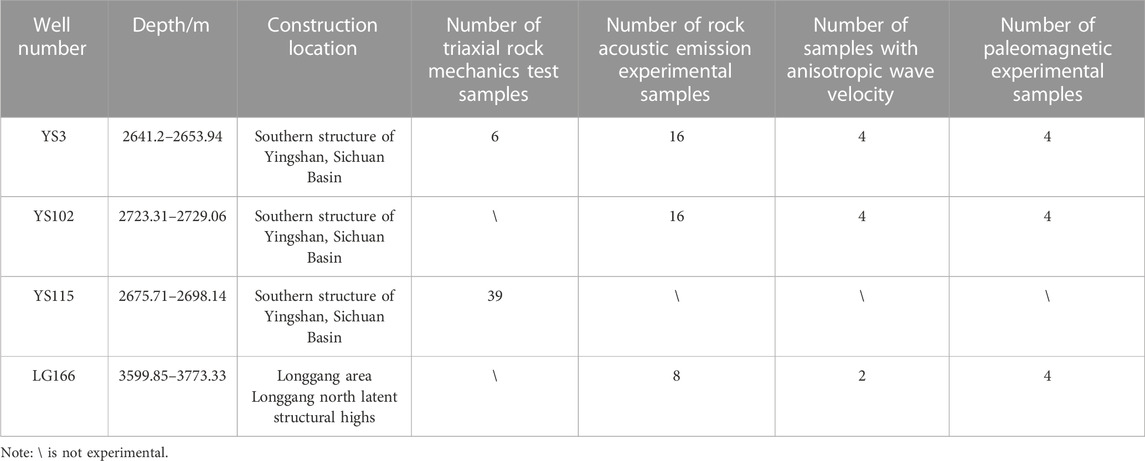
TABLE 1. Statistical table of sample delivery in the study area.
In this experiment, a triaxial rock mechanics test system (RTR-1000, GCTS, America) was used to apply the stress to the specimen until the rock reaches the yield strength. The test process is in accordance with the GB/T50266-99“Standard for test methods of engineering rock mass.”
The rock acoustic emission method is based on the fact that when the crack extends or expands under load, the strain energy releases rapidly to produce elastic waves. This phenomenon, which is called acoustic emission. When the rock is subjected to a stress similar to or greater than the previously applied maximum stress, acoustic emission is produced again. These violently fluctuating acoustic emission values are called the Kaiser effect point and reflect the original rock stress in the deep formation (Wang et al, 2014). Based on the acoustic emission test, the in situ stress of 40 samples from 3 wells was measured. The acoustic emission test is conducted according to the ASTM standard for international rock mechanics. To this end, an acoustic emission instrument (SAEU2S, Soundwel, China) was installed on a triaxial rock mechanics servo test system (GCTS-RTR-1000, GCTS, America) to transmit data. Each series of acoustic emission samples contains 4 rock samples, and 10 series of samples were used in the test. During acoustic emission sampling, the sample was drilled along the axial direction. If it is a vertical well, the vertical principal stress can be determined. Then three samples with an increment of 45° were drilled along the horizontal direction, and normal stresses were measured in three directions so as to determine the minimum and maximum horizontal principal stress. Then the three-dimensional stress of the specimen was obtained by combining the four rock samples. The experimental samples were processed into a cylindrical specimen of φ25mm × 50 mm. After drilling and polishing, the two end faces were ground and flattened manually to ensure the flatness of the faces meet the requirements of the test procedure (Fu et al, 2007).
Wave velocity anisotropy test refers to the use of rock in the drilling process in the presence of a micro-crack. Affected by the crack, sound waves have different propagation velocities along different directions and an anisotropy occurs; More specifically, the slowest acoustic wave propagation is along the maximum horizontal principal stress of the rock. On the contrary, the fastest acoustic wave propagation is along the minimum stress. In this experiment, samples from three wells in the study area were tested. The samples were organized into 10 groups, each group containing two samples. The test was carried out in accordance with the DZ/T0276.31-2015“rock mass acoustic velocity test” standard. The experiment uses the wave velocity anisotropy module of the multi-function rock mechanics instrument (GCTS-RTR-2000, GCTS, America), which is mainly composed of a core holder, an ultrasonic probe, an automatic expansion device of the probe, etc. This testing system can measure the wave velocity of longitudinal (P-wave) and transverse (S-wave) waves, and P-wave is selected for wave velocity anisotropy testing.
The test procedure can be summarized as follows: 1) draw a line parallel to the well for the full-diameter core and place an arrow pointing to the top surface; 2) Measure the time of longitudinal wave propagation along the line. To this end, there is an ultrasonic instrument in the test setup. Then measure the time it takes for a longitudinal wave to propagate along the diameter of the specimen by rotating it 5° clockwise about the core. The propagation velocity of the longitudinal wave can be calculated according to the measured time and the core diameter. 3) Draw the curve of longitudinal wave propagation speed versus circumference angle, and find out the angle corresponding to the minimum wave speed position from the curve. That is, the angle between the maximum horizontal principal stress and the marker line is obtained from the experiment. The direction of the maximum horizontal principal stress relative to the geographical North Pole needs to be further obtained by combining the core orientation results of the paleomagnetism experiment.
The paleomagnetic test is used to determine the relationship between the direction of the maximum horizontal principal stress and the direction of the viscous remanence. This test is commonly used to determine the characteristics of the viscous remanence in magnetic minerals when they are formed and obtain the angle between the maximum horizontal principal stress and the geographical north pole. In this regard, a viscous remanence measuring instrument was used, which was implemented according to the DD 2006-04‘paleomagnetic test technical requirements’ standard. The test process can be summarized as follows: The cylindrical rock sample with a diameter of φ25 mm and a length of 25 mm core is processed from the core of the wave velocity anisotropy experiment, based on the orientation of its marker line. The paleomagnetic instrument is used to perform alternating demagnetization and thermal inference on the sample and measure the characteristics step by step. The fisher statistical method was used to determine the average direction of the core remanence vector. The comparison of the obtained results from two rock samples reveals that a more consistent direction was selected as the final direction of the paleomagnetic orientation for specimens. Based on the results of the wave velocity anisotropy experiment and the paleomagnetic experiment, the maximum horizontal principal stress direction of the specimen can be determined.
Acoustic emission tests are used to determine the primary rock stress by recording the acoustic emission signals under uniaxial multi-stage loading conditions and determining the stress components at different levels based on sudden changes in signals (Jiang et al, 2005). Field measurement of in situ stress using hydraulic fracturing is primarily based on the curve of pressure changes over time recorded during the fracturing construction process in the entire fracturing section. By combining relevant rock mechanics parameters and fracturing theories, the magnitude of in situ stress can be determined.
In the present study, the Kaiser effect points were determined by taking the data surge points in the AE ringing count-time relationship graph combined with the data of abrupt change points in the cumulative energy log-time curve, while the measured stress by hydraulic fracturing data was used to comprehensively calibrate the acoustic emission results.
The measurement principle of hydraulic fracturing is based on the assumption that the rocks in the Earth’s crust are linear and homogeneous isotropic elastic bodies. There is a stress direction parallel to the borehole axis in the main stress direction, and the flow of fluid in the pore conforms to Darcy’s law. When high-pressure fluid is injected into the tested formation segment during a hydraulic fracturing test, the rock will break and form hydraulic fractures around the wellbore, and the direction of crack propagation is always along the maximum horizontal principal stress direction. When the hydraulic fracturing system is closed, the crack will close again. At the critical closure pressure of the crack, the fluid pressure inside the crack is equal to the minimum horizontal principal stress perpendicular to the crack. The closed fracture pressure at this time is approximately equal to the size of the minimum horizontal principal stress (Zhang et al, 2012; Wu, 2013; Dong et al, 2019; Wang et al, 2020; He et al, 2022). The formula for calculating the minimum horizontal principal stress using the hydraulic fracturing method is as follows:
Here, σh refers to the magnitude of the minimum horizontal principal stress in MPa; Ps is the instantaneous shut-in pressure in MPa; and PH is the hydrostatic column pressure in the wellbore at the depth of the PH test interval in MPa.
Ps is the closed fracture system’s crack closure pressure obtained at the wellhead after shutting down the hydraulic fracturing process. The actual bottomhole closure pressure of the fractures needs to be adjusted by adding the hydrostatic pressure PH to obtain the magnitude of the minimum horizontal principal stress σh under in situ formation conditions. Through analyzing and computing the hydraulic fracturing data of the Xujiahe Formation in well YS102, it was found that the fracture closure pressure distribution ranged from 45.52 to 55.35 MPa, with an average of 54 MPa (Figure 2A). Based on this data, the Kaiser effect point in the acoustic emission testing result was calibrated, and the fourth Kaiser effect point value was determined to represent the magnitude of current in situ stress (Figure 2B)."
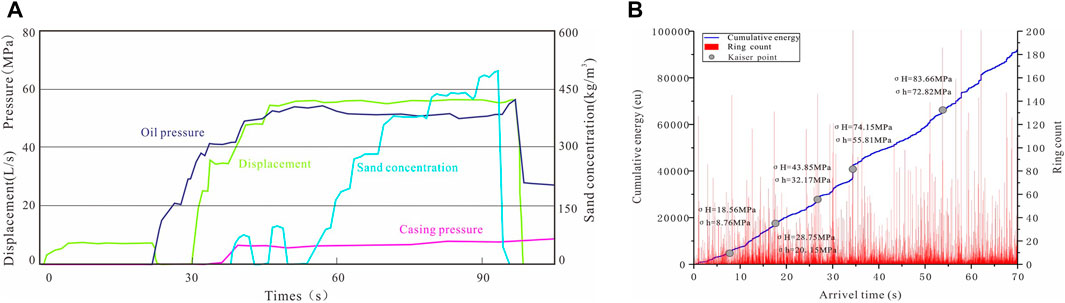
FIGURE 2. Hydraulic fracturing construction curve and acoustic emission experimental results diagram: (A) Sand fracturing construction profile of well YS102 in the Yingshan-Longgang, Xujiahe Formation in a depth of 2716.00 m–2730.00 m; (B) Distribution of cumulative energy and ringing count as a function of the arrival time of acoustic emission specimens collected from the Xujiahe Formation at a depth of 2728.77 m in well YS102 in the Yingshan-Longgang area.
The obtained results from the three-way in situ stress measurements show that the maximum horizontal principal stress in the study area varies between 66.51 MPa and 97.96 MPa, with an average value of 75.06 MPa; Meanwhile, it is found that the minimum horizontal principal stress varies between 46.54 MPa and 83.99 MPa, with an average value of 59.85 MPa; and the vertical principal stress varies in the range of 63.85 MPa–91.14 MPa, with an average value of 70.82 MPa Table 2. The obtained results show that the order of three-way stress is maximum horizontal principal stress > vertical principal stress > minimum horizontal principal stress, indicating that the study area can be categorized as type III in situ stress and is in a slip stress state; longitudinally, the three-way stress of the Xujiahe Formation decreases gradually from the bottom to the top; In the plane, the three-way stress of well LG166 in the Longgang area is larger than that in the Yingshan area. Moreover, the test results are greater than those in the Yingshan area.
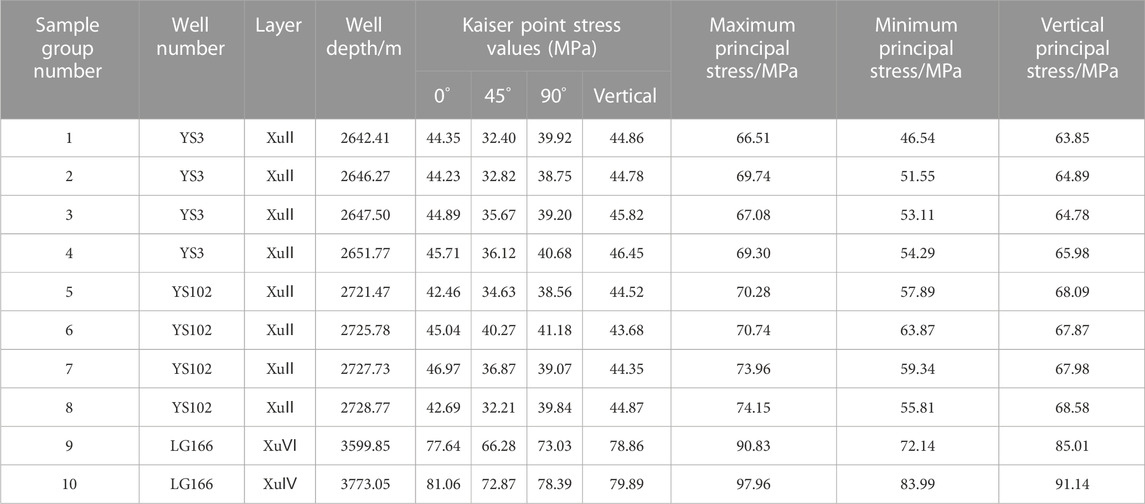
TABLE 2. Three-way stress values obtained from experimental acoustic emission tests of the Xujiahe Formation in the Longgang-Yingshan area.
When measuring in situ stress using the experimental method, drilling the sample drilling results in a missing core. Meanwhile, the experimental analysis is costly and the samples reflect the characteristics of discrete points. In other words, samples can reflect the in situ stress in limited depths. As a result, the generalized in situ stress in the whole profile may be inaccurate. In contrast, logging data has good continuity and high resolution, so logging data can be used to obtain a smooth and accurate in situ stress profile of the target layer (Mao et al, 2019). Based on the obtained results from acoustic emission tests and considering the stratigraphic anisotropy, utilized the ADS (Acoustic Density Stress) method to interpret the in situ stress. This approach relies primarily on acoustic and density logging data to calculate current in situ stress values indirectly (Tan et al, 1990; Zhou et al, 2007). The ADS method has the advantages of simplicity in calculation procedure and ability to obtain continuous Earth stress profiles, and has been widely used (Zheng et al, 2014; Yao, 2016; Lyu, 2017; He et al, 2022; Zhang et al, 2022). This method can be mathematically expressed as follows:
Where σx and σy are horizontal stresses along x- and y-directions, respectively; σv denotes the vertical principal stress; μg is the dimensionless non-equilibrium factor of horizontal skeletal stress in the formation; v is Poisson’s ratio; Pp is the formation pressure; Cma and Cb are the skeleton and volume compression coefficients of rock, respectively.
The determination steps of each parameter are as follows: Poisson’s ratio v is calculated based on acoustic logging data and calibrated using rock mechanics experimental results; σv is obtained by integrating the density of overlying strata using density logging data; PP is the formation pressure, which can be calculated using the formation pressure coefficient in the study area or equivalent mud density. Cma and Cb are computed using the acoustic travel time method; The parameter μg can be obtained using borehole diameter. To this end, the stress deformation in the borehole is used to reflect the change in tectonic stresses. The calculation formula is shown in Equation (3). If there is no dual-diameter logging data available, μg can also be obtained by an inverse calculation method using actual measurement values.
Where dmin and dmax are the minimum and maximum borehole diameter at the measurement point, respectively; K is the scale factor.
The coincidence between the calculated maximum horizontal principal stress, minimum horizontal principal stress, and vertical principal stress from logging and the measured values is 75.4%, 74.0%, and 96.7%, respectively. The above results indicating that the logging calculation method is an effective scheme to establish a continuum in situ stress profile for single wells in the Yingshan-Longgang area. As an example, Figure 3 shows the measured and predicted in situ stress in well YS102.
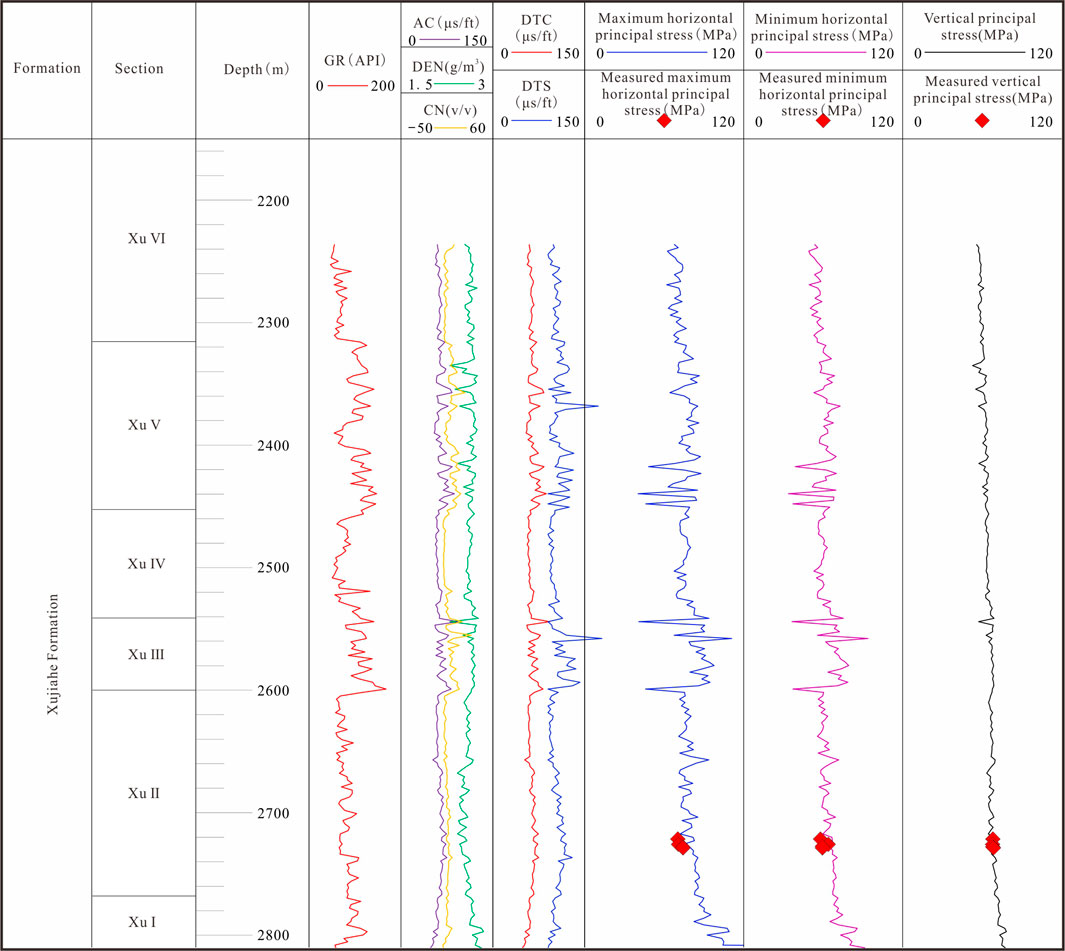
FIGURE 3. In-situ stress interpretation section of the Xujiahe Formation in well YS102 in the Yingshan-Longgang area.
The obtained in situ stress in the Yingshan-Longgang area using acoustic emission tests and logging data reveals that the study area is dominated by a strike-slip stress state, and the in situ stress increases with increasing depth in the longitudinal direction. Compared to the Yingshan area, the Longgang area exhibits higher three-way in situ stress in the planar direction. Ground force is affected by numerous factors such as burial depth, lithology, faults, and tectonic morphology (Xu et al, 2019). The analysis of the planar distribution of in situ stress indicates a significant variation in burial depth between the Yingshan and Longgang areas. More specifically, the burial depth of the Xujiahe Formation is deeper in the Longgang area compared to the Yingshan area, resulting in higher stress in the former.
Paleomagnetic core orientation refers to the use of core samples to determine the characteristics of the magnetic minerals to record viscous remanence at the time of formation. This test is usually carried out to determine the correlation between the direction of maximum horizontal principal stress and the direction of viscous remanence in the rock and obtain the angle between the maximum horizontal principal stress and the geographic north pole. The rocks in the formation are under compression loads and geological stresses. As a result, fractures and pores are compressed to varying degrees, and the greatest compression occurs along the maximum horizontal principal stress. When the core is removed from the stress-bearing environment elastic stress is released.
The experiment on wave velocity anisotropy is conducted using samples extracted from underground that have been brought to the surface. At this stage, the sample is free from the original stress of the rock and the stress relief causes the rock core to develop microcracks in proportion to the degree of stress release (Li et al, 1997). These micro-cracks derive from stress relief and preferentially arrange themselves along the direction of the maximum vertical principal stress. As a result, the cracks become filled with air, which yields significant differences in the wave impedances of air and rock. This manifests as prominent directional wave velocity anisotropy. Each propagation speed across different directions is then plotted and connected sequentially to form sinusoidal or cosine curves. On the maximum horizontal in situ stress direction, the degree of stress unloading in the rock core is maximized, resulting in the slowest wave speed in that direction. Conversely, the fastest wave speed is observed along the minimum horizontal principal stress direction (Zhou, 2007; Lucier et al, 2011; Min et al, 2020). Accordingly, there is an obvious anisotropy in the propagation velocity of sound waves in different directions in the core. This characteristic can be used to obtain the relative azimuthal angle between the maximum horizontal principal stress and the marker line of the core.
Based on the orientation results of paleomagnetic core samples from the Longgang-Yingshan area (Figure 4), it is inferred that the angle between the core marker line and the geographical north pole mainly varies between 135° and 180°.
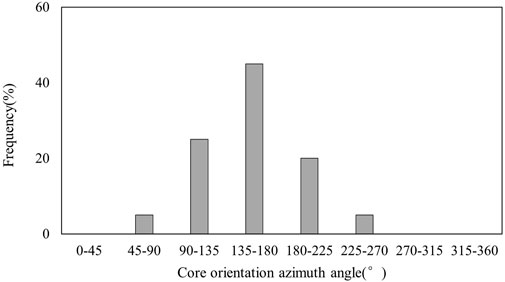
FIGURE 4. Core orientation results of the Xujiahe Formation in the Yingshan-Longgang area.
According to the results obtained from the wave velocity anisotropy tests, the wave velocity is a function of the angle between the direction of the maximum horizontal principal stress and the marker line. Figure 5A shows that the lowest wave velocity occurs when the angle between the direction of the maximum horizontal principal stress and the marker line is 40°. Moreover, Figure 5B illustrates that the lowest wave velocity occurs along the maximum horizontal principal stress that has an angle of 25° from the marker line. Figure 5C reveals that there is no obvious sine and cosine wave velocity curve, indicating that the anisotropy is poor and the experimental results may not reflect the true direction of the in situ stress. Combining the results of paleomagnetic and wave velocity anisotropy measurements of the in situ stress direction (Figure 6), it is inferred that the azimuth of the relative maximum horizontal principal stress in the Xujiahe Formation in the study area is mainly distributed in N110°–120°E with a mean maximum principal stress azimuth of N100°E near the EW direction.
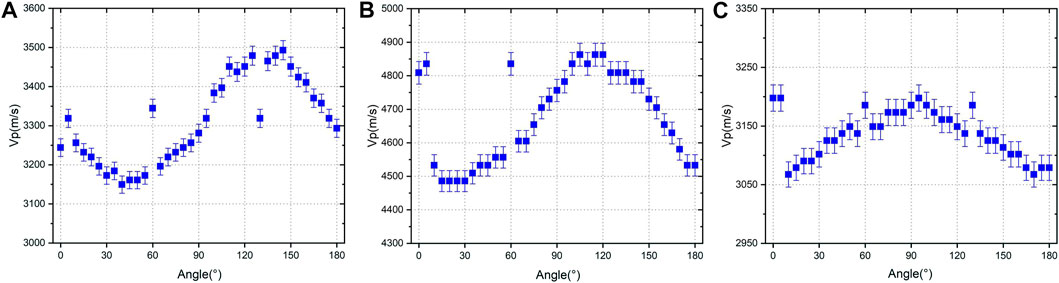
FIGURE 5. Wave velocity anisotropy curves of the Xujiahe Formation in the Yingshan-Longgang area: (A) Sample group 1 from well YS3; (B) Sample group 10 from well LG166; (C) Sample group 5 from well YS102.
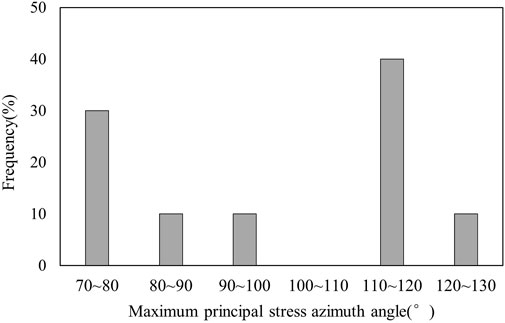
FIGURE 6. Distribution of the maximum horizontal principal stress results for the Xujiahe Formation in the Yingshan-Longgang area.
According to the tangential stress analysis of the well wall, there is a minimum perimeter tangential stress along the maximum horizontal principal stress. Until the mud column pressure is less than a certain threshold, this stress is negative, indicating that it is a tensile stress. Once this tensile stress exceeds the rock tensile strength, a tensile-induced fracture appears in the well wall along the maximum horizontal principal stress (Jonaghani et al, 2019). When drilling the core, stress is released in the borehole, but it remains around the borehole. When the difference between the maximum and minimum horizontal principal stresses around the borehole exceeds the shear strength of the rock, the borehole collapses and the block falls forming an elliptical borehole. Currently, the borehole wall collapse method is one of the most important methods for determining the direction of deep in situ stress with the long axis of the borehole along the minimum horizontal principal stress (Huang, 2008). Logging images can visualize the induced fracture and the orientation of the well section where the stress collapse occurred, and can indicate the direction of the maximum and minimum horizontal principal stresses by recovering the direction of the induced fracture, and well wall collapse, respectively.
The wall collapse in the imaging log of well YS3 in the Yingshan area is 15°±5°, with a maximum horizontal principal stress orientation of N105°±5°E (Figure 7A), and the mean value of the maximum horizontal principal stress direction is N113.4°E (Table 3); The wall collapse in the imaging log of well LG166 in the Longgang area is 20°±5°, with a maximum horizontal principal stress orientation of N110°±5°E (Figure 7B), and the mean horizontal principal stress direction measured by the previous experiments in this well was N115.9°E (Table 3). It is observed that the experimental test results are in good agreement with the in situ stress orientation interpreted by the imaging logs. However, the absence of induced fractures and well wall crumbling in the imaging logs at the depth section in well YS102 (Figure 7C) indicates that the two-way differential stress is small at this depth section, which reduces the accuracy of in situ stress direction evaluation.
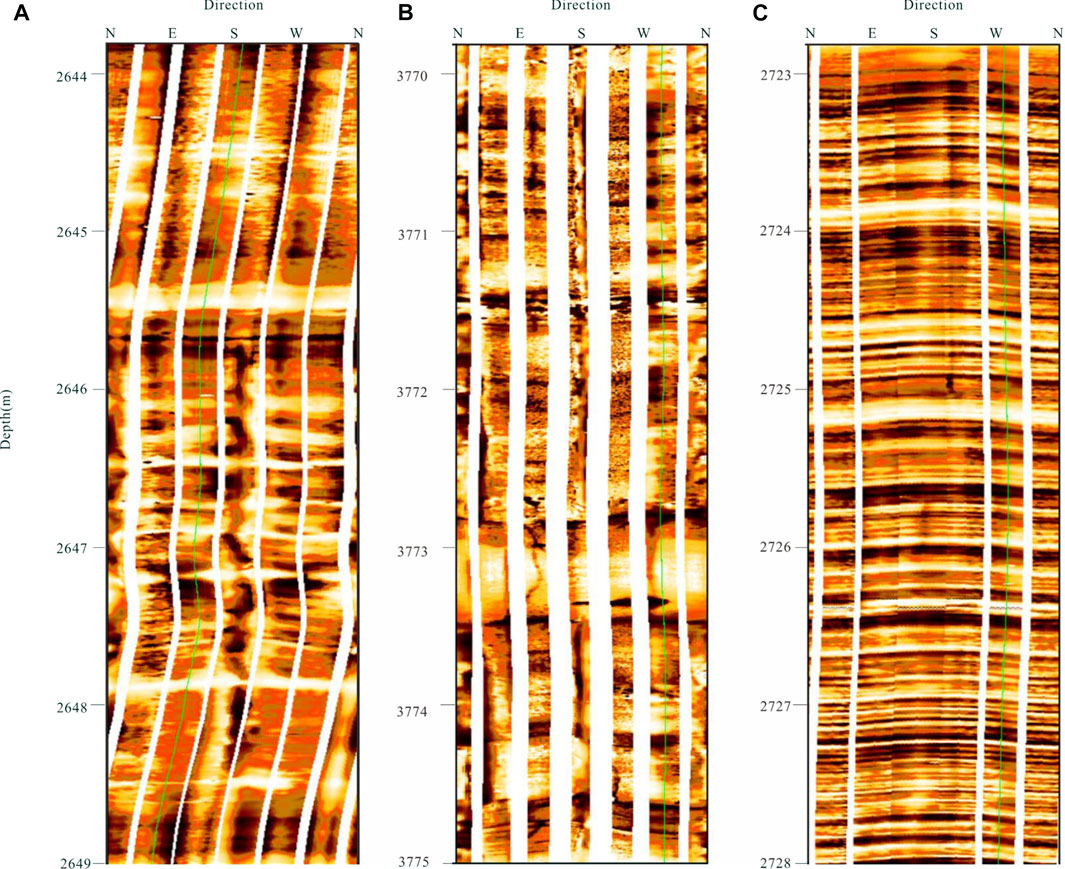
FIGURE 7. Maximum principal stress orientation identified by wall collapse: (A) YS3 well at a depth of 2646 m; (B) LG166 well at a depth of 3773 m; (C) YS102 well at a depth of 2724 m.
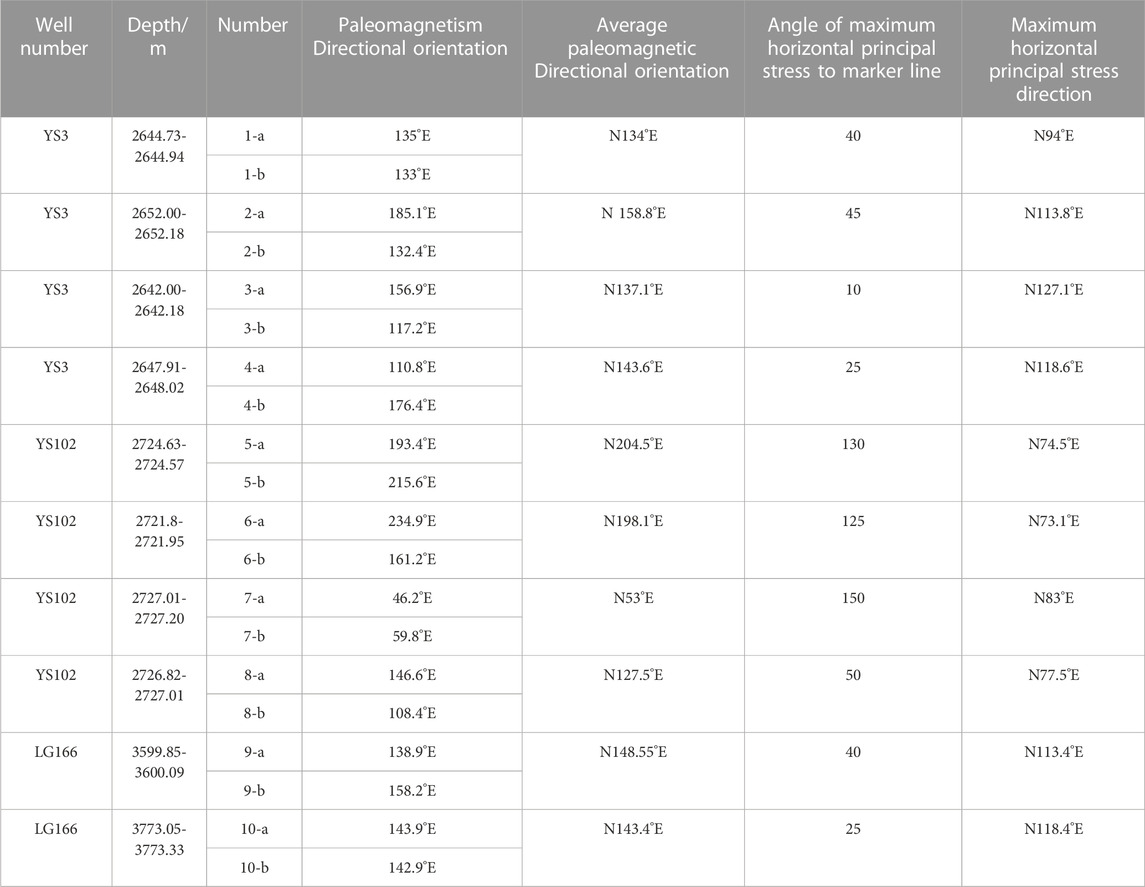
TABLE 3. Experimental paleomagnetic test results and directional calculations of the maximum horizontal principal stress in the Xujiahe Formation in the Yingshan-Longgang area.
By interpreting the imaging log data in and around the sampling depth section of well YS102, the well wall collapse orientation, and the maximum horizontal principal stress direction were obtained. The comparison of measured and calculated average maximum horizontal principal stress direction in the YS102 well shows that the calculated results are in good agreement with the experimental data Table 4. Meanwhile, it is found that the azimuthal angle of the maximum horizontal principal stress in this well has been shifted counterclockwise to a smaller extent when compared with the other two wells.

TABLE 4. In-situ stress direction results from image logging interpretation of well YS102 in the Xujiahe Formation in the Longgang-Yingshan area.
The experimental results of combined paleomagnetic wave velocity anisotropy in the Yingshan-Longgang area are consistent with the maximum principal stress direction reflected in the electrical imaging logs. The average maximum horizontal principal stress direction is N100°E, maintaining the present-day near east-west regional stress field. However, the azimuth of the maximum principal stress direction at well YS102 shifts counterclockwise to a smaller angle. Analysis of the combined regional stress and tectonic context suggests that a strong escape occurred eastward from the eastern part of the extruded Tibetan Plateau as the Indian plate continued to push the Tibetan Plateau in the NNE direction, which has been the dominant geological phenomenon in the region from the mid-late Xishan to present. Meanwhile, strong lateral compressional stresses were generated in the central Sichuan area that formed the compressive stress field in the Yingshan-Longgang area and provided energy for creating an east-west regional stress field in the study area. The top boundary of the Xu Ⅱ section in the Yingshan area is characterized by a nearly NW oriented long axis anticline, with structures of varying sizes of traps developed from south to north. The structures are interconnected through synclines and faults (Figure 8). The YS3 well is located at the high point of the backslope structure in the Yingshan area, and the YS102 well is on the same backslope flank, with the maximum horizontal principal stress deflected in a direction perpendicular to the axial direction.
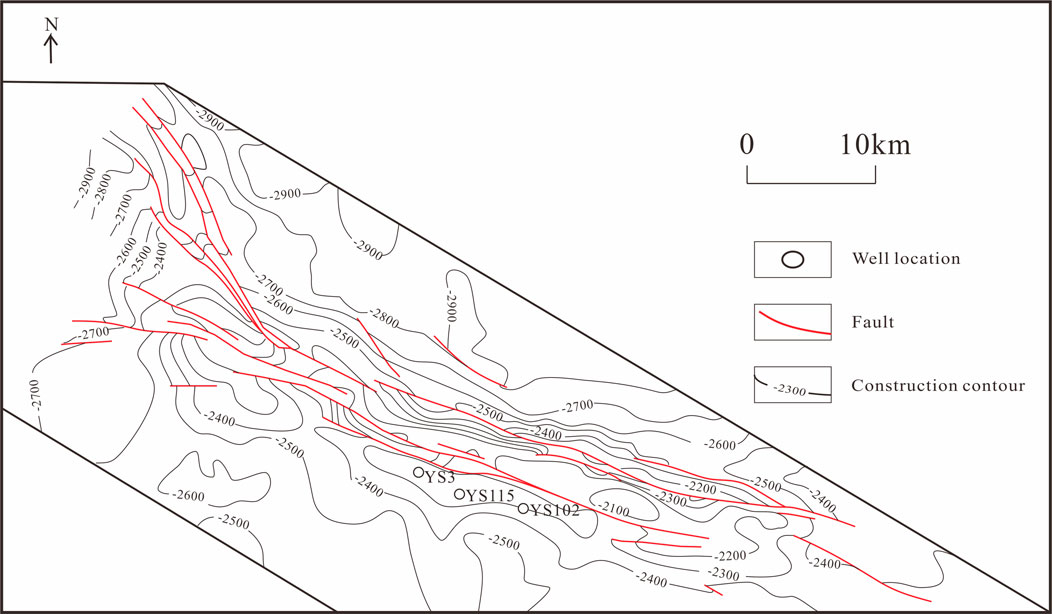
FIGURE 8. Contour of the top surface of the Xu II section in the Ying Shan area.
The in situ stress controls the pressure fracture expansion and fracturing effect. The measured in situ stress indicates that the Yingshan-Longgang area is under a walking slip stress state, and the fractured fractures expand along the maximum principal stress and vertical stress. The crack expansion forms narrow and long vertical fractures. As a result, the longitudinal expansion is weak, while the lateral expansion is strong (Hubbert and Wills, 1957).
Moreover, the morphology and distribution of hydraulically fractured joints are controlled by the minimum horizontal principal stress and horizontal two-way differential stress (Renshaw and Pollard, 1994; Li et al, 2016; Zhang Ruxin et al, 2019; Zhang and Qi, 2020; Li and Wang, 2021). The latter determines the fracture pressure and affects the initiation location of fractures. This is because fractures expand along the lowest minimum horizontal principal stress and stop when reaching a formation with higher minimum horizontal principal stress. When the horizontal two-way differential stress is high, hydraulic fracturing forms simple and long directional planar fractures. However, Figure 9 shows that when the horizontal two-way differential stress is low, a complex network of longitudinal and transverse fractures forms.
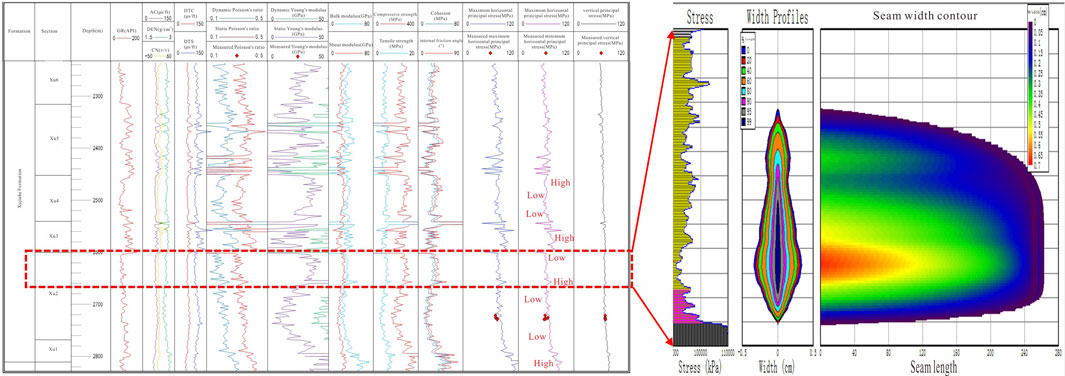
FIGURE 9. Simulation results of hydraulically fractured morphology in the middle and upper part of sublayer 2, member 2, Xujiahe Formation, and well 102 in the Yingshan area.
Given the longitudinal structure of in situ stress in the Yingshan-Longgang area, the upper section of the XuⅡ middle section is an optimal choice for fracturing. This section exhibits how horizontal two-directional differential stress, which facilitates the formation of complex, poorly oriented fractures and enables effective modification of the reservoir volume.
For a Type III stress structure, wall stability gradually increases as the borehole azimuth increases. More specifically, horizontal wells have higher wall stability than straight wells. Higher wall stability results when the borehole azimuth angle and the maximum horizontal principal stress angle are at 45° (Figure 10). Considering the present-day in situ stress orientation (average N100°E) of the Xu II section, the overall more developed natural fractures, and the NW orientation of the dominant group system, the horizontal well should be deployed at an azimuth of N20°-30°E in order to obtain a larger modification volume and production (Figure 11).
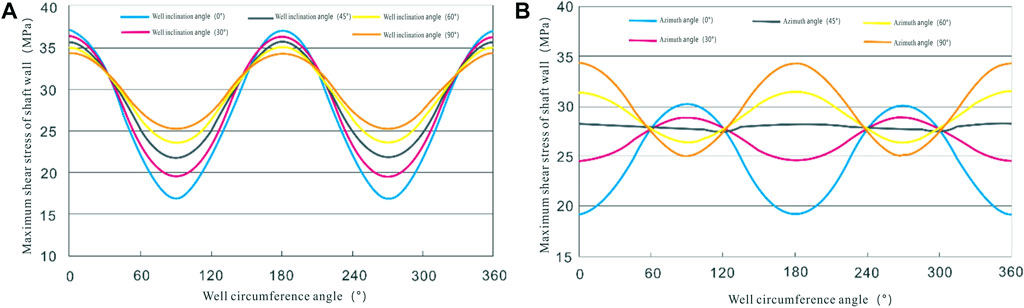
FIGURE 10. Distribution of maximum shear stress around the well wall (A) for different borehole slope angles; (B) for different borehole azimuth angles.
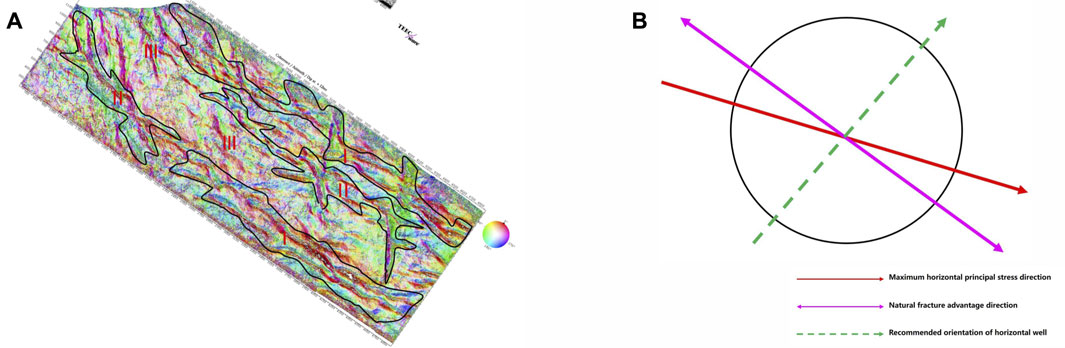
FIGURE 11. Recommended orientation map for horizontal wells combining test results for natural fracture dominance direction and in situ stress direction: (A) Predicted natural fracture distribution map of the Xujiahe Formation in the Yingshan-Longgang; (B) Proposed orientation of horizontal wells).
In the present study, the magnitude and direction of in situ stress in the second section of the Xujiahe Formation in Yingshan-Longgang area were evaluated. Based on the performed analysis and the obtained results, the main achievements of this article can be summarized as follows.
(1) The maximum horizontal principal stress value of the Xujiahe Formation in the Yingshan-Longgang area is between 66.51 MPa and 97.96 MPa, with an average value of 75.06 MPa; The minimum horizontal principal stress varies in the range of 46.54–83.99 MPa, with an average value of 59.85 MPa; The vertical principal stress varies from 63.85-91.14 MPa, with an average value of 70.82 MPa; The order of the in situ stress is maximum principal stress > vertical principal stress > minimum principal stress. The study are can be categorized as a type III stress area with the state of slip stress. According to the layer from deep to shallow, hydraulic fractures primarily produce longitudinal tension joints. The three-way stress value gradually decreases as the depth increases, while it increases with increasing burial depth. The Longgang area has relatively higher three-way stress values due to the influence of burial depth.
(2) The maximum horizontal principal stress azimuth in the Xujiahe Formation ranges from N73.1° to 127.1°E, with an average azimuth of N100°E and the maximum principal stress occurs along the EW direction. However, at well YS103 in the Yingshan area, the in situ stress direction counterclockwise deflection becomes smaller due to the influence of tectonic morphology.
(3) Considering the influence of the longitudinal variation of the minimum horizontal principal stress and the two-directional stress difference on the fracture extension pattern, the middle and upper members of the second member of the Xujiahe Formation have reasonable fracturing performance; Taking into account the maximum horizontal principal stress and the distribution of natural fractures, it is recommended to deploy horizontal wells with an orientation of N20°–30° E for greater volume transformation and higher production.
The original contributions presented in the study are included in the article/supplementary material, further inquiries can be directed to the corresponding authors.
SG and HD: contributed to conception and design of the study. WY, SY, and JZ: organized the database. ZW: software. YG: writing-original draft preparation. BZ and CL: visualization investigation. XY and WX: performed the statistical analysis. TH: writing-Review and Editing, supervision. All authors contributed to the article and approved the submitted version.
This research was supported by National Natural Science Foundation of China (42072182): Study on the mechanical mechanism of particle deformation and displacement alignment during shale page rationalization. Sichuan Outstanding Young Scientific and Technological Talents Project (2020JDJQ0058): Natural fracture evaluation of Shale gas reservoir.
The authors would like to thank all the reviewers who participated in the review, as well as MJEditor (www.mjeditor.com) for providing English editing services during the preparation of this manuscript.
The authors declare that the research was conducted in the absence of any commercial or financial relationships that could be construed as a potential conflict of interest.
All claims expressed in this article are solely those of the authors and do not necessarily represent those of their affiliated organizations, or those of the publisher, the editors and the reviewers. Any product that may be evaluated in this article, or claim that may be made by its manufacturer, is not guaranteed or endorsed by the publisher.
Aadnoy, B. S. (1990). In-situ stress directions from borehole fracture traces. J. Petroleum Sci. Eng. 4 (2), 143–153. doi:10.1016/0920-4105(90)90022-U
Bai, Jinpeng, Peng, Hua, Zheng, Zhexia, Liu, Chong, Ma, Xiumin, Jiang, Jingjie, et al. (2013). In-situ stress measurement by differential strain analysis method in the well tun-1. J. Geomechanics 19 (02), 117–124. doi:10.3969/j.issn.1006-6616.2013.02.001
Cai, Meifeng. (1993). Review of principles and methods for rock stress measurement. Chin. J. Rock Mech. Eng. (03), 275–283. :SUN:YSLX.0.1993-03-009.
Cao, Feng, He, Jianhua, Wang, Yuanyuan, Deng, Hucheng, and Xu, Qinglong (2022). Methods to evaluate present-day in-situ stress direction for low anisotropic reservoirs in the second member of the Xujiahe Formation in hechuan area. Adv. Earth Sci. 37 (07), 742–755. doi:10.11867/j.issn.1001-8166.2022.036
Dai, Jinxing, Ni, Yunyan, and Wu, Xiaoqi (2012). Tight gas in China and its significance in exploration and exploitation. Petroleum Explor. Dev. 39 (03), 257–264. CNKI:SUN:SKYK.0.2012-03-002.
Deng, Hucheng, Zhou, Wen, Jiang, Haogang, Liang, Feng, and Huang, Tingting (2009). Effect of tectonic deformation on current geo-stress orientation. Oil Drill. Prod. Technol. 31 (04), 57–62. doi:10.3969/j.issn.1000-7393.2009.04.014
Dong, Bingxiang, Liu, Yang, Li, Wei, Zhou, Xun, and Xu, Haoyin (2019). Physical simulation of fracture initiation and propagation in horizontal well fracturing. Special Oil Gas Reservoirs 26 (06), 151–157. doi:10.3969/j.issn.1006-6535.2019.06.028
Fu, Xiaomin, and Wang, Xudong (2007). The research on data processing about in-situ stress measurement with AE. Res. Explor. Laboratory (11), 296–299.
He, Jianhua, Cao, Feng, Deng, Hucheng, Wang, Yuanyuan, Li, Yong, and Xu, Qinglong (2022). Evaluation of in-situ stress in dense sandstone reservoirs in the second member of Xujiahe formation of the HC area of the Sichuan Basin and its application to dense sandstone gas development. Geol. China, 1–16.
Hou, Mingxun, Ge, Xiurun, and Wang, Shuilin (2003). Discussion on application of hydraulic fracturing method to geostress measurement. Rock Soil Mech. (05), 840–844. doi:10.16285/j.rsm.2003.05.038
Huang, Bo. (2008). Study of the formation stress analysis method for imaging logging. Beijing, China: China University of Geosciences.
Hubbert, M. K., and Wills, D. G. (1957). Mechanics of hydraulic fracturing. Transactiongs th AIME 210 (1), 153–168. doi:10.2118/686-g
Jia, Chengzao, Zheng, Min, and Zhang, Yongfeng (2012). Unconventional hydrocarbon resources in China and the prospect of exploration and development. Petroleum Explor. Dev. 39 (02), 139–146. doi:10.1016/S1876-3804(12)60026-3
Jian, Min, Ma, Huiyun, Peng, Junliang, Han, Huifen, and Wang, Du (2020). Study on determination of in-situ stress direction using wave velocity anisotropy method combined with paleomagnetism method. Drill. Prod. Technol. 43 (S1), 17–19. doi:10.3969/J.ISSN.1006-768X.2020
Jiang, Yongdong, Xian, Xuefu, and Jiang, Xu (2005). Research on application of Kaiser effect of acoustic emission to measuring initial stress in rock mass. Rock Soil Mech. (06), 946–950. doi:10.16285/j.rsm.2005.06.026
Jing, Lyu (2017). Continental facies shale formation rock mechanical characteristics and stress field evaluation technique —a case study of xinchang Xu5 layer, western sichuan depression. Chengdu, China: Chengdu university of technology. CNKI:CDMD:1.1018.258600.
Jonaghani, H. H., Manshad, A. K., Ali, J. A., Shalafi, M., HabibNia, B., Lglauer, S., et al. (2019). Fracture analysis and in situ stress estimation of a gas condensate field in Persian Gulf using FMI and DSI image logs. SN Appl. Sci. 1 (11), 1481. doi:10.1007/s42452-019-1466-4
Li, Jianhong, and Wang, Yanbin (2021). Fracture characteristics of the 8th member of Shihezi formation in Linxing Area and its influence on fracturing effect. J. Min. Sci. Technol. 6 (04), 379–388. doi:10.19606/j.cnki.jmst.2021.04.002
Li, nianyin, Dai, Jinxin, Liu, Chao, Liu, Pingli, Zhang, Yanming, and Luo, Zhifeng (2016). Feasibility research on volume acid fracturing to tight carbonate gas reservoir and its construction effect:A case study of lower Paleozoic carbonate gas reservoir in Ordos basin. Petroleum Geol. Recovery Effic. 23 (03), 120–126. doi:10.13673/j.cnki.cn37-1359/te.2016.03.019
Li, Zhiming, and Zhang, Jinzhu (1997). In-situ stress and petroleum exploration and development. Beijing, China: Petroleum Industry Press, 146–153.
Liu, Yunbin, An, Guangzhu, and Zhang, Liehui (2006). Confirming characteristics of ground stress field of toutai oil field in songliao basin by microseismic wave method. Petroleum Geol. Oilfield Dev. Daqing (03), 29–30+105. doi:10.3969/j.issn.1000-3754.2006.03.010
Liu, Zekai, Chen, Yaolin, and Tang, Ruzhong (1994). Application of geostress technology in oilfield development. Petroleum Geol. Recovery Effic. (01), 48–56. + 85.
Lucier, A. M., Hofmann, R., and Bryndzia, L. T. (2011). Evaluation of variable gas saturation on acoustic log data from the Haynesville shale gas play, NW Louisiana, USA. Lead. Edge 30 (3), 300–311. doi:10.1190/1.3567261
Mao, Haiyan, Luo, Tongtong, Lai, Fuqiang, Zhang, Guotong, and Zhong, Lulu (2019). Experimental analysis and logging evaluation of in-situ stress of mud shale reservoir- Taking the deep shale gas reservoir of Longmaxi Formation in Western Chongqing as an example. IOP Conf. Ser. Earth Environ. Sci. 384, 012129. doi:10.1088/1755-1315/384/1/012129
Qiu, Zhen, Zou, Caineng, Li, Jianzhong, Guo, Qiulin, Wu, Xiaozhi, and Hou, Lianhua (2013). Unconventional Petroleum resources assessment: Progress and future prospects. Nat. Gas. Geosci. 24 (02), 238–246. CNKI:SUN:TDKX.0.2013-02-007.
Renshaw, C. E., and Pollard, D. D. (1994). Are large differential stresses re-quired for straight fracture propagation paths? J. Struct. Geol. 16 (6), 817–822. doi:10.1016/0191-8141(94)90147-3
Rubin, Xue (2006). Identifying terrestrial stress direction by imaging logs in Erdos Basin. Pet. Instrum. 20 (3), 52–53. doi:10.3969/j.issn.1004-9134.2006.03.018
Tan, Tingdong (1990). Determination of formation fracture pressure from well loqqing data. Well Logging Technol. (06), 371–377+4. doi:10.16489/j.issn.1004-1338.1990.06.001
Wang, Chenghu. (2014). Brief review and outlook of main estimate and measurement methods for in-situ stresses in rock mass. Geol. Rev. 60 (05), 971–996. doi:10.16509/j.georeview.2014.05.005
Wang, Chenghu, Gao, Guiyun, Wang, Hong, and Wang, Pu (2020). Integrated determination of principal stress and tensile strength of rock based on the laboratory and field hydraulic fracturing tests. J. Geomechanics 26 (02), 167–174. doi:10.12090/j.issn.1006-6616.2020.26.02.016
WangXiao, , Xu, Fanghao, Che, Guoqiong, Wang, Jiashu, and Li, Zhengyong (2014). Main controlling factors of tight sand gas accumulation of Member 2 of Xujiahe Formation in Vingshan structure, Central Sichuan. China. J. Chengdu Univ. Technol. Sci. Technol. Ed. 41 (01), 18–26. doi:10.3969/j.issn.1671-9727.2014.01.03
Wu, Jie (2013). The application of hydraulic fracturing in the geostress survey. Guangdong Chem. Ind. 39 (13), 124–125. doi:10.3969/j.issn.1007-1865.2012.13.065
Xu, Ke, Dai, Junsheng, Shang, Lin, Lu, Fang, Feng, Jianwei, and Du, He (2019). Characteristics and influencing factors of in-situ stress of Nanpu sag, Bohai Bay basin, China. J. China Univ. Min. Technol. 48 (03), 570–583. doi:10.13247/j.cnki.jcumt.000937
Yao, Yong (2016). The study of stress and its application of the salt and gypsum formations of paleogene in yubei area. Chengdu, China: Chengdu university of technology. CNKI:CDMD:2.1016.224856.
Zhang, Chongyuan, Wu, Manlu, Chen, Qunce, Liao, Chunting, and Feng, Chengjun (2012). Review of in-situ stress measurement methods. J. Henan Polytech. Univ. Nat. Sci. 31 (03), 305–310. doi:10.16186/j.cnki.1673-9787.2012.03.005
Zhang, Jincai, and Qi, Yuanchang (2020). Impact of in-situ stresses on shale reservoir development and its countermeasures. Oil Gas Geol. 41 (4), 776–783. doi:10.11743/ogg20200411
Zhang, Manlang, Gu, Jiangrui, Kong, Fanzhi, Guo, Zhenhua, Qian, Weiwei, Fu, Jing, et al. (2019a). Research on tight sandstone reservoir sweet spots of the second member of Xujiahe formation of upper triassic in Hechuan gas field, central Sichuan basin. J. China Univ. Min. Technol. 48 (04), 806–818. doi:10.13247/j.cnki.jcumt.000958
Zhang, Ruxin, Hou, Bing, Han, Huifen, Fan, Meng, and Chen, Mian (2019b). Experimental investigation on fracture morphology in laminated shale formation by hydraulic fracturing. J. Petroleum Sci. Eng. 177, 442–451. doi:10.1016/j.petrol.2019.02.056
Zhang, Xiaoju, He, Jianhua, Xu, Qinglong, Ye, Tairan, Deng, Hucheng, Xu, Zhengqi, et al. (2022). Distribution characteristics and disturbance mechanism of present in-situ stress field in the second member of xujiahe formation in hechuan area. Mineralogy Petrology 42 (04), 71–82. doi:10.19719/j.cnki.1001-6872.2022.04.07
Zheng, Lianhui, Shan, Yuming, Jiang, Xiaohong, and Yin, Shuai (2014). ADS method to calculate geo stress in deep and tight sandstone reservoirs. Nat. Gas Technol. Econ. 8 (04), 21–24+78. doi:10.3969/j.issn.2095-1132.2014.04.006
Keywords: in-situ stress magnitude, in-situ stress direction, Xujiahe formation, dense sandstone, fracture layer
Citation: Gao S, Deng H, Yan W, Yin S, Zhou J, Wen Z, Guo Y, Zhang B, Li C, Yang X, Xia W and Huang T (2023) Evaluation and engineering applications of the in situ stress state of deep tight sandstone reservoirs in the Xujiahe Formation of the Yingshan-Longgang in the central Sichuan Basin. Front. Earth Sci. 11:1204082. doi: 10.3389/feart.2023.1204082
Received: 11 April 2023; Accepted: 31 May 2023;
Published: 14 June 2023.
Edited by:
Lidong Dai, Chinese Academy of Sciences, ChinaReviewed by:
Hongrui Xu, Southwest Jiaotong University, ChinaCopyright © 2023 Gao, Deng, Yan, Yin, Zhou, Wen, Guo, Zhang, Li, Yang, Xia and Huang. This is an open-access article distributed under the terms of the Creative Commons Attribution License (CC BY). The use, distribution or reproduction in other forums is permitted, provided the original author(s) and the copyright owner(s) are credited and that the original publication in this journal is cited, in accordance with accepted academic practice. No use, distribution or reproduction is permitted which does not comply with these terms.
*Correspondence: Hucheng Deng, ZGVuZ2h1Y2hlbmdAY2R1dC5jbg==; Tao Huang, MTEzNjgzMDQzMUBxcS5jb20=
Disclaimer: All claims expressed in this article are solely those of the authors and do not necessarily represent those of their affiliated organizations, or those of the publisher, the editors and the reviewers. Any product that may be evaluated in this article or claim that may be made by its manufacturer is not guaranteed or endorsed by the publisher.
Research integrity at Frontiers
Learn more about the work of our research integrity team to safeguard the quality of each article we publish.