 Huilin Zong
 Xiping Yuan2,3
 Xiaolun Zhang
- 1Faculty of Land Resource Engineering, Kunming University of Science and Technology, Kunming, Yunnan, China
- 2Plateau Mountain Spatial Information Survey Technique Application Engineering Research Center at Yunnan Provinces Universities, Kunming, Yunnan, China
- 3College of Geosciences and Engineering, West Yunnan University of Applied Sciences, Dali, Yunnan, China
In natural terrain scene UAV image matching, traditional feature point-based methods often have problems such as an unstable number of extracted feature points, difficulty in detecting feature points in weak texture areas, uneven distribution, and low robustness. Deep learning-based image matching methods can produce larger and more reasonably distributed matching pairs, so this research paper tries to perform UAV image matching based on a deep learning LoFTR algorithm for natural terrain scenes. The critical technical process was: first, the LoFTR algorithm was used to generate dense feature matching, and then the epipolar line constraints were used to purify the interior points, specifically, this study used the MAGSAC++ method to estimate the fundamental matrix, eliminate the wrong matching pairs, and finally get reliable matching results. In this research paper, six sets of visible images taken by different UAVs equipped with different sensors in the field were selected as experimental data to test the method and were compared and analyzed with the traditional classical SIFT, ASIFT, and AKAZE algorithms and the KeyNet-AdaLAM deep learning method. The experimental results show that the method in this study obtains a dense number of robust matching pairs with uniform spatial distribution in the UAV image matching of natural scenes mainly in mountainous areas, and the comprehensive performance is higher and more advantageous than the comparison methods.
1 Introduction
With the rapid development of software and hardware of low-altitude UAV photogrammetry technology, its unique advantages of high-precision spatial resolution and high time-sensitive responsiveness can provide timely and reliable 3D scene information for natural disasters such as landslides and mudslides. Image matching quality and speed have become the key to data processing (Ji, 2018). At present, the mainstream UAV remote sensing image feature matching methods mainly include traditional feature point-based methods and deep learning-based methods. Feature point-based matching methods generally detect feature points first, then describe them using descriptors, and finally calculate the similarity of feature vectors based on the descriptors, such as the scale-invariant feature transform (SIFT) (Lowe, 2004) algorithm, the ORB (Rublee et al., 2011) algorithm, HARRIS (Haeeis and Stephens, 1988) algorithm, SURF (Bay et al., 2008) algorithm, the full-space affine invariant (ASIFT) (Yu and Morel, 2011) algorithm, the BRISK (Leutenegger et al., 2011) algorithm, and KAZE (Alcantarilla et al., 2012)/Accelerated-KAZE (Alcantarilla et al., 2013) algorithm. With the emergence and continuous in-depth development of deep neural network technology, some excellent matching methods based on deep learning have emerged, such as the L2-Net (Tian et al., 2017) algorithm, SuperPoint (DeTone et al., 2018) algorithm, SuperGlue (Sarlin et al., 2019) algorithm, LoFTR algorithm (Sun et al., 2021), KeyNet algorithm (Laguna and Mikolajczyk, 2022), etc. Large topographic undulations and complex landscapes in natural disaster zones in mountainous regions make it difficult to fly and difficult to collect data, leading to unstable data quality, and frequently resulting in shadows, occlusions, uneven brightness distribution, and geometric distortion in the images, which makes matching of such images challenging or impossible. Many academics have already focused on this issue and used traditional feature-matching techniques to match images of natural landscape scenes in hilly places, yielding beneficial study findings. For feature point coarse difference rejection, Xi’s novel method known as GSIFT was suggested. Prior to rejecting coarse differences, it harvests feature points with the SIFT technique, performs Euclidean distance matching, and builds a system of UAV image-matching feature points with the RANSAC algorithm and graph theory. This system is capable of feature matching and producing high-accuracy single response matrices (Xi, 2020). For UAV image matching in karst regions, (Li et al., 2020) developed the enhanced algorithm A-AKAZE, which greatly decreased the overall matching time and produced more accurate matching pairs. Dai developed the AKAZE improvement algorithm based on the DAISY descriptor and the BRISK improvement algorithm, which are based on the machine learning descriptor LATCH, which in turn are based on an analysis of the characteristics of complex terrain images and their influence on matching. It was demonstrated that while the AKAZE improvement algorithm has a relatively small number of matches, the total matching time is low and the matching efficiency is high. The BRISK improvement algorithm takes longer, but it has a higher percentage of accurate matches and can handle photos of terrain with greater complexity (Dai et al., 2021). For complex terrain in highland mountains, Gao et al. investigated a quick and efficient UAV image matching technique under unique terrain and landscape conditions, and they proposed an integrated scale-invariant feature transform (SIFT) algorithm with the nearest neighbor distance ratio (NNDR) and random sampling consensus algorithm (RANSAC) model constrained method. The technique not only extracts a lot of feature point pairs, but it also has an alignment accuracy rate of 85% (Gao et al., 2022). Using a dual strategy of grid motion statistics and kernel line constraints for matching error point rejection, (Zong et al., 2022) proposed an algorithm to improve the feature matching of AKAZE UAV images for high-resolution images of mountain mudslides. The algorithm replaces the original descriptor with the binary descriptor BEBLID to complete Hamming distance matching, and the number of correctly matched point pairs obtained is higher than that of the original algorithm. In comparison to the previous method, there are more correct matching pairs, but the running speed is also much slower, by almost 40%. The majority of the aforementioned studies are based on traditional manual feature point matching techniques, which may still lead to uneven feature point distribution or even failure to identify repeatable points of interest in images with weak texture information, weak light intensity, blur, and significant geometric distortion. This results in poor robustness of matching results that do not meet the requirements of downstream tasks. Emerging deep learning-based matching methods tend to produce dense pairs of matching points, but the application of such methods in image matching for images with complex and variable terrain and large geometric deformation is still relatively rare, and their application potential needs to be further validated and explored. This article will offer helpful references for future work on UAV image matching in hilly terrain with challenging topography as well as fresh perspectives on the use of the LoFTR method.
2 Experimental platform and data sources
2.1 Experimental platform
All experiments in this research paper were conducted based on the Google Colaboratory free cloud platform, which is a research project of Google Inc. aimed at providing a cloud-based deep neural network training platform for developers with approximately 12 GB of temporary RAM and approximately 100 GB of temporary storage space.
2.2 Data sources
In this study, six groups of images taken by different UAVs with different sensors in different seasons were selected as test objects, as shown in Figure 1. Due to the large size of the original image, all images were down-sampled to 640 × 480. An overview of each test image group is shown in Table 1.
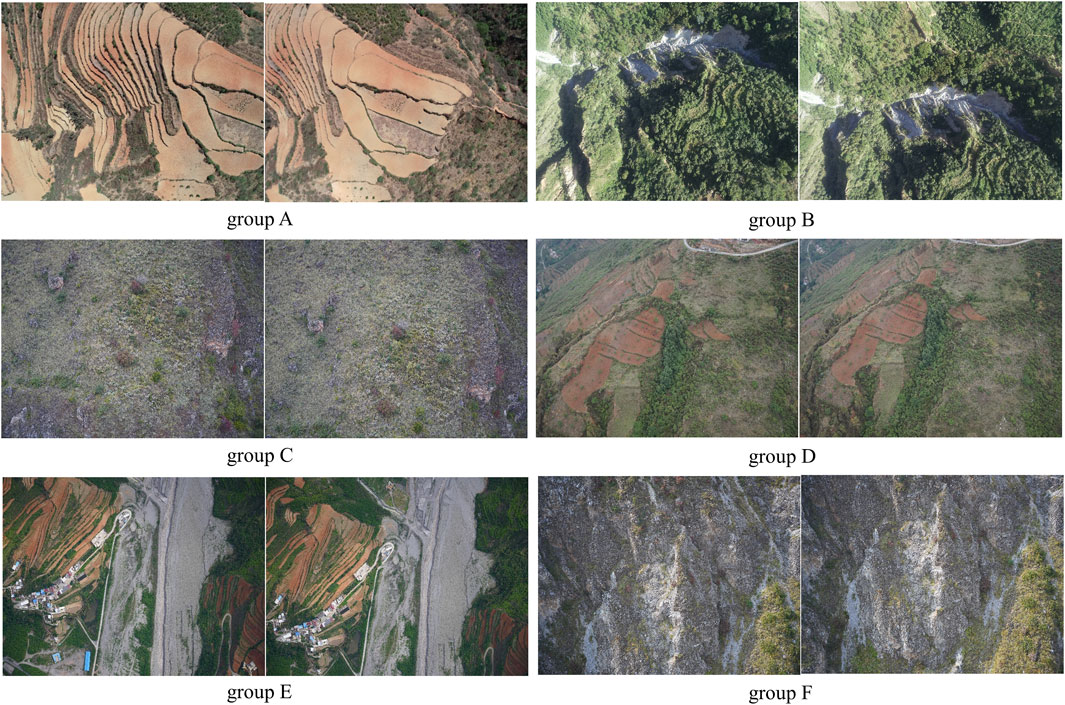
FIGURE 1. Experimental data.
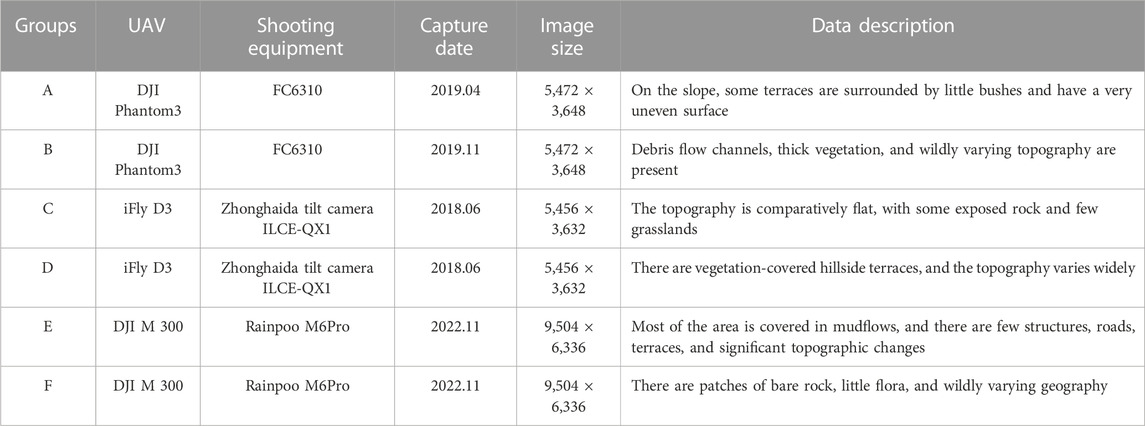
TABLE 1. Description of the test images.
3 Materials and methods
The fundamental process flow of the method employed in this research paper is shown in Figure 2. The key ideas are as follows: 1) Use a CNN local feature extraction network to extract local feature maps of multi-scale from the left and right images; 2) spread the 1/8 feature map of the original resolution image into one-dimensional vectors, fuse the position encoding, and get through the LoFTR module for graph attention calculation to obtain the self-attention layer and cross attention layer; 3) get coarse feature block matching confidence matrix dual-softmax method, and get coarse matching prediction according to the confidence threshold and mutual nearest neighbor (MNN) criterion; 4) a grid map of size 5 × 5 is created and serialized for each chosen coarse prediction location, and the fine matching is carried out within this local window, down to the sub-pixel level. For each cell, its fine features are fused with the coarse features of the grid centroid to obtain the fine feature representation of each cell. To produce the fine feature representation of each cell, each cell’s fine characteristics are combined with the coarse features of the grid centroid. Additionally, the LoFTR module calculates the graph attention, using the centroid of one of the cells as the final feature point coordinate, and outputs the coordinate with the highest confidence in the other 5 × 5 cell as the final matching prediction; and 5) after all matching is done, inevitably there will be some point pairs that do not match. In order to complete the epipolar line constraint, achieve the goal of inner point purification, and provide the desired matching outcome, the fundamental matrix is also estimated using the MAGSAC ++ method.
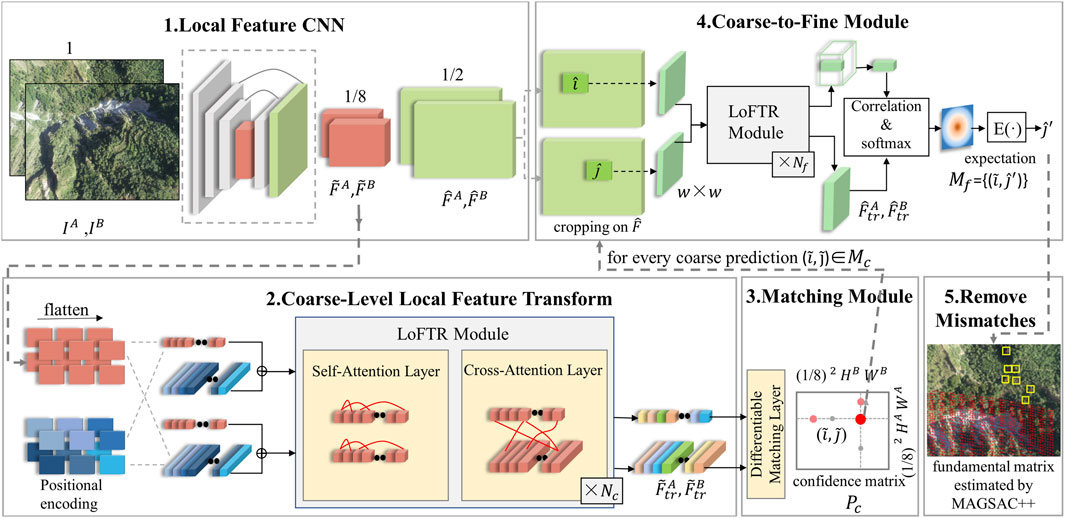
FIGURE 2. The basic workflow of the proposed algorithm (Sun et al., 2021)
3.1 Headings local feature extraction with FPN
The original image needs to be transformed into a feature map by a feature extraction network. Convolutional Neural Networks (CNNs) are well suited for extracting local features. Multi-level features are extracted using feature pyramid networks (FPN) from image pair
3.2 Local feature transformer (LoFTR) module
To create feature representations that are simple to match, the 1/8-size feature maps
The LoFTR module consists of the transformer’s encoder and decoder, where the core of the encoder is the attention layer. The encoder structure is shown in Figure 3. Three vectors are commonly used as the attention layer’s input: a query vector (Q), a key vector (K), and a value vector (V). The values of Query (
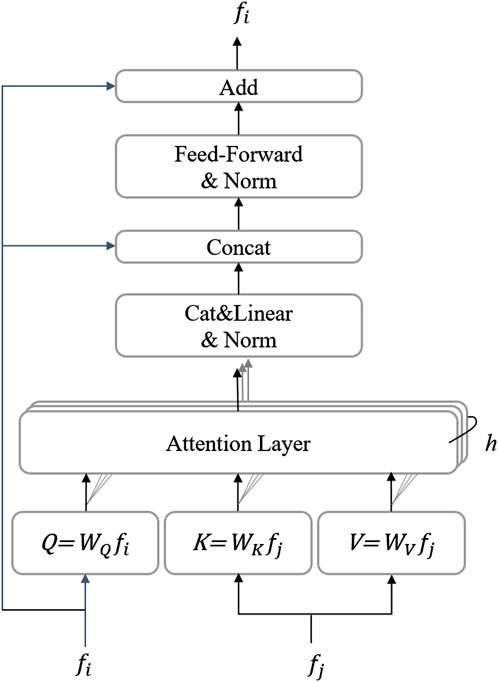
FIGURE 3. Transformer encoder layer, h represents the multiple heads of attention (Sun et al., 2021).
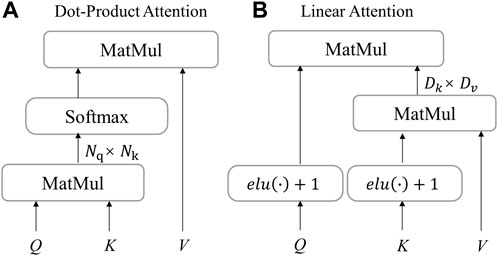
FIGURE 4. Attention layer in LoFTR. (A) dot-product attention layer with O(N2) complexity; (B) linear attention with O(N) complexity. The scale factor is omitted for simplicity (Sun et al., 2021).
3.3 Coarse-level matches module
The self-attention module and the cross-attention module iteratively improve the features after the LoFTR layer and can be utilized for matching. The score matrix
The probability matrix
In Eq. 2:
In Eq. 3:
3.4 Coarse-to-fine matches
Following the completion of coarse-level matching, the conversion to fine-level matching is carried out to bring the matching outcome closer to the resolution of the original image.
First, mapping the coarse-matching point pairs
3.5 Exclusion of incorrect match pairs
Frequently, when the textures of two photos are identical, there will be interference terms when trying to match the same points, and there will invariably be some bad match pairs. A well-matched point is typically referred to as an inliner, whereas a poorly matched point is referred to as an outliner. The epipolar line geometric relations are expressed by the essential or fundamental matrices and play a crucial role. ① As long as the essential matrix or fundamental matrix is obtained, the epipolar line expression can be written directly, and the two-dimensional search interval can be constrained to the one-dimensional epipolar line during the dense matching; ② Another important role is that the epipolar line stereo images can be produced, which is ready for the production of the DEM products; ③ The third important role is that it is able to recover the 3D model of the scene.
Without the assistance of internal and exterior camera parameters, the fundamental matrix depicts the intrinsic geometric relationship of the two perspectives. According to the photogrammetric geometrical relations, it is known that the interior points satisfy the epipolar line geometrical relations in stereo matching, meaning that for each point on an epipolar line, its homonymous point on another image must be located on its homonymous epipolar line. On the reference image and the image to be matched, specifically, if the feature vector distance between two feature points p and p′ is small, it is determined that these two feature points correspond to the same scene and are considered to be homonymous points, with the coordinates of the point pairs being
Setting the error threshold excludes the outer points, which are measured as the distance from the reprojected point to the kernel line.
According to this condition, the corresponding unknown parameters can be calculated by more than eight pairs of homonymous points. The previous standard detection method is to use the Random Sampling Consensus (RANSAC) (Fischler and Bolles, 1987) algorithm for roughness removal, which integrates the removal of incorrect matching pairs into the process of calculating the fundamental matrix and no longer treats it as a separate step to complete the match purification and improve the correctness of the match.
A previous study (Barath et al., 2020) proposed the MAGSAC++ method, which is faster, has higher geometric accuracy, and lower failure rate compared to the existing RANSAC, LMdeS, MSAC, GC-RANSAC (Barath and Matas, 2018a), and MAGSAC (Barath and Matas, 2018b). Therefore, the MAGSAC++ algorithm is chosen to estimate the fundamental matrix model to purify the inner points in this research paper.
4 Results and analysis
4.1 Preliminary matching results based on the LoFTR algorithm
The model trained in MegaDepth, a sizable outdoor dataset, was used for image matching directly to confirm the efficacy of the LoFTR method for picture feature matching of natural settings with complicated topography and scenery in mountainous places. The number of initial matching feature pairs and matching time were compared using the SIFT, ASIFT, AKAZE, KeyNet-AdaLAM, and LoFTR algorithms. The number of initial matching point pairs, the matching runtime, and the qualitative outcomes of the LoFTR algorithm matching are all displayed in Table 2; Figures 5, 6, respectively.
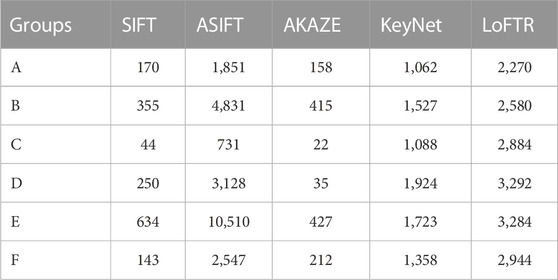
TABLE 2. Statistics of preliminary matching results for UAV images.
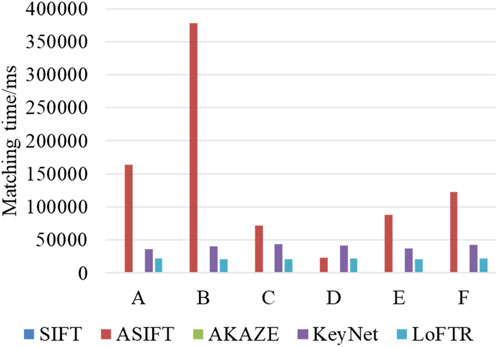
FIGURE 5. Matching time/ms.
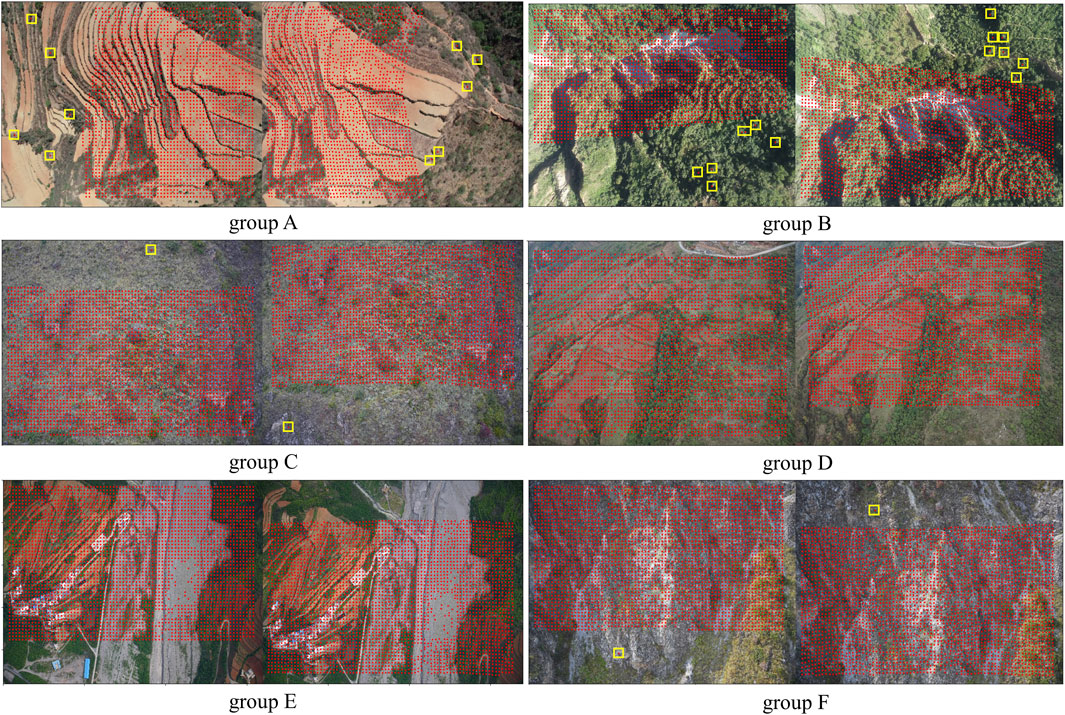
FIGURE 6. Feature matching results by LoFTR algorithm.
The preliminary matching test findings' statistical analysis revealed that ① in comparison to the traditional techniques SIFT and AKAZE, the LoFTR algorithm gets a considerable number of feature matching pairs with uniform distribution in each pair of images, as shown in Figure 6. The LoFTR algorithm has almost three times more matched pairs than the ASIFT algorithm in the C-group images, placing it second after the ASIFT algorithm in groups B and E. As can be observed, the LoFTR algorithm’s performance is highly stable, but the ASIFT method performs better in areas with more texture but clearly performs worse than the LoFTR algorithm in areas with less texture; ② although the learning algorithm KeyNet-AdaLAM does not have as many initial matching pairs as the LoFTR algorithm, which is about half of the LoFTR algorithm, the overall performance is also stable; in comparison to the SIFT and AKAZE algorithms, it obtains more matches per set of images and is more suitable for matching natural scene images with challenging hilly terrain. Moreover, it runs much faster and more consistently than the ASIFT algorithm; ③ the initial matching times for each batch of photographs vary significantly amongst algorithm, in descending order of time consumption: ASIFT > KeyNet-AdaLAM > LoFTR > SIFT > AKAZE; the ASIFT algorithm not only takes up a lot of time, but it also varies a lot and is very unstable in each group of images, whereas the two learning algorithms, KeyNet-AdaLAM and LoFTR, take up a stable amount of time in each group of images; ④ combining the analysis of feature matching quantity and time consumption, it is discovered that the test matching time costs of the learning algorithms KeyNet-AdaLAM and LoFTR are close in each group of images and are barely impacted by different image pairs; however, the ASIFT algorithm’s number of features is positively correlated with the matching time, and the richer the texture and the more features, the longer the matching time is; and ⑤ combining the aforementioned arguments, it is possible to conclude that the LoFTR method has a high degree of generalization in matching and can produce dense matching point pairs. The matching results in Figure 6 also show that there may be a small number of serious matching errors (boxed in yellow), and further inspection reveals that some of the incorrect matching point pairs are located outside the overlap region and share a lot of similarities in their local texture information. If these matched pairs are not removed, it will have a significant effect on the calculation that follows.
4.2 Precise matching results with epipolar constraint based on MAGSAC++ algorithm
Although the LoFTR algorithm takes longer than the SIFT and AKAZE algorithms in the comparative examination of the initial matching results, the number of matched point pairs obtained is dense and uniform, and the stability is considerable. Eliminating the matching error point pairs is required to further increase the matching’s dependability and quality. The MAGSAC++ algorithm is then used to further reduce the error matching point pairs in stereo image matching based on the initial matching of the SIFT algorithm, ASIFT algorithm, AKAZE algorithm, KeyNET-AdaLAM algorithm, and LoFTR algorithm. SIFT+, ASIFT+, AKAZE+, KeyNET +, and LoFTR + (the methods in this research paper) are used to denote the approaches after eliminating mistakes for the convenience of a later presentation. The correct matching pairs, also known as inner points, are the outcomes after the incorrect matching pairs have been eliminated. The accuracy rate was defined as the proportion of inner points to the number of initial matching pairings (or inner point rate). Finally, two indexes were used to compare and evaluate each algorithm’s performance: the accuracy rate (inner point rate) and the number of correct matching pairs (number of inner points). In order to be fair, the MAGSAC++ algorithm was used to calculate the fundamental matrix, and the minimum number of random samples was set to 8. The experiment needs to define an epipolar line constraint threshold, which was set at 2 pixels in this study in order to more accurately compare the benefits of this research. In other words, matching reprojection errors that are within two pixels of the proper matching point pair were accepted, and those that were outside of two pixels were disregarded. The matching results are shown in Figure 7, where the red line connects the correctly matched points, and the yellow line connects the incorrectly matched points. Table 3 lists the number of accurate matching pairs and the accuracy rate.
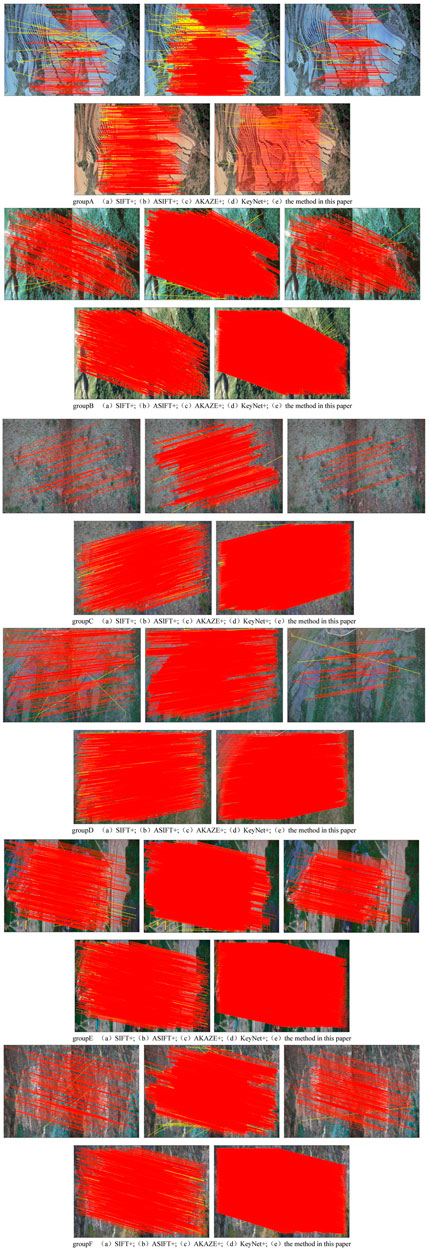
FIGURE 7. The result after eliminating the mismatched point pairs.
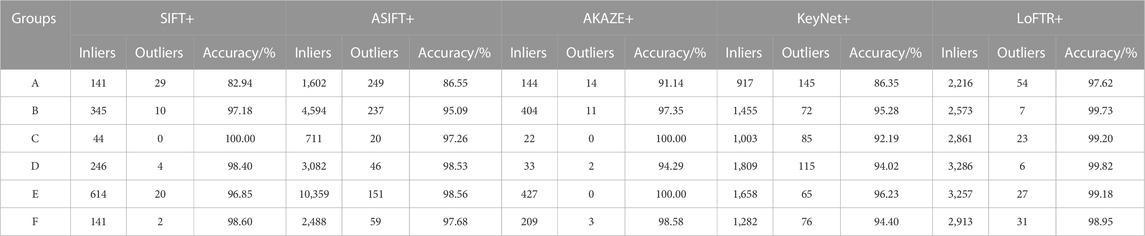
TABLE 3. Statistics of matching results for UAV images.
It is evident from the test findings that ① the matching results of comparison methods are significantly different, and the matching results obtained by the method in this research paper are the most stable, ranking first in the number of inner points obtained in the A, C, D, and F groups and second in the B and E groups; the matching accuracy rate of the method in this study also ranks first in the A, B, D, and F groups. It is clear that the method described in this research has a high level of robustness and overall performance; ② in comparison to other methods, the SIFT+ and AKAZE+ algorithms have fewer inner points, and the matched point pairs obtained in each group of images are also unstable, which is particularly unfavorable for subsequent computations such as orientation, dense matching, and bundle adjustment; ③ comparing the ASIFT+ algorithm to the method in this research paper, it can be seen that the matching pairs obtained by the ASIFT+ algorithm are not stable enough, and the number of matching pairs in group C is less than 1/4 of the algorithm in this study, and the overall matching accuracy rate is not as high as that of the method in this study. The number of correct matching pairs obtained by the ASIFT+ algorithm is significantly higher than that of SIFT+ and AKAZE+ in each group of images; ④ the KeyNet+ algorithm’s matching results reveal the number of valid matching pairs produced by the KeyNet+ algorithm is about half that of LoFTR+ in A, B, C, D, E, and F groups and the matching accuracy rate is lower. It is a medium-level number of correct matching pairs with a low accuracy rate since more point pairs are removed during the fine matching session; there is a pretty misleading point in Group A that needs to be explained more: LoFTR+ has more correct matching points than KeyNet + in Table 3, and it looks like KeyNet+ has more correct matching points than LoFTR+ in Figure 7 for Group A. In group A, the epipolar lines on the two images are aligned. The wrong point pairs are eliminated by LoFTR+, and the correct matching points are connected and then overlapped together, therefore, it appears that there are few matching points. However, LoFTR+ has more correct matching points than KeyNet +, consistent with Table 3; the KeyNet + algorithm’s results are superior to those of SIFT+ and AKAZE+, particularly in the C and D groups; the KeyNet+ method performs at a medium level overall, with some applicability and a stable effect in matching difficult terrain photos in hilly regions; and ⑤ comprehensive analysis of the abovementioned experimental argumentation can be concluded in response to the problem of matching drone imagery in mountainous areas that the method in this research paper, based on deep learning LoFTR algorithm matching, further uses the MAGSAC++ method to purify the initial matching results, which can get more uniformly distributed correct matching pairs with high reliability.
5 Conclusion
The accuracy of subsequent data processing will be directly impacted by the quality of UAV image matching. In this study, the MAGSAC++ technique is utilized to estimate the fundamental matrix and reject the discrete points while the LoFTR approach is used to match UAV images of natural scenes. Six groups of UAV photographs captured in the field of natural scenes were subjected to tests, and the results of these tests were compared to those of numerous common matching techniques. The results demonstrate that the method presented in this research paper has a high and stable overall performance. Additionally, for each group of images, a large number of correctly matched point pairs with even spatial distribution were obtained, providing a solid foundation for subsequent binocular stereo matching, relative orientation, absolute orientation, and aerial triangulation leveling.
Although the experimental results verify that the method in this study can achieve good matching results, there are still some problems that are worthy of further research and discussion, for example, 1) the test applies the pre-training model for preliminary matching directly, but the original pre-training data does not include much of the image data in this study; migration learning can be considered in the future to add some data close to the target dataset based on the original large dataset pre-training model for labeling and model training; 2) it is discovered that several major mistakes matching points are situated outside the overlapping area of the two images in the preliminary matching test results carried out by the image employing the LoFTR method. It would be better to prevent major errors when matching pairings outside the overlap region if the picture overlap area could be calculated before matching and just the overlap area could be focused on during image matching; 3) in the future, a lightweight transformer can be considered to be introduced to optimize this algorithm to improve the speed and efficiency of matching. Further research will be done in the future to solve the aforementioned problems.
Data availability statement
The original contributions presented in the study are included in the article/Supplementary Material, further inquiries can be directed to the corresponding author.
Author contributions
Writing-original draft preparation, HZ; Designed the framework of the research, mastered the conceptualization, and gave many suggestions for improving and modifying this paper, SG and XY; Investigation and data processing, XZ and HZ; Data acquisition and curation, MY and JL. All authors contributed to the article and approved the submitted version.
Funding
This study was supported by the National Natural Science Foundation of China (Grant No. 62266026, No. 41861054).
Acknowledgments
The authors would like to acknowledge the reviewers and the editors for their valuable comments and suggestions to improve the quality of this manuscript.
Conflict of interest
The authors declare that the research was conducted in the absence of any commercial or financial relationships that could be construed as a potential conflict of interest.
Publisher’s note
All claims expressed in this article are solely those of the authors and do not necessarily represent those of their affiliated organizations, or those of the publisher, the editors and the reviewers. Any product that may be evaluated in this article, or claim that may be made by its manufacturer, is not guaranteed or endorsed by the publisher.
References
Alcantarilla, P. F., Bartoli, A., and Davison, A. J. (2012). “KAZE features,” in European conference on computer vision, 214–227. doi:10.1007/978-3-642-33783-3_16
Alcantarilla, P. F., Nuevo, J., and Bartoli, A. (2013). “Fast explicit diffusion for accelerated features in nonlinear scale spaces,” in British machine vision conference (BMVC). doi:10.5244/C.27.13
Barath, D., and Matas, J. (2018a). Graph-cut RANSAC. IEEE/CVF Conf. Comput. Vis. Pattern Recognit., 6733–6741. doi:10.1109/CVPR.2018.00704
Barath, D., and Matas, J. (2018b). “Magsac: marginalizing sample consensus,” in 2019 IEEE/CVF conference on computer vision and pattern recognition (CVPR) (Long Beach, CA, USA: IEEE), 10189–10197. doi:10.1109/CVPR.2019.01044
Barath, D., Noskova, J., Ivashechkin, M., and Matas, J. (2020). “MAGSAC++, a fast, reliable and accurate robust estimator,” in IEEE/CVF conference on computer vision and pattern recognition, 1301–1309. doi:10.1109/CVPR42600.2020.00138
Bay, H., Ess, A., Tuytelaars, T., and Gool, L. V. (2008). Speeded-up robust features (SURF). Comput. Vis. Image Underst. 110 (3), 346–359. doi:10.1016/j.cviu.2007.09.014
Dai, Y. L., Wang, X. H., Li, C., and Li, W. H. (2021). Image matching algorithm for UAV in Karst mountain areas based on BRISK-LATCH. Geogr. Geo-information Sci. 37 (01), 26–32. doi:10.3969/j.issn.1672-0504.2021.01.005
DeTone, D., Malisiewicz, T., and Rabinovich, A. (2018). “SuperPoint: self-supervised interest point detection and description,” in IEEE/CVF conference on computer vision and pattern recognition workshops, 337–33712. doi:10.1109/CVPRW.2018.00060
Fischler, M. A., and Bolles, R. C. (1987). Random sample consensus: A paradigm for model fitting with applications to image analysis and automated cartography. Readings Comput. Vis., 726–740. doi:10.1016/b978-0-08-051581-6.50070-2
Gao, S., Yuan, X. P., Gan, S., Hu, L., Bi, R., Li, R. B., et al. (2022). UAV image matching method integrating SIFT algorithm and detection model optimization. Spectrosc. Spectr. Analysis 42 (05), 1497.
Haeeis, C. G., and Stephens, M. J. (1988). A combined corner and edge detector. Alvey Vis. Conf., 147–151.
Laguna, A. B., and Mikolajczyk, K. (2022). Key.Net: keypoint detection by handcrafted and learned CNN filters revisited. IEEE Trans. Pattern Analysis Mach. Intell., 698–711. doi:10.1109/TPAMI.2022.3145820
Leutenegger, S., Chli, M., and Siegwart, R. Y. (2011). “Brisk: binary robust invariant scalable keypoints,” in International conference on computer vision (IEEE). doi:10.1109/ICCV.2011.6126542
Li, C., Wang, X. H., and He, Z. W. (2020). UAV image matching in Karst area using A-AKAZE algorithm. Bull. Surv. Mapp. 519 (06), 53–56. doi:10.13474/j.cnki.11-2246.2020.0180
Lowe, D. G. (2004). Distinctive image features from scale-invariant key points. Int. J. Comput. Vis. 60, 91–110. doi:10.1023/B:VISI.0000029664.99615.94
Rublee, E., Rabaud, V., Konolige, K., and Bradski, G. (2011). Orb: an efficient alternative to SIFT or SURF. Int. Conf. Comput. Vis., 2564–2571. doi:10.1109/ICCV.2011.6126544
Sarlin, P. E., Detone, D., Malisiewicz, T., and Rabinovich, A. (2019). Superglue: Learning feature matching with graph neural networks. arXiv. doi:10.1109/CVPR42600.2020.00499
Sun, J. M., Shen, Z. H., Wang, Y. A., Bao, H. J., and Zhou, X. W. (2021). “LoFTR: detector-free local feature matching with transformers,” in IEEE/CVF conference on computer vision and pattern recognition, 8918–8927. doi:10.1109/CVPR46437.2021.00881
Tian, Y., Fan, B., and Wu, F. (2017). “L2-net: deep learning of discriminative patch descriptor in euclidean space,” in IEEE conference on computer vision and pattern recognition, 6128–6136. doi:10.1109/CVPR.2017.649
Xi, W. F. (2020). Study on remote sensing image preprocessing method and landslide feature identification of UAV in northeast Yunnan mountain area. Acta Geod. Cartogr. Sinica 49 (8), 1071. doi:10.11947/j.AGCS.2020.20200081
Yu, G. S., and Morel, J. M. (2011). Asift: an algorithm for fully affine invariant comparison. Image Process. Line 1, 11–38. doi:10.5201/ipol.2011.my-asift
Keywords: deep learning, UAV remote sensing image, image matching, LoFTR algorithm, attention mechanism, inline point purification
Citation: Zong H, Yuan X, Gan S, Zhang X, Yang M and Lv J (2023) UAV image matching of mountainous terrain using the LoFTR deep learning model. Front. Earth Sci. 11:1203078. doi: 10.3389/feart.2023.1203078
Received: 10 April 2023; Accepted: 22 August 2023;
Published: 08 September 2023.
Edited by:
Hyuck-Jin Park, Sejong University, Republic of KoreaReviewed by:
Ming Hao, China University of Mining and Technology, ChinaDong-Cheon Lee, Sejong University, Republic of Korea
Copyright © 2023 Zong, Yuan, Gan, Zhang, Yang and Lv. This is an open-access article distributed under the terms of the Creative Commons Attribution License (CC BY). The use, distribution or reproduction in other forums is permitted, provided the original author(s) and the copyright owner(s) are credited and that the original publication in this journal is cited, in accordance with accepted academic practice. No use, distribution or reproduction is permitted which does not comply with these terms.
*Correspondence: Shu Gan, Z3NAa3VzdC5lZHUuY24=
†ORCID:Huilin Zong, orcid.org/0000-0002-2203-5162