 Huihua Du
 Zongzhi Wang
 Jun Yin2
- 1State Key Laboratory of Hydrology-Water Resources and Hydraulic Engineering, Nanjing Hydraulic Research Institute, Nanjing, China
- 2School of Hydrology and Water Resources, Nanjing University of Information Science and Technology, Nanjing, China
Introduction: A design flood is a hypothetical flood used for the design of reservoirs and other hydrologic engineering infrastructures. Among many hydrological properties of a design flood, flood volume and peak can significantly affect the safety of reservoir operation. However, the uncertainty of flood volume and peak has rarely been considered in the risk analysis of reservoir operation regarding floodwater utilization.
Methods: In this paper, a general risk analysis framework that integrates the Monte Carlo sampling method and the most likely event selection method is proposed to calculate the risk of operating a single reservoir. By generating a large amount of stochastic bivariate flood data, the most likely design values were selected for a given return period. The probability of the maximum water level exceeding the current design flood level was calculated based on the simulation of flood control operation under various floodwater utilization schemes.
Results: The model is applied to the Shagou reservoir in the Shuhe River basin, China. The results show that the design flood volume and flood peak obtained by the bivariate joint return are 7.59% and 8.22% higher than those from univariate frequency analysis, respectively; the joint return period of bivariate design value spans from 10a to 1000a compared to the historical data; and the flood control risk at Shagou reservoir is 0.29 under current flood control operations based on the uncertainty of flood volume and peak.
Discussion: Moreover, the marginal benefit may contain floodwater utilization and a transmission risk effect between different node projects in the flood control system.
1 Introduction
With continuous economic development and population growth, the demand for water resources is becoming increasingly intense, and scarcity of water resources is among the major factors restricting social progress (Chen et al., 2016; Chang et al., 2017). To alleviate water resource shortages, various floodwater utilization models have been recently developed and demonstrated to be effective in many studies (Ding et al., 2017; Meng et al., 2018; Liu et al., 2019; Wang et al., 2019). According to the floodwater utilization concept (Wallington and Cai, 2020; Wang et al., 2020), floodwater utilization strategies can only be implemented if the risks are controlled within an acceptable range. As one of the major and effective engineering measures for floodwater utilization, reservoirs are built for multiple purposes, including flood control, water supply, and other functions. Moreover, floods are among the most frequent, widespread, and devastating natural disasters in the context of climate change and human activities (Wu et al., 2020); thus, flood control risks are particularly important for reservoir flood control operations. Therefore, the scientific assessment of flood control risk in floodwater utilization operations is important for flood management in reservoirs.
The risk analysis of floodwater utilization is a fundamental issue in flood management, engineering design, and area planning. Because the uncertainty factors lead to deviations between the calculated deterministic results and the actual occurrence and the risks involved in flood control decision making (Xiong and Qi, 2010; Delenne et al., 2012; Simonovic and Arunkumar, 2016; Ocio et al., 2017; Chen et al., 2019), various uncertainties have been discussed in the estimations of floodwater utilization in past years, including meteorological and hydrological forecast uncertainties, hydraulic uncertainties and human operation uncertainty (Melching, 1992; Cloke and Pappenberger, 2009; Dong, 2009; Diao and Wang, 2010; Wu et al., 2011; Kriauciuniene et al., 2013; Tung and Wong, 2014; Yan et al., 2014; Ocio et al., 2017). Due to significant concerns regarding design flood estimation under a specific return period for reservoir flood management, the study of its uncertainty has received much research attention from hydrologists (Parkes and Demeritt, 2016; Nakamura and Oki, 2018; Brunner and Sikorska-Senoner, 2019; Guo et al., 2020). Notably, design floods are generally defined by several features that are correlated with uncertainty (Dung et al., 2015; Daneshkhah et al., 2016; Guo et al., 2020), such as flood peak, flood volume, and regional flood composition. Hence, analysis of bivariate design floods characterized by correlated flood volumes and peaks reveals its advantage over traditional analysis of univariate design floods. In recent years, numerous frameworks have been developed to estimate uncertainties in bivariate design floods in various flood control systems (Zhang and Singh, 2007c; Yan et al., 2014; Fan et al., 2016; Ozga-Zielinski et al., 2016; Yin et al., 2018b; Xiong et al., 2019; Guo et al., 2020; Huang et al., 2020). The application of the copula-based methodology has been of growing interest in bivariate design floods. Various uncertainties in copula-based design flood estimation are discussed (Malekmohammadi et al., 2009; Serinaldi, 2013; Michailidi and Bacchi, 2017; Liu et al., 2018; Guan et al., 2022), including model uncertainty, parameter uncertainty, and sampling uncertainty. In particular, the sampling uncertainty of flood volume and peak is high in bivariate design floods, influencing the selection of model structure and parameters. The floodwater utilization approach is devised based on the analysis of flood control risk caused by various uncertainties. Analyzing the frequency curve of flood control reservoir capacity is necessary to balance risks and benefits considering the uncertainty of flood volume and peaks in the selection of floodwater utilization schemes.
However, to the best of our knowledge, there are few studies on the flood control risk of floodwater utilization from a sampling uncertainty perspective. More importantly, apart from a few papers, flood volume and peak and their impacts on flood control risk have not been systematically estimated in the literature. Towards this goal, here we propose an integrated model that employs the Monte Carlo sampling method and the most likely event selection method to estimate the probability of the maximum water level exceeding the current design flood level.
The remainder of this paper is structured as follows. Section 2 describes the Shagou reservoir of the Shuhe River in the Huaihe River Basin in China, which is chosen as the study domain. Section 3 introduces the research framework. Section 4 presents the computational process and the results. Section 5 discusses the impacts of flood control operations on flood control risk. Section 6 provides the conclusions of this study.
2 Case study
2.1 Study area
The Shagou reservoir is located upstream of the Shuhe River in the Huaihe River Basin in China, with a control basin area of 164 km2, as shown in Figure 1. The average annual precipitation is 745 mm, and flood season (from June to September) accounts for approximately 74% of the annual precipitation. In the current flood control operation, the flood-limited water level of the Shagou reservoir is 231.5 m, and the maximum control outflow is 500 m3/s under the given return period
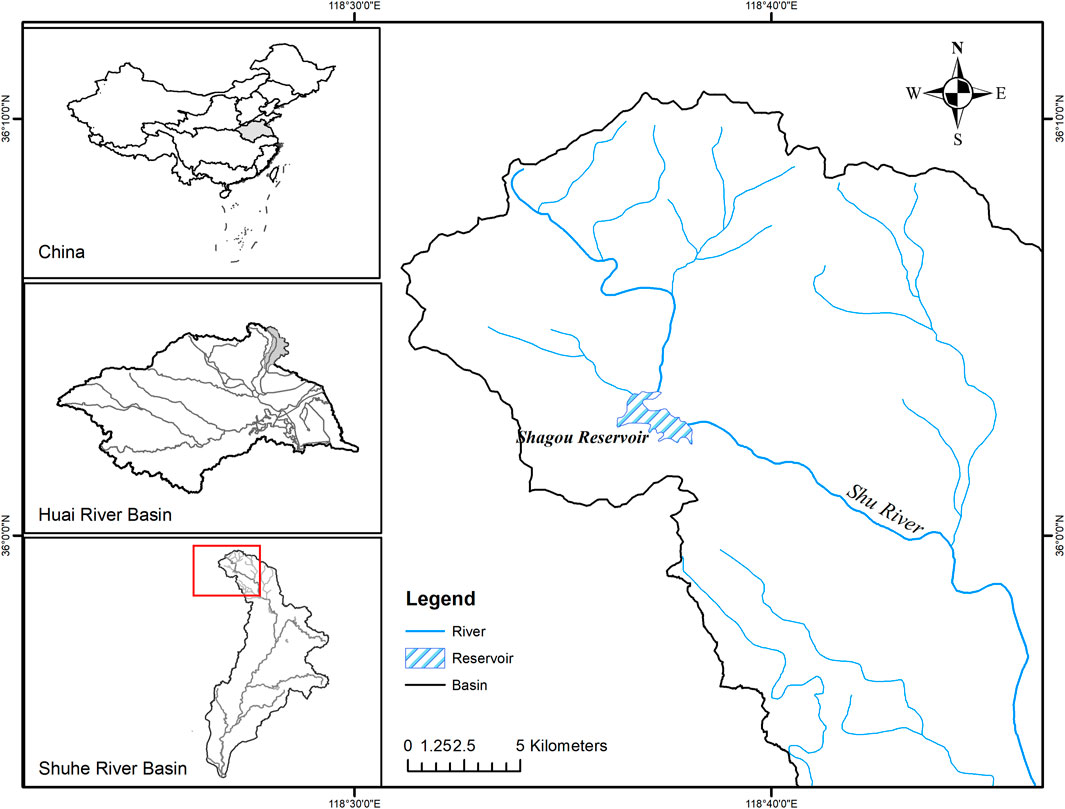
FIGURE 1. Sketch map of the Shagou reservoir in the Shu River basin, China.
2.2 Data
The annual maximum 72 h flood volume and corresponding flood peak observed in 1964–2013 are utilized to represent the flood characterization in the Shagou reservoir. The data are provided by the Yi-Shu-Si River Basin Administration, which is responsible for the unified management of major rivers (including the Shuhe River), lakes, hubs and other projects in the Yishusi Basin. The statistical results of flood volume and flood peak are shown in Table 1.
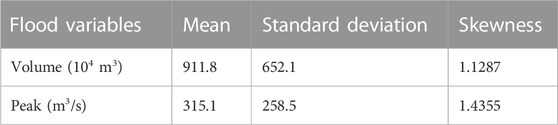
TABLE 1. Statistical features of flood variables from 1964 to 2013.
According to the statistics of historical flood data, the highest annual maximum flood volume is 3.115 m3⨯107 m3, which is approximately 3.5 times the multiyear average, and the lowest annual maximum is 70.4 m3⨯104 m3. Similarly, the highest annual maximum flood peak is 1,190 m3/s, which is approximately 3.7 times the multiyear average, and the lowest annual maximum is 3.92 m3/s. The annual flood change is dramatic, and floodwater utilization is necessary for local regional water management. When the range of flood volume is [2,070, 2,204] ⨯104 m3, the flood peak range is [315, 994] m3/s. Obvious uncertainty exists between flood volume and peak, which may have an adverse effect on flood control operation. Estimating the flood control risk caused by the flood volume and peak uncertainty in the Shagou reservoir is important for flood control operation decision making in floodwater utilization management.
3 Materials and methods
3.1 Joint distribution of flood variables based on copulas
Multivariate distribution construction using copulas has been well developed in the past years (Sklar, 1959; Shaked and Joe, 1998; Sancetta and Satchell, 2004). A bivariate joint distribution can be expressed by a copula function and its corresponding marginal distributions. A copula is a function that links two marginal distribution functions to construct a multivariate distribution function. Sklar’s theorem states that if
where
There are many classes of copula functions, such as Archimedean copulas, elliptical copulas and Plackett copulas (Plackett, 1965; Fang et al., 2002). Archimedean copulas are popular because they can be easily constructed and are capable of capturing a wide range of dependence structures with several desirable properties, such as symmetry and associativity (Nelson, 2006; Hofert, 2008). The widely used bivariate Archimedean family copulas include the Clayton Copula, Frank Copula, and Gumbel-Hougaard (GH) Copula, with a parameter
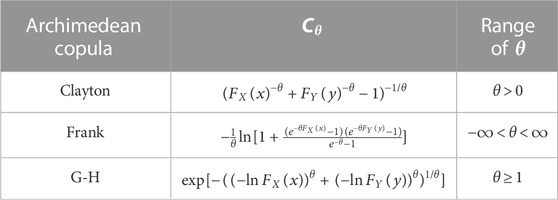
TABLE 2. Types of Clayton, Frank and GH copulas.
In current studies, root mean square error (RMSE) (Zhang and Singh, 2006), Akaike’s information criterion (AIC) (Zhang and Singh, 2007b) and Nash-Sutcliffe efficiency (
3.2 Joint return period
In conventional univariate analysis, the return period is usually used to represent the average time interval of a specific design flood, which is also a method used to measure the magnitude of floods. Within the copula-based framework, various definitions of the joint return period have been proposed, such as OR, AND, Kendall, dynamic, and structure-based return periods (Shiau, 2003; De Michele et al., 2005; Salvadori et al., 2011; Yin et al., 2018a). In this paper, the OR case (
where
3.3 Most-likely event selection
According to Eq. 2, in the bivariate case, infinite possible combinations of Q and W can be selected for a given joint return period
where
3.4 Flood control risk
Generally, the risk is simplified and defined as the probability of occurrence of a risk event (Sun et al., 2018; Li et al., 2022). In this paper, the flood control risk for the reservoir is defined as the probability of the highest level over the design flood level and can be expressed as follows:
where
3.5 General framework of risk estimation
In this research, the framework of estimating flood control risk with the flood uncertainty of flood volume and peak is proposed based on the Monte Carlo sampling method and the most likely event selection method. It can be divided into three steps, which are shown in Figure 2.
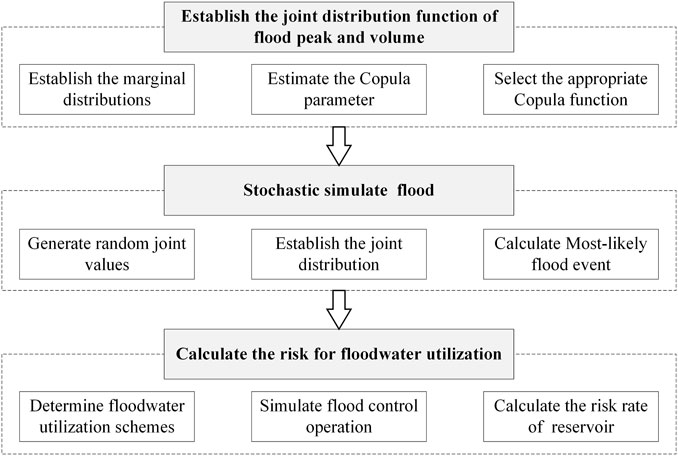
FIGURE 2. Flowchart of the proposed framework.
Step 1: Establish the joint distribution function. Based on the observed flood volume and peak data with k-samples, the marginal distributions
Step 2: Stochastic simulation of the flood. Based on the multilevel Monte Carlo method (Giles, 2008; Brodie, 2013; Clare et al., 2022),
Step 3: Calculate the risk. According to the engineering and hydrological characteristics, various design floodwater utilization schemes have been developed. The design flood hydrograph can be obtained by
4 Results
4.1 Parameter estimation for the marginal distributions
In this paper, the Pearson type III (P-III) distribution, which is recommended by the Chinese Ministry of Water Resources (Wang et al., 2015; Peng et al., 2017; Gao et al., 2018), was employed to obtain the single marginal distribution of flood volume and flood peak. The parameters of the P-III distribution were estimated by the moment method (Hosking, 1990) and are shown in Table 3. The K-S test (
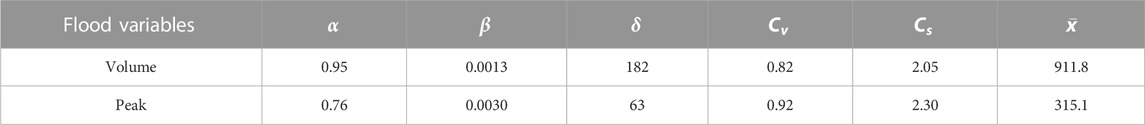
TABLE 3. Parameters of P-III in flood volume and peak.
4.2 Joint distribution function based on the copula function
For the flood data, Clayton, Frank and G-H Copula were used to establish the joint distribution. RMSE, AIC and
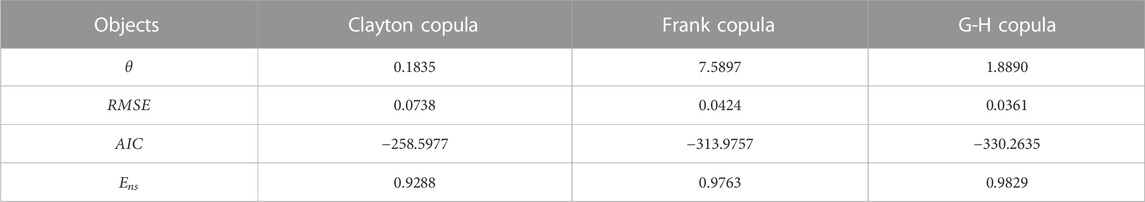
TABLE 4. Results of copula parameter and goodness of fit.
4.3 Most-likely design values
According to the bivariate joint distribution of historical flood data, the most likely method was employed to obtain the bivariate flood volume and peak for a given joint return period
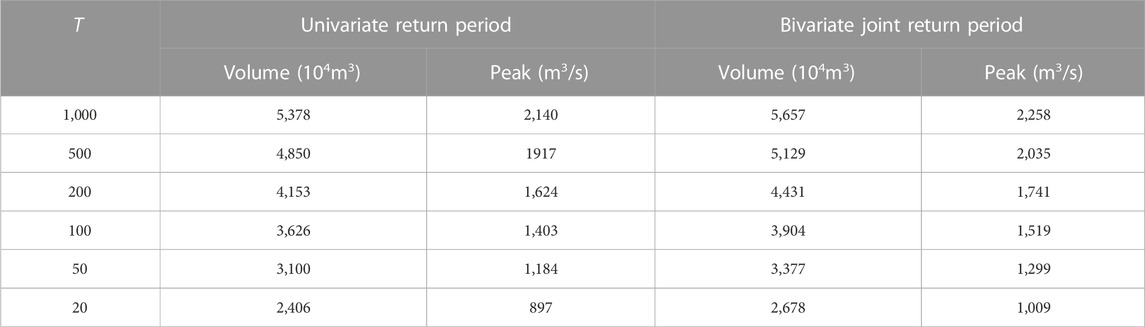
TABLE 5. Design flood values under different return periods.
The results show that the flood volume and peak obtained by the bivariate joint return for a given joint return period
4.4 Stochastic flood simulation
Based on the joint distribution function of flood volume and peak, the multilevel Monte Carlo method was employed to generate bivariate design data. Considering the number of historical flood data, 50 samples are randomly generated in each set. In the same way, the joint distribution was constructed, and the most likely design values were obtained. The number of stochastic simulation sets is 10,000 in this paper and the design flood values based on the stochastically simulated flood for given
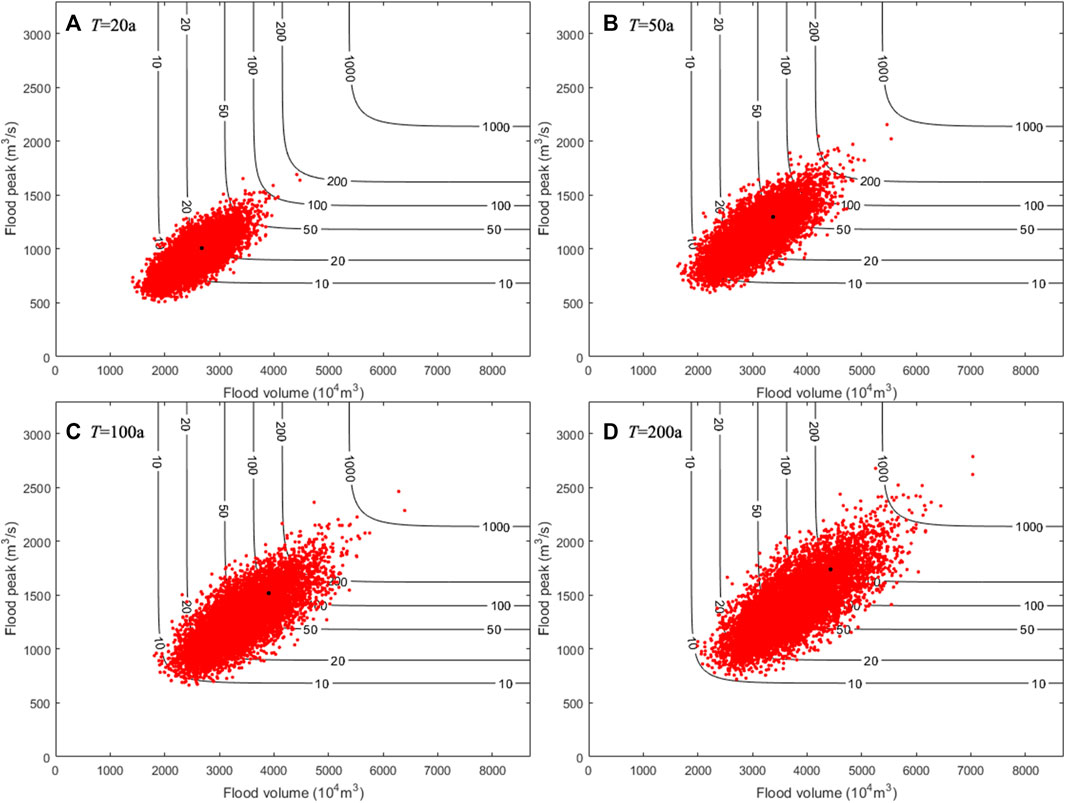
FIGURE 3. Design flood values under different stochastic simulations (the black point indicates that the value was obtained by historical data): (A) T = 20a; (B) T =50a; (C) T =100a; (D) T=200a.
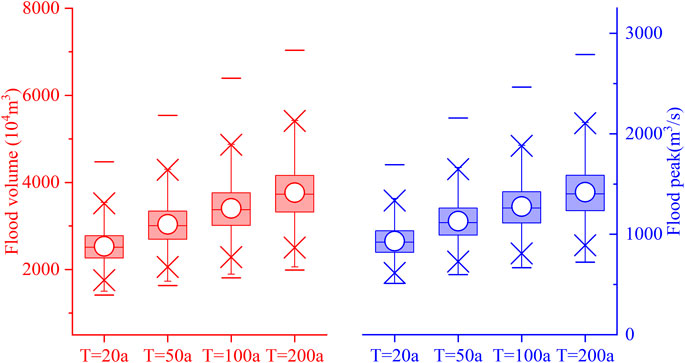
FIGURE 4. Box-plots of bivariate design data under different bivariate joint return periods.
The results reveal that the generated design flood values are scattered around the most likely design value calculated based on historical flood data. As the bivariate joint return period increases, the generated design values also increase. For the
4.5 Flood control risk of reservoir
As mentioned in Section 2.1, the Shagou reservoir was designed with the standard T=100a, and the corresponding design flood water level is 233.13 m, which was obtained by univariate flood volume frequency analysis. In the current scheduling rules, the water level is limited to 231.5 m in the flood season. The essence of floodwater utilization is transferring more floodwater into ordinary water resources in the flood season for use in the non-flood season, where the flood-limited water level plays an important role. In recent years, numerous studies have been carried out to scientifically raise the flood-limited water level in the flood season without decreasing flood control standards or damaging the ecological environment of rivers (Li et al., 2010; Liu et al., 2015; Chang et al., 2017; Xie et al., 2018; Ye et al., 2019; Wang et al., 2020). In this paper, according to the current operation, the flood-limited water level is designed to be from 231.5 m to 232.0 m with an interval of 0.1 m to indicate various floodwater utilization schemes.
The flood in August 1974 was selected as a typical flood, and various flood hydrographs were obtained by using the design bivariate design value in Section 4.4. By simulating the current flood control operation, the maximum water level (
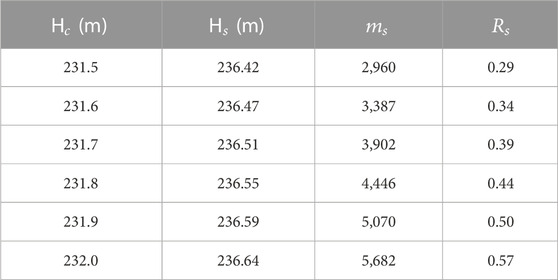
TABLE 6. Flood control risk statistics under different flood-limited water levels.
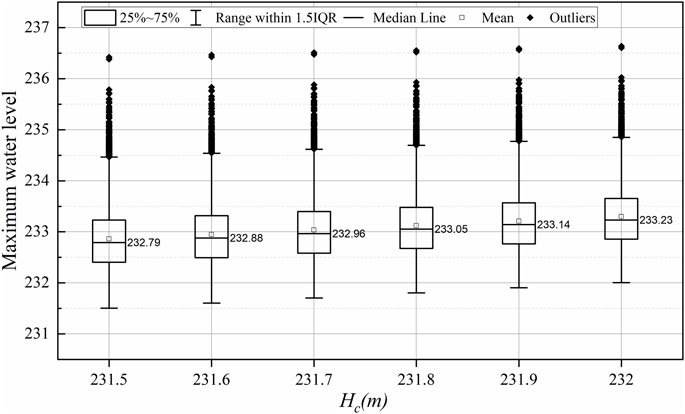
FIGURE 5. Statistical results of the maximum water level under various flood-limited water levels.
In the flood control operation of a reservoir, the flood-limited water level is considered to be the initial water level in a flooding process. With the initial water level rise, the maximum water level in the flood control operation process will also increase accordingly. According to the statistical results, the averages of the maximum water levels are all less than the design water level of 233.13 m under flood utilization with flood-limited water levels of 231.5, 231.6, 231.7 and 231.8 m. With the increase in flood-limited water level, the counts of the maximum water level exceeding the current design water level similarly increased. When the flood-limited water level increased from 231.5 m to 232,
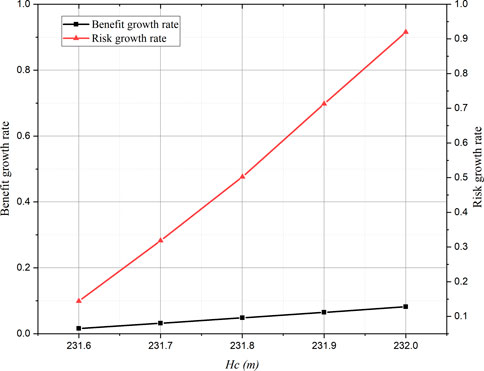
FIGURE 6. Increased water resources and flood control risk under various floodwater utilization schemes.
The results reveal that different increased rates occurred between benefit and risk with the same increased flood-limited water level. In particular, the growth rates of benefit and risk are 0.08% and 91% with
5 Discussion
Flood control operations have a certain impact on reservoir flood control risk. As an important indicator of flood control operation, the maximum control outflow (

TABLE 7. Flood control risk under different maximum control outflows.
In flood operations, with the increase in the maximum control outflow of the reservoir, more floods are released downstream. For the upstream reservoir, the less flood control storage is needed, the lower the flood control risk is in flood control operation. In this paper, the maximum control outflow has a strong impact on flood control risk. In particular, with the maximum control outflow increasing to 550 from 500 m3/s, the reduction in flood control risk will be 48%. In the field of floodwater utilization, many studies aim at risk decision-making for transforming some amount of floodwater into ordinary water resources without decreasing flood control standards (Li et al., 2010; Ye et al., 2019; Wang et al., 2022). The reduction of flood control risk is favorable for floodwater utilization, however, the flood control risk of the upstream reservoir affects the flood control risk of the downstream reservoir through changes in discharge control. In the flood control system, there is a risk transmission effect in different flood control projects.
6 Conclusion
Considering the influence of the uncertainty of flood volume and peak, the estimation of flood control risk is discussed in this paper. Taking the reservoir as the study object, the Monte Carlo sampling method and the most likely event selection method were employed to develop a general framework and then applied to the Shagou reservoir in the Shuhe River basin, China. The main conclusions can be summarized as follows:
(1) The proposed framework can estimate the flood control risk considering the uncertainty of flood volume and peak. For flood control risk with an uncertain distribution of random variables, the stochastic simulation has certain advantages. At present, the framework can be used with a single reservoir in the flood control risk of flood control systems. The calculation of flood control risk under cascade reservoirs and parallel reservoirs will continue to be studied in future work.
(2) The application of the framework to the Shagou reservoir in the Shuhe River basin showed that the flood control risk caused by the uncertainty of flood volume and peak is 0.29, which indicates that the design value obtained by the bivariate joint return is much greater than the value from univariate frequency analysis. Multivariable flood events can be described more reasonably and may provide a new theoretical basis for flood control operations.
(3) The flood control risk and the benefit of floodwater utilization increased with the rising flood-limited water level, and different rate increases occurred between the benefit and risk. The marginal benefit may be in floodwater utilization. The flood operation function, such as different maximum control outflows, also has a considerable impact on the flood control risk and may play an important role in floodwater utilization. The transmission effect of flood control risk is not quantitatively evaluated, which will be improved in future research.
Data availability statement
The raw data supporting the conclusion of this article will be made available by the authors, without undue reservation.
Author contributions
HD: conceptualization, methodology, writing original, and resources. ZW: review and editing, investigation, and resources. JY: review and provided advice for analyzing the data and figures. All authors contributed to the article and approved the submitted version.
Funding
This research was supported by the Natural Science Foundation of Jiangsu Province of China (No. BK20211023).
Conflict of interest
The authors declare that the research was conducted in the absence of any commercial or financial relationships that could be construed as a potential conflict of interest.
Publisher’s note
All claims expressed in this article are solely those of the authors and do not necessarily represent those of their affiliated organizations, or those of the publisher, the editors and the reviewers. Any product that may be evaluated in this article, or claim that may be made by its manufacturer, is not guaranteed or endorsed by the publisher.
References
Brodie, I. M. (2013). Rational Monte Carlo method for flood frequency analysis in urban catchments. J. Hydrol. 486, 306–314. doi:10.1016/j.jhydrol.2013.01.039
Brunner, M. I., and Sikorska-Senoner, A. E. (2019). Dependence of flood peaks and volumes in modeled discharge time series: Effect of different uncertainty sources. J. Hydrol. 572, 620–629. doi:10.1016/j.jhydrol.2019.03.024
Chang, J., Guo, A., Du, H., and Wang, Y. (2017). Floodwater utilization for cascade reservoirs based on dynamic control of seasonal flood control limit levels. Environ. Earth Sci. 76, 260. doi:10.1007/s12665-017-6522-z
Chen, J., Shi, H., Sivakumar, B., and Peart, M. R. (2016). Population, water, food, energy and dams. Renew. Sustain. Energy Rev. 56, 18–28. doi:10.1016/j.rser.2015.11.043
Chen, J., Zhong, P.-A., An, R., Zhu, F., and Xu, B. (2019). Risk analysis for real-time flood control operation of a multi-reservoir system using a dynamic Bayesian network. Environ. Model. Softw. 111, 409–420. doi:10.1016/j.envsoft.2018.10.007
Clare, M. C. A., Piggott, M. D., and Cotter, C. J. (2022). Assessing erosion and flood risk in the coastal zone through the application of multilevel Monte Carlo methods. Coast. Eng. 174, 104118. doi:10.1016/j.coastaleng.2022.104118
Cloke, H. L., and Pappenberger, F. (2009). Ensemble flood forecasting: A review. J. Hydrol. 375, 613–626. doi:10.1016/j.jhydrol.2009.06.005
Daneshkhah, A., Remesan, R., Chatrabgoun, O., and Holman, I. P. (2016). Probabilistic modeling of flood characterizations with parametric and minimum information pair-copula model. J. Hydrol. 540, 469–487. doi:10.1016/j.jhydrol.2016.06.044
De Michele, C., Salvadori, G., Canossi, M., Petaccia, A., and Rosso, R. (2005). Bivariate statistical approach to check adequacy of dam spillway. J. Hydrol. Eng. 10, 50–57. doi:10.1061/(asce)1084-0699(2005)10:1(50)
Delenne, C., Cappelaere, B., and Guinot, V. (2012). Uncertainty analysis of river flooding and dam failure risks using local sensitivity computations. Reliab. Eng. Syst. Saf. 107, 171–183. doi:10.1016/j.ress.2012.04.007
Diao, Y., and Wang, B. (2010). Risk analysis of flood control operation mode with forecast information based on a combination of risk sources. Sci. China-technological Sci. 53, 1949–1956. doi:10.1007/s11431-010-3124-3
Ding, W., Zhang, C., Cai, X., Li, Y., and Zhou, H. (2017). Multiobjective hedging rules for flood water conservation. Water Resour. Res. 53, 1963–1981. doi:10.1002/2016WR019452
Ding, W., Zhang, C., Peng, Y., Zeng, R., Zhou, H., and Cai, X. (2015). An analytical framework for flood water conservation considering forecast uncertainty and acceptable risk. Water Resour. Res. 51, 4702–4726. doi:10.1002/2015WR017127
Dong, W. (2009). Rethinking risk analysis: The risks of risk analysis in water issues as the case. Hum. Ecol. Risk Assess. Int. J. 15, 1079–1083. doi:10.1080/10807030903304690
Du, H., Wang, Y., Liu, K., and Cheng, L. (2019). Exceedance probability of precipitation for the Shuhe to futuan water transfer project in China. Environ. Earth Sci. 78, 240. doi:10.1007/s12665-019-8207-2
Dung, N. V., Merz, B., Bárdossy, A., and Apel, H. (2015). Handling uncertainty in bivariate quantile estimation – an application to flood hazard analysis in the Mekong Delta. J. Hydrol. 527, 704–717. doi:10.1016/j.jhydrol.2015.05.033
Fan, Y. R., Huang, W. W., Huang, G. H., Li, Y. P., Huang, K., and Li, Z. (2016). Hydrologic risk analysis in the Yangtze River basin through coupling Gaussian mixtures into copulas. Adv. Water Resour. 88, 170–185. doi:10.1016/j.advwatres.2015.12.017
Fang, H.-B., Fang, K.-T., and Kotz, S. (2002). The meta-elliptical distributions with given marginals. J. Multivar. Anal. 82, 1–16. doi:10.1006/jmva.2001.2017
Gao, S., Liu, P., Pan, Z., Ming, B., Guo, S., Cheng, L., et al. (2018). Incorporating reservoir impacts into flood frequency distribution functions. J. Hydrol. 568, 234–246. doi:10.1016/j.jhydrol.2018.10.061
Giles, M. B. (2008). Multilevel Monte Carlo path simulation. Oper. Res. 56, 607–617. doi:10.1287/opre.1070.0496
Gräler, B., van den Berg, M. J., Vandenberghe, S., Petroselli, A., Grimaldi, S., De Baets, B., et al. (2013). Multivariate return periods in hydrology: A critical and practical review focusing on synthetic design hydrograph estimation. Hydrol. Earth Syst. Sci. 17, 1281–1296. doi:10.5194/hess-17-1281-2013
Gringorten, I. I. (1963). A plotting rule for extreme probability paper. J. Geophys. Res. 68, 813–814. doi:10.1029/jz068i003p00813
Guan, X., Xia, C., Xu, H., Liang, Q., Ma, C., and Xu, S. (2022). Flood risk analysis integrating of Bayesian-based time-varying model and expected annual damage considering non-stationarity and uncertainty in the coastal city. J. Hydrol. 617, 129038. doi:10.1016/j.jhydrol.2022.129038
Guo, A., Chang, J., Wang, Y., Huang, Q., and Li, Y. (2020). Uncertainty quantification and propagation in bivariate design flood estimation using a Bayesian information-theoretic approach. J. Hydrol. 584, 124677. doi:10.1016/j.jhydrol.2020.124677
Guo, S., Muhammad, R., Liu, Z., Xiong, F., and Yin, J. (2018). Design flood estimation methods for cascade reservoirs based on copulas. Water 10, 560. doi:10.3390/w10050560
Hofert, M. (2008). Sampling archimedean copulas. Comput. Stat. Data Anal. 52, 5163–5174. doi:10.1016/j.csda.2008.05.019
Hosking, J. (1990). L-Moments: Analysis and estimation of distributions using linear combinations of order statistics. J. R. Stat. Soc. Ser. B 52, 105–124. doi:10.1111/j.2517-6161.1990.tb01775.x
Huang, Y., Liang, Z., Hu, Y., Li, B., and Wang, J. (2020). Theoretical derivation for the exceedance probability of corresponding flood volume of the equivalent frequency regional composition method in hydrology. Hydrol. Res. 51, 1274–1292. doi:10.2166/nh.2020.027
Kriauciuniene, J., Jakimavicius, D., Sarauskiene, D., and Kaliatka, T. (2013). Estimation of uncertainty sources in the projections of Lithuanian river runoff. Stoch. Environ. Res. Risk Assess. 27, 769–784. doi:10.1007/s00477-012-0608-7
Li, J., Zhong, P., Wang, Y., Yang, M., Fu, J., Liu, W., et al. (2022). Risk analysis for the multi-reservoir flood control operation considering model structure and hydrological uncertainties. J. Hydrol. 612, 128263. doi:10.1016/j.jhydrol.2022.128263
Li, X., Guo, S., Liu, P., and Chen, G. (2010). Dynamic control of flood limited water level for reservoir operation by considering inflow uncertainty. J. Hydrol. 391, 124–132. doi:10.1016/j.jhydrol.2010.07.011
Liu, K., Wang, Z., Cheng, L., Zhang, L., Du, H., and Tan, L. (2019). Optimal operation of interbasin water transfer multireservoir systems: An empirical analysis from China. Environ. Earth Sci. 78, 238. doi:10.1007/s12665-019-8242-z
Liu, P., Li, L., Guo, S., Xiong, L., Zhang, W., Zhang, J., et al. (2015). Optimal design of seasonal flood limited water levels and its application for the Three Gorges Reservoir. J. Hydrol. 527, 1045–1053. doi:10.1016/j.jhydrol.2015.05.055
Liu, Z., Xu, X., Cheng, J., Wen, T., and Niu, J. (2018). Hydrological risk analysis of dam overtopping using bivariate statistical approach: A case study from geheyan reservoir, China. Stoch. Environ. Res. Risk Assess. 32, 2515–2525. doi:10.1007/s00477-018-1550-0
Malekmohammadi, B., Kerachian, R., and Zahraie, B. (2009). Developing monthly operating rules for a cascade system of reservoirs: Application of Bayesian Networks. Environ. Model. Softw. 24, 1420–1432. doi:10.1016/j.envsoft.2009.06.008
Melching, C. S. (1992). An improved first-order reliability approach for assessing uncertainties in hydrologic modeling. J. Hydrol. 132, 157–177. doi:10.1016/0022-1694(92)90177-W
Meng, X., Chang, J., Wang, X., and Wang, Y. (2018). Multi-objective hydropower station operation using an improved cuckoo search algorithm. Energy 168, 425–439. doi:10.1016/j.energy.2018.11.096
Michailidi, E. M., and Bacchi, B. (2017). Dealing with uncertainty in the probability of overtopping of a flood mitigation dam. Hydrol. Earth Syst. Sci. 21, 2497–2507. doi:10.5194/hess-21-2497-2017
Moridi, A., and Yazdi, J. (2017). Optimal allocation of flood control capacity for multi-reservoir systems using multi-objective optimization approach. Water Resour. Manag. 31, 4521–4538. doi:10.1007/s11269-017-1763-x
Nakamura, S., and Oki, T. (2018). Paradigm shifts on flood risk management in Japan: Detecting triggers of design flood revisions in the modern era. Water Resour. Res. 54, 5504–5515. doi:10.1029/2017WR022509
Ocio, D., Le Vine, N., Westerberg, I., Pappenberger, F., and Buytaert, W. (2017). The role of rating curve uncertainty in real-time flood forecasting. Water Resour. Res. 53, 4197–4213. doi:10.1002/2016WR020225
Ozga-Zielinski, B., Ciupak, M., Adamowski, J., Khalil, B., and Malard, J. (2016). Snow-melt flood frequency analysis by means of copula based 2D probability distributions for the Narew River in Poland. J. Hydrol. Reg. Stud. 6, 26–51. doi:10.1016/j.ejrh.2016.02.001
Parkes, B., and Demeritt, D. (2016). Defining the hundred year flood: A bayesian approach for using historic data to reduce uncertainty in flood frequency estimates. J. Hydrol. 540, 1189–1208. doi:10.1016/j.jhydrol.2016.07.025
Peng, Y., Chen, K., Yan, H., and Yu, X. (2017). Improving flood-risk analysis for confluence flooding control downstream using copula Monte Carlo method. J. Hydrol. Eng. 22, 04017018. doi:10.1061/(ASCE)HE.1943-5584.0001526
Plackett, R. L. (1965). A class of bivariate distributions. J. Am. Stat. Assoc. 60, 516–522. doi:10.1080/01621459.1965.10480807
Salvadori, G., De Michele, C., and Durante, F. (2011). On the return period and design in a multivariate framework. Hydrol. Earth Syst. Sci. 15, 3293–3305. doi:10.5194/hess-15-3293-2011
Sancetta, A., and Satchell, S. (2004). The bernstein copula and its applications to modeling and approximations of multivariate distributions. Econom. Theory 20, 535–562. doi:10.1017/s026646660420305x
Serinaldi, F. (2013). An uncertain journey around the tails of multivariate hydrological distributions. Water Resour. Res. 49, 6527–6547. doi:10.1002/wrcr.20531
Shaked, M., and Joe, H. (1998). Multivariate models and dependence concepts. J. Am. Stat. Assoc. 93, 1237. doi:10.2307/2669872
Shiau, J. T. (2003). Return period of bivariate distributed extreme hydrological events. Stoch. Environ. Res. Risk Assess. 17, 42–57. doi:10.1007/s00477-003-0125-9
Simonovic, S. P., and Arunkumar, R. (2016). Comparison of static and dynamic resilience for a multipurpose reservoir operation. Water Resour. Res. 52, 8630–8649. doi:10.1002/2016WR019551
Sklar, A. (1959). Fonctions de répartition à n dimensions et leurs marges. Publ. Inst. Stat. Univ. Paris 8, 229–231. doi:10.1007/978-3-642-33590-7
Sraj, M., Bezak, N., and Brilly, M. (2015). Bivariate flood frequency analysis using the copula function: A case study of the litija station on the sava river. Hydrol. Process. 29, 225–238. doi:10.1002/hyp.10145
Strupczewski, W. G., Singh, V. P., and Feluch, W. (2001). Non-stationary approach to at-site flood frequency modelling I. Maximum likelihood estimation. J. Hydrol. 248, 123–142. doi:10.1016/S0022-1694(01)00397-3
Sun, Y., Zhu, F., Chen, J., and Li, J. (2018). Risk analysis for reservoir real-time optimal operation using the scenario tree-based stochastic optimization method. Water 10, 606. doi:10.3390/w10050606
Tung, Y., and Wong, C. (2014). Assessment of design rainfall uncertainty for hydrologic engineering applications in Hong Kong. Stoch. Environ. Res. Risk Assess. 28, 583–592. doi:10.1007/s00477-013-0774-2
Wallington, K., and Cai, X. (2020). Feedback between reservoir operation and floodplain development: Implications for reservoir benefits and beneficiaries. Water Resour. Res. 56. doi:10.1029/2019WR026610
Wang, J., Liang, Z., Hu, Y., and Wang, D. (2015). Modified weighted function method with the incorporation of historical floods into systematic sample for parameter estimation of Pearson type three distribution. J. Hydrol. 527, 958–966. doi:10.1016/j.jhydrol.2015.05.023
Wang, K., Wang, Z., Liu, K., Du, H., Mo, Y., Wang, M., et al. (2022). Assessing the floodwater utilization potential in a reservoir-controlled watershed: A novel method considering engineering regulations and an empirical case from China. Ecol. Inf. 68, 101581. doi:10.1016/j.ecoinf.2022.101581
Wang, Z., Wang, K., Liu, K., Cheng, L., Wang, L., and Ye, A. (2019). Interactions between lake-level fluctuations and waterlogging disasters around a large-scale shallow lake: An empirical analysis from China. Water 11, 318. doi:10.3390/w11020318
Wang, Z., Zhang, L., Cheng, L., Liu, K., Ye, A., and Cai, X. (2020). Optimizing operating rules for a reservoir system in northern China considering ecological flow requirements and water use priorities. J. Water Resour. Plan. Manag. 146. doi:10.1061/(ASCE)WR.1943-5452.0001236
Wu, S.-J., Yang, J.-C., and Tung, Y.-K. (2011). Risk analysis for flood-control structure under consideration of uncertainties in design flood. Nat. Hazards 58, 117–140. doi:10.1007/s11069-010-9653-z
Wu, Z., Shen, Y., Wang, H., and Wu, M. (2020). Urban flood disaster risk evaluation based on ontology and Bayesian Network. J. Hydrol. 583, 124596. doi:10.1016/j.jhydrol.2020.124596
Xie, A., Liu, P., Guo, S., Zhang, X., Jiang, H., and Yang, G. (2018). Optimal design of seasonal flood limited water levels by jointing operation of the reservoir and floodplains. Water Resour. Manag. 32, 179–193. doi:10.1007/s11269-017-1802-7
Xiong, F., Guo, S., Liu, P., Xu, C.-Y., Zhong, Y., Yin, J., et al. (2019). A general framework of design flood estimation for cascade reservoirs in operation period. J. Hydrol. 577, 124003. doi:10.1016/j.jhydrol.2019.124003
Xiong, F., Guo, S., Yin, J., Tian, J., and Rizwan, M. (2020). Comparative study of flood regional composition methods for design flood estimation in cascade reservoir system. J. Hydrol. 590, 125530. doi:10.1016/j.jhydrol.2020.125530
Xiong, W., and Qi, H. (2010). “A extended TOPSIS method for the stochastic multi-criteria decision making problem through interval estimation,” in 2010 2nd International Workshop on Intelligent Systems and Applications, China, 22-23 May 2010.
Xu, P., Wang, D., Singh, V. P., Wang, Y., Wu, J., Wang, L., et al. (2017). A two-phase copula entropy-based multiobjective optimization approach to hydrometeorological gauge network design. J. Hydrol. 555, 228–241. doi:10.1016/j.jhydrol.2017.09.046
Yan, B., Guo, S., and Chen, L. (2014). Estimation of reservoir flood control operation risks with considering inflow forecasting errors. Stoch. Environ. Res. Risk Assess. 28, 359–368. doi:10.1007/s00477-013-0756-4
Ye, A., Wang, Z., Zhang, L., Wang, L., and Wang, K. (2019). Assessment approach to the floodwater utilization potential of a basin and an empirical analysis from China. Environ. Earth Sci. 78, 52. doi:10.1007/s12665-019-8050-5
Yin, J., Guo, S., He, S., Guo, J., Hong, X., and Liu, Z. (2018a). A copula-based analysis of projected climate changes to bivariate flood quantiles. J. Hydrol. 566, 23–42. doi:10.1016/j.jhydrol.2018.08.053
Yin, J., Guo, S., Liu, Z., Yang, G., Zhong, Y., and Liu, D. (2018b). Uncertainty analysis of bivariate design flood estimation and its impacts on reservoir routing. Water Resour. Manag. 32, 1795–1809. doi:10.1007/s11269-018-1904-x
Zhang, L., and Singh, V. P. (2006). Bivariate flood frequency analysis using the copula method. J. Hydrol. Eng. 11, 150–164. doi:10.1061/(asce)1084-0699(2006)11:2(150)
Zhang, L., and Singh, V. P. (2007a). Bivariate rainfall frequency distributions using Archimedean copulas. J. Hydrol. 332, 93–109. doi:10.1016/j.jhydrol.2006.06.033
Zhang, L., and Singh, V. P. (2007b). Gumbel–hougaard copula for trivariate rainfall frequency analysis. J. Hydrol. Eng. 12, 409–419. doi:10.1061/(asce)1084-0699(2007)12:4(409)
Zhang, L., and Singh, V. P. (2007c). Trivariate flood frequency analysis using the gumbel–hougaard copula. J. Hydrol. Eng. 12, 431–439. doi:10.1061/(asce)1084-0699(2007)12:4(431)
Keywords: flood control risk, uncertainty of flood volume and peak, floodwater utilization, Shagou reservoir, stochastic simulation
Citation: Du H, Wang Z and Yin J (2023) Analysis of flood control risk in floodwater utilization considering the uncertainty of flood volume and peak. Front. Earth Sci. 11:1196903. doi: 10.3389/feart.2023.1196903
Received: 30 March 2023; Accepted: 02 May 2023;
Published: 18 May 2023.
Edited by:
Xihui Gu, China University of Geosciences Wuhan, ChinaReviewed by:
Keke Fan, Henan Agricultural University, ChinaDongdong Kong, China University of Geosciences Wuhan, China
Copyright © 2023 Du, Wang and Yin. This is an open-access article distributed under the terms of the Creative Commons Attribution License (CC BY). The use, distribution or reproduction in other forums is permitted, provided the original author(s) and the copyright owner(s) are credited and that the original publication in this journal is cited, in accordance with accepted academic practice. No use, distribution or reproduction is permitted which does not comply with these terms.
*Correspondence: Zongzhi Wang, d2FuZ3p6NzdAMTYzLmNvbQ==