- 1Mechanical Systems Engineering Department, Faculty of Industrial Engineering, Robotics and Production Management, Technical University of Cluj-Napoca, Cluj-Napoca, Romania
- 2Micro-Nano Systems Laboratory, Technical University of Cluj-Napoca, Cluj-Napoca, Romania
The study shows the findings of a microscopic examination of samples of filtered water obtained using five different types of filters. The novelty of the approach to the research carried out in this paper consisted in using of a statistical mathematical model that confers increased accuracy on the resulting values, with the aim of characterizing the efficiency and quality of drinking water filters intended for the general public for domestic consumption at the national level. Atomic force microscopy was used to carry out the analysis, and particular mathematical models were used to statistically evaluate the findings. The paper explains the methodology used, including details on the laboratory setup, the steps finished, and the tools used to accomplish the suggested goals. With an emphasis on the three dimensions of the particles—height, diameter, and arithmetic roughness—the findings from the microscopic analysis of the particle deposits on the filtered water samples are given and tabular indexed. As a result, it was feasible to use a computational mathematical model to identify the statistical indicators of the values recorded in the samples that underwent microscopical analysis. Following the application of the mathematical model, the findings were centralized, and their correlation was analyzed using graphical representations. The results led to the concrete identification of the impurity degree of drinking water filtered by consumer means.
1 Introduction
Water is one of the most important substances on Earth, and it plays a crucial role in sustaining all forms of life. Besides its agricultural and industrial uses, environmental importance and recreational role, water is an essential resource in sustaining life for all inhabitants on our planet, therefore a special attention should be given to water resources and their management (Marcal et al., 2021). No one can deny the water’s crucial role in ensuring good health for humans if it is characterized by high quality, one of the largest studies in drinking water epidemiology indicating a protective effect of magnesium from for the risk of mortality to coronary heart disease and an increased risk of mortality due to cardiovascular disease associated with the concentration of calcium and the water hardness in drinking water (Houthuijs et al., 2022).
Obviously, there are several sources of drinking water such as surface water, ground water, bottled water, but most citizens in developed country use the public water distribution networks, therefore, a lot of the researcher’s recent efforts have been concentrated on establishing drinking water quality in different areas. Several factors or combination of factors such as chemical contaminants, microbial contaminants, sediments, temperature, nutrients level or pH, are taken into consideration when drinking water quality is analyzed (Petculescu et al., 2022; Prety Debnath et al., 2022; Villanueva et al., 2023; Zhang et al., 2023). The subject presents interest, not only to researchers, but also to the European Union who has issued a new directive on the quality of water intended for human consumption (Dettori et al., 2022) and to environmental protection agency from USA that presents point-of-use (e.g., reverse osmosis, active carbon filter, etc.) and point-of-entry (e.g., water softeners, disinfection systems, etc.) treatment systems that can be adopted in small community water systems (USEPA, 2006).
Statistical analysis is known be a powerful tool to help consumers make informed decisions based on data and has been widely used in many fields. Several statistical approaches have been considered for water quality with respect to different influencing factors, even a software has been developed for the statistical analysis of water quality (Lee and Helsel, 2005). A wide scale study has been conducted on European surface waters, tap water, bottled water and on Norwegian crystalline bedrock groundwater, study in which simple tools were used to investigate the hydro-chemical data, utilizing the absolute data, as well as, the log-ratio transformed data and the results were presented using graphical statistics (Flem et al., 2018). Smaller scale studies regarding water quality characterization and assessment were carried out using water quality index and multivariate statistical methods in smaller areas from Ethiopia (considering the hydro-chemical data) (Mohamed et al., 2022) or Ghana (considering the physical, microbiological and chemical properties) (Amuah et al., 2021).
Water quality is also reflected by its price in most cases. There are studies such as (Johnstone and Serret, 2012) or (Vásquez et al., 2009) that have indicated that consumers are willing to pay more for improved water quality because people tend to be more cautious when important topics are addressed such as water quality. For example, the relationship between the quality of the drinking water entering the household and its price was studied in (Janusz and Katarzyna, 2019; Kaur and Janmaat, 2023) using a household production function approach, while in (Janusz and Katarzyna, 2019) the quality filtration–price ratio was taken into account when analyzing different filters in order to help the consumer make an informed decision.
In Romania and other developing countries, even if, the public companies responsible for providing drinking water have ensured a law-abiding degree of drinking-water quality at the treatment plant or at the distribution point, the quality of the water reaching the point-of-use is often much lower. This is explained the condition, material, and age of the pipes from the public water distribution network. Because replacing them would imply significant costs as well as disruptions in supplying drinking water to the general population, only local, occasional, and small-scale interventions and updates are made to the public water distribution network. Therefore, the individuals who are health concerned and environmentally aware choose to pay more by purchasing and installing point-of-use treatment systems, such as filters, instead of using regular tap water or PET bottled water. Usually, they choose a filter based on criteria such as price, manufacturing company, or marketing claims because there is no statistical data available regarding the filtered water using a filter.
Considering the above-mentioned aspects, the aim of this paper was, on one hand, to further extend the research regarding the quality filtration provided by a series of household filters available on the consumer market (Crișan et al., 2022). This research extension is focused on the investigation of several samples of filtered water using the atomic force microscopy and on the statistical interpretation of the obtained data with respect to criteria such as roughness or height of the deposited particles.
On the other hand, due to the importance of the addressed topic, water quality (Varol, 2020; da Luz and Kumpel, 2020; Cui et al., 2020; Wang and Zhu, 2021; Katarzyna and Janusz, 2020), and its direct influence on household consumers’ health, as well as, to the fact that the chosen types of filters are widely used and can be purchased from the national network of stores, scientific structured data, statistically interpreted, such as the one encompassed in this research should be made available to the public, in order to provide the interested consumers with the required information to truly achieve a high-quality level of drinking water in their own household (Ma et al., 2022; Khan and Sheikh, 2023; Larson et al., 2023).
Based on the analysis of the studies and research currently published regarding the quality of drinking water and the need to improve it through efficient methods at the final point of distribution of public networks (to the domestic user), but also as a continuation of the previous researches brought in this way, it was developed a pattern of analyzing the efficiency of the main filter cartridges types intended for the general consumer public. In contrast to some empirical or limiting findings, this approach makes a significant contribution to the perspective of making the decision to use these existing solutions to increase the quality of drinking water.
The premises for the continuation of the brought research consist in facilitating the decision-making of the general consumer public in Romania to take the decision for using the optimal drinking water filtration solution based on the results of the statistical analysis of the physicochemical parameters of the particles deposited in the filtered drinking water that directly affect the quality this one, with a direct effect on the health of consumers.
The previously detailed approach regarding our study, in order to a better understanding of the preliminary conditions that consist the basis for the present research, is given in the reference (Crișan et al., 2022).
The theoretical-applicative character but also quantitative of the conducted research represents a contribution with pragmatic results and being easy to evaluate them but also having a directly high degree of confidence.
The statistical indicators of the specific parameters analyzed determine the characterization of the remaining deposits after drinking water filtration, and the global evaluation of the tested filter solutions determines the agglomeration distribution of the particles and their dimensional and structural values. The variations of the deposits and the characteristics of the localized particles represent the path to identify the efficiency of the filtration and the field of the tested filtering solutions, from the perspective of their general degree of use in relation to the cost price and their lifetime. From this point of view, the approached method represents significant contributions to previously published research. At the same time, the results obtained and validated by the applied mathematical model allow the approach by identifying complementary solutions with increased efficiency, as future research directions.
From a practical perspective, the contributions made to the developed research are based on the testing in laboratory conditions of the most used types of filter cartridges, the sampling of drinking water samples after filtration, the preparation of the samples, and the microscopic analysis with high precision techniques, at the nanometer scale, of formations deposited in filtered drinking water, the realization of a representative sample of determinations that were the basis for the application of the mathematical model by the statistical analysis to determine the specific indicators in order to make the characterization of deposited residues with the aim of determining the tested filtering solutions efficiency.
The approach is a methodical one, step by step, focusing on the need to make identical samples as well as the strict follow-up of the methodological algorithm performed in laboratory conditions.
2 Materials and methods
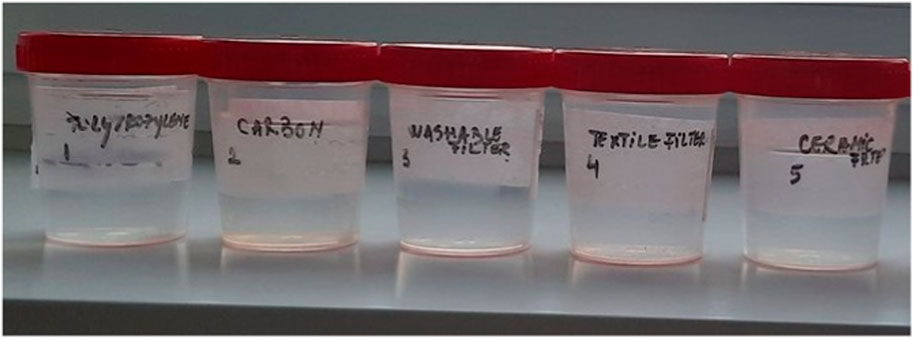
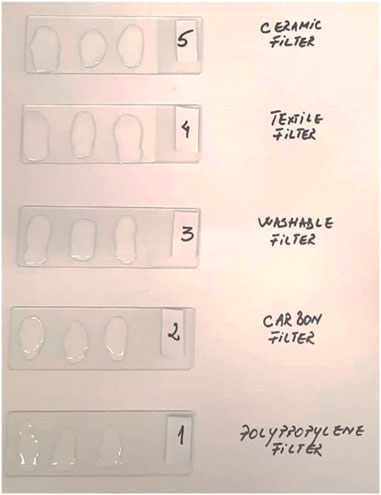
In order to obtain the proposed samples for microscopic analysis, by using a pipette, 5 [ml] of filtered water was taken with each type of filter tested (Note: Obtaining filtered drinking water samples with the five types of tested filters in laboratory conditions, is presented in the following paper: “An Efficient Method for Testing the Quality of Drinking-Water Filters Used for Home Necessities” (Crișan et al., 2022). Therefore, the microscopic analyzes carried out by the AFM technique (Atomic Force Microscopy) and the statistical interpretation of the results obtained was possible following the expansion of the research carried out beforehand). The Appendix section has included a series of relevant images regarding the materials and methods used. Therefore, Figure A1 shows the samples of filtered water with each type of filter (polypropylene, carbon, washable, textile, and ceramic filters) from which three drops of water were taken and equally distributed on three equidistant areas of the glass slides shown in Figure A2.
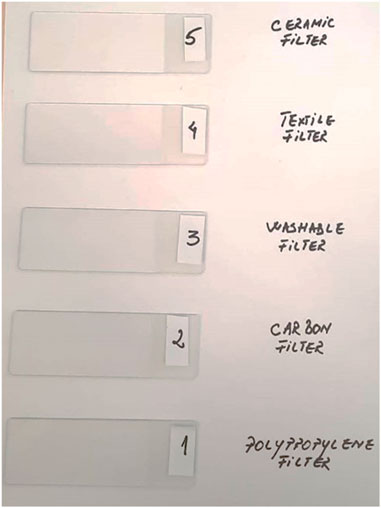
The glass slides covered with water were left for 72 h until the water completely evaporated in normal conditions. This process took place in a room within the MiNaS (Micro Nano Systems) laboratory at the Technical University of Cluj-Napoca. This laboratory has a class 1,000 cleanroom with temperature, pressure and humidity control but also a filtration system for air impurities. Figure A3 illustrates the slides after the drying time lapse.
Slides impregnation was made in multiple spots for making possible microscopic analyses for the total number of seven for each filter type (three by each side and one in the middle, due to the bidirectional limited design of the microscope plates area).
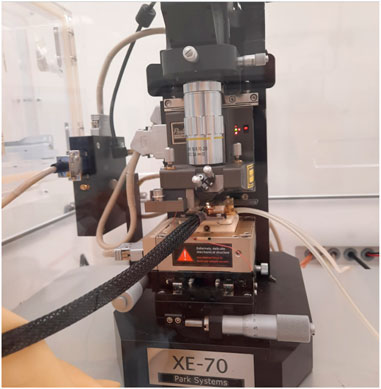
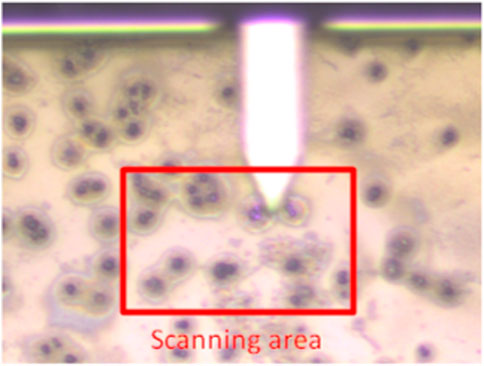
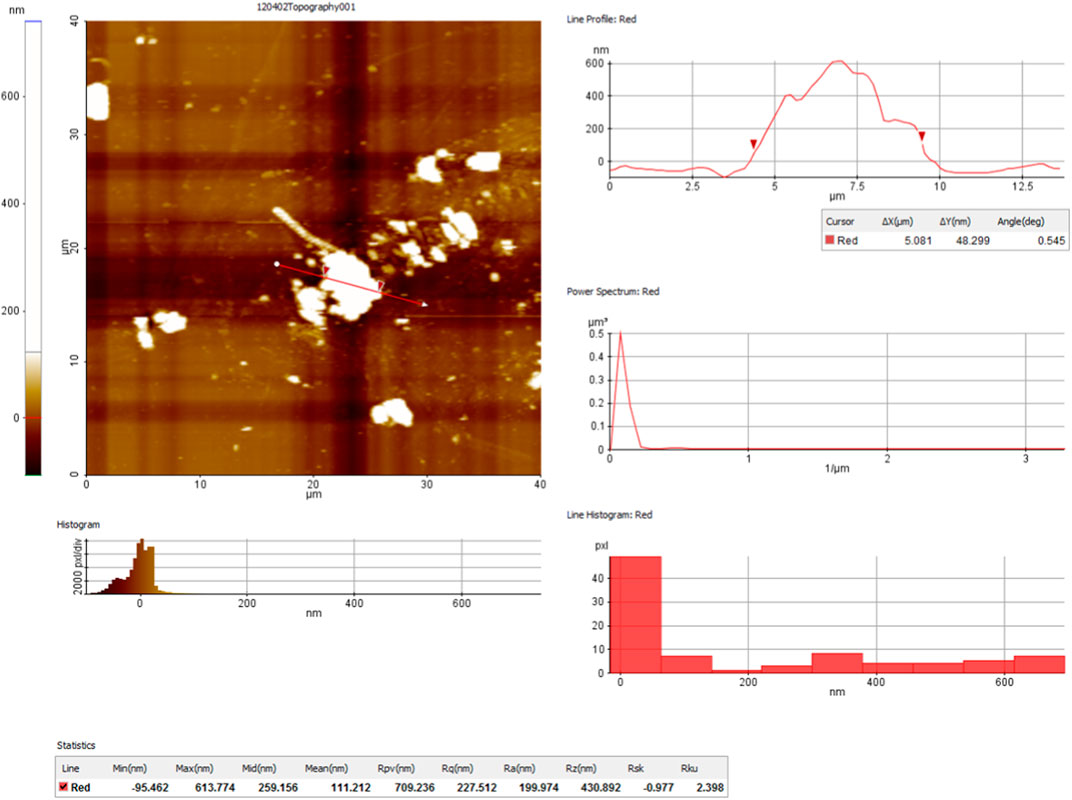
For the microscopic analyses was used the AFM Park System Microscope XE-70 by using a nanoindentation module. This one is exposed in Figure A4 from the appendix. The scanned surface of each sample was made by 40 [µm] x 40 [µm] and the procedure was “contact mode scanning”. For obtaining the best results, the scanning process was at a low rate of 0.25 [Hz] and a pressure force of 100 [nN]. After ending the scanning process, the results have been interpreted through XEI v5.1.6 software, part of the Park System XE-70 microscope modules. Figure A5 has presented an image with the cantilever approaching to the sample and searching the set scan area, in Figures A6A,B are presented two topographic post-scan captures from different areas of the sample, and Figure A6C show a 3D post-scan exposure made in order to double-check the accuracy of scanning stage. Also, in Figure A7 is shown a scan results interpretation obtained through the analyses made by software XEI v5.1.6.
Based on the results obtained from the microscopic analyzes of the tested samples, the characterization of the particle deposits on the post-filtration water samples was possible by performing a statistical evaluation. The method used assumed the application of specific mathematical models for the determination of indicators such as the distribution of the probability for the occurrence of certain size classes of the measured particles related to the number of microscopic samples, the average of the dimensional values related to the observation subintervals, the dispersion of the average values, the mean squared deviation.
The mathematical model was run in the MathCad v15 program. The results of these statistical analyzes allow the correlated and corroborated interpretation of the main three types of dimensions observed for the particles analyzed and measured microscopically: (a) particle height dimensions; (b) dimensions of the diameters for the particles and (c) dimensions regarding the arithmetic roughness of the deposited particles.
The results obtained on the three lines of analysis were tabulated and graphical interpretations were made, using the Ms Excel v16 program, for a unified and adequate global interpretive approach.
a) Statistical analysis of the resulting measurements for the height of the particles deposited on the microscopically analyzed samples
The results of the 7 samples tested for each type of filter analyzed were taken into account, thus resulting in a total number of determined samples N0 = 35. The values of the dimensions measured on the height of the particles deposited in the filtered water were entered in Table 1. The preliminary calculations, necessary for the application of the calculation algorithm, were completed. The obtained results were entered in Table 4.
In order to determine the values of the statistical indicators, the following preliminary calculations are performed (Józef et al., 2020; You and Chuan, 2022).
- N0 is determined, the total number of microscopically analyzed samples;
- Dhmin and Dhmax are determined [µm], the minimum and maximum size recorded;
- the observation subintervals are determined, ∆h [µm] (dimensional increment), using relation (1) where N0 is the total number of samples analyzed;
- the previously determined values are rounded (if necessary) and the number of observation classes is calculated kh, using relation (2) where ∆h’ is the number of observation subintervals rounded and Dhmin’ and Dhmax’ are the size limits rounded;
- the repartition function of the height values of the analyzed particles is determined Pp(h), (represents the probability that a sample contains a certain dimensional value related to the height of the particle, in a range of dimensions h related to the total number of analyzed samples), using relation (3) (Józef et al., 2020; You and Chuan, 2022);
- the distribution function of the height values of the analyzed particles is determined Fp (h), (represents the probability that a sample does not contain a certain dimensional value related to the height of the particle, within a range of dimensions h related to the total number of analyzed samples), using relation (4) (Józef et al., 2020; You and Chuan, 2022);
where np represents the number of samples in which relative cumulative average values are found Dhmed for the heights of the analyzed particles and it was calculated with the relation (5), and Np represents the number of samples in which relative cumulative average values are not found Dhmed for the heights of the analyzed particles and it was calculated with the relation (6). In relation (5) n∆h represents the number of samples with particle height values that fall within the subinterval Δh which is added to the pre-increment of np samples type.
The probability density of the height dimensions for the analyzed particles (Dh) is the limit of the ratio between the probability that the occurrence of a certain dimension is included in the interval of high limits (h, h+ ∆h] and the size of the interval, for h → 0. It was determined by relation (7), where ∆h’ represents the number of rounded observation subintervals (Józef et al., 2020; You and Chuan, 2022).
The rate of recording dimensional values of particle heights zp (h) represents the limit of the ratio between the probability of the appearance for a dimensional value, of one or more analyzed samples located in the interval (h, h+ ∆h] and the size of the interval. It was determined by relation 8, where np(∆h) represents the number of samples in which relative cumulative average values are found Dhmed for the heights of the analyzed particles by the Δh subinterval and Np(h-∆h) represents the number of samples in which relative cumulative average values are not found Dhmed for the heights of the analyzed particles, related at the interval (h-∆h) (Józef et al., 2020; You and Chuan, 2022).
- using relation (9) it is calculated the arithmetic mean mh which represents the average value of the height of the particles on a sample, related to the total number of samples performed, distributed over observation subintervals (Józef et al., 2020; You and Chuan, 2022).
where
and Dh represents the size values divided by observation classes.
- using relation (11) it is calculated the dispersion Ddh for the dimensional values of the particle height grouped by observation subintervals. This can be determined after knowing mh and represents the dispersion area of the dimensional values for the average height of the particles in the samples classified by observation subintervals, relative to the entire number of analyzed samples (Józef et al., 2020; You and Chuan, 2022).
Where Dhmed represents the relative cumulative average heights dimensions, specific to the observation classes.
- the mean square deviation for the dispersion of the mean values particle height dimensions is also calculated, with the relation (12) (Józef et al., 2020; You and Chuan, 2022).
b) Statistical analysis of the resulting measurements for the diameter of the particles deposited on the microscopically analyzed samples
The results of the 7 samples tested for each type of filter analyzed were taken into account, thus resulting in a total number of determined samples N0 = 35. The values of the dimensions measured on the diameter of the particles deposited in the filtered water were entered in Table 2. It was performed the preliminary calculations, necessary for the application of the calculation algorithm using the calculation relations (1)–(12). The calculations were made in an analogous way and the obtained results were entered in Table 5.
c) Statistical analysis of the resulting measurements for the arithmetic roughness of the particles deposited on the microscopically analyzed samples
The results of the 7 samples tested for each type of filter analyzed were taken into account, thus resulting in a total number of determined samples N0 = 35. The values of the dimensions measured on the arithmetic roughness of the particles deposited in the filtered water were entered in Table 3. It was performed the preliminary calculations, necessary for the application of the calculation algorithm using the calculation relations (1)–(12). The calculations were made in an analogous way and the obtained results were entered in Table 6.
3 Results
a) Statistical analysis of the resulting measurements for the height of the particles deposited on the microscopically analyzed samples
After performing the preliminary calculations, the size limits of the N0 samples were identified as the minimum size Dhmin= 0.004 [µm] and Dhmax= 3.599 [µm], thus the interval ends at D’hmin= 0.004 [µm] and D’hmax= 3.604 were adopted, as necessary for the calculation of the dimensional increment of the observation subintervals ∆h =0.587 [µm], and the adoption of a value rounded ∆’h =0.6 [µm], immediately above, so that the number of observation classes kh = 6 to be integer.
Following the application of the calculation algorithm that determined the distribution of the probability of the appearance of certain classes of measured particle sizes related to the number of microscopic samples (size distribution function Pp(h), distribution function of particle values Fp(h), probability density fp(h)), the rate of recording the values dimensional values zp(h), the average of the dimensional values related to observation subintervals mh, the dispersion of the average valuesDdh, the mean squared deviation σh. The obtained results were centralized in Table 4. In order to obtain the results, after performing the preliminary calculations, the Dh dimensions of the particle heights were also determined, divided by incremental observation subintervals, the relative cumulative average dimensions of the Dhmed heights, specific to the observation classes, respectively the number of samples n∆h which represents the number of samples with values of the particle heights that fall into the subinterval Δh, the number of samples Np which represents the number of samples in which no cumulative average relative Dhmed values of the particle heights are found, the number of samples np in which the cumulative average relative Dhmed values of the heights are found particles, according to the relationships indicated in the methodology.
b) Statistical analysis of the resulting measurements for the diameter of the particles deposited on the microscopically analyzed samples
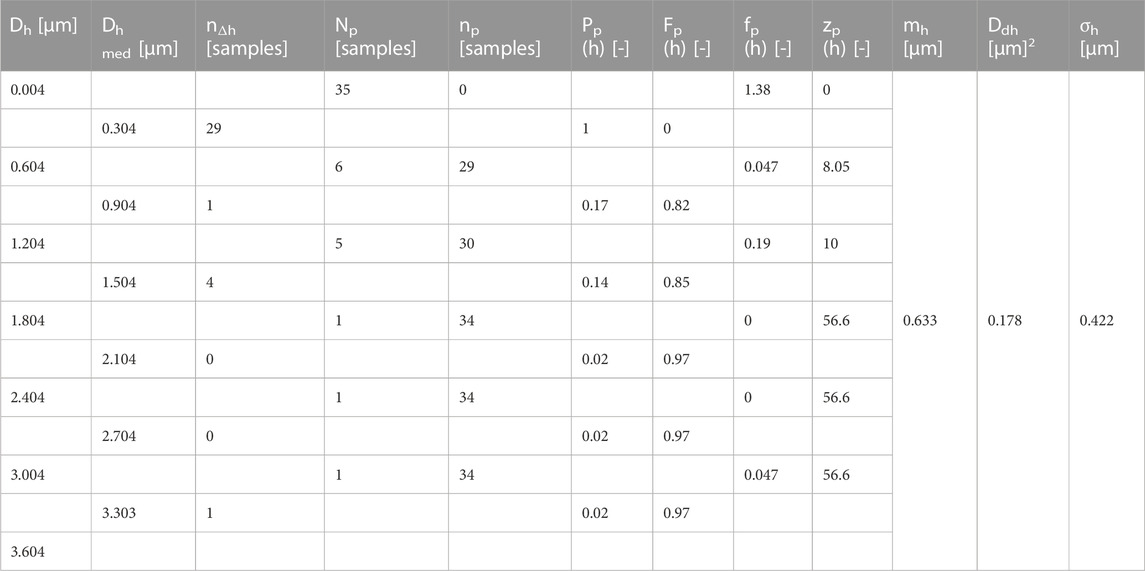
TABLE 4. The centralized results of the statistical indicators for the height of the deposited particles.
After performing the preliminary calculations, the size limits of the N0 samples were identified as the minimum size Dhmin= 0.325 [µm] and Dhmax= 9.766 [µm], thus the interval ends at D’hmin= 0.3 [µm] and D’hmax= 9.8 [µm] were adopted as necessary for the calculation of the dimensional increment of the observation subintervals ∆h =1.54 [µm] and the adoption of a rounded value ∆’h =1.6 [µm], immediately above, so that the number of observation classes kh = 6 to be integer.
Following the application of the calculation algorithm were determined the distribution of the probability of the appearance of certain classes of measured particle sizes related to the number of microscopic samples (size distribution function Pp(h), distribution function of particle values Fp(h), probability density fp(h)), the rate of recording the values dimensional values zp(h), the average of the dimensional values related to observation subintervals mh, the dispersion of the average values Ddh, the mean squared deviation σh. The obtained results were centralized in Table 5.
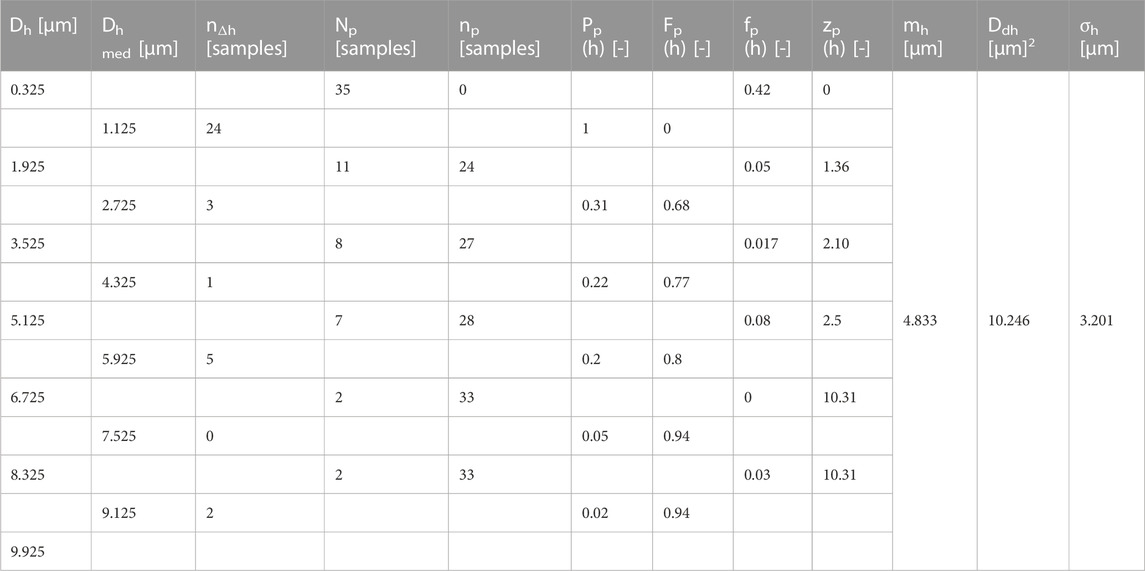
TABLE 5. The centralized results of the statistical indicators for the diameter of the deposited particles.
To obtain the results, after performing the preliminary calculations, the dimensions Dh of the particle diameters were also determined, divided by incremental observation subintervals, the average cumulative relative dimensions of the Dhmed diameters, specific to the observation classes, respectively the number of samples n∆h which represents the number of samples with values of particle diameters that fall within the sub-interval Δh, the number of samples Np which represents the number of samples in which relative cumulative average values Dhmed of the particle diameters are not found, the number of samples np in which relative cumulative average values Dhmed are found of the particle diameters, according to the relationships indicated in the methodology.
c) Statistical analysis of the resulting measurements for the arithmetic roughness of the particles deposited on the microscopically analyzed samples
After performing the preliminary calculations, the size limits of the N0 samples were identified as being the minimum size Dhmin= 0.02 [µm] and Dhmax= 0.914 [µm], thus the range ends were adopted at D’hmin= 0.02 [µm] and D’hmax= 0.92 [µm] as a necessity for the calculation of the dimensional increment of the observation subintervals ∆h =0.146 [µm] and the adoption of a rounded value ∆’h =0.15 [µm], immediately higher, so that the number of classes of observation kh = 6 sa fie to be an integer.
Following the application of the calculation algorithm by which was determined the probability distribution for occurrence of certain classes by measured particle sizes, related to the number of microscoped samples (the repartition function Pp(h), the distribution function of particle values Fp(h), probability density fp(h)), the values dimensions registration rate zp(h), the arithmetic mean of the dimensional values related to the observation subintervals mh, dispersion of the mean values Ddh, mean square deviation σh. The obtained results were centralized in Table 6. To obtain the results, after performing the preliminary calculations, the dimensions Dh of the arithmetic roughness of the particles, divided by incremental observation subintervals, the average cumulative relative dimensions of the arithmetic roughness Dhmed, specific to the observation classes, respectively the number of samples n∆h, which represents the number of samples with values of the arithmetic roughness of the particles that fall into the subinterval Δh, the number of samples Np which represents the number of samples in which there are no relative cumulative average values Dhmed of the arithmetic roughness of the particles, the number of samples np in which relative cumulative average values Dhmed of the arithmetic roughness of the particles are found, according to the relationships indicated in the methodology.
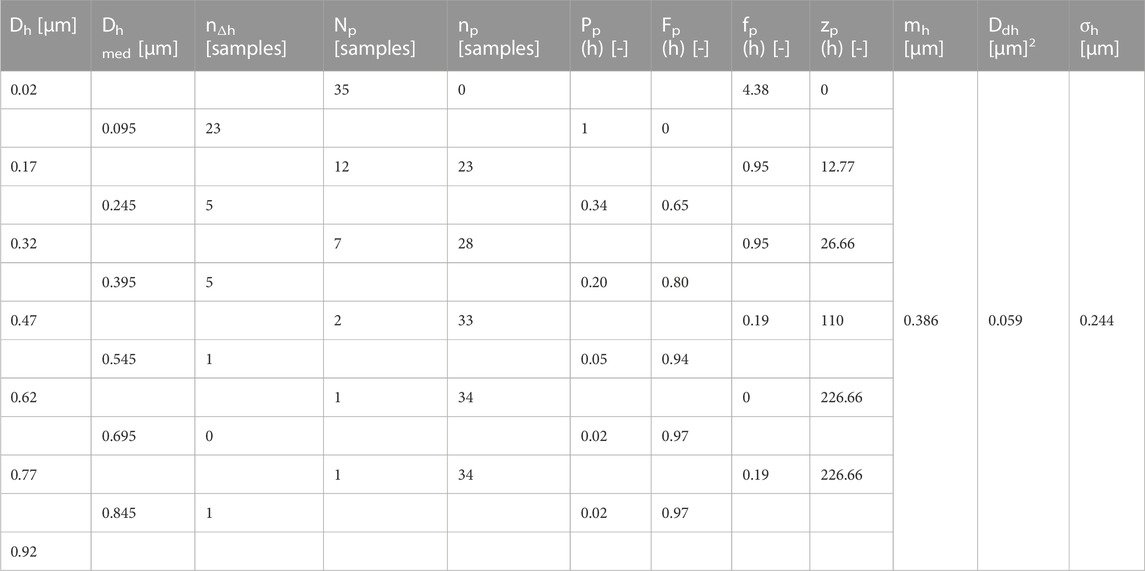
TABLE 6. The centralized results of the statistical indicators for the arithmetic roughness of the deposited particles.
As a result of obtaining and tabulating the mathematically analyzed results, it was possible to create graphical representations of the distributions of the statistically analyzed parameters, using the MsExcel (v16) program. Thus, it is possible to interpret the results in a centralized form by correlating the obtained results and identifying the distribution tendency of the resulting values. In Figure 1 is the stock type representation of the variations of the Phi and Fhi distribution functions of the resulting particle height values, analyzed in relation to the relative cumulative average dimensions of the Dhmed particle height values.
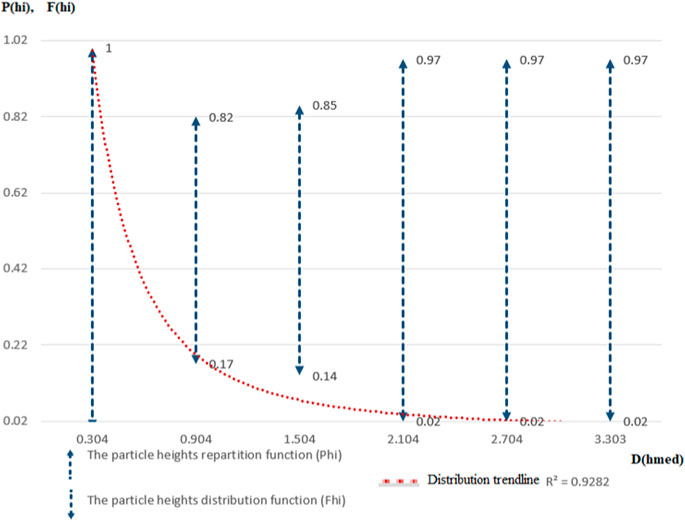
FIGURE 1. The repartition (Phi) and distribution (Fhi) functions of particle heights according to the average cumulative relative heights (Dhmed).
By analyzing the tendency of the distribution of the values of the Particle Height Distribution Function, it is found that in proportion to 80% there are values of the cumulative average heights of the particles between 0.3–0.9 [µm], then up to 85% values between 0.9–1.5 [µm], and up to 100% of the range of distribution values, particles with cumulative average values between 1.5–3.3 [µm] are found. Thus, the first value range was encountered in the case of 85.71% of the analyzed samples, the second value range in the case of 11.42% of the analyzed samples and the last set of values in the case of only 2.87% of the sample of analyzed samples.
The distribution function of the particle height values confirms the distribution law, having a tendency similar to this one, and the validation of the analysis was carried out by drawing the regression curve, which in this case is of the exponential type, by using the least squares method, resulting in a correlation coefficient of 92.82% of R2.
In Figure 2 is the stock type representation of the variations of the distribution functions Phi and distribution Fhi of the values of the diameter sizes of the resulting particles, analyzed in relation to the relative cumulative average sizes of the values of the diameters Dhmed.
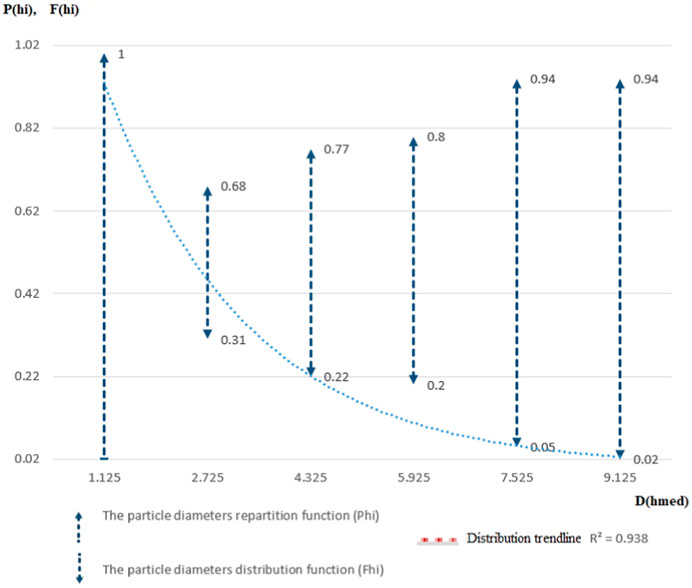
FIGURE 2. The repartition (Phi) and distribution (Fhi) functions of particle diameters according to the average cumulative relative diameters (Dhmed).
By analyzing the tendency of the distribution of the values of the distribution function of the diameter sizes of the particles, it is found that in proportion of 68% there are values of the average cumulative heights of the particles between 1.12–5.92 [µm], then up to 98% values between 5.92–7.52 [µm], and up to 100% of the range of distribution values, particles with cumulative average values between 7.52–9.12 [µm] are found. Thus, the first range of values were encountered in the case of 80.00% of the analyzed samples, the second range of values in the case of 14.28% of the analyzed samples and the last set of values in the case of only 5.72% of the sample of analyzed samples. The distribution function of the values of the particle diameters confirms the distribution law, having a tendency similar to this one and the validation of the analysis was carried out by drawing the regression curve, which in this case is of the exponential type, by using the least squares method, resulting in a correlation coefficient R2 of 93.8%.
In Figure 3 is the stock type representation of the variations of the Phi and Fhi distribution functions of the roughness values of the resulting particles, analyzed in relation to the average cumulative relative dimensions of the Dhmed roughness values.
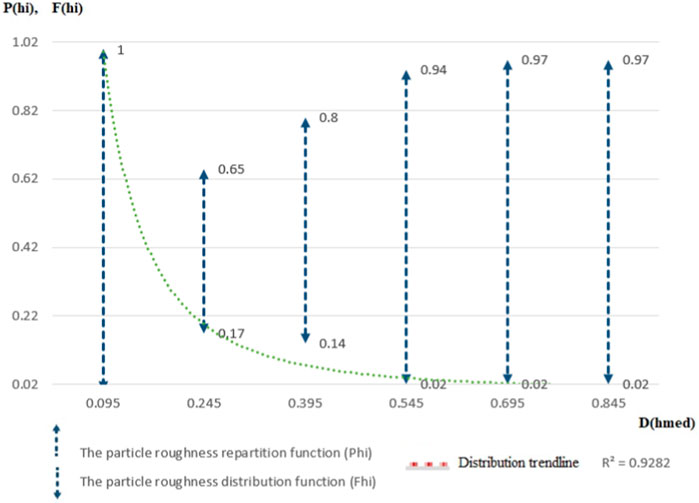
FIGURE 3. The repartition (Phi) and distribution (Fhi) functions of particle roughness according to the average cumulative relative roughness (Dhmed).
By analyzing the tendency of apportion the values regarding the Particle Roughness Distribution Function it is found that in a proportion of 80% there are values of the cumulative average roughness of the particles between 0.09–0.24 [µm], then up to 87% values between 0.24–0.39 [µm], and up to 100% from the range of distribution values there are particles with cumulative average values between 0.39–0.84 [µm]. Thus, the first range of values were encountered in the case of 80.00% of the analyzed samples, the second range of values in the case of 14.28% of the analyzed samples and the last set of values in the case of only 5.72% of analyzed samples. The distribution function of the particle roughness values also confirms in this case the distribution law, having a similar tendency to this one and the validation of the analysis was carried out by drawing the regression curve which in this case is of exponential type, by using the least squares method, resulting in a correlation coefficient R2 of 92.82%.
In conjunction with the analyses carried out previously were also made in graphical form the distribution of the Probability density of particle values occurrences fhi and of the recording particle range zhi related to the relative cumulative average values Dhmed, analyzed on observation subintervals.
Figure 4 shows the case of the particle height values, Figure 5 the case of their diameter values and Figure 6 shows their roughness.
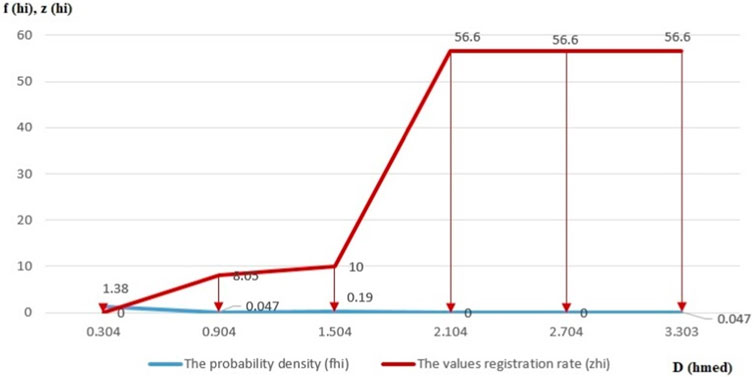
FIGURE 4. The probability density (fhi) and recording particles range (zhi) of particle heights according to the average cumulative relative heights (Dhmed).
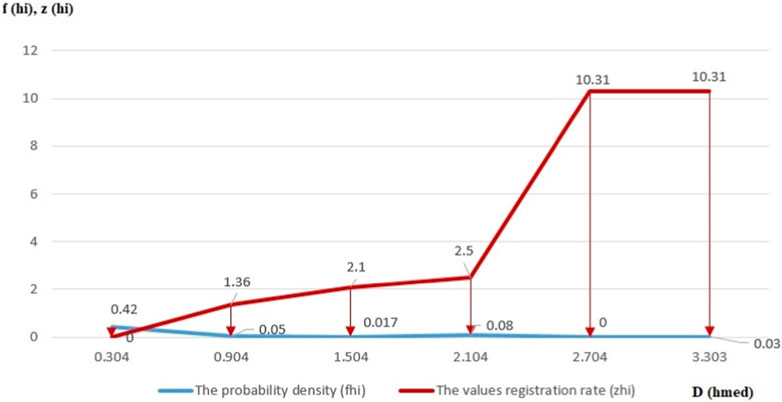
FIGURE 5. The probability density (fhi) and recording particles range (zhi) of particle diameters according to the average cumulative relative diameters (Dhmed).
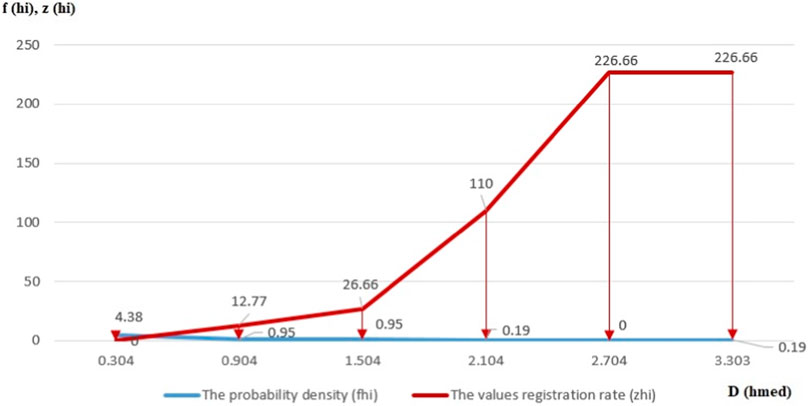
FIGURE 6. The probability density (fhi) and recording particles range (zhi) of particle roughness according to the average cumulative relative roughness (Dhmed).
In the case of the height values of the analyzed particles, it is mown that in the case of those 80% of samples, the probability density of values occurrence up to 0.9 [µm] is by 85.75% and the values registration rate of values height, ranked on observation subintervals specific to the cumulative relative means of the dimensions, is by 4.24%, in the case of those 85% from samples, the particles apparition probability density up to 1.5 [µm] is by 11.4% and the values registration rate is by 5.32%, and in the case of those 100% from samples, the probability density of values occurrence up to 3.3 [µm] is by 2.82% and the values height registration rate is by 90.4%.
In the case of diametral values of the analyzed particles, it is found that for those 68% of samples, the probability density of values occurrence up to 5.92 [µm] is by 81.57% and the registration rate of diameter values, ranked on observation subintervals specific to the cumulative relative means of the dimensions, is by 13.01%, in the case of those 98% of samples, the particles apparition probability density up to 7.52 [µm] is by 13.4% and the values registration rate is by 9.4%, and in the case of those 100% of samples, the probability density of values occurrence up to 9.12 [µm] is by 5.03% and the diameter values registration rate is by 77.59%.
In the case of the roughness values of the analyzed particles, it is mentioned that for those 80% of samples, the probability density of values occurrence up to 0.24 [µm] is by 80.03% and the registration rate of roughness values, ranked on observation subintervals specific to the cumulative relative means of the dimensions, is by 6.54%, in the case of those 87% of samples, the particles apparition probability density up to 0.39 [µm] is by 14.26% and the values registration rate is by 18.24%, and in the case of those 100% of samples, the particles apparition probability density up to 0.84 [µm] is by 5.71% and the roughness values registration rate is by 75.22%.
Overall, there were analyzed compared and graphically represented the parameters that represent the arithmetic mean mh, the recorded values dispersion Ddh and the standard deviation σh for the three types of values, more exactly, the height, diameter and roughness of the analyzed particles. Figure 7 shows their graphic representation.
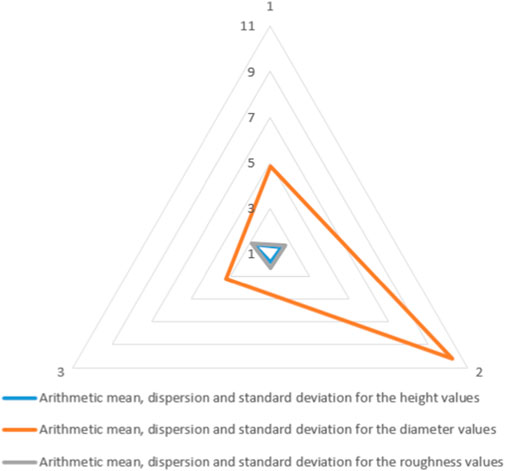
FIGURE 7. The arithmetic mean (mh), values dispersion (Ddh) and standard deviation (σh) for height values (case 1), diameter values (case 2) and rougness values (case 3).
In the case of arithmetic mean, the values recorded for heights and roughness are close as range but for diametral particle dimensions, this parameter is up to five times greater. In the case of dispersion analyses, it is found that the bigger spread of values is recorded at diametral particle dimensions, up to ten times more. For deviation particle values, again, regarding diametral dimensions, this parameter has recorded up to seven times greater value relative to height or particle roughness.
4 Discussions, conclusions and future directions of development
4.1 Discussions
Drinking water is a continuous topic of interest for increasing its quality, especially for that used domestically in large urban agglomerations, especially where the population density is high and public supply networks are old, outdated, or at the limit of functionality. This research, being an extension of the previous one (Crișan et al., 2022), allowed overcoming limitations such as those related to the unitary sampling of the analyzed samples, due to the topographic and topo-metric diversity of the samples and at the same time taking over the entire sample of deposited particles, with the aim of applying the mathematical analysis model and obtaining valid results.
Through the prism of the entered data set into the mathematical model, generated unitarily by taking identical samples and determining the physical-mechanical characteristics of the post-filtration residues through atomic force microscopy techniques, it was possible to obtain at output data with increased accuracy which validates by the one hand, the previously published research as well as the application of the research methodology developed in this work, bringing convergent and conclusive findings regarding the efficiency of the tested filters and the quality of drinking water after filtration.
Moreover, this sampling method allowed full analysis using atomic force microscopy and not part with optical one so that the particles could be uniquely characterized according to the main criteria of analysis and interest that reproduce the quality of post-filtration water with the main types of commercial filters for home users.
The determination of the statistical indicators specific to the physical-mechanical characteristics of the residual particles is a method whose results complement and validate the results obtained in the previous research, through which the optimal solution of the quality-price ratio for commercial filtration systems was identified. Last but not least, this statistical method reflects the existing limitations of commercial filtering solutions, in terms of the quality of filtered drinking water, but also forms the basis of future research aimed at the development of a filter cartridge with superior filtering characteristics but with increased durability and an optimal price.
Although the method that consists in determining the statistical indicators regarding the characterization of post-filtration residual particles has very high accuracy, its application also imposes some limitations such as the existence of a unitary representative sample. This involves the sampling and comparative analysis of identical or similar product categories from the point of view of intended use. At the same time, the method is based on the identification of some distribution classes for the analyzed parameters, so there may be a risk to appearing of different subintervals, larger or smaller so that in the final stage of results validation the global indicators such as the arithmetic mean, the dispersion and the average deviation quadratic not to outline low relative error values. Moreover, the method is efficient for the analysis of parameters of the same type, as those followed by the research carried out in this work.
4.2 Conclusions
The research carried out in the present paper represents a continuation of the steps carried out previously (Crișan et al., 2022). The method approached in this paper allowed the purity analysis of the drinking water provided by the public network. The water was filtered by the five types of filter cartridges available to domestic consumers.
Five water samples corresponding to each type of filter cartridge tested were prepared, and identical amounts of water were taken from them, for which a microscopic analysis of the deposition of residual particles after filtration was carried out. For this purpose, the technique of atomic force microscopy was used. For the accuracy of the results and the relevance of their statistical interpretation, three directions of analysis were followed for the characterization of the deposited particles: height and diameter, for establishing the three-dimensional size and their agglomeration, and roughness, for the statistical analysis of the structure that characterizes the post-filtration residual deposits.
The method of determining the statistical indicators, applied for the analysis of the microscopic analysis results, by the three research directions followed, represents an efficient method with precise results that allow the comparative interpretation of the values determined by calculation. For reaching this purpose, a computerized calculation model was developed, using the specific mathematical formulas for these indicators, and samples of 35 microscopic results were run for each type of analysis in the three categories. The data was mathematically analyzed through incremental subintervals of observations and the obtained results were entered in tree tables which represented the basis of drawing graphic diagrams in order to overview and develop a comparative analysis.
The most relevant results reflect the existence of post-filtration deposits of residual particles with average cumulative relative heights between 0.3–0.9 [µm] in a proportion of 80% of the analyzed sample and with the probability density of the occurrence by 85.75%, for diameters between 1.12–5.92 [µm] in a proportion to 68% and with the probability density of the occurrence by 81.57%, and for roughness values between 0.09–0.24 [µm] in case of 80% from the sample analyzed and with the probability density of the occurrence by 80.03%. The registration rate of the occurrence of the specified values is directly proportional to their probability density with an excess in the case of diametric values, which otherwise measure the largest dimensions and are the basis of this fact.
It is found that the diameter values of the particles end up being more than six times larger, a fact mainly due to their agglomeration and welding in conglomerate-type formations, as can be seen in Figure A5 in the appendix. The variation of a little over two and a half times in the cumulative average roughness of the particles reflects the fact that the diametrical dimensions do not affect the constitution and surface condition of the analyzed deposits. Regarding the arithmetic mean, dispersion, and standard deviation of obtained values it is found that, again, next to the values of the diametrical dimensions, the value results with eight to ten times higher were found.
4.3 Future directions of development
Following the research developed and the results obtained, the worrying perspective related to the quality of drinking water filtered by the usual existing methods, in terms of consumer health (Undesser, 2007; Foysal et al., 2020), leads to the conclusion that the current research can be further extended. The future directions of research development focus on the identification of filtering solutions (materials or innovative technologies) with superior qualities of filtering and purifying drinking water used in household regimes and at the same time intended for the general public users, not for a narrow area of consumers as a result of very high-cost prices.
Data availability statement
The original contributions presented in the study are included in the article/supplementary material, further inquiries can be directed to the corresponding authors.
Author contributions
H-GC and O-AC contributed to conception and design of the study. FȘ organized the database. H-GC performed the statistical analysis. H-GC and O-AC wrote the first draft of the manuscript. CB and MP wrote sections of the manuscript. All authors contributed to the article and approved the submitted version.
Conflict of interest
The authors declare that the research was conducted in the absence of any commercial or financial relationships that could be construed as a potential conflict of interest.
Acknowledgments
This paper was financially supported by the Project “Network of excellence in applied research and innovation for doctoral and postdoctoral programs/InoHubDoc”, project co-funded by the European Social Fund financing agreement no. POCU/993/6/13/153437.
Publisher’s note
All claims expressed in this article are solely those of the authors and do not necessarily represent those of their affiliated organizations, or those of the publisher, the editors and the reviewers. Any product that may be evaluated in this article, or claim that may be made by its manufacturer, is not guaranteed or endorsed by the publisher.
References
Amuah, E. E. Y., Obeng Bekoe, E. M., Kazapoe, R. W., Dankwa, P., Nandomah, S., Douti, N. B., et al. (2021). Sachet water quality and Vendors’ practices in Damongo, northern Ghana during the emergence of SARS-CoV-2 using multivariate statistics, water quality and pollution indices, and panel assessment. Environ. Challenges 4, 100164. doi:10.1016/j.envc.2021.100164
Crișan, H.-G., Șerdean, F., Bîrleanu, C., Pustan, M., and Crișan, O.-A. (2022). An efficient method for testing the quality of drinking-water filters used for home Necessities. Int. J. Environ. Res. Public Health 19, 4085. doi:10.3390/ijerph19074085
Cui, S., Yu, T., Zhang, F., Fu, Q., Hough, R., An, L., et al. (2020). Understanding the risks from diffuse pollution on wetland eco-systems: The effectiveness of water quality classification schemes. Ecol. Eng. 155, 105929. doi:10.1016/j.ecoleng.2020.105929
da Luz, N., and Kumpel, E. (2020). Evaluating the impact of sampling design on drinking water quality monitoring program outcomes. Water Res. 185, 116217. doi:10.1016/j.watres.2020.116217
Dettori, M., Arghittu, A., Deiana, G., Castiglia, P., and Azara, A. (2022). The revised European Directive 2020/2184 on the quality of water intended for human consumption. A step forward in risk assessment, consumer safety and informative communication. Environ. Res. 209, 112773.
Flem, B., Reimann, C., Fabian, K., Birke, M., Filzmoser, P., and Banks, D. (2018). Graphical statistics to explore the natural and anthropogenic processes influencing the inorganic quality of drinking water, ground water and surface water. Appl. Geochem. 88, 133. doi:10.1016/j.apgeochem.2017.09.006
Foysal, J., Fotedar, R., Tay, C.-Y., and Gupta, S. K. (2020). Biological filters regulate water quality, modulate health status, immune indices and gut microbiota of freshwater crayfish, marron (Cherax cainii, Austin, 2002). Chemosphere 247, 125821. doi:10.1016/j.chemosphere.2020.125821
Houthuijs, D., Breugelmans, O. R. P., Baken, K. A., Sjerps, R. M. A., Schipper, M., van der Aa, M., et al. (2022). Assessment of drinking water safety in The Netherlands using nationwide exposure and mortality data. Environ. Int. 166, 107356. doi:10.1016/j.envint.2022.107356
Janusz, R. R., and Katarzyna, P. U. (2019). An approach to determine risk indices for drinking water–study investigation. Sustainability 11, 3189.
Johnstone, N., and Serret, Y. (2012). Determinants of bottled and purified water consumption: Results based on an OECD survey. Water Policy 14 (4), 668–679. doi:10.2166/wp.2011.048
Józef, Z., Jerzy, M., Jarosław, Z., and Joanna, S. R. (2020). Reliability analysis of technical means of transport, MDPI. Appl. Sci. 10 (9), 3016.
Katarzyna, P. U., and Janusz, R. R. (2020). Consumers' perceptions of the supply of tap water in crisis situations. Energies 13, 3617.
Kaur, A., and Janmaat, J. (2023). Investigating the impacts of drinking water quality on house prices: A household production function approach. Water Resour. Econ. 41, 100213. doi:10.1016/j.wre.2022.100213
Khan, S. U., and Sheikh, M. R. (2023). Spatial disparities in household expenditure on safe drinking water in Pakistan: An application of geographically weighted regression. Groundw. Sustain. Dev. 2023, 21. doi:10.1016/j.gsd.2023.100933
Larson, A., Haver, S., Hattendorf, J., Salmon-Mulanovich, G., Riveros, M., Verastegui, H., et al. (2023). Household-level risk factors for water contamination and antimicrobial resistance in drinking water among households with children under 5 in rural San Marcos, Cajamarca, Peru. One Heal 2023, 16. doi:10.1016/j.onehlt.2023.100482
Lee, L., and Helsel, D. (2005). Statistical analysis of water-quality data containing multiple detection limits: S-Language software for regression on order statistics. Comput. Geosciences 31 (10), 1241–1248. doi:10.1016/j.cageo.2005.03.012
Ma, L., Jiang, X.-T., Guan, L., Li, B., and Zhang, T. (2022). Nationwide biogeography and health implications of bacterial communities in household drinking water. Water Res. 2022, 215. doi:10.1016/j.watres.2022.118238
Marcal, J., Antizar-Ladislao, B., and Hofman, J. (2021). Addressing water security: An overview. Sustainability 13, 13702. doi:10.3390/su132413702
Mohamed, N. A., Wachemo, A. C., Karuppannan, S., and Duraisamy, K. (2022). Spatio-temporal variation of groundwater hydrochemistry and suitability for drinking and irrigation in Arba Minch Town, Ethiopia: An integrated approach using water quality index, multivariate statistics, and GIS. Urban Clim. 46, 101338. doi:10.1016/j.uclim.2022.101338
Petculescu, I., Paul, H., Stephen Brown, R., McDermott, K., and Anna, M. (2022). An assessment of total coliforms and associated thresholds as water quality indicators using a large Ontario private drinking water well dataset. Sci. Total Environ. 846, 157478.
Prety Debnath, M. M., Abdullah, A., Karmakar, S., Uddin, M. S., and Nath, T. K. (2022). Drinking water quality of Chattogram city in Bangladesh: An analytical and residents' perception study. Heliyon 8 (12), e12247. doi:10.1016/j.heliyon.2022.e12247
Undesser, P. (2007). Filter standards: How important is filter certification to consumers? Filtr. Sep. 44, 40–41. doi:10.1016/s0015-1882(07)70289-6
USEPA (2006). Point-of-use or point-of-entry treatment options for small drinking water systems. United States: USEPA.
Varol, M. (2020). Use of water quality index and multivariate statistical methods for the evaluation of water quality of a stream affected by multiple stressors: A case study. Environ. Pollut. 266, 115417. doi:10.1016/j.envpol.2020.115417
Vásquez, W. F., Mozumder, P., Hernández-Arce, J., and Berrens, R. P. (2009). Willingness to pay for safe drinking water: Evidence from Parral, Mexico. J. Environ. Manag. 90 (11), 3391. doi:10.1016/j.jenvman.2009.05.009
Villanueva, C. M., Evlampidou, I., Ibrahim, F., Donat-Vargas, C., Valentin, A., Tugulea, A. M., et al. (2023). Global assessment of chemical quality of drinking water: The case of trihalomethanes. Water Res. 230, 119568. doi:10.1016/j.watres.2023.119568
Wang, Y., and Zhu, G. (2021). Evaluation of water quality reliability based on entropy in water distribution system. Phys. A Stat. Mech. its Appl. 584, 126373. doi:10.1016/j.physa.2021.126373
You, Z., and Chuan, H. (2022). A review on reliability of integrated electricity-gas system. MDPI, Energies 15, 6815.
Zhang, K., Chang, S., Zhang, Q., Bai, Y., Wang, E., Zhang, M., et al. (2023). Heavy metals in influent and effluent from 146 drinking water treatment plants across China: Occurrence, explanatory factors, probabilistic health risk, and removal efficiency. J. Hazard. Mater. 450, 131003. doi:10.1016/j.jhazmat.2023.131003
Appendix A
Keywords: filtered water, residual particles, microscopic analysis, atomic force microscopy, statistical indicators, water impurity
Citation: Crișan H-G, Crișan O-A, Bîrleanu C, Pustan M and Șerdean F (2023) Microscopic characterization of residual particles from filtered drinking water and determination of statistical indicators regarding identified deposits. Front. Earth Sci. 11:1196513. doi: 10.3389/feart.2023.1196513
Received: 30 March 2023; Accepted: 17 May 2023;
Published: 05 June 2023.
Edited by:
Mostafa Mohamed El-Sheekh, Tanta University, EgyptReviewed by:
Katarzyna Pietrucha-Urbanik, Rzeszów University of Technology, PolandAli Gemeay, Tanta University, Egypt
Copyright © 2023 Crișan, Crișan, Bîrleanu, Pustan and Șerdean. This is an open-access article distributed under the terms of the Creative Commons Attribution License (CC BY). The use, distribution or reproduction in other forums is permitted, provided the original author(s) and the copyright owner(s) are credited and that the original publication in this journal is cited, in accordance with accepted academic practice. No use, distribution or reproduction is permitted which does not comply with these terms.
*Correspondence: Horea-George Crișan, aG9yZWEuY3Jpc2FuQG9tdC51dGNsdWoucm8=; Florina Șerdean, ZmxvcmluYS5ydXN1QG9tdC51dGNsdWoucm8=
 Horea-George Crișan
 Oana-Adriana Crișan
 Corina Bîrleanu
 Marius Pustan1
 Florina Șerdean


