
95% of researchers rate our articles as excellent or good
Learn more about the work of our research integrity team to safeguard the quality of each article we publish.
Find out more
ORIGINAL RESEARCH article
Front. Earth Sci. , 05 June 2023
Sec. Solid Earth Geophysics
Volume 11 - 2023 | https://doi.org/10.3389/feart.2023.1195485
This article is part of the Research Topic Applications of Gravity Anomalies in Geophysics View all 11 articles
 Fayez Harash1,2*
 Amin Khalaf3Nadhir Al-Ansari4*Chao Chen5Imad Alrawi6Harith Al-Khafaji7Mohammed Tageldin7
This study investigates the variations of surface Moho inverted from Bouguer gravity data beneath the northwestern Arabian plate. The results were obtained by applying the 3DINVER program developed in a MATLAB environment using the Parker–Oldenburg method. The calculation results show that the maximum Moho depth observed in the western Arabian shield approaches more than 40 km, while the minimum values of 16–20 km are mainly concentrated beneath the Mediterranean Sea. A key innovation of this study is its implementation of exponential density contrast decrease in the sediment–basement interface in the Syrian part of the Arabian plate. The gravity anomaly of the sediment is computed using a density contrast which varies exponentially with depth, leading to a more accurate representation of the subsurface structure and offering valuable insights into the geodynamic processes and seismogenic potential of the area. To validate the inverted results from the 3DINVER program, the study compares these findings with seismic results that show good agreement with our results from the same region. This leads to a better understanding of the crustal structure and provides insights into its implications for the geodynamic and seismogenic nature of the northwestern Arabian plate—critical for assessing the potential for earthquakes and other geological hazards. The density contrast between the Earth’s crust and mantle can be related to variations in the composition, temperature, and pressure of the rocks. These factors influence the mechanical properties of the crust, ultimately affecting the tectonic processes and seismic activity in the region.
The northwestern Arabian plate is a very interesting region because of the tectonic separation from the African plate in the south and the collision with the Anatolian microplate in the north, as well as the Red Sea spreading and movement in the Suez Gulf (Figure 1) and the Dead Sea rift (Ben-Avraham, 1985).
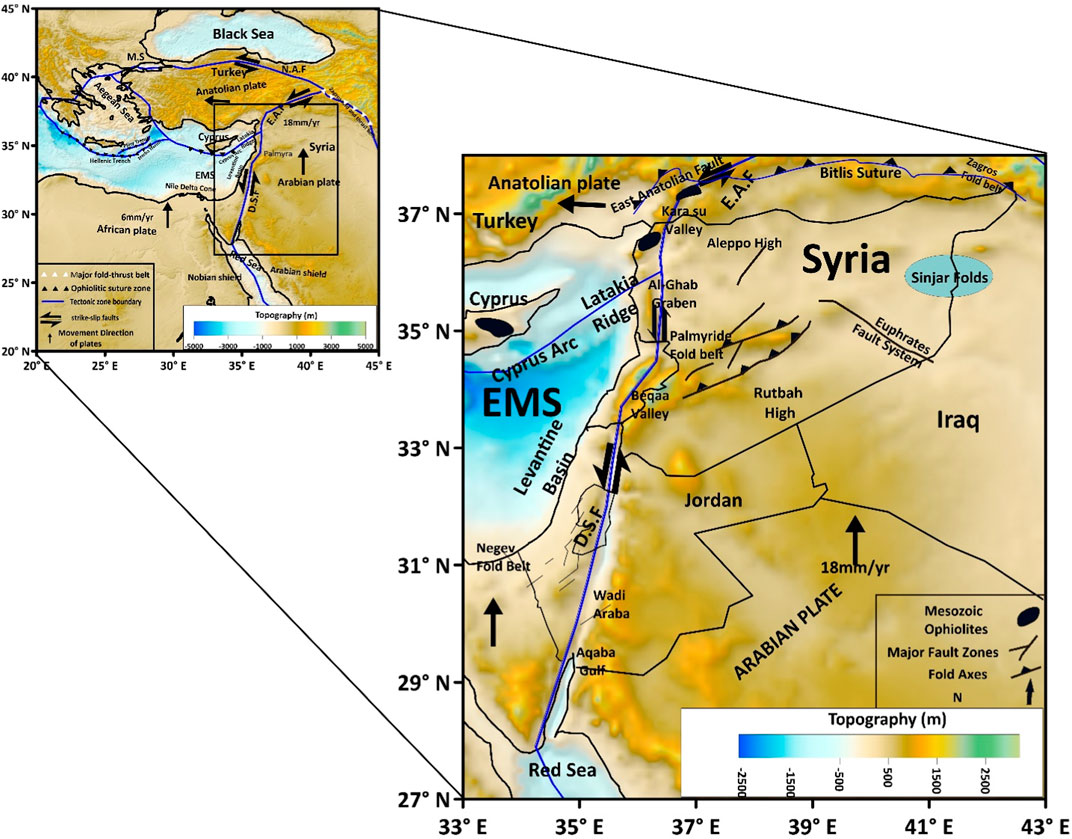
FIGURE 1. Location of the study area (WMS Demo Server). Simplified tectonic and topographic map of the eastern Mediterranean. Thick lines show the main plate boundaries. Approximate plate velocity vectors are shown in black (Stern & Johnson, 2010). E. A. F, East Anatolian Fault; D. S. F, Dead Sea Fault; EMS, eastern Mediterranean Sea, modified from Barazangi et al. (1993).
The Dead Sea Fault System (DSFS) starts in the south from the northern part of the Gulf of Aqaba to the Kara Su Valley in the north, with a total length of about 1,100 km that crosses four countries: through the Arab Wadi, Jordan Valley in Jordan, the Beqa’a Valley in Lebanon, and the Al-Ghab Graben in Syria (Figure 1).
The Cornell Syria project has already surveyed Syria with its prominent tectonic features represented by the Zagros fold in the far northeastern boundary with Iraq that extends northwest into western Iraq and western Iran, the Palmyride fold belt in central Syria, the Euphrates fault system crossing Syria from north to east, and the Abd el Aziz and Sinjar folds in eastern Syria near the border with Iraq (Brew et al., 2000). This project described paleogeography and tectonic deformation using geological data but did not use gravity data to investigate the deep Moho depth in this area.
Many functions were used to observe the density contrast variation. For example, Murthy and Rao (1979) developed a linear function, Rao et al. (1990) assumed the change in density contrast as a quadratic function, Silva et al. (2006) simulated a hyperbolic function, and Chakravarthi et al. (2016) discovered that the density contrast differed as an exponential function with depth.
Our study discusses the Moho depth inverted from Bouguer gravity measurements and seeks to understand the difference in Moho depth in the study area. We focus on the Syrian part of the plate and the surrounding areas because Syria has not been studied as specifically comprising oceanic and continental crust, and no sedimentary corrections have been attempted as the density contrast changes following an exponential function with depth. Some authors have considered the sedimentary density in the surrounding area as being uniform (Ben-Avraham et al., 2002; Michal Rosenthal, 2015).
The tectonics of the northwestern Arabian plate are still active, as represented in its tectonic boundaries. Those in the east comprise the thrust belt and Zagros fold that form the collision zone between the Arabian and Iranian plates, the eastern Anatolian fault in the north, and, in the south, the Red Sea and Dead Sea faults that separate the Arabian plate and the Levantine microplate (Brew et al., 2003). There are many clear features in the region that derive from this complicated history, such as the Dead Sea, which separates the Arabian and African plates. The tectonic movement of the plate boundaries controls the tectonic deformation in the region, especially in Syria, as observed in the Palmyride fold and the Euphrates system (Barazangi et al., 1993). The Levant basin was opened in the eastern Mediterranean Sea as a result of the separation of the Arabian from the African plate. The eastern Mediterranean region has a complicated geological history that extends from the late Triassic to the early Jurassic (Garfunkel, 1998). The varied stratigraphic evolution of the eastern Mediterranean region represents the complicated Cenozoic and pre-Cenozoic boundary (McBride et al., 1990).
Syria has been geologically influenced because of the movement of the Arabian plate, with Syria being in its northwest (Brew et al., 2000). Syria has many consequent tectonic features like the Aleppo Plateau in the north, the Rutbah uplift in the south, the intercontinental Palmyride fold belt in the center, and the Abd el Aziz fold in its northeast.
The Al-Ghab depression is formed at the northern end of the Levant rift that extends from south of the Dead Sea rift to the north in Turkey. It is considered to have been a left-lateral strike-slip fault since the mid-Cenozoic (Chaimov et al., 1993) and has been studied by many researchers (Trifonov et al., 1991; Domas, 1994). The central portion of the graben is a plain covered by a thin bed of Pleistocene and Holocene sediment covered with lacustrine Pliocene deposits which may reach 1 km in thickness, and a base that may go 700 m below sea level. The flanks of this rift are controlled by faults with blocks and scraps. Basaltic magma was very active during the late Miocene–Pliocene in the southern Al-Ghab depression and moved to the north of this basin during the late Pliocene–early Pleistocene (Sharkov, 1997).
This study aims to determine the Moho depth based on Bouguer gravity data inversion, assuming that the density contrast decreases exponentially with depth (Chakravarthi, 2003; Chakravarthi et al., 2016; Pham et al., 2018). Although many authors consider the sedimentary density uniform, two maps will be presented here: one from our inversion results and the other from the seismological map. Our inversion results will be compared to the seismological Moho map (Mechie et al., 2013).
Bouguer gravity data are a useful tool for inverting the Moho boundary. The gravity data for the region we investigated were acquired from the Earth Geopotential Model EGM2008 estimated from altimetry missions, ground data, and the GRACE satellite mission (Pavlis et al., 2013), with a resolution (1' × 1′) as demonstrated in Figure 2.
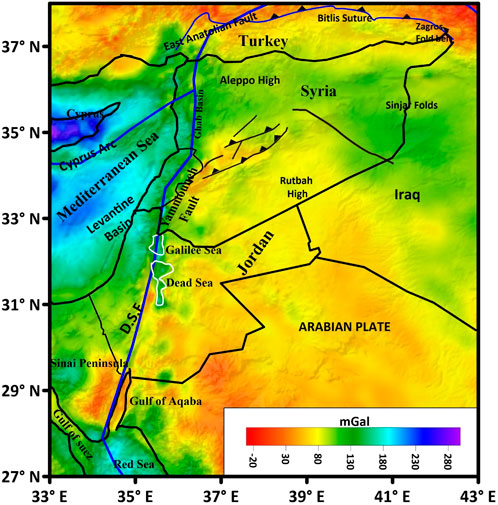
FIGURE 2. Bouguer gravity map (in mGal) of the study region.
Figure 2 represents the Bouguer anomaly map related to the crust–mantle boundary observed over the eastern Mediterranean region. Gravity anomaly is high in the Mediterranean Sea and through the DSFS, with a total amplitude of over 150 mGal crossing the DSFS. The area has an extent of 10° and 11° in longitude and latitude, respectively.
We corrected the Bouguer gravity anomalies to eliminate the gravitational effects of the sediment–basement because of their lower density. We concluded that density contrast decreases following an exponential function with depth, based on seismic velocity measurements provided by the Syrian Petroleum Company (Figure 3). This exponential function was used in Granser’s method (Chakravarthi et al., 2003; Pham et al., 2018) to compute the Bouguer gravity effect of sediment–basement from the basement data digitized by Rybakov (2004) and Jassim and Goff (2006). Bouguer gravity was corrected for the sediment–basement effect before inverting the data. We obtained the residual Bouguer gravity data that were ready to implement in the inversion process. Before performing the inversion, we applied some processes to achieve the gravity anomaly from the Moho boundary (
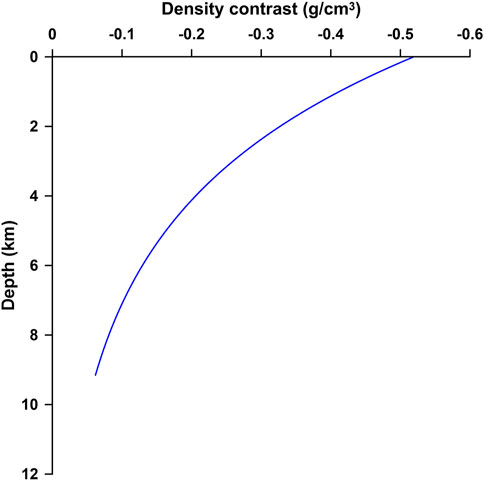
FIGURE 3. Exponential density contrast variation in the study region.
Many anomalies and trends are clearly observed on the simplified Bouguer map. The Bouguer gravity anomaly has a clear variation in southern and northern Syria, and with maximum anomalies values of 270 mGal in western Syria and minimum values of −70 mGal (Figure 2).
Density is considered an important parameter that plays a significant role in the impact of gravity anomalies. It is useful to distinguish the lithology by investigating its conduct as it changes with depth.
The density contrast values change exponentially with depth (Chakravarthi et al., 2016; Pham et al., 2018) according to this equation:
where z represents depth in km,
To forward compute the gravity effect of the sediment–basement, the exponential density contrast function that varies with depth following Granser’s (1987a) equation should be taken into account:
where
The basement depths used in the aforementioned algorithm were digitized from Rybakov (2004) and Jassim & Goff (2006) over an area of (33–43°N and 27–37°E) described in Figure 4A. The resulting gravity data will be subtracted from the Bouguer gravity data to obtain the residual gravity effect of the Moho discontinuity that will be used in the inversion procedures as
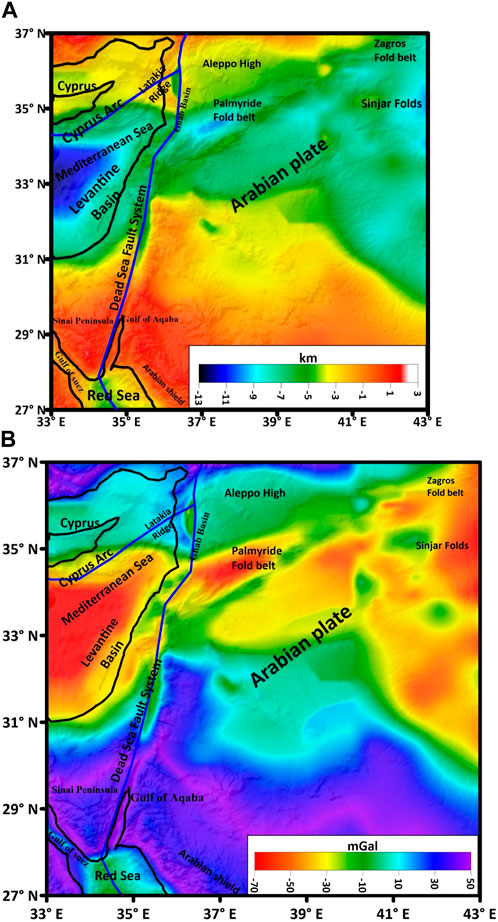
FIGURE 4. (A) Top boundary (in km) of basement rocks (modified after Michel Rybakov, 2004; Jassim and Goff, 2006); (B) gravitational attraction of this boundary in mGal.
The result obtained for gravitational Bouguer anomaly
Gómez-Ortiz and Agarwal (2005) modified the Parker–Oldenburg iterative method to construct a Moho map under the eastern Mediterranean study area by inverting the gravity anomaly along the horizontal density interface geometry. This code was modified again because it misused Parker’s formula by giving incorrect forward and inversion results (Gao & Sun, 2019).
This technique depends on the Fourier transform for the topography interface, the gravity anomaly, and the relationship between them. Many authors have established methods to determine Moho depth (e.g., Cordell & Henderson, 1968; Rao et al., 1990).
Eq. 5 represents the Fourier transform of gravity data (Parker, 1973) in a one-dimensional direction as
The depth to the uneven interface is computed using MATLAB code with several iterative procedures based on Oldenburg’s (1974) equation.:
where
The inversion needs to set parameters that are z0 in km, which is the mean Moho depth, with
The root mean square error (RMS) can be calculated using the following formula:
where M and N stand for the grid size and t means the iteration step.
A low-pass filter is used during the process to assure the convergence of the inversion steps in the equation (Oldenburg, 1974):
for
Figure 4B shows the forwarding results of the compiled crystalline basement depth data generated by applying Granser’s method (1987a) to compute the gravitational effect between the Cenozoic sediment and the basement (Pham et al., 2018). The exponential decrease in density contrast with depth
We removed the gravity effect of the Cenozoic sediments
The obtained data still have high-frequency anomalies resulting from shallow blocks, so they were removed by a low-pass filter to eliminate the gravitational effect of shallow blocks
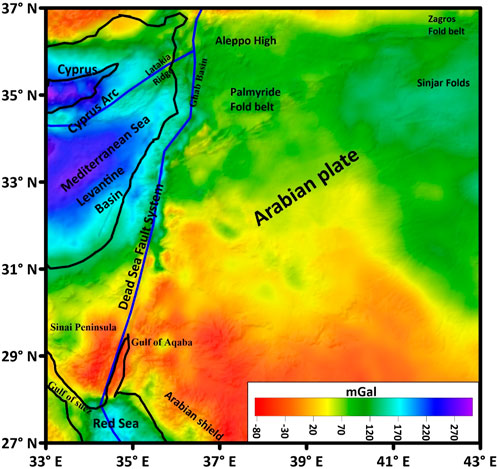
FIGURE 5. Observed gravity anomaly (in mGal) resulting from Moho topography after removing the gravitational effect of Cenozoic sedimentary and shallow blocks.
The inversion needs parameters of z0 = 32 km, where the mean Moho depth used the inversion procedure reported by Koulakov & Sobolev (2006) for the eastern Mediterranean study region,
The sum of the columns and rows is 301 × 301. The truncation window data length was chosen as 10% of the extended data length.
The inversion procedures needed 10 iterations to compute the anomalies and calculate the desired Moho depth. In the last step of the inversion, the RMS error was 0.009 according to Eq. 7.
Figure 6 shows the Moho discontinuity depth resulting from the inversion of Bouguer gravity anomalies corrected for the gravity effect of the sediment–basement (Figure 5). The Moho depth ranges from 12–48 km over the study area (Figure 6). The maximum values tending toward the south under the western Arabian shield determine the deep roots beneath those chains; the minimum depth is observed in western Syria beneath the Mediterranean Sea.

FIGURE 6. Map of Moho depth (in km) computed by applying 3D inversion MATLAB code.
The minimum Bouguer anomalies coincide with the high mountains over the western Arabian shield, Palmyride in central Syria, and the Zagros chains. Crustal thickness plays an important role in the increase and decrease of Bouguer anomaly values. The Moho depths reached more than 44 km beneath the western Arabian shield and more than 35 km in central Syria, where the Palmyride is located. The low Moho depth tends toward western Syria, reaching less than 15 km—except under Cyprus and the Eratosthenes seamount because of the overlying continental crust.
The prominent tectonic features in Syria are a result of the separation of the Arabian plate from the African plate, which created the increase and decrease of Moho depth and may be associated with the Neo-Tethys Ocean.
Figure 4A illustrates the top boundary between the Cenozoic sediment and basement blocks, while its gravity effect is constructed by applying Granser’s (1987a) forward method with contrast density decreasing exponentially with the depth (Figure 4B).
The Bouguer gravity anomaly in Figure 4B increases to the south in the Red Sea with a value of approximately 35 mGal. It is relatively reduced to −50 mGal in central Syria (Palmyria) and in eastern Syria close to the Syria–Iraq border. It reaches a maximum of approximately 35 mGal at the northern Mediterranean Sea.
The Moho gravity effect after correction by removing the gravity anomaly of the sedimentary–basement boundary and shallow blocks is presented in Figure 5. The anomaly ranges between −60 mGal and 300 mGal. We note the negative anomalies centered beneath the western Arabian shield chains while the maximum values are located in the Mediterranean Sea. The gravity anomaly values range from 100–150 mGal in Syria. These data will be used in the inversion process to obtain the Moho depth under the eastern Mediterranean Sea.
A comparison of the two maps in Figures 5, 7 shows good agreement where the gravity anomaly values are almost the same, especially in the northeast. The inverted Bouguer anomaly coincides with the theoretical gravity data at many parts of the study region. The RMS error was just 0.009 mGa l with few differences.
FIGURE 7. Map of gravity anomaly (in mGal) computed from the 3D Moho relief map derived from the present inversion process.
There are two unique regions in the Mediterranean Sea that have a great Moho depth: 22 km under Cyprus at 33.5 E, 35 N and 27 km at 33 E, 33.5 N beneath the Eratosthenes seamount, and toward the south in the Mediterranean Sea; the great Moho depth here is because of continental crust (Netzeband et al., 2006).
The maximum values of Moho depth are located in the east toward the destructive margin of the Arabian plate, while the minimum depths are at the constructive margin near the Red Sea.
The Moho depth values range from approximately 16 km to 40 km; the lowest value is observed in the eastern Mediterranean Sea and near the Red Sea with constructive edges, and the highest value appears in the northeastern corner of the investigation area with destructive edges.
Moho depth in Syria has an extended trend between 27 and 32 km. A large part of the Arabian region has a value between 30 and 35 km, which represents the mantle–crust boundary in the Arabian area, especially in the southeastern corner. The maximum value reaches 40 km in south Turkey near northeastern Syria. The Bouguer gravity anomaly in the southern part of the DSFS is very small, representing deep Moho depth variations caused by left-lateral movement along the fault (Group. et al., 2004). From north to south alongside the DSFS, where the Ghab depression is considered an extended graben of the Dead Sea rift, the Moho depth has a small value ranging from 27–29 km, decreasing toward offshore and increasing to the east, in agreement with Segev et al. (2006).
It is clear that the crustal thinning is to the north of the Red Sea under the Mediterranean Sea; north of 36 N, the crustal thickness increases to more than 40 km in the western corner of the map. The lowest Moho depth value in the study area is observed to be approximately 16 km at 33 N on the eastern Mediterranean coast.
The Moho depth from Lebanon in the south along the Mediterranean coast varies from 27 km to 32 km in the north (Bekaa) and increases toward eastern Syria, which agrees with Tiberghien (1974). The higher gravity anomaly along the Lebanon coast and the Levant basin means a higher Moho depth due to tectonic forces and active dynamism (Segev et al., 2006). The Moho depth beneath the Palmyride is approximately 37 km and may be caused by a high density penetrated body (Barazangi et al., 1993).
A comparison between the north-east of Syria and the southern Syrian boundaries shows an increase in the south approaching 33 km and a decrease in the north of approximately 27 km, while the increment toward the east of Syria near the Iraqi border reaches more than 30 km and continues beneath the Zagros Mountains in the northern Arabian boundaries with Iran.
The sediments in the Arabian shield are not evident (Seber et al., 2000). Triassic rifting plays a major role in the depth of the Moho in Palmyride in central Syria (Brew et al., 2003). Under the Arabian shield, the Moho depth was too deep at approximately 48 km, in agreement with Mooney et al. (1985) who provide a seismic velocity of 8 km.s-1.
It is clear that there is a sharp and major difference of the Moho depth between offshore and onshore areas on the inversion and seismological maps. Both maps coincide with the shallowing of the Moho depth toward the west of the DSFS beneath the Mediterranean Sea. Both maps show the same tendency of increment and shallowing in Moho depths in the study region. Moho depth increases under eastern Syria to approximately 37 km toward the destructive margin of the eastern boundaries of the Arabian with the Eurasian Plate. On the other hand, the decrease in the southern DSFS under the Red Sea is approximately 27 km, at the constructive margin of the Arabian Plate. The Moho depth decreases west of the DSFS under the Mediterranean Sea, except under the two unique continental regions of Cyprus and the Eratosthenes seamount (roughly 28 km).
In comparing the Moho depth results obtained by seismic data (Koulakov and Sobolev, 2006) in Figure 8A and gravity data we inverted (Figure 6), the Moho depth, seismically calculated, ranges between 15 and 42 km, where the maximum values of 42 km are located near the Red Sea and in the northern Mediterranean Sea to the south of Turkey, with the minimum of approximately 15 km in western Syria.
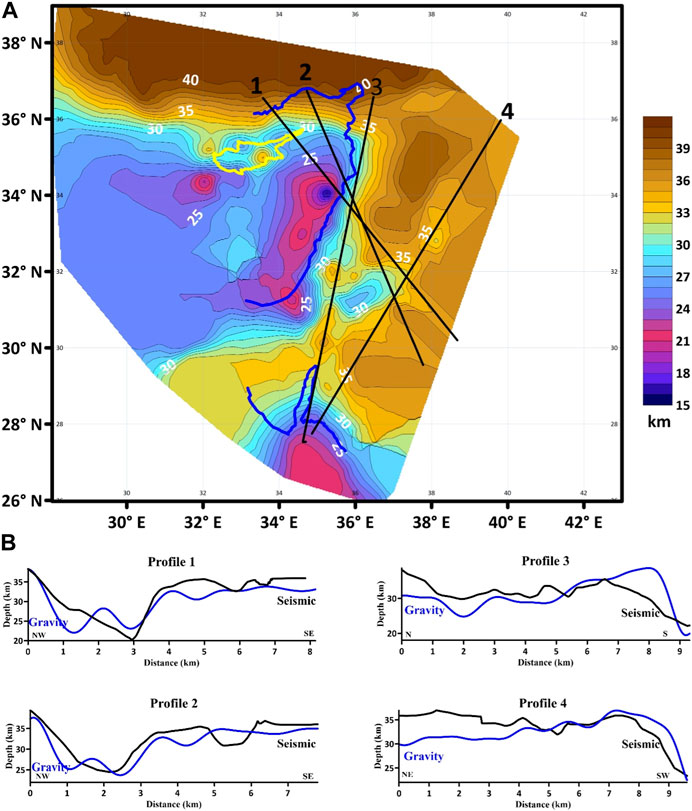
FIGURE 8. Comparison between Moho gravity depth and seismic Moho depth. (A) Seismic Moho depth map (in km) modified after Koulakov & Sobolev (2006); (B) profiles of both Moho gravity depth (blue color) and seismic Moho depth (black color).
Four profiles are plotted to compare the Moho discontinuity inverted from seismological and gravity data. In the first profile, we see the compatibility of two profiles, where seismic and gravity data give the same Moho depth value of 39 km under the northern Mediterranean Sea. Both profiles continue fluctuating, matching well (Figure 8). In the second profile, the Moho depth given by seismic and gravity data is almost the same as in the first profile.
We can observe the difference in the third and fourth profiles. Even though both have different starting points, they share with the end point the inversion of the same Moho depth. The unique feature in the third profile is that it is located along the DSFS from north to south; when the DSFS approaches Turkey, gravity and seismological data give different Moho depths while giving the same results along this fault.
In central Syria (Palmyride fold belt), we can find the coincidence between gravity and seismic results where the Moho depth value is 37 and 38 km, respectively, while, in western Syria, the Moho depth minimum is 15 km.
Despite the similarity of the Moho depth in the two maps, there is a still difference where the seismic Moho depth is deeper than the Bouguer Moho depth. This difference is not standard, varying from 2 km in central Syria to 5 km under the Mediterranean Sea due to density contrast over the study area, so the results obtained from gravity data could be changed by a change in this contrast. This comparison is thus very important.
The average crustal thickness is over 42 km in the southern and eastern continental parts of Syria, whereas, in the south where the western Arabian shield is located, a minimum thinning of the crust is observed in the western part of Syria beneath the Mediterranean Sea ranging 15–18 km. This may be a result of the increased density contrast in the Mediterranean Sea. The results obtained by seismic and gravity data corroborate the high Moho depths located in the continental areas beneath the Palmyride, Zagros Mountains, and the western Arabian shield, while the low Moho depth values in the Mediterranean Sea are because of the ocean crust and high density.
We have applied the 3DINVER program developed in a MATLAB environment using the Parker–Oldenburg method to determine the Moho depth inverted from the Bouguer gravity anomaly with many iterations. Prior to executing the inversion process, we conducted some corrections to remove the gravity effect of the sedimentary–basement boundary by forward modeling Granser’s (1987a) method that takes into account the variation of density contrast exponentially with the depth.
It is clear that there is a sharp and major difference in Moho depth between offshore and onshore areas, confirmed by the inversion of the seismological and gravity data. Both maps coincide with the shallowing of Moho depth toward the west of the DSFS toward the Mediterranean Sea because of the ocean crust and high density. Both maps give the same tendency of increment and shallowing in Moho depths in the study region. The computed Moho depth ranging from 16 km to 40 km coincides with results obtained from seismic data. The deepest Moho depth was beneath the Arabian shield, with an approximate value of 40 km. The Moho depth increases over the eastern Mediterranean Sea toward eastern Syria near the Iraqi border with a maximum value of 42 km and may continue toward the destructive margin of the eastern edges of the Arabian and Eurasian plates. Conversely, the Moho depth decreases in the western Dead Sea rift under the Mediterranean Sea due to the thinning of the oceanic crust. However, an exception is observed beneath Cyprus and the Eratosthenes seamount because of the continental crust, with a maximum depth of approximately 30 km. This research sheds light on the variations in Moho depth across the region, providing valuable insights into the geophysical characteristics of the region.
In this research, we have not only analyzed the Moho depth variations but have also used the density contrasts, which play a crucial role in understanding the geodynamics and seismogenic nature of the northwestern Arabian plate. This study provides valuable insights into the composition and structure of the lithosphere, which directly influences the geodynamic behavior of the region. In the study area, density contrasts are influenced by several factors, including the presence of both continental and oceanic crust, variations in crustal thickness, and the distribution of different rock types. The variations in Moho depth across the northwestern Arabian plate provide critical insights into the geodynamics and seismogenic nature of the region. The study highlights the importance of considering both depth and density contrasts when investigating the complex tectonic processes and seismic activity in the area. Further study in this field will help expand our understanding of the geophysical characteristics of the region and contribute to better hazard assessment and mitigation strategies (Dyrelius and Vogel, 1972; Sawaf et al., 1990).
The original contributions presented in the study are included in the article/Supplementary Material; further inquiries can be directed to the corresponding authors.
Conceptualization, FH and CC; methodology, FH, AK, HA, and IA; software, FH, MT, and IA; validation, CC and NA; formal analysis, FH, MT, HA, and AK; investigation, CC; resources, CC; data curation, FH, MT, and AK; writing—original draft preparation, FH, CC, and AK; writing—review and editing, FH, CC, HA, and MT; visualization, CC and NA; supervision, CC; project administration, CC; funding acquisition, CC and NA. All authors contributed to the article and approved the submitted version.
The publication fees were paid gratefully by Lulea University of Technology (Sweden). This work was supported by Natural Science Foundation of China (Nos. 42174090 and 41604060), the MOST Special Fund from the State Key Laboratory of Geological Processes and Mineral Resources (MSFGPMR2022-4), China University of Geosciences.
The authors express many thanks to Qing Liang, Jinsong Du, and Dr. Shida Sun for their sincere criticisms and helpful advice during this research. Thanks are due to Prof. Jamal Abou-deeb of Damascus University for revising the manuscript. This work was supported by the National Natural Science Foundation of China (No. 41604060). The gravity data of the investigated region were acquired from the Earth Geopotential Model EGM2008 estimated from altimetry missions, ground data, and GRACE satellite mission (Pavlis et al., 2013) with resolution (1′ × 1′) shown in Figure 2.
The authors declare that the research was conducted in the absence of any commercial or financial relationships that could be construed as a potential conflict of interest.
All claims expressed in this article are solely those of the authors and do not necessarily represent those of their affiliated organizations, or those of the publisher, the editors, and the reviewers. Any product that may be evaluated in this article, or claim that may be made by its manufacturer, is not guaranteed or endorsed by the publisher.
Barazangi, M., Seber, D., Chaimov, T., Best, J., Litak, R., Al-Saad, D., et al. (1993). Tectonic evolution of the northern Arabian Plate in western Syria. Recent Evol. Seismicity Mediterr. Region, 117–140. doi:10.1007/978-94-011-2016-6_5
Ben-Avraham, Z. (1985). Structural framework of the Gulf of elat (Aqaba), northern Red Sea. J. Geophys. Res. 90 (B1), 703–726. doi:10.1029/JB090iB01p00703
Ben-Avraham, Z., Ginzburg, A., Makris, J., and Eppelbaum, L. (2002). Crustal structure of the Levant basin, eastern mediterranean. Tectonophysics 346 (1–2), 23–43. doi:10.1016/S0040-1951(01)00226-8
Blakely, R. (1995). Potential theory in gravity and magnetic applications. Cambridge, UK: Cambridge University Press.
Brew, G., Barazangi, M., Sawaf, T., and Al-Maleh, K. (2000). “A new tectonic map of Syria and surrounding regions,” in 4th Middle East Geosciences Conference GEO, Manama, Bahrain, February 2000.
Brew, G., Best, J., Barazangi, M., and Sawaf, T. (2003). Tectonic evolution of the NE Palmyride mountain belt, Syria: The bishri crustal block. J. Geol. Soc. 160 (5), 677–685. doi:10.1144/0016-764902-161
Chakravarthi, (2003). Digitally implemented method for automatic optimization of gravity fields. US6615139B1, 2.12
Chakravarthi, V., Pramod Kumar, M., Ramamma, B., and Rajeswara Sastry, S. (2016). Automatic gravity modeling of sedimentary basins by means of polygonal source geometry and exponential density contrast variation: Two space domain based algorithms. J. Appl. Geophys. 124, 54–61. doi:10.1016/j.jappgeo.2015.11.007
Cordell, L., and Henderson, N. D. G. (1968). Iterative three dimensional solution of gravity anomaly data using a digital computer. Geophysics 33, 596–601. doi:10.1190/1.1439955
Dyrelius, D., and Vogel, A. (1972). Improvement of convergency in iterative gravity interpretation. Geophys. J. R. Astronomical Soc. 27 (2), 195–205. doi:10.1111/j.1365-246X.1972.tb05771.x
Gao, X., and Sun, S. (2019). Comment on “3DINVER.M: A matlab program to invert the gravity anomaly over a 3D horizontal density interface by parker-oldenburg’s algorithm”. Comput. Geosciences 127, 133–137. doi:10.1016/j.cageo.2019.01.013
Gardner, G. H. F., Gardner, L. W., and Gregory, A. R. (1974). Formation velocity and density—The diagnostic basics for stratigraphic traps. Geophysics 39 (6), 770–780. doi:10.1190/1.1440465
Garfunkel, Z. (1998). Constrains on the origin and history of the Eastern Mediterranean basin. Tectonophysics 298 (1–3), 5–35. doi:10.1016/S0040-1951(98)00176-0
Gómez-Ortiz, D., and Agarwal, B. N. P. (2005). 3-3DINVER.M: A matlab program to invert the gravity anomaly over a 3D horizontal density interface by parker-oldenburg’s algorithm. Comput. Geosciences 31 (4), 513–520. doi:10.1016/j.cageo.2004.11.004
Granser, H. (1987). U S I N G a N exponential density-depth. Tulsa, Oklahoma: Seg Library, 1030–1041.
Group, D., Weber, M., Abueladas, A., Agnon, A., Babeyko, A., Bartov, Y., et al. (2004). The crustal structure of the Dead Sea transform. Geophys. J. Int. 156, 655–681. doi:10.1111/j.1365-246X.2004.02143.x
Koulakov, I., and Sobolev, S. V. (2006). Moho depth and three-dimensional P and S structure of the crust and uppermost mantle in the Eastern Mediterranean and Middle East derived from tomographic inversion of local ISC data. Geophys. J. Int. 164, 218–235. doi:10.1111/j.1365-246X.2005.02791.x
Mechie, J., Ben-avraham, Z., Weber, M. H., Götze, H., Koulakov, I., Mohsen, A., et al. (2013). The distribution of Moho depths beneath the Arabian plate and margins. Tectonophysics 609, 234–249. doi:10.1016/j.tecto.2012.11.015
Michal Rosenthal, A. S. (2015). 1-The deep structure and density distribution of northern Israel and its surroundings. Report No.: GSI/12/2015.
Mooney, W. D., Gettings, M. E., Blank, H. R., and Healy, J. H. (1985). Saudi arabian seismic-refraction profile: A traveltime interpretation of crustal and upper mantle structure. Tectonophysics 111 (3–4). doi:10.1016/0040-1951(85)90287-2
Murthy, I. V. R. (1979). Gravity anomalies of two-dimensional bodies of irregular cross-section with density contrast varying with depth. Geophysics 44. doi:10.1190/1.1441023
Netzeband, G. L., Gohl, K., Hübscher, C. P., Ben-avraham, Z., Dehghani, G. A., Gajewski, D., et al. (2006). Levantine Basin — crustal Struct. Orig. 418, 167–188. doi:10.1016/j.tecto.2006.01.001
Oldenburg, (1974). The inversion and interpretation of gravity anomalies. Geophysics 39 (4), 526–536. doi:10.1190/1.1440444
Parker, R. L. (1973). The rapid calculation of potential anomalies. Geophys. J. R. Astronomical Soc. 31, 447–455. doi:10.1111/j.1365-246X.1973.tb06513.x
Pavlis, N. K., Holmes, S. A., Kenyon, S. C., and Factor, J. K. (2013). Erratum: Correction to the development and evaluation of the Earth gravitational model 2008 (EGM2008). J. Geophys. Res. Solid Earth 118 (5), 2633. doi:10.1002/jgrb.50167,2013
Pham, T. P., Oksum, E., and Do, T. D. (2018). GCH_gravinv: A MATLAB-based program for inverting gravity anomalies over sedimentary basins. Comput. Geosciences 120, 40–47. doi:10.1016/j.cageo.2018.07.009
Rao, D. B., Prakash, M. J., and Babu, N. R. (1990). 3D and 2½ D modelling of gravity anomalies with variable density contrast. Geophys. Prospect. 38 (4), 411–422. doi:10.1111/j.1365-2478.1990.tb01854.x
Rybakov, M. (2004). 4-Top of the crystalline basement in the Levant. J. Metrics, 1–8. doi:10.1029/2004GC000690
Sawaf, T., Gebran, A., and Resources, M. (1990). Crustal shortening in the Palmyride fold belt, Syria, and implications for movement along the Dead Sea fault system. Tectonics 9 (6), 1369–1386. doi:10.1029/TC009i006p01369
Seber, D., Steer, D., Sandvol, E., Sandvol, C., Brindisi, C., and Barazangi, M. (2000). Design and development of information systems for the geosciences: An application to the Middle East. Geoarabia 5 (2). doi:10.2113/geoarabia0502269
Segev, A., Rybakov, M., Lyakhovsky, V., and Hofstetter, A. (2006). The structure, isostasy and gravity field of the Levant continental margin and the southeast Mediterranean area the structure. isostasy gravity field Levant Cont. margin southeast Mediterr. area 425. doi:10.1016/j.tecto.2006.07.010
Sharkov, E. V. (1997). The el-ghab rift depression in Syria: Its structure, stratigraphy, and history of development. Stratigr. Geol. Correl.5 (4), 362–374.
Silva, J. B., Costa, D. C., and Barbosa, V. C. (2006). Gravity inversion of basement relief and estimation of density contrast variation with depth. Geophysics 71 (5), J51–J58. doi:10.1190/1.2236383
Spector, , and Grant, (1970). Statistical models for interpreting aeromagnetic data. GEOPHYSICS 35 (2), 293–302. doi:10.1190/1.1440092
Keywords: basement boundary, eastern Mediterranean Sea, gravity inversion, Moho depth, Bouguer gravity
Citation: Harash F, Khalaf A, Al-Ansari N, Chen C, Alrawi I, Al-Khafaji H and Tageldin M (2023) Local Moho distribution in the eastern Mediterranean region from gravity inversion: eastern Mediterranean Sea. Front. Earth Sci. 11:1195485. doi: 10.3389/feart.2023.1195485
Received: 28 March 2023; Accepted: 18 May 2023;
Published: 05 June 2023.
Edited by:
Filippo Greco, National Institute of Geophysics and Volcanology (INGV), ItalyReviewed by:
Alessandra Borghi, National Institute of Geophysics and Volcanology (INGV), ItalyCopyright © 2023 Harash, Khalaf, Al-Ansari, Chen, Alrawi, Al-Khafaji and Tageldin. This is an open-access article distributed under the terms of the Creative Commons Attribution License (CC BY). The use, distribution or reproduction in other forums is permitted, provided the original author(s) and the copyright owner(s) are credited and that the original publication in this journal is cited, in accordance with accepted academic practice. No use, distribution or reproduction is permitted which does not comply with these terms.
*Correspondence: Fayez Harash, Zi5oYXJhc2hAaG90bWFpbC5jb20=; Nadhir Al-Ansari, bmFkaGlyLmFsYW5zYXJpQGx0dS5zZQ==
Disclaimer: All claims expressed in this article are solely those of the authors and do not necessarily represent those of their affiliated organizations, or those of the publisher, the editors and the reviewers. Any product that may be evaluated in this article or claim that may be made by its manufacturer is not guaranteed or endorsed by the publisher.
Research integrity at Frontiers
Learn more about the work of our research integrity team to safeguard the quality of each article we publish.