- State Key Laboratory of Coal Mine Safety Technology, China Coal Technology and Engineering Group Shenyang Research Institute, Shenfu Demonstration Zone, Fushun, China
The spontaneous combustion of residual coal in the gob seriously threatens the safety of coal mining. Injecting CO2 into the gob not only prevents the residual coal from spontaneous combustion but also realizes CO2 storage in the mined areas. Injection flux and burial depth of the port are crucial for CO2-preventing fire in coal mine gobs. In this study, the distribution of the oxidation zone in the Tanyaoping coal mine was field-measured, and the coal oxidation kinetic model was built by the adiabatic test. Then, a 3-D mathematical model was constructed based on the conditions of the 5011 working face by COMSOL Multiphysics. Furthermore, the coupled effects of the two factors on the distribution of the oxidation zone were investigated. Increases in both injection flux and burial depth result in a decrease in the oxidation zone volume. The reasonable ranges of the injection flux and burial depth are 540–720 m3 h-1 and 30–40 m, respectively. These results provide some guidelines on how to prevent the spontaneous combustion of residual coal in mine gobs.
1 Introduction
China is the largest producer of coal in the world. Coal mining normally faces several types of accidents that can cause environmental disruption, fatalities, and equipment loss (Zhang et al., 2021; Li et al., 2022). The reaction between coal and O2 at low temperatures usually results in spontaneous combustion and uncontrolled coal fires (Zhang et al., 2023). During underground coal mining, spontaneous combustion of residual coal in the mine gob often leads to a wide range of secondary disasters, such as methane explosions, carbon monoxide generation, and ventilation disorders. The oxidation process of residual coal in the gob is extremely complex. High-mechanized technology, especially coal caving mining, results in considerable coal resources left in the gob. However, it is necessary to keep enough fresh air through the airways and working face for human survival and methane dilution. Therefore, the residual coal in the gob is exposed to continuous O2 and has the possibility of spontaneous combustion. The hazardous areas of self-ignition in the gob depend on many factors, such as air leakage, thickness of residual coal, and the advanced rate of the working face (Zhu and Wen, 2023). Normally, the “three zones” (the cooling zone, oxidation zone, and suffocation zone) in the gob are determined based on the distribution of O2 concentration in the gob area (Ma et al., 2020).
Spontaneous combustion of coal is influenced by coal oxidation reactions, heat accumulation, and the characteristics of porous media (Si et al., 2021). Therefore, many technical solutions were presented to prevent coal from spontaneous combustion and inhibit coal fire, which normally focus on two aspects: isolating coal active sites from O2 and cooling the temperature (Dou et al., 2022). The present strategies can be broadly classified as uniform pressure ventilation (Lu et al., 2017), grouting (Zhang et al., 2018), spray inhibitors (Lu et al., 2020; Sun et al., 2022), pumping inert gas (Zhu and Wen, 2023), and injecting gel foam or gel (Lu et al., 2018; Lu et al., 2021; Han et al., 2022; Huang et al., 2022). CO2 is an inert gas and can dilute the O2 concentration and protect the coal from heat release. Furthermore, broken coal can absorb CO2 and thus saved from oxidation (Guan et al., 2018). With the advancement of the working face, the volume of the mine gob increases. The resistance of internal airflow is small, and the porosity is large. Thus, the coal mine gob is an ideal location for storing CO2. Injecting CO2 into the gob can achieve the dual benefits of fire prevention and CO2 storage.
This study is based on the actual conditions of the 5011 working face of the Tanyaoping coal mine. To achieve the fire prevention of residual coal in the gob by injecting CO2, the oxidation zone was calculated by mathematical simulation using COMSOL Multiphysics. This simulated result without CO2 injection was verified to be reasonable by comparing it with the field measurement. By studying the effect of the injection flux and burial depth of the injection port on the oxidation zone, the superior injection parameters were determined.
2 Overview of the 5011 working face
The Tanyaoping coal mine is located in Lvliang city, China. The recoverable coal seams consist of 5# and 10# coal seams. The 5011 working face is in coal seam 5# and adopts the “U” ventilation method. Coal seam 5# is the main production seam and is around 4.4 m thick. The width and design length are 180 and 2,000 m, respectively. The width and height of the intake and return airways are 5 and 4.5 m, respectively. The thickness of the residual coal that remains in the mined area, that is, the gob, is about 0.4 m. The mined coal has a spontaneous combustion tendency.
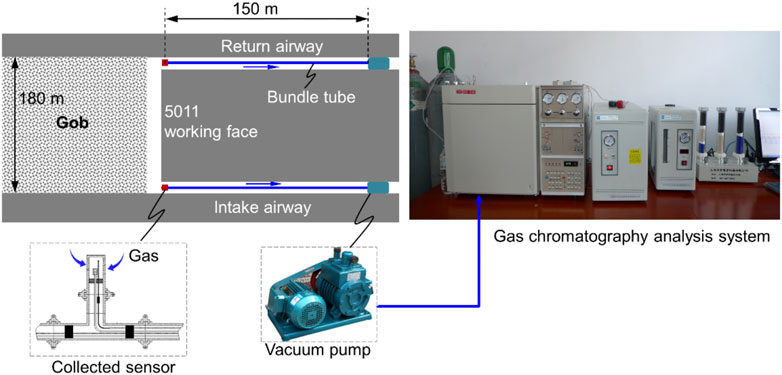
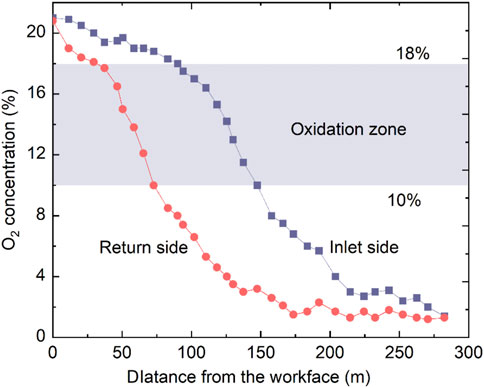
As shown in Figure 1, two sensors were fixed in the intake and return airways to collect the gas. The monitoring system was based on the measurement of bundle tubes. With the advancement of the working face, O2 concentrations at different buried depths were drawn out through the bundle tubes using a vacuum pump. A gas chromatography analysis system was used to analyze the O2 concentrations of the collected bags. Figure 2 shows the measured O2 concentration values in the intake and return airways. The O2 concentrations at the observation points decrease with increasing buried depth. According to the actual condition and other studies, the “three zones” were divided by using an O2 concentration of 10%–18% (Ma et al., 2020). The O2 concentration at the point in the intake airway decreased to 18% and 10% at 90 and 147 m, respectively. For the measured point in the return airway, the buried depths of O2 concentrations of 18% and 10% are 30 and 73 m, respectively. Normally, there are three parameters to determine the “three zones” in the gob: the air leakage velocity, O2 concentration, and heating rate (Deng et al., 2018). However, the O2 concentration is the most accessible and was, therefore, applied in this study to judge the oxidation zone.
3 Coal oxidation kinetic model
Coal exothermic processes under low temperatures include three forms: physical adsorption, chemical adsorption, and chemical reactions (Liang et al., 2021). Chemical adsorption and chemical reactions are recognized as the main reasons for promoting the self-heating of coal under low temperatures (Zhang et al., 2019; Qu et al., 2023). Although partially active functional groups are self-reacting, a significant amount of heat will be released from the coal–O2 reaction. Therefore, a linear relationship between the O2 consumption rate and heat generation rate is generally considered to exist, expressed as follows:
where q is the heat generation rate of the coal reaction (W·m−3); ΔH is the coal oxidation heat (J·mol−1); and r is the O2 consumption rate (mol·m−3⋅s−1).
Based on the coal oxidation dynamics theory, another major influence on coal oxidation is temperature, which increases, causing the activation of functional groups, i.e., the exothermic intensity increases with increasing temperature. Most of the models on O2 consumption in the previous studies were based on the Arrhenius equation, expressed as follows:
where A is the pre-exponential factor (s−); E is the activation energy (J·mol−1); R is the gas constant (8.314 J mol−1⋅K−1); co is the O2 concentration (%); and T is the temperature (K). The kinetic parameters in Equation 2 are normally obtained from the adiabatic oxidation test.
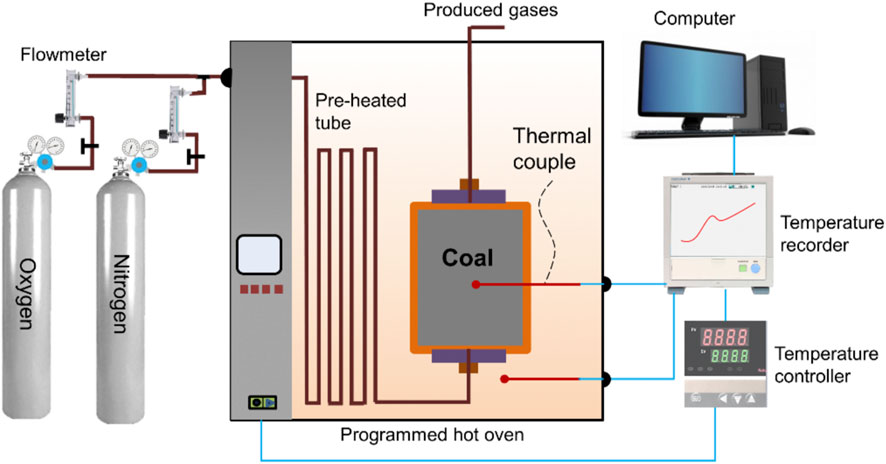
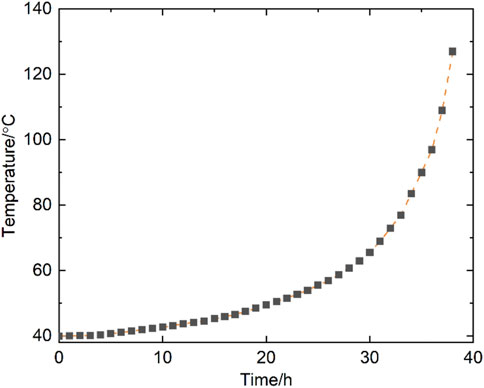
As shown in Figure 3, the coal sample was mined from the 5011 working face of the Tanyaoping coal mine. Moisture, ash, volatile matter, and fixed carbon of coal are 7.64, 2.21, 26.24, and 63.19, respectively. Elements of C, H, O, and N of coal are 63.61, 4.86, 0.81, and 30.69, respectively. Approximately 220 g of coal particles (0.2–0.45 mm) were prepared and naturally filled into the reaction vessel. The sample was dried in N2 at 105°C for 5 h and then cooled to 40°C under a N2 atmosphere (Wang et al., 2010). Once the temperature was stable, the mixed gases with 21% O2 were injected into the reaction vessel at 10 mL min−1. It should be ensured that the oven temperature is synchronized with the coal temperature using the temperature controller. The change in coal temperature over time was recorded using the recorder for later analysis. Figure 4 shows the temperature profile versus time of the adiabatic oxidation test.
Under the adiabatic conditions, the coal sample was subjected to accelerated self-oxidation so that the heat released in the last step was completely converted to internal energy, which can be described by Equation 3 as follows:
where ρc is the density of coal (kg·m−3) and Cpc is the specific heat capacity of coal (J·kg−1⋅K−1). Equation 4 can be rearranged by taking the natural logarithm, which is expressed as follows:
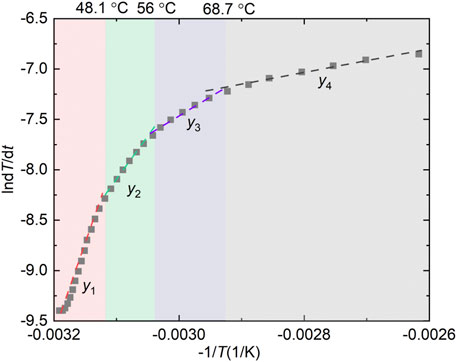
The relationship between lndT/dt and −1/T shown in Figure 5 is a nonlinear positive correlation, which does not follow the standard Arrhenius equation, and this phenomenon also appears in other studies (Zhang et al., 2020; Yoruk and Arisoy, 2022). It is difficult to fit the curve with one or two straight lines. The curve was divided into four stages with three break points of 48.1, 56, and 68.7°C. In each stage, lndT/dt and −1/T exhibit good linearity, as shown in Equation 1. The slope of the fitting line in each stage presents the value of -E/R, and the intercept is the value of lnΔHAc0/ρcCpc. The apparent activation energies of the four stages are 143.25, 57.45, 32.89, and 19.48 kJ mol−1, respectively. Accordingly, the pre-exponential factors of the coal sample are 2.53×10²⁰, 2.83×10⁶, 358.31, and 3.2 s−1, respectively. In the numerical calculation, different E and A are invoked based on the coal temperature for the heat generation model.
4 Numerical simulation
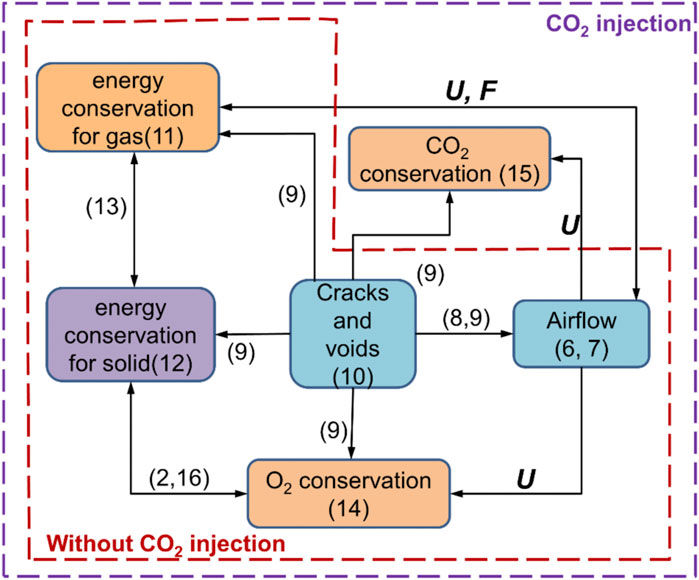
The process of spontaneous combustion of residual coal in the gob area will involve heat transport and generation, O2 consumption and transport, CO2 emission and migration, and gas airflow. As shown in Figure 6, all the involved equations are interrelated based on the fluid-solid-thermal coupling (Xia et al., 2016; Zhang et al., 2019; Qi et al., 2021). The continuity equation and the momentum conservation equation are as follows:
where ρg is the density of air (kg·m−3); ε is the porosity of gob; t is the time (s); U is the seepage air velocity vector (m·s1); p is the static pressure (Pa); τ is the stress tensor (Pa); μ is the air viscosity (Pa s); K is the permeability (m2); and F is the gravitational body force (N·m−3).
The relationship between porosity and permeability is expressed as
where d is the particle size (mm). With the working face advanced, the stress status of overlying strata is damaged, and the roof-bed formation collapses. The overlying strata are vertically divided into a caving zone, fissure zone, and bent deformation zone based on the differences in the balance status and re-compaction degree of the damaged strata (Qin et al., 2016). Therefore, it is a significant challenge to build mathematical models with reasonable permeability and porosity in the gob area. According to the observation of the mine pressure, the compaction bulking factor, k, of the gob follows the law (Xia et al., 2015):
where kp,min and kp,max are the initial bulking factors before and after compacting in the gob area, respectively, (1.15 and 1.5). a0 and a1 are the decay ratios of the bulking factor in the dip and strike directions of the working face, respectively, (0.268 and 0.0368 m−1). d0 and d1 are the distances between the point (x,y) in the gob and the working face and coal pillar, respectively. ξ1 is the adjustment factor controlling the distribution pattern of the model, 0.233.
The local thermal non-equilibrium is considered in the energy equation of conservation, which is given by
where Cpg is the specific heat capacity of air (J·kg−1·K−1); λg and λc are the thermal conductivities of air and coal, respectively (W·m−1·K−1); Tg and Tc are the temperatures of air and coal, respectively (K); qo is the heat generation rate of coal (W·m−3) obtained using Equation 3; qgc is the solid–gas heat exchange around coal particles (W·m−3), which has
where hgc is the convective heat transfer coefficient (W·m−2⋅K−1), indicating the heat exchange between coal and pore air; a is the specific surface area, that is, the exposed area of coal particles per unit volume (m-1).
O2 conservation is a unique consideration without CO2 injection. However, we must consider the conservation of O2 and CO2 for fire prevention by injecting CO2 into the gob, which is expressed as follows:
where cm is the concentration of CO2 (mol·m-3); Do and Dm are the effective diffusivities of O2 and CO2, respectively (m2·s−1); and ro is the O2 consumption rate (mol·m−3⋅s−1). rm is the CO2 generation rate (mol·m−3⋅s−1) of coal oxidation, whose ratio to ro is 0.1 (Taraba et al., 2014). The oxidation reaction of residual coal in the gob is affected by working face advance. Based on Equation 2, ro can be expressed as
where w is the influence coefficient of working face advance.
In addition, to ensure the normal operation of modeling, the following main assumptions are supplemented (Ma et al., 2020; Zhang et al., 2022):
(i) The effects of moisture transport and evaporation are not considered.
(ii) Thermal conductivity and heat capacity of coal and gas are independent of other parameters.
(iii) The transfer of heat in the gob merely involves convection and conduction, and the radiative transfer is not taken into account.
(iv) The gas in the gob is incompressible.
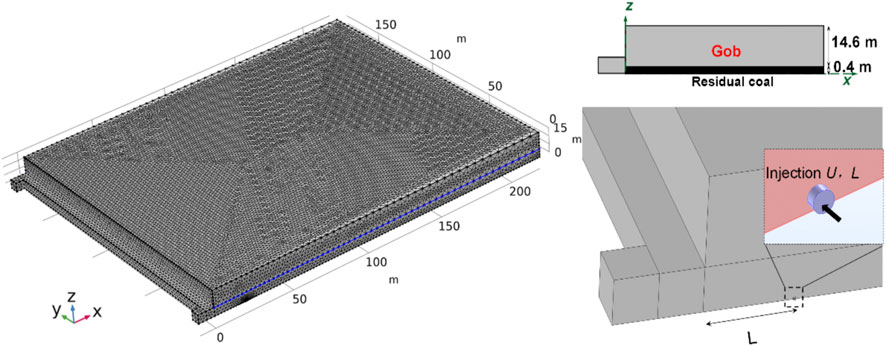
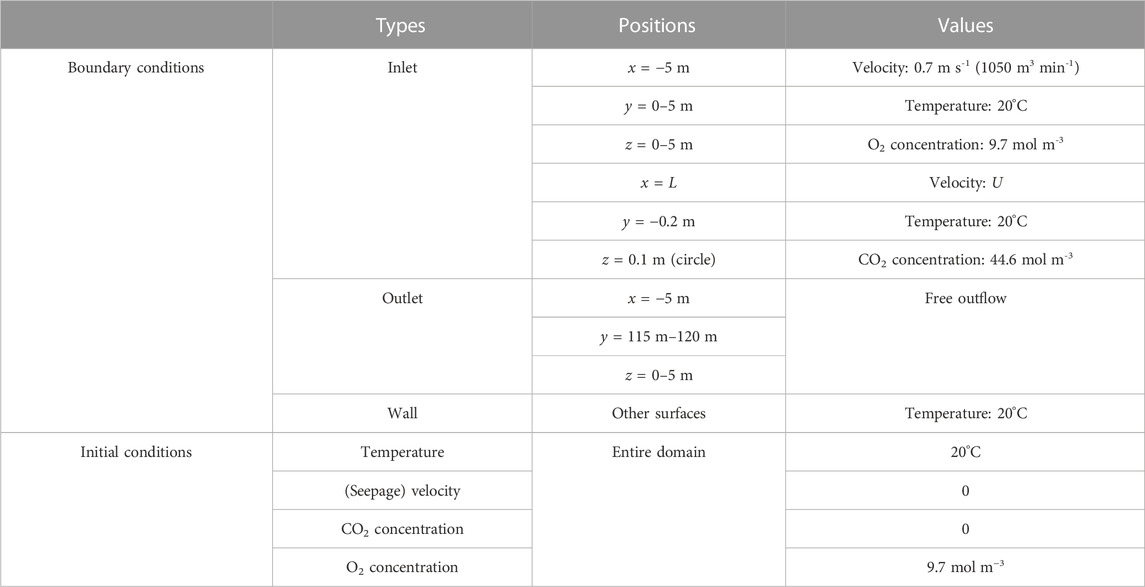
According to the actual conditions of the 5011 working face, the corresponding geometric model has been established. COMSOL Multiphysics software was applied to simulate the oxidation process of residual coal in the mine gob. The whole model consists of four parts: the mining area, the inlet airway, the return airway, and the working face. The cross-sectional area of both the inlet and return airways is 22.5 m2, and the cross-sectional area of the working face is 25 m2. The length of the inlet and return airways is 5 m. The length of the working face is set as 220 m, and the length and height of the gob area are 180 and 15 m, respectively. For the condition without CO2 injection, grid independence was checked by carrying out three sets of grids. Eventually, after considering the CPU time and the sensitive parameter, 34,954 mesh blocks are divided among this model, including 32,389 mesh blocks in the gob area. The mesh blocks of the models for CO2 injection were slightly larger than those without CO2 injection. The time step was set as 1 h. As shown in Figure 7, the CO2 injection port was a round tube with a radius of 0.2 m and a length of 0.2 m. Two parameters, injection flux (U, m3h−-1) and injection port burial depth (L, m), were considered to investigate the performance of CO2 injection in preventing residual coal fires. The parameters used in the simulations are listed in Table 1. The boundary and initial conditions used in the mathematical model are illustrated in Table 2.
5 Results and discussion
5.1 Analysis of the oxidation zone without CO2 injection
As shown in Figures 8A, B, the porosities and permeabilities of the gob near the working face and pillars are larger than those of the inner zone due to the mining process. Fresh air enters the working face from the inlet airway with a velocity of 0.7 m s−1, and more than 90% of the ventilation flux passes through the working face and then flows into the return airway. The airflow streamlines in the gob area, normally from the windward zone near the inlet airway to the zone near the return airway. The airflow velocity near the working face is larger than that in the inner zone due to the smaller forced-convection resistance.
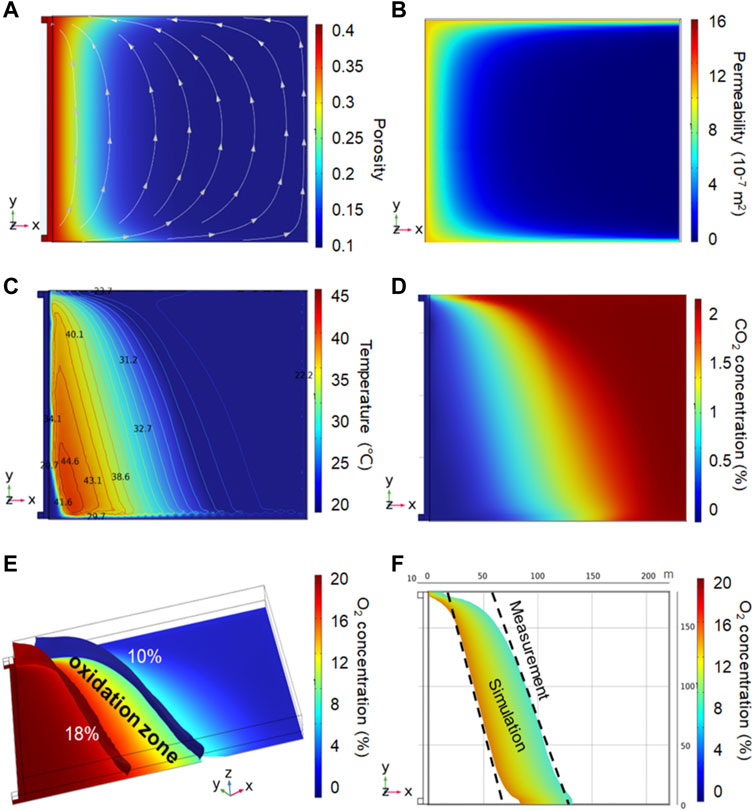
FIGURE 8. Numerical simulation without CO2 injection: (A) porosity and airflow seepage at z=0.2 m, (B) permeability distribution at z=0.2 m, (C) temperature distribution at z=0.2 m, (D) CO2 distribution at z=0.2 m, (E) 3-D oxidation zone, and (F) oxidation zone at z = 0.2 m.
With the deepening of the gob, the O2 concentration gradually decreases. As shown in F8(e), on the side of the inlet airway, the fresh air from the intake airway enters the gob and flows toward the deep. However, gases with low O2 concentrations flow from the deep to the return airway. Therefore, the O2 concentration near the side of the return airway shows a more rapid decline than that of the intake airway.
This distribution of the oxidation zone has been observed in many other field measurements and simulations (Xia et al., 2015; Chu et al., 2019; Xu et al., 2020). Coal near the working face undergoes a strong oxidation reaction because of the abundant O2, accompanied by the release of heat. We can find that the high-temperature zone is located on the windward side of the oxidation zone, as shown in Figure 8C. It is due to the fact that O2 was consumed in the high-temperature zone, causing fewer O2 molecules to enter the interior of the gob. Therefore, it is difficult to transport enough O2 to the inner zone, resulting in a low concentration of O2 within the area. The distribution of CO2 in the gob is the opposite of the distribution of O2 because most of the CO2 in the gob is derived from low-temperature oxidation of residual coal, as shown in Figure 8D. The overall CO2 values are much lower than those of O2. The CO2 concentration near the working face is lower than that in the inner zone due to the dilution of airflow seepage.
Figure 8E is a three-dimensional distribution of O2 concentration in the gob area. The O2 concentration in the upper area in the same vertical direction is slightly higher than that in the lower area. The volume of the oxidation zone without CO2 injection is calculated to be 121,000 m3. The average width of the oxidation band is 45 m. Figure 8F shows the range comparison of the oxidation zones (z=0.2 m) between the field measurement and simulation. The two results show good alignment. It indicates that the numerical simulation can reflect the performance of the self-ignition of the residual coal in the gob.
5.2 Analysis of the base case with CO2 injection
The base case of U = 540 m3 h−1 and L = 20 m was calculated, and the distributions of O2, CO2, and temperature in the gob area are shown in Figure 9. CO2 injection has the properties of a displacement effect on the air leakage, a dilution effect on the O2 distribution, and a cooling effect on the high-temperature zone. Therefore, the spontaneous combustion of residual coal is delayed or prevented. CO2 injection can dilute the O2 concentration. CO2 concentration is much higher than O2 concentration downstream of the injection port. The oxidation zone on the inlet airway side moved significantly toward the injection port, and the width of the oxidation zone decreased significantly. CO2 was continually mixed with leaked O2, and the dilution effect on the O2 distribution was gradually attenuated. The high-temperature zone under CO2 injection was a smaller area than that without CO2 injection. CO2 also suppresses the maximum temperature in the gob. It indicates that CO2 can restrict the self-ignition of coal. In addition, the area of the oxidation zone for CO2 injection on the surface z = 0.2 m is 1300 m2, much smaller than that without CO2 injection, which is 7400 m2. However, the volumes of the oxidation zone with and without CO2 injection are 63,000 m3 and 121,000 m3, respectively. The injection port is located near the bottom, causing a large amount of CO2 cluster in the lower area and, therefore, not easily diluting O2 in the upper area. As a result, the width of the oxidation zone in the upper area is much greater than that of the lower area.
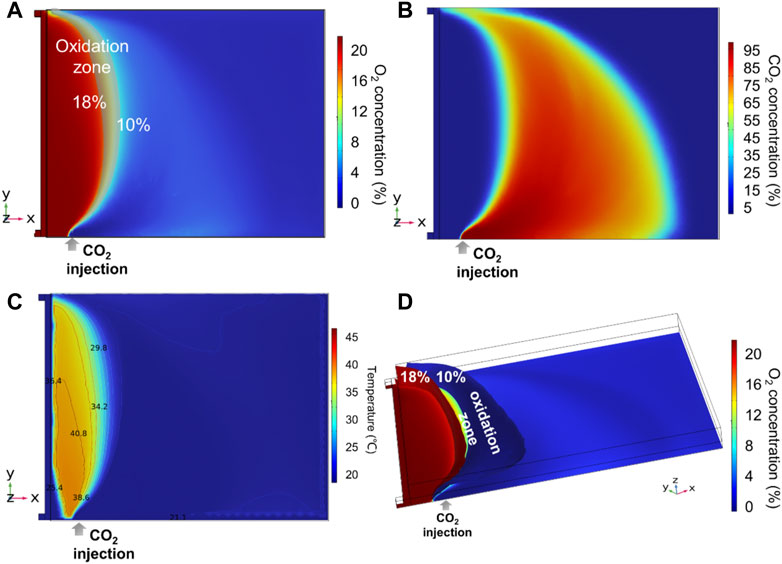
FIGURE 9. Numerical simulation with CO2 injection (L = 20 m and U = 540 m3 h−1): (A) oxidation zone at z = 0.2 m, (B) CO2 distribution at z = 0.2 m, (C) temperature distribution at z = 0.2 m, and (D) 3-D oxidation zone.
5.3 Effect of the CO2 injection flux
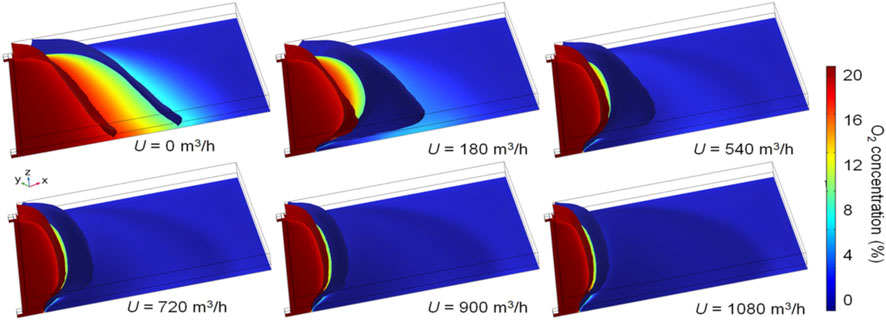
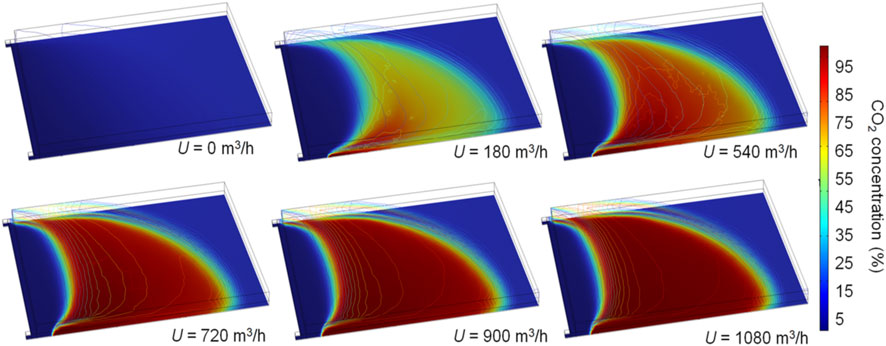
Based on the base case and the corresponding simulation without CO2 injection, the effects of the CO2 injection flux on the prevention of residual coal fires were analyzed. The assumed CO2 injection fluxes are 180, 360, 540, 720, 900, and 1080 m3 h−1, respectively. Figure 10 shows the oxidation zone in the gob for different CO2 injection fluxes at L=20 m. An increase in the injection flux weakens the O2 concentration in the gob and increases the displacement effect. When U ≥ 180 m3 h−1, the higher pressure of the intake airway and gravity suppress the injected CO2, which flows along the lower side of the gob in the direction of airflow seepage, as shown in Figure 11. At U= 180 and 540 m3 h−1, CO2 concentrations in the upper zone of the gob are much lower than those in the bottom zone. Because the CO2 injection fluxes (≤1080 m3 h−1) are smaller than the air flux from the intake airway (1050 m3 min−1). CO2 injection hardly affects the air leakage streamlines, and thus, the high CO2 areas at different U values are extremely similar. With the increase in CO2 injection flux, the overall distribution of the oxidation zone moves toward the working face. The oxidation zone in the lower gob area moves toward the upwind side of the injection port when U ≥ 0. As wind speeds increase, the distance between the iso-surfaces increases by 10% to 18%, reducing the volume of the oxidation zone. The volumes of the oxidation zone at U = 180, 360, 540, 720, 900, and 1080 m3 h−1 are 89,000, 62,500, 43,000, 2,950, 24,000, and 23,000 m3 at L=20 m, respectively. Therefore, when U < 900 m3 h−1, the volume of the oxidation zone decreases with the injection flux, and when U > 900 m3 h−1, the volume changes little as flux increases. This phenomenon also appears in other cases with different L values.
5.4 Effect of the CO2 injection location
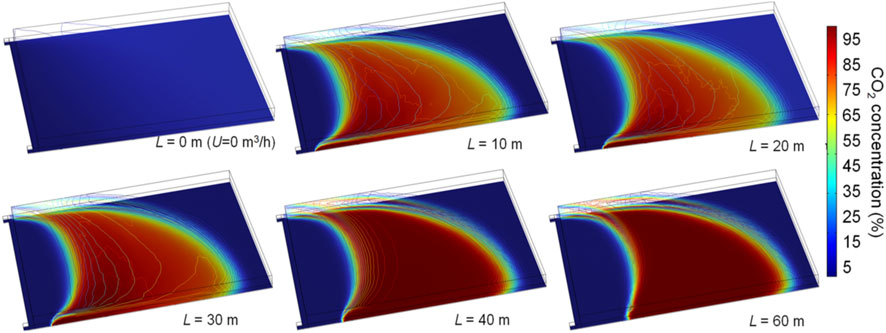
Figures 12, 13 show O2 and CO2 distributions in the gob with different burial depths at U = 540 m3 h−1. Once CO2 is injected, the oxidation zone on the inlet side is significantly reduced. This is because the high CO2 concentration near the injection port effectively dilutes O2. The closer the inlet port is to the working face, the closer the oxidation zone on the inlet side is to the working face, and the weaker the effect of the O2 concentration in the upper area of the inlet side being displaced by CO2. It is due to the high leakage strength near the working face and a large amount of fresh air that suppresses CO2 diffusion by the dilution effect. Therefore, as shown in Figure 13, the smaller L is, the lower the CO2 concentration within the gob. At L = 10, 20, and 30m, the CO2 concentration in the upper area of the gob is low. Moreover, as the burial depth of the injection port increases, the airflow leakage from the working face is small, and CO2 can migrate to the upper area without high resistance. The volumes of the oxidation zone at L= 10, 20, 30, 40, 50, and 60 are 65,000, 43,000, 27,000, 23,000, 19,200, and 18,500 m3 at Q=540 m3 h−1, respectively. As L increases, the width of the oxidation zone in the upper area decreases rapidly. The volumes of the oxidation zone are almost identical at L = 50 and 60 m. In addition, the change in the burial depth of the injection port has little effect on the distribution of the oxidation zone on the return side.
5.5 Comprehensive analysis of coupling the CO2 injection flux and location
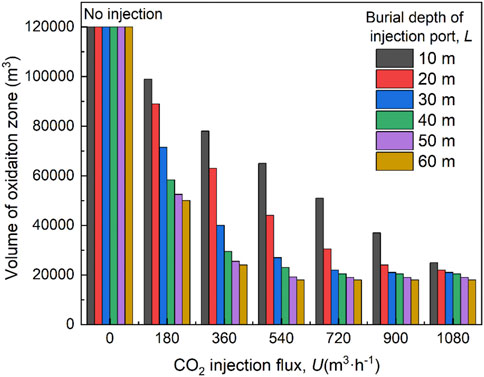
Figure 14 shows the effects of coupling factors, that is, the CO2 injection flux and location, on the predicted volume of the oxidation zone. A decrease in the CO2 injection volume or burial depth of the port will reduce the volume of the oxidation zone. When U < 720 m3 h−1, an increase in the burial depth significantly reduces the volume of the oxidation zone, especially at a lower injection flux. When U=1080 m3 h−1, the change in the position of the injection port does not have a significant effect on the distribution of the oxidation zone. At L = 10 m, the volume of the oxidation zone decreases linearly with the injection flux. However, when L > 30 m, the volume dramatically reduces with increasing U from 0 to 540 m3 h−1, but changes little as flux continues increasing. In practice, longer gas injection lines are avoided, which can make operations difficult. Smaller U values can save costs and reduce CO2 concentrations in the upper corner and working face when achieving similar effects of suppressing coal spontaneous combustion for different U values. Therefore, based on the simulation results, the parameters of U = 540–720 m3 h−1 and L = 30–40 m are recommended for the 5011 working face.
6 Conclusion
To accurately predict the effectiveness of CO2 injection on spontaneous combustion in the coal mine gob. A mathematical simulation by COMSOL Multiphysics was applied in this study.
According to the conditions of the 5011 working face in the Tanyaoping coal mine, a 3-D mathematical model considering fluid-solid-thermal inter-relationship was established. The coal oxidation kinetic model was derived from the adiabatic oxidation test, where four stages were considered in the model. The apparent activation energies of the four stages are 143.25, 57.45, 32.89, and 19.48 kJ mol−1, respectively. A good agreement between the field measurement and numerical simulation indicates the rationality of the mathematical model. CO2 injection can dilute the O2 concentration and prevent spontaneous combustion of coal. The coupling effects of injection flux, U, and the burial depth of the injection port, L, on the oxidation zone were investigated. The oxidation zone volume decreased with increasing U and L. When U or L is small, the upper width of the oxidation zone is wider, and as U or L increases, the upper width gradually decreases until it is no longer sensitive to parameter changes. An optimum injection plan is to keep the volume of the oxidation zone at a lower value in consideration of economic viability and operational parameters. The injection parameters of U = 540–720 m3 h−1 and L = 30–40 m are recommended after considering the activity of the 5100 working face. The volume of the oxidation zone was estimated to be 18,500–23000 m3.
Data availability statement
The original contributions presented in the study are included in the article/supplementary material, further inquiries can be directed to the corresponding author.
Author contributions
Investigation, methodology, writing—original draft, formal analysis, and final draft were completed by the author FJ.
Conflict of interest
The author declares that the research was conducted in the absence of any commercial or financial relationships that could be construed as a potential conflict of interest.
Publisher’s note
All claims expressed in this article are solely those of the authors and do not necessarily represent those of their affiliated organizations, or those of the publisher, the editors, and the reviewers. Any product that may be evaluated in this article, or claim that may be made by its manufacturer, is not guaranteed or endorsed by the publisher.
References
Chu, T., Li, P., and Chen, Y. (2019). Risk assessment of gas control and spontaneous combustion of coal under gas drainage of an upper tunnel. Int. J. Min. Sci. Technol. 29 (3), 491–498. doi:10.1016/j.ijmst.2018.05.002
Deng, J., Lei, C., Xiao, Y., Cao, K., Ma, L., Wang, W., et al. (2018). Determination and prediction on “three zones” of coal spontaneous combustion in a gob of fully mechanized caving face. Fuel 211, 458–470. doi:10.1016/j.fuel.2017.09.027
Dou, G., Liu, J., Jiang, Z., Jian, H., and Zhong, X. (2022). Preparation and characterization of a lignin based hydrogel inhibitor on coal spontaneous combustion. Fuel 308, 122074. doi:10.1016/j.fuel.2021.122074
Guan, C., Liu, S., Li, C., Wang, Y., and Zhao, Y. (2018). The temperature effect on the methane and CO2 adsorption capacities of Illinois coal. Fuel 211, 241–250. doi:10.1016/j.fuel.2017.09.046
Han, C., Nie, S., Liu, Z., Liu, S., Zhang, H., Li, J., et al. (2022). A novel biomass sodium alginate gel foam to inhibit the spontaneous combustion of coal. Fuel 314, 122779. doi:10.1016/j.fuel.2021.122779
Huang, Z., Quan, S., Hu, X., Zhang, Y., Gao, Y., Ji, Y., et al. (2022). Study on the preparation and inhibition mechanism of intumescent nanogel for preventing the spontaneous combustion of coal. Fuel 310, 122240. doi:10.1016/j.fuel.2021.122240
Li, J., Li, X., Liu, C., and Zhang, N. (2022). Study on the air leakage characteristics of a goaf in a shallow coal seam and spontaneous combustion prevention and control strategies for residual coal. Plos one 17 (6), e0269822. doi:10.1371/journal.pone.0269822
Liang, Y., Tian, F., Guo, B., and Liu, Z. (2021). Experimental investigation on microstructure evolution and spontaneous combustion properties of aerobic heated coal. Fuel 306, 121766. doi:10.1016/j.fuel.2021.121766
Lu, W., Cao, Y. J., and Tien, J. C. (2017). Method for prevention and control of spontaneous combustion of coal seam and its application in mining field. Int. J. Min. Sci. Technol. 27 (5), 839–846. doi:10.1016/j.ijmst.2017.07.018
Lu, W., Guo, B., Qi, G., Cheng, W., and Yang, W. (2020). Experimental study on the effect of preinhibition temperature on the spontaneous combustion of coal based on an MgCl2 solution. Fuel 265, 117032. doi:10.1016/j.fuel.2020.117032
Lu, W., Zhang, X., Yuan, Y., Qi, G., Hu, X., Li, J., et al. (2021). Study on the characteristics and mechanism of a new type of antioxidant gel foam for coal spontaneous combustion prevention. Colloids Surfaces A Physicochem. Eng. Aspects 628, 127254. doi:10.1016/j.colsurfa.2021.127254
Lu, X., Zhu, H., Wang, D., Hu, C., Zhao, H., and Huo, Y. (2018). Flow characteristic investigation of inhibition foam used for fire extinguishment in the underground goaf. Process Saf. Environ. Prot. 116, 159–168. doi:10.1016/j.psep.2018.02.005
Ma, L., Guo, R., Wu, M., Wang, W., Ren, L., and Wei, G. (2020). Determination on the hazard zone of spontaneous coal combustion in the adjacent gob of different mining stages. Process Saf. Environ. Prot. 142, 370–379. doi:10.1016/j.psep.2020.06.035
Qi, Y., Wang, W., Qi, Q., Ning, Z., and Yao, Y. (2021). Distribution of spontaneous combustion three zones and optimization of nitrogen injection location in the goaf of a fully mechanized top coal caving face. Plos one 16 (9), e0256911. doi:10.1371/journal.pone.0256911
Qin, B., Li, L., Ma, D., Lu, Y., Zhong, X., and Jia, Y. (2016). Control technology for the avoidance of the simultaneous occurrence of a methane explosion and spontaneous coal combustion in a coal mine: A case study. Process Saf. Environ. Prot. 103, 203–211. doi:10.1016/j.psep.2016.07.005
Qu, L., Liu, L., Chen, J., and Wang, Z. (2023). Molecular model construction and optimization study of gas coal in the huainan mining area. Processes 11, 73. doi:10.3390/pr11010073
Si, J., Li, L., Cheng, G., Shao, H., Wang, Y., and Li, Z. (2021). Characteristics and Safety of CO2 for the fire prevention technology with gob-Side entry retaining in goaf. ACS Omega 6 (28), 18518–18526. doi:10.1021/acsomega.1c02836
Sun, L., Zhan, M., Zhang, C., Shi, Q., Huang, Q., and Wang, W. (2022). Experimental study on prevention of spontaneous combustion of coal by ionic surfactant solution injection in coal seam. Energy 260, 125079. doi:10.1016/j.energy.2022.125079
Taraba, B., Michalec, Z., Michalcová, V., Blejchař, T., Bojko, M., and Kozubková, M. (2014). CFD simulations of the effect of wind on the spontaneous heating of coal stockpiles. Fuel 118, 107–112. doi:10.1016/j.fuel.2013.10.064
Wang, D., Zhong, X., Gu, J., and Qi, X. (2010). Changes in active functional groups during low-temperature oxidation of coal. Min. Sci. Technol. 20 (1), 35–40. doi:10.1016/s1674-5264(09)60157-5
Xia, T., Wang, X., Zhou, F., Kang, J., Liu, J., and Gao, F. (2015). Evolution of coal self-heating processes in longwall gob areas. Int. J. Heat Mass Transf. 86, 861–868. doi:10.1016/j.ijheatmasstransfer.2015.03.072
Xia, T., Zhou, F., Wang, X., Zhang, Y., Li, Y., Kang, J., et al. (2016). Controlling factors of symbiotic disaster between coal gas and spontaneous combustion in longwall mining gobs. Fuel 182, 886–896. doi:10.1016/j.fuel.2016.05.090
Xu, Y., Li, Z., Liu, H., Zhai, X., Li, R., Song, P., et al. (2020). A model for assessing the compound risk represented by spontaneous coal combustion and methane emission in a gob. J. Clean. Prod. 273, 122925. doi:10.1016/j.jclepro.2020.122925
Yoruk, B., and Arisoy, A. (2022). Development of a mathematical model for simulating the self-heating behavior of moist coal. Combust. Sci. Technol. 194 (13), 2674–2692. doi:10.1080/00102202.2021.1885388
Zhang, C., Wang, E., Xu, J., and Peng, S. (2021). A new method for coal and gas outburst prediction and prevention based on the fragmentation of ejected coal. Fuel 287, 119493. doi:10.1016/j.fuel.2020.119493
Zhang, H., Sasaki, K., Zhang, X., Sugai, Y., and Wang, Y. (2019). Numerical simulations on the self-heating behaviours of coal piles considering aging effect. Combust. Theory Model. 23 (6), 1169–1190. doi:10.1080/13647830.2019.1644378
Zhang, H., Wang, Y., Zhang, X., Sasaki, K., Sugai, Y., Han, F., et al. (2023). Experimental study of moisture effects on spontaneous combustion of Baiyinhua lignite from individual particles to stockpile. Fuel 334, 126774. doi:10.1016/j.fuel.2022.126774
Zhang, H., Zhang, X., Wang, Y., Dong, W., Fan, J., and Sasaki, K. (2022). Application of aging effect model in numerical simulation for predicting spontaneous combustion of coal stockpiles. J. Therm. Analysis Calorim. 147, 13847–13860. doi:10.1007/s10973-022-11708-7
Zhang, J., An, J., Wen, Z., Zhang, K., Pan, R., and Akter Al Mamun, N. (2020). Numerical investigation of coal self-heating in longwall goaf considering airflow leakage from mining induced crack. Process Saf. Environ. Prot. 134, 353–370. doi:10.1016/j.psep.2019.12.025
Zhang, Q., Hu, X. M., Wu, M. Y., Zhao, Y. Y., and Yu, C. (2018). Effects of different catalysts on the structure and properties of polyurethane/water glass grouting materials. J. Appl. Polym. Sci. 135 (27), 46460–46511. doi:10.1002/app.46460
Keywords: coal, spontaneous combustion, CO2 injection, oxidation zone, oxidation kinetic model
Citation: Fan J (2023) Effects of CO2 injection factors on preventing spontaneous coal combustion in coal mine gobs: a simulation approach. Front. Earth Sci. 11:1191049. doi: 10.3389/feart.2023.1191049
Received: 21 March 2023; Accepted: 31 May 2023;
Published: 15 June 2023.
Edited by:
Zhibo Zhang, University of Science and Technology Beijing, ChinaReviewed by:
Yang Xiao, Xi’an University of Science and Technology, ChinaBo Tan, China University of Mining and Technology, China
Chunliu Liu, Anhui University of Technology, China
Ge Huang, Liaoning Technical University, China
Copyright © 2023 Fan. This is an open-access article distributed under the terms of the Creative Commons Attribution License (CC BY). The use, distribution or reproduction in other forums is permitted, provided the original author(s) and the copyright owner(s) are credited and that the original publication in this journal is cited, in accordance with accepted academic practice. No use, distribution or reproduction is permitted which does not comply with these terms.
*Correspondence: Jiafeng Fan, c3lta3lmamZAMTYzLmNvbQ==
 Jiafeng Fan