 Shuva Shankha Ganguli
 Sanjit K. Pal
- 1PSS-P&M-I, Geological Survey of India, Kolkata, India
- 2Department of Applied Geophysics, Indian Institute of Technology (Indian School of Mines), Dhanbad, India
The Cauvery sedimentary basin of India, a part of the Eastern Continental Margin of India (ECMI), has evolved as a consequence of its breakup from East Antarctica in the early Cretaceous. This study covers approximately 10,000 km2 in the southern part of the Cauvery basin. A total of 5,161 gravity-magnetic observations were made in an area bounded by 78°–79°E longitude and 9°–10°N latitude. The gravity anomaly map shows a dominant NE-SW trend with a total relief of 83 mGal from −77 mGal to 6 mGal. The map reveals very prominent NE-SW trending linear gravity high bands and two circular/elliptical gravity lows around Madurai and Ramanathapuram, respectively. The residual gravity map reveals NE-SW trending alternative bands of gravity highs and lows, revealing a ridge-depression structure. The gravity modeling shows the presence of underplated material, which may be related to magmatic activity during the Cretaceous. The magnetic map reveals two prominent E-W trending linear structures, which probably represent the disposition of a shear zone under the Cauvery Basin. Based on the filtered magnetic and gravity map, we have prepared an interpreted basement geology map. The magnetic map and residual gravity map suggest that the basement rock of the basin is crystalline (granite/gneiss) and may not comprise a high-grade metamorphic rock Eastern Ghat Orogeny.
Introduction
Massive igneous activity is usually associated with continental rifting as the continents are stretched prior to their break up (White and Mckenzie, 1989). The Western Continental Margin of India (WCMI, Figure 1B) evolved due to the disintegration of India from Madagascar and Seychelles, which was associated with the extrusion of huge areas of flood basal approximately 65 Ma. A thick (∼18 km) high-velocity layer (HVL) was reported in the lower crust of the west coast of India, which is considered a part of magmatism that characterizes a volcanic rifted margin (Saikia et al., 2017). The Cauvery Sedimentary Basin (CSB), southernmost among the string of Mesozoic rift basins along the east coast, is a part of the Eastern Continental Margin of India (ECMI) and has evolved as a consequence of fragmentations of India and East Antarctica in the early Cretaceous (Powel et al., 1988); however, evidence of volcanic activity at the surface is absent and may be buried under thick sedimentary cover. Additionally, the seismological and magnetotelluric (MT) studies are also inadequate with regard to the east coast of India; therefore, the deeper crustal architecture is elusive. The east coast of India comprises five sedimentary basins, from north to south. These are Bengal, Mahanadi, Godavari-Krishna, Palar, and Cauvery (Figure 1A; Sastri et al., 1981), and the Cauvery Basin forms a Category-I sedimentary basin or an oil province with an established commercial production (Mazumder et al., 2019). For the past few decades, a large amount of data has been accrued during the exploration for hydrocarbons. The geophysical studies in the East Indian coast have revealed an alternating set of NE-SW trending ridge-depression structural features in all of the basins (Sastri et al., 1973, 1981; Behara et al., 2004; Bastia et al., 2010; Radhakrishna et al., 2012). The studies based on the satellite-derived potential field and seismic data encompassing onshore and offshore areas provided broad crustal configurations, lithospheric strength, and subsidence history of the Godavari-Krishna and Palar-Cauvery basins (Singh and Rao, 2021, Twinkle et al., 2016a; Radhakrishna et al., 2012; Rao and Radhakrishna, 2021). The present study area is mostly covered by sediments, except in western parts; therefore, the structural features and basement geology remain elusive. The potential field data have been effectively used for structural studies attempting to better understand basement geometry (Castro et al., 2014; Curto et al., 2014; Essa et al., 2018; Eldosouky and Mohamed, 2021; Hamimi et al., 2023) and mineral investigations (Blundell et al., 2019; Eassa et al., 2022) in different parts of the world, especially over sediment-covered terrain. However, insights into the shallow crustal structure and deep crustal architecture based on high data density and systematic coverage of the ground gravity-magnetic data are limited, especially for the southern part of the Cauvery Basin. The present study is based on an analysis of high-resolution ground gravity magnetic and aims to reveal basement geometry and structure. Additionally, the study aims to understand the tectonic regime that caused the evolution of the Cauvery Basin. We have applied several geophysical filters and generated a residual-regional gravity anomaly map of the study area based on the spectral analysis, analytical signal map, and tilt derivative map of the magnetic data and two-dimensional gravity modeling. The study reveals the alternate ridge-depression structure, some oblique structures to the east coast, and the occurrence of a high-density unit on the deeper crust, which might be the impact of plume lithospheric interaction.
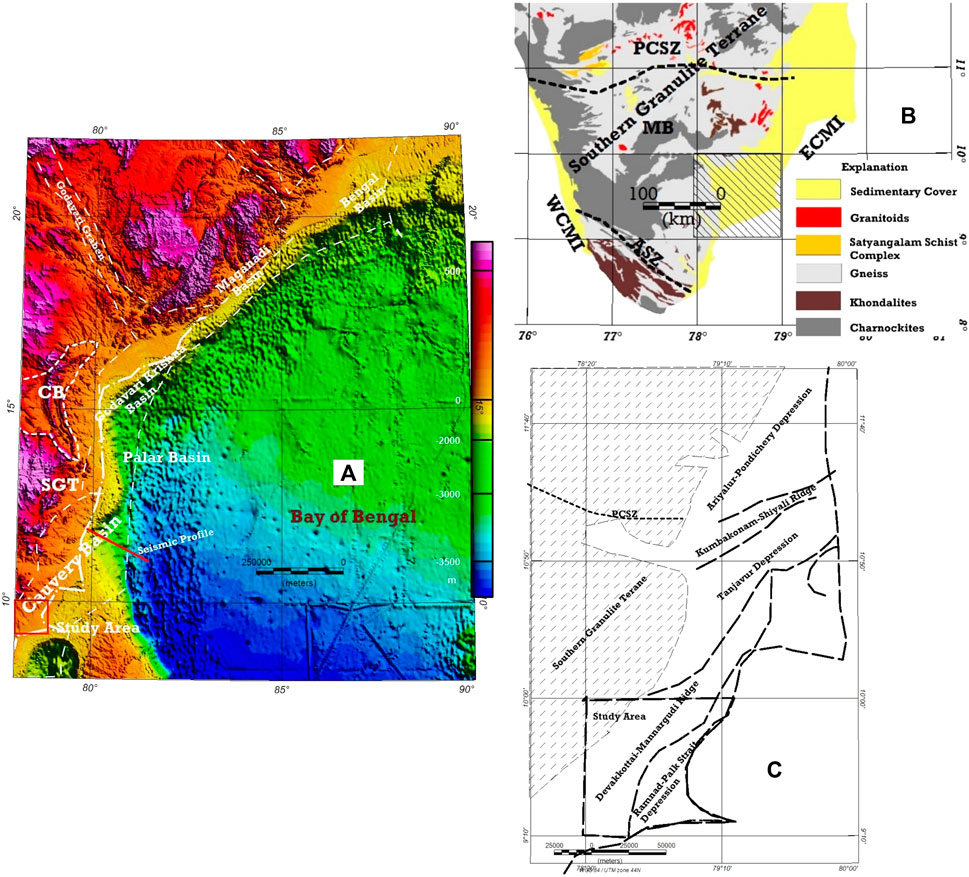
FIGURE 1. (A) The prominent basins of the Eastern Continental Margin of India (ECMI), including the location of the Cauvery Sedimentary Basin. SGT, Southern Granulite Terrane; CB, Cuddapah Basin. (B) Generalized geological map of parts of the SGT. MB, Madurai Block; PCSZ, Palghat Cauvery Shear Zone; ASZ, Achankovil Shear Zone. The hatched box indicates the study area; WCMI, Western Continental Margin of India. (C) Prominent structures of the Cauvery Sedimentary Basin.
Regional geology and tectonics
The Eastern Continental Margin of India (ECMI) bears the imprints of drifting because of the disintegration of Gondwanaland with a time window stretching from the Permian to the Early Cretaceous (Sastri et al., 1981). The margin consists of five river basins. From north to south these are the Bengal, Mahanadi, Godavari-Krishna, Palar, and Cauvery (Fig. l a) basins, and the sediment thickness in these basins varies from 3 to 5 km in the onshore depressions to more than 10 km in the thick deltaic sedimentation regions of the onshore (Sastri et al., 1973). The seismic studies reveal that the underlying basement is characterized by NE-SW ridge-depression structures that are parallel to the east coast of India. The geophysical studies suggest the margin is a composite of two segments: the northern part (north of 16° N), with a rifted margin character, and the transformed segment southern part that has developed due to shearing during the early stages of continental separation (Subrahmanyam et al., 1999; Chand et al., 2001; Krishna et al., 2009; Yatheesh, 2020). The effective elastic thickness (Te), which indicates the mechanical character of the underlying lithosphere, varies from 10 to 25 km for the northern part of the ECMI and less than 5 km for the southern part of the ECMI (Chand et al., 2001).
The Cauvery Basin is an intracratonic rift basin (Chari et al., 1995) that came into existence due to the break-up of Eastern Gondwanaland during the Late Jurassic to Early Cretaceous. The westerly bordering Southern Granulite Terrane (SGT) forms the basement of the basin (Figure 1). The SGT is made of exhumed lower crustal rocks, such as the gneisses, charnockite, khondolite, intrusive granites, and other high-grade metamorohic rocks (Chetty 2021). The Palghat Cauvery Shear Zone (PCSZ) is a crustal scale E-W trending shear zone that separates the SGT in the northern block in the north and the Madurai block (MB; Chetty, 2021) in the south (Figure 1B). The disposition of the PCSZ beneath the Cauvery Basin played a major role in shaping the basement structure and morphology of the basin (Majumder et al., 2019). Additionally, apart from the shear zone, the basement was subjected to three episodes of tectonism, which also shaped the basin geometry. The oldest episode was associated with N-S trending faults that developed during the late Permian followed by the principle event associated with NE trending rifts during the late Jurassic to Early Cretaceous. The rifting was caused by the separation of the India-Sri Lanka system from Antarctica and Australia. The NW-SE trending oblique structures developed due to rifting and strike-slip moment (Majumder et al., 2019).
The Cauvery Basin encompasses an area of approximately 25,000 km2 on land (Chari et al., 1995), and the basement is characterized by ridge and graben morphology. The depth to the basement for depression varies from 5,400 to 3,000 m, as estimated from the seismic refraction survey (Sastri et al., 1973). The sedimentary thickness over the ridges varies from 250 to 2,440 m (Sastri et al., 1973). The present study covers an approximately 10,000-km2 area of the southern part of the Cauvery Basin. The Khondolite and Charnockite group of rocks of the SGT forms the basement (Figure 2). The basement is unconformably overlain by Triassic-Cretaceous Shivganga formations comprising alternating shale, sandstone, and grit. Coal seams occasionally occur in the formation. The Cuddalore formation overlies the Miocene Shivganga formation. The formation mainly comprises sandstone. The major part of the area is covered by Quaternary alluvium of arenaceous and calcareous origin, with patches of laterite cover over the Tertiary formations. The area has a gentle seaward slope with an elevation that varies from 171 m to 1 m (amsl).
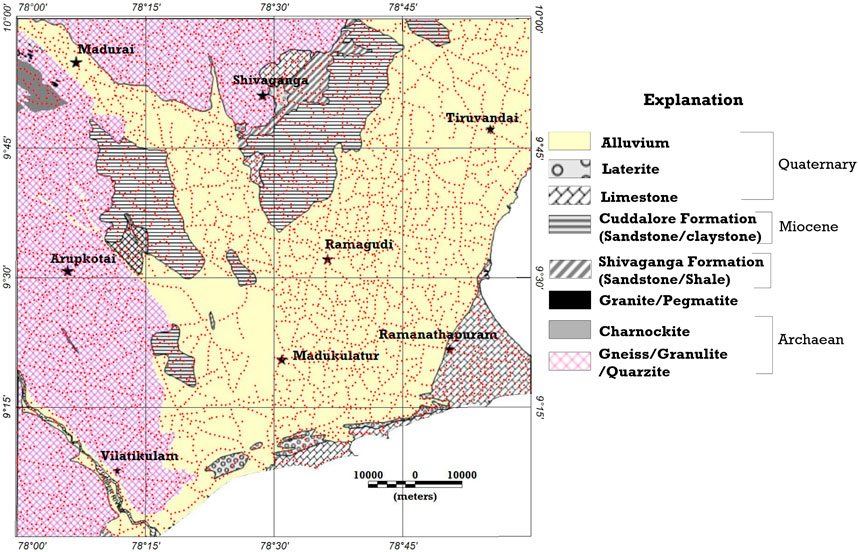
FIGURE 2. Geological map of the study area. The red dots represent gravity-magnetic data locations.
Methodology and analysis
The Bouguer gravity anomalies (BGA) are essentially caused by subsurface density inhomogeneity, and therefore, reflect the lateral variations in the density of subsurface rocks. The magnetic anomalies (MA), which are caused by the variations in the magnetic susceptibility in crustal rocks, formed at temperatures above the Curie point. The magnetic susceptibility of rocks is inversely correlated with rock silica content (Teknik et al., 2023) and directly proportional with magnetite content. Magnetic anomaly maps are efficient tools for mapping concealed subsurface magmatic structures and basement configurations where overlying sedimentary units are not embedded by magnetic bodies (e.g., basaltic intrusions). Thus, both gravity and magnetic anomalies provide important insights into the tectonic nature of crustal domains and help in building a regional scale representation of the basement configuration. The gravity-magnetic data were acquired as part of the National Geophysical Mapping Programme (NGPM) of the GSI between 2010 and 2012, along with all the available roads with 1–2-km station intervals. The present data set includes more than 5,000 gravity-magnetic observations covering an area of approximately 10,000 sq. Km (Figure 2). The gravity data were acquired using a CG-5 gravimeter and magnetic data were acquired using a proton precession magnetometer (GSM-19T), and the orthometric height of each gravity station was measured by deploying the ‘Total Station’ leveling instrument. The entire acquired data, which was tied with the IGSN-1971 gravity bases, was corrected for drift, tidal, elevation, and latitude effects to arrive at the Bouguer gravity anomaly (BGA). The magnetic data were subjected to diurnal correction and IGRF correction (Epoch-2010). The gravity, magnetic, and elevation data were gridded using the minimum curvature method with a cell size of 1,000 m.
Bouguer gravity anomaly (BGA)
The Bouguer gravity map shows some distinct anomaly patterns with a total variation of 83 mGa l from −77 mGa l to six mGa l (Figure 3). The high gravity anomaly values may indicate the reduction of crustal thickness and the presence of underplated high-density material. The very prominent NE-SW trending linear gravity high zone (−35 to six mGa l) anomaly values separate the entire study area into two-halves. The high anomaly zone may indicate the emplacement of a high-density plug into the mid-crustal level. The map shows circular and elliptical gravity lows around Madurai and Ramanathapuram, respectively (Figure 3), which may indicate the occurrence of low-density granites within the basement.
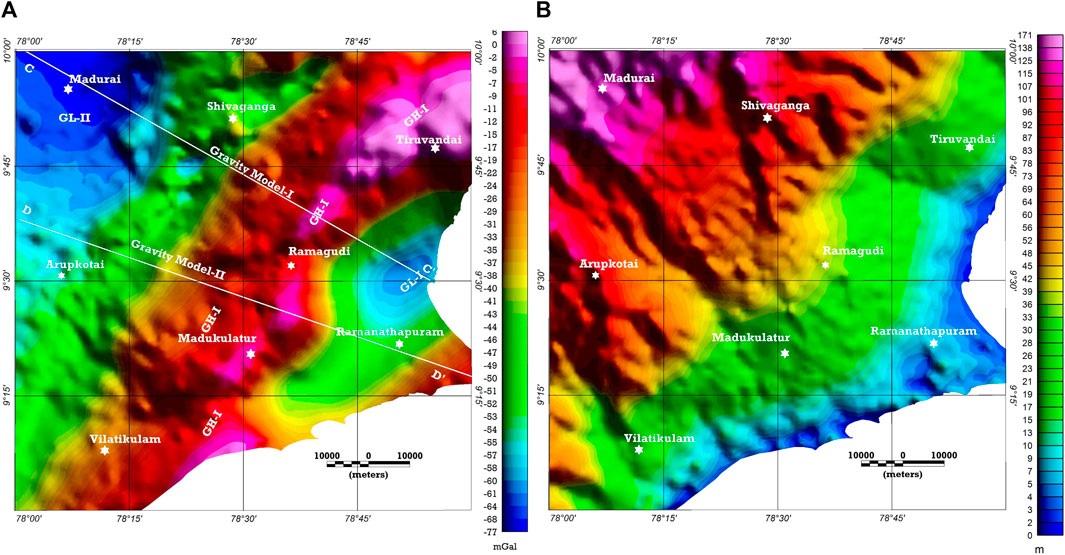
FIGURE 3. (A) Bouguer Gravity Anomaly Map of the study area. The warm color indicates gravity high zones and the lighter color indicates gravity low zones. Note the NE-SW trending moderate-to-high gravity anomaly (GH-I) zone and two gravity low zones (GL-I and GL-II). Gravity modeling is carried along C–C’ and D–D’. (B) Topographic image of the study area.
Magnetic anomaly (MA)
The magnetic anomaly map shows some distinct anomaly patterns; however, we have applied a reduced to pole filter (RTP) to center the magnetic anomalies over their causative features, which makes the interpretation easier and more reliable (Castro et al., 2014; Essa et al., 2022). The present study lies in a low magnetic latitude, hence a pseudo-inclination factor of 60°–85° was used to suppress the amplitude and power in and near the declination direction at low magnetic latitudes (Blakely R. J., 1996). Generally high amplitude high-frequency anomalies are caused by highly magnetized rocks at a shallow depth, and low-amplitude low-frequency anomalies are likely to be sourced from deep magnetic bodies (Teknik et al., 2023). The magnetic anomaly values (Figure 4A) show a relief of approximately 1,500 nT, which suggests susceptibility does not vary widely among the litho-units and non-magnetic litho-units are dominant within the study area. The western part of the study area is characterized by higher frequency anomalies than the eastern part. It suggests that in the western part, the causative sources of the anomalies are occurring at a shallow depth and magnetic minerals are present in the causative litho-units. We have generated an RTP, analytical signal (AS), and tilt derivative magnetic anomaly map of the study area to enhance the shape and pattern of the magnetic anomalies. The application of an RTP filter on the magnetic data centers the magnetic anomaly over a causative source but the filter does not take account of the remanent magnetization (Leseane et al., 2020; Essa et al., 2021). The tilt derivative (TDR) is an arc-tan geometrical function that normalizes the vertical derivative by the total horizontal derivative (Miller and Singh, 1994; Blakely RJ. 1996; Essa et al., 2022). The TDR acts as an automatic gain control filter (AGF) and responds equally to both shallow and deeper sources. The peaks of the transformed data are positioned directly over the body’s center (Ferreira et al., 2013). The function is very useful in enhancing the structural trend and linear features in magnetic data (Stewart and Miller, 2018). Based on the RTP anomaly and tilt derivative (TDR) (Castro et al., 2014; Ganguli et al., 2022), the entire study area is classified into five magnetic domains: domains I, II, III, IV, V, and VI (Figure 4A, B). ‘Domain I’ is characterized by high-frequency negative anomalies, with a few patches of positive anomalies (Figure 4A). The magnetic fabric did not show any predominant trend (Figure 4B). A strong approximate E-W trending positive linear magnetic anomaly (A-A’; Figure 4A) runs across domain II. Another near parallel linear magnetic anomaly (B-B’; Figure 4A) runs just south of it. The same pattern is also evident in the TDR map (Figure 4B). The pattern cuts across the dominant NE-SW structural and gravity anomaly trend of the study area, and the causative magnetic source may not be outcropping but corroborates well with the trend of PCSZ (Figure 1B). Domain III is characterized by moderate-to-high frequency positive and negative anomalies. Domain IV is characterized by negative-to-near positive long-wavelength anomalies, which indicate the presence of thick sedimentary rock over the dominantly non-magnetic or silicic basement. The WNW-ESE trending linear feature separates domains IV and VI, which otherwise shows a similar anomaly pattern. This linear feature is interpreted as a fault. The southern part of domain IV covers the Ramanathapuram Sub-basin. The anomaly pattern suggests a comparatively shallow mafic basement. Based on the analysis of the magnetic data, an inferred geological map was prepared and is presented in Figure 4C.
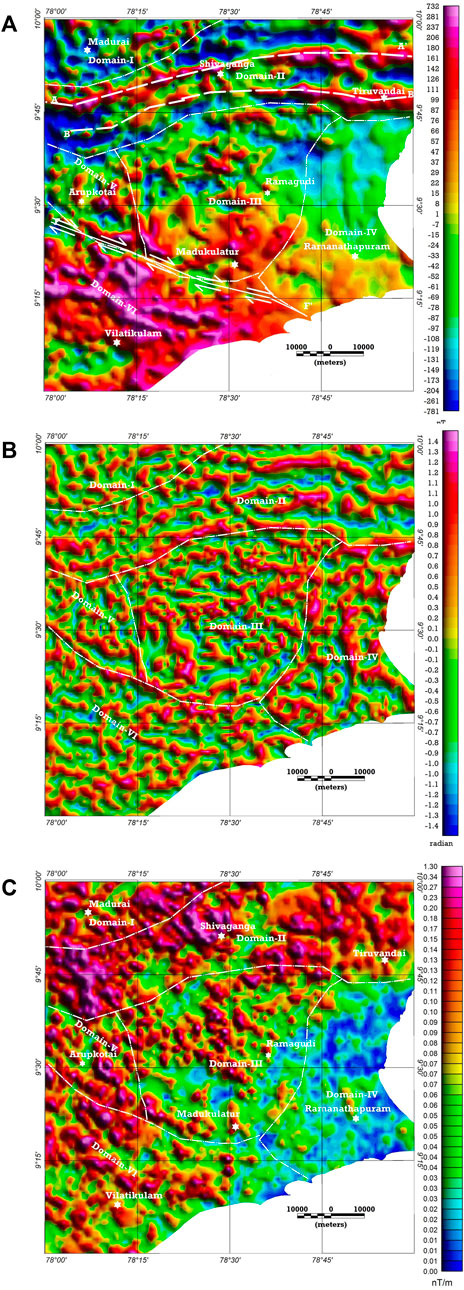
FIGURE 4. (A) Magnetic (RTP) anomaly map of the study area. The warm color indicates magnetic high zones and the lighter color indicates magnetic low zones. Note the curvilinear approximate E-W trending magnetic features (A–A’ and B–B’) in domain II. F–F’ is the inferred structural feature (see text for details). (B) Tilt derivative of the magnetic anomaly map (TDR). The study area is divided in five zones based on the tilt derivative signatures. (C) Analytical Signal (AS) map of the study area.
Regional-residual analysis of the gravity data
The gravity and magnetic anomaly map represent the superposition of the anomalies of various frequencies associated with sources with different depth levels. The spectral analysis and subsequent wavelength filtering of the gravity and magnetic anomaly are useful for separating anomalies resulting from shallow causative sources and deeper causative sources (Telford et al., 1990; Ganguli et al., 2020, 2022).
The radially averaged power spectrums (Spector and Grant, 1970; Blakely R. J., 1996; Ganguli et al., 2021, Teknik et al., 2023) were generated for both the gravity and magnetic data (Figure 5). The radially averaged power spectrum of the gravity data shows three density interfaces at 13.3 km, 5.5 km, and 1.6 km. The radially averaged power spectrum for the magnetic data shows two magnetic interfaces: a deeper interface at 5.5 km and a shallower one at 1.2 km. The results of the spectral analysis suggest there is a density and magnetic interface at 5.5 km, which may indicate the average basement for the sedimentary depressions, while the density interface at 1.7 km may indicate average sedimentary thickness over the ridges and the magnetic interface at 1.2 km may indicate the top of a buried magnetic source. Here, we have observed that the deepest density interface is at 13.3 km but the magnetic deepest magnetic interface is at 5.5 km. This suggests that geological sources at a greater depth contribute more to the gravity anomaly map than they do to the magnetic anomaly map. Additionally, it is possible that the crust below 5.5 km is magnetically homogeneous.
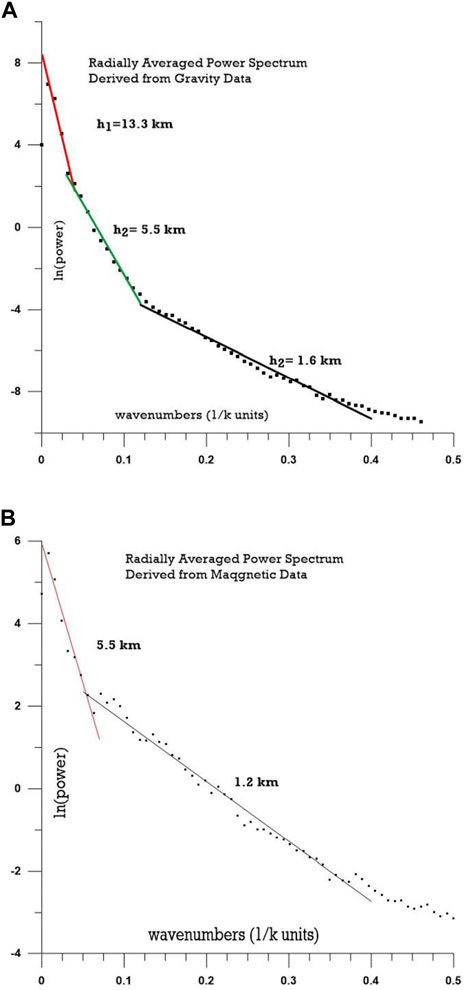
FIGURE 5. Radially average power spectrum for gravity (A) and magnetic data (B).
Residual gravity map
The cutoff wavenumber (0.04 units) separating the regional and residual gravity maps were derived from the results of the spectral analysis of gravity data. The residual anomaly map, which manifests a near-surface density distribution (Figure 6), was generated by applying a band-pass anomaly map with a passband from 0.04–0.4 units. The residual gravity map shows the variation of 18 mGa l and NE-SE trending linear bands of gravity residual highs and lows, which are the distinct features of the map. We have corroborated the geologically mapped ridge-depression structure (Sastri et al., 1981) with the residual gravity map (Figure 1B) and observed that the NE-SW trending most prominent positive gravity anomaly in the eastern part of the study area corroborates well with the Devakkottai-Mannargudi Ridge and the adjacent linear gravity low Ramnand-Palk-Strait Depression (Sastri et al., 1981). Additionally, similar anomaly patterns were observed over the Mahanadi Basin, where gravity ‘highs’ lie over the shallow basement ridges and the ‘low’ corroborates with the basement depressions over which thick sediments have been deposited (Behara et al., 2004). Hence, we have inferred that linear gravity lows are associated with depression and linear highs are associated with ridges and marked them in the residual gravity map. The present study, for the first time, brought out the subsurface ridge depression structure, which had otherwise been concealed. It is interesting to note that the ridge-depression structures abut along the line G–G’ (Figure 6A) in the south, which we have inferred as a fault oblique to the primary NE-SW trend. Additionally, we have identified some faults (L–L’, M–M’; Figure 6) parallel to this fault. We further notice that the residual high signature associated with the Devvakotai-Mannargudi Ridge exhibits three deformation sets (NE-SW, N-S, and NW-SE). NE-SW is the oldest and NW-SE is the youngest. Moderate-to-high residual gravity signatures were observed in Madurai and Ramanathapuram sub-basin, respectively. Over the Ramanathapuram sub-basin or Ramnand-Palk Strait depression, the basement thickness reaches almost 3.5 km (Sastri et al., 1981). Therefore, the moderate-to-high residual gravity anomaly may indicate the presence of mafic rock underneath the sediments. The drilling data does indicate the presence of basalts at a depth of ∼1,650 m.
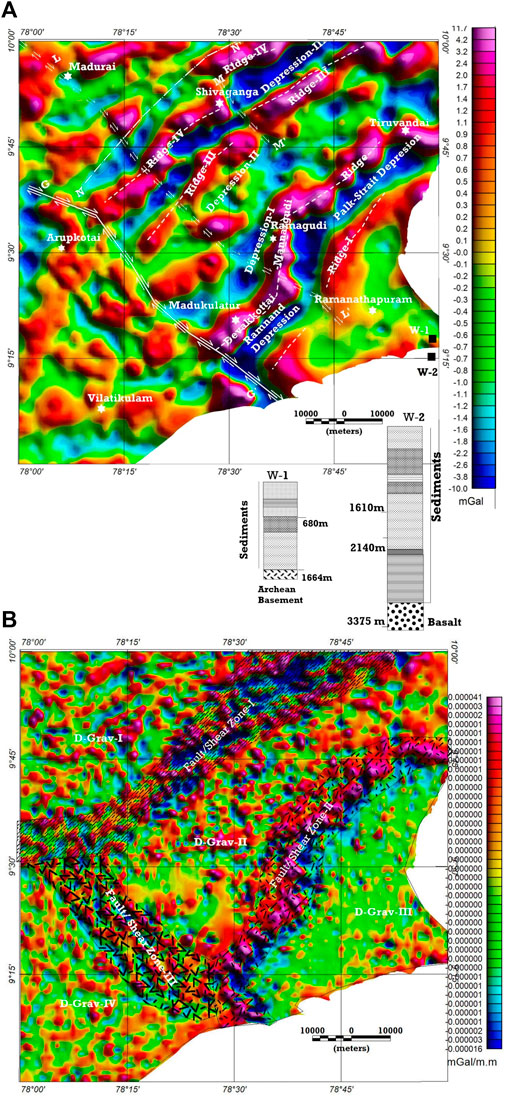
FIGURE 6. (A) Residual gravity anomaly map of the study area. W-1 and W-2 bore well locations are indicated. M–M’, L–L’, and G–G’ are the inferred faults. N–N’ is the inferred western boundary of the basin. Note the alternative high and low anomalies revealing the ridge depression structure of the study area. See text for details. (B) Second vertical derivative of the gravity anomaly map. Based on the gravity trend, the entire study area can be divided into several domains.
Second vertical derivative (SVD)
The second vertical derivative of the gravity data enhances the subtle effects caused by near-surface density discontinuities, which are otherwise blurred by the density variation in the deeper subsurface. The spectral analysis shows that the deepest density interface is approximately 13 km, while the deepest magnetic interface is at a depth of approximately 5 km (Figure 5). Therefore, magnetic data are more influenced by near surface geological units than the gravity data. Again, the cutoff wavelength used to derive the residual gravity anomaly was approximately 25 km. Hence, the residual anomaly is dominated by a signal from a crustal column at least 5 km thick. To carry out a comparative study between the magnetic and gravity anomaly maps, we generated an SVD gravity map that is dominated by signals from a much shallower depth. Based on the SVD of the gravity data (Figure 6B), we have again classified the study area in different domains (Figure 6B). The SVD brings out two prominent NE-SW trending litho-contacts (Litho-Contact-I and Litho-Contact-II, Figure 6B) and another NW-SE trending litho-contact (Fault/Shear Zone-III, Figure 6B). These prominent structures divide the entire study area into four domains (Figure 6B). Litho contact-I is probably indicating the contact between basement granulites and sedimentaries. Litho contact-II is probably the western boundary of the Ramnathapuram sub-basin. The basement is exposed over domains ‘D-Grav-I’ and ‘D-Grav- IV’ (Figure 6B) and consists of high-grade metamorphic rocks of the Southern Granulite Terrane (SGT). However, there is difference in structural trends over these two domains. Domain ‘D-Grav-II’ is covered by sediments, but it appears that the basement occurs at a shallow depth and granulites may form the basement. The sediments are thicker over domain ‘D-Grav-III’, which represents the Ramanathpuram sub-basin.
Regional gravity map
The regional gravity map almost mimics the Bouguer gravity maps and have a high frequency due to the elimination of shallow sources (Figure 7). The strong linear NE-SW trending gravity high band is a distinct feature of the map, and it further emphasizes the emplacement of a high-density plug into mid-crustal levels. The two distinct gravity lows near Madurai and Ramanathapuram persist in the regional gravity map, which indicates emplaced low-density rocks within the basement. Moderate-to-high residual anomalies were observed (Figure 6) at these two places.
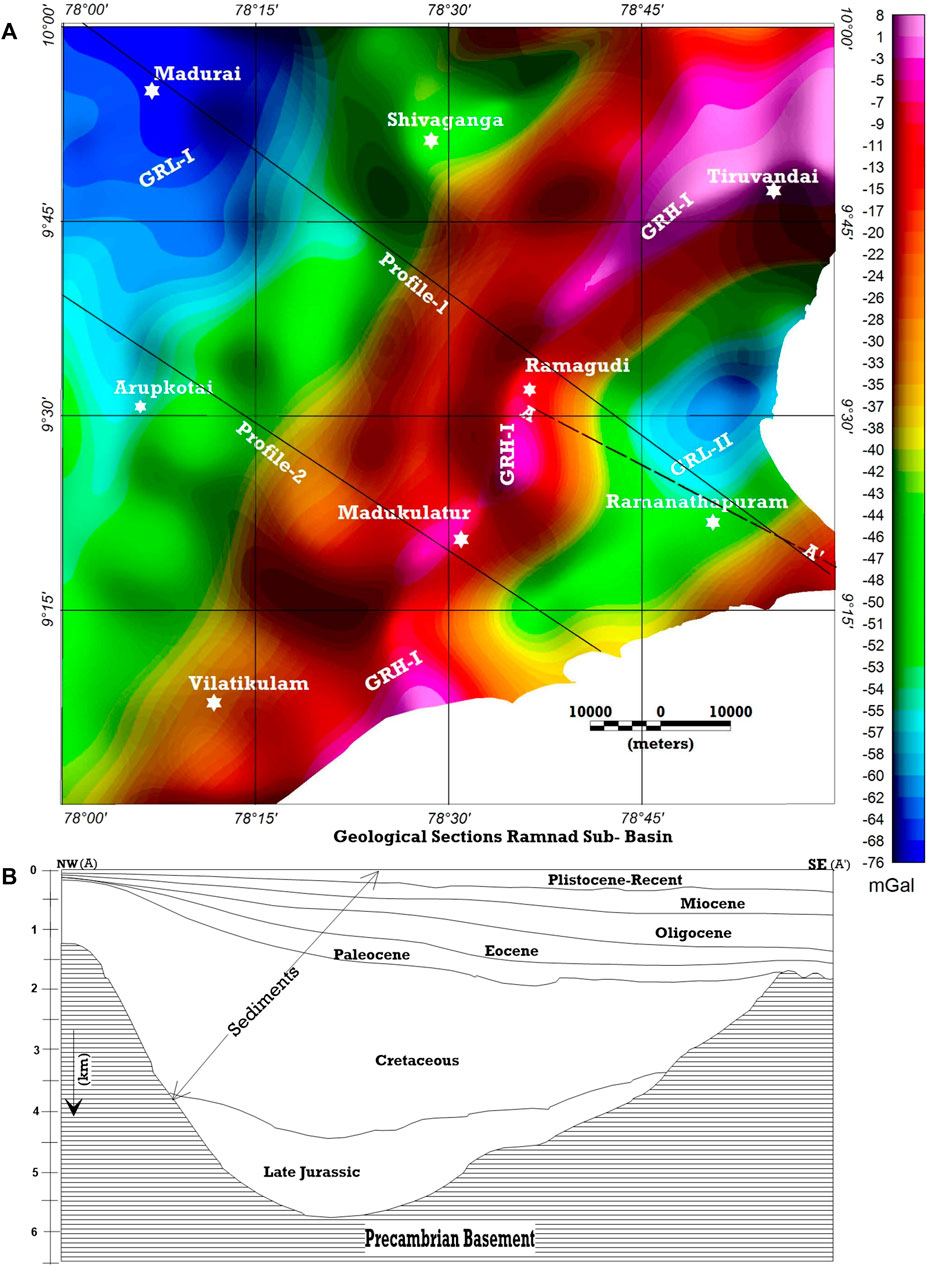
FIGURE 7. (A) Regional gravity anomaly map of the study area. See the NE-SW trending moderate-to-high gravity anomaly (GRH-I) zone and two gravity low zones (GRL-I and GRL-II). The gravity magnetic anomaly response over the outcrop geology was studied along the two profiles (Profile-I and Profile-II) indicated by black lines. (B) The available geological section (Chaudhuri et al., 2010) along A–A′ based on a bore well study is presented below.
The signature of the regional and residual Bouguer gravity anomalies, magnetic anomaly, and surface geology along two profiles was examined (Figure 8). The residual gravity profile shows a sinusoidal gravity anomaly pattern in the southeastern part under the sedimentary cover (Figure 8A, B). The anomaly pattern depicts a concealed ridge basin structure in the SE part of the study area. The regional gravity anomaly for Profile-1 (Figure 8A) shows a strong gravity high with a peak amplitude of −18 mGa l. The anomaly has a wavelength of approximately 70 km (Profile-1), which suggests the emplacement of a high-density plug at the mid-crustal level. This regional gravity high is followed by a regional gravity low (−60 mGal) of approximately 25 km wavelength in the SE, which indicates the presence of low-density granitoid within the basement. Additionally, a similar feature was also observed in Profile-2 (Figure 8B). The profile shows a Bouguer anomaly low over a regional gravity high extends in the southeast. The NW part of the profiles are dominated by high-frequency magnetic anomalies (Figure 8A, B), indicating the shallow presence of magnetic sources. In the south-eastern (SE) part, the low-frequency magnetic anomalies suggest the deeper occurrence of magnetic sources and the non-magnetic nature of the basement sediments underneath.
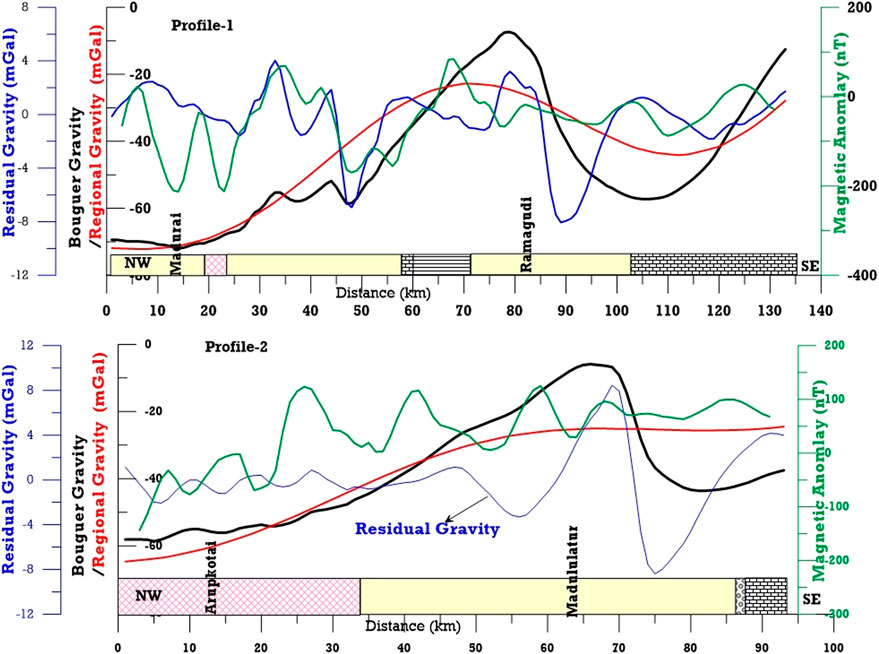
FIGURE 8. Gravity, regional gravity, residual gravity, and magnetic (RTP) response over the lithology along profiles one and 2 (Figure 7).
Bouguer gravity elevation relationship
The Bouguer gravity anomaly (BGA) bears a definite direct relationship with surface elevation, which depends on the subsurface density distributions and crust-mantle density difference (Verma and Mukhopadhyay, 1976). The BGA varies linearly with a negative regression coefficient (−112 mGa l/km) in a region with isostatic equilibrium; however, in some areas, non-linear relationships and a positive regression coefficient are also observed (Qureshy, 1971). In the present case, we have observed that gravity and elevation overall maintain an inverse relationship with a regression coefficient of −305.6 mGa l/km (Figure 9A). However, the data are segregated into two clusters. For surface elevations up to 25 m, the gravity data bears no distinct linear relationship with surface elevation; rather, the least-square fitted line shows a positive regression coefficient (932.2 mGa l/km). The gravity data for surface elevations of 25 m or more maintain an inverse relationship, with a negative regression coefficient of −483.6 mGa l/km. To analyze this observation, we undertook an isostatic study (Blakely RJ., 1996; Lowrie and Fichtner, 2020). The gravity field that originates due to the compensation of long wavelength topographic features is called an isostatic regional gravity field, which is manifested by Moho relief and also indicates the mechanical strength of the lithosphere. The gravity field that remains after subtracting the isostatic regional field from the Bouguer gravity field is known as an isostatic residual anomaly (Ussami et al., 1993; Kumar et al., 2011). The isostatic residual anomalies are caused by the intracrustal masses and sources that are not involved in isostatic compensation. Assuming the Airy–Heiskanen model for local isostasy, the crust-mantle interface was derived by using the formula.
where
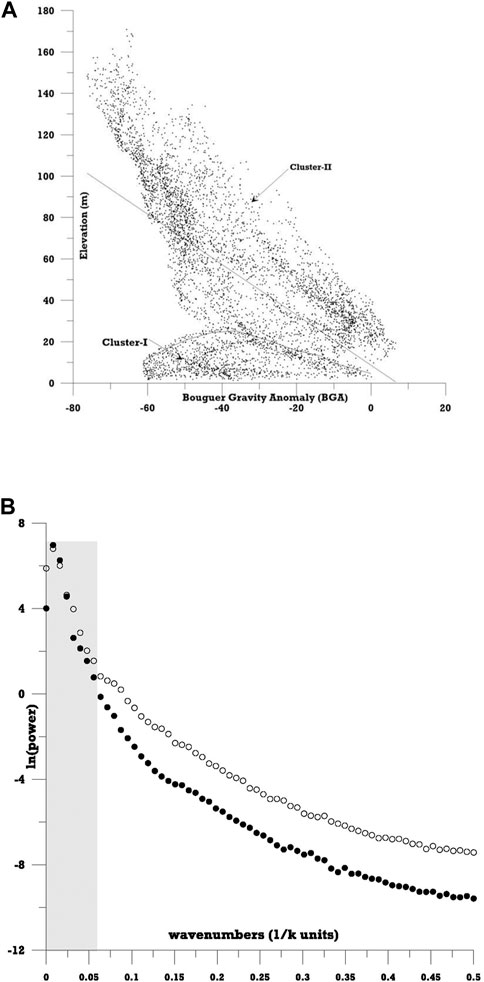
FIGURE 9. (A) Scatter diagram of station elevation against the Bouguer gravity anomaly (BGA) over the study area. The plot can be classified in two clusters (Cluster-I and Cluster-II). (B) Radially averaged power spectrum of the Bouguer gravity and topography over the study area. Note the increase in offset between the spectrums for wavenumbers more than 0.06 units.
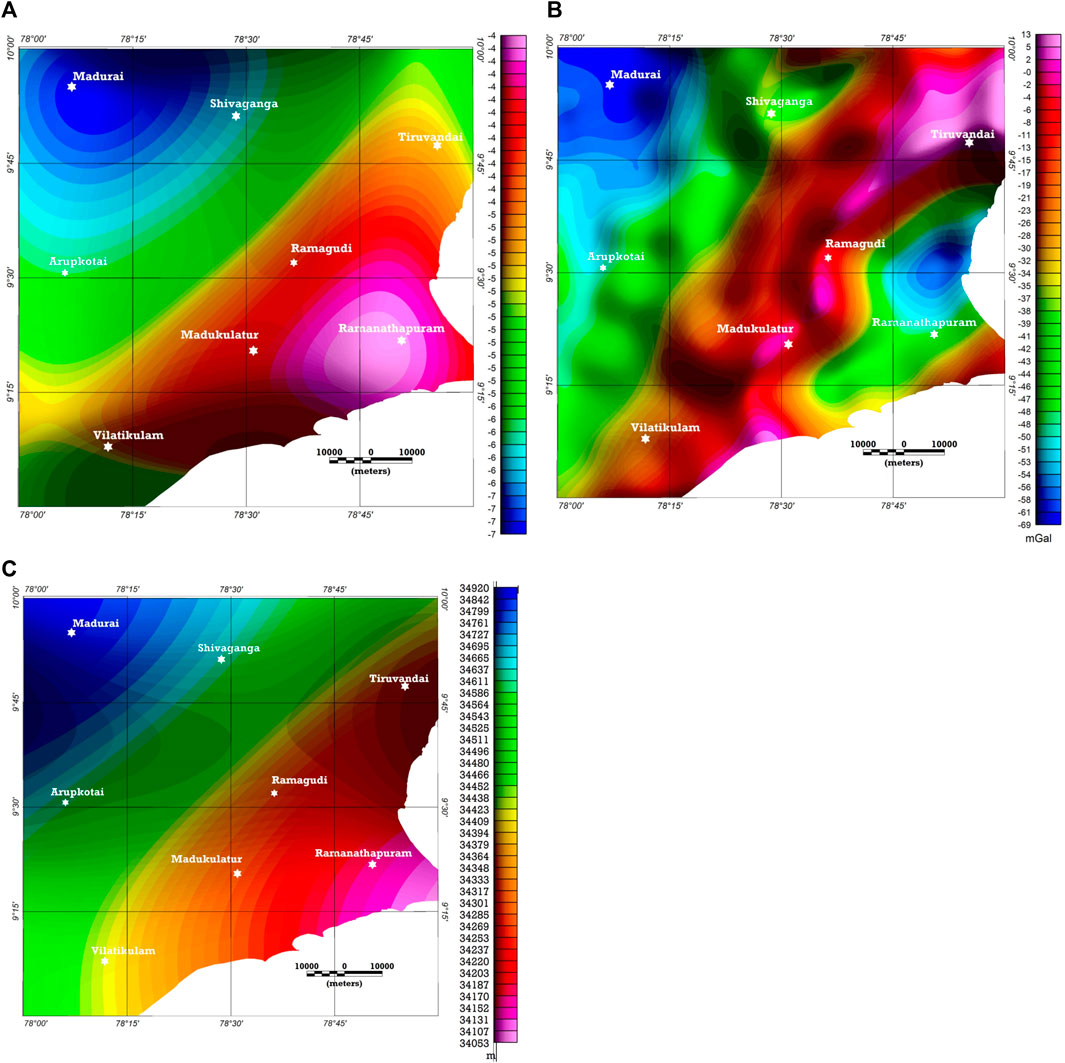
FIGURE 10. (A) Isostatic regional anomaly map. (B) Isostatic residual anomaly map. (C) Crustal thickness map.
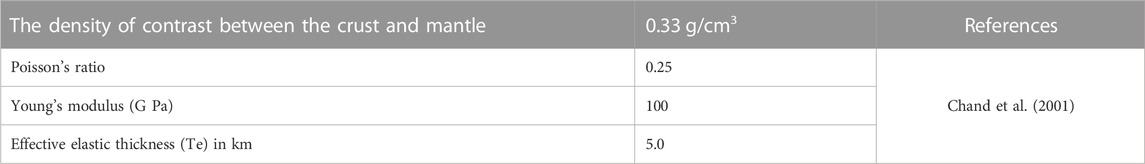
TABLE 1. Model Parameters considered for the Moho relief calculation.
Therefore, we may infer that the area bordered by a 25 m elevation contour is subject to emplacement of high-density masses, which are not part of the isostatic compensation. Furthermore, we studied the spectral relationship between surface elevation and gravity data (Figure 9B). The gravity data has a good coherence with surface elevation up to a wavenumber of 0.06 units. The shallow crustal units represented by a wavelength less than approximately 16.5 km may not have been involved in isostatic compensation.
2.5D gravity modeling
The 2.5D gravity modeling (Vasanthi and Santosh, 2021; Kumar et al., 2009) was performed along the profiles in C–C’ and D–D’ (Figure 3, Figure 11) to arrive at a realistic geological model. The geological section derived from gravity modeling suffers from non-uniqueness (Singh et al., 2014). However, if the model is constrained from any other independent data sets, the ambiguity reduces, which leads to a realistic geological model (Motaghi et al., 2014; Kumar et al., 2009). For gravity modeling, two parameters, i.e., the density and geometry of geological bodies, need to be calibrated. The densities of the representative rock samples were collected from the available reports (Table 2) of the Geological Survey of India (GSI).
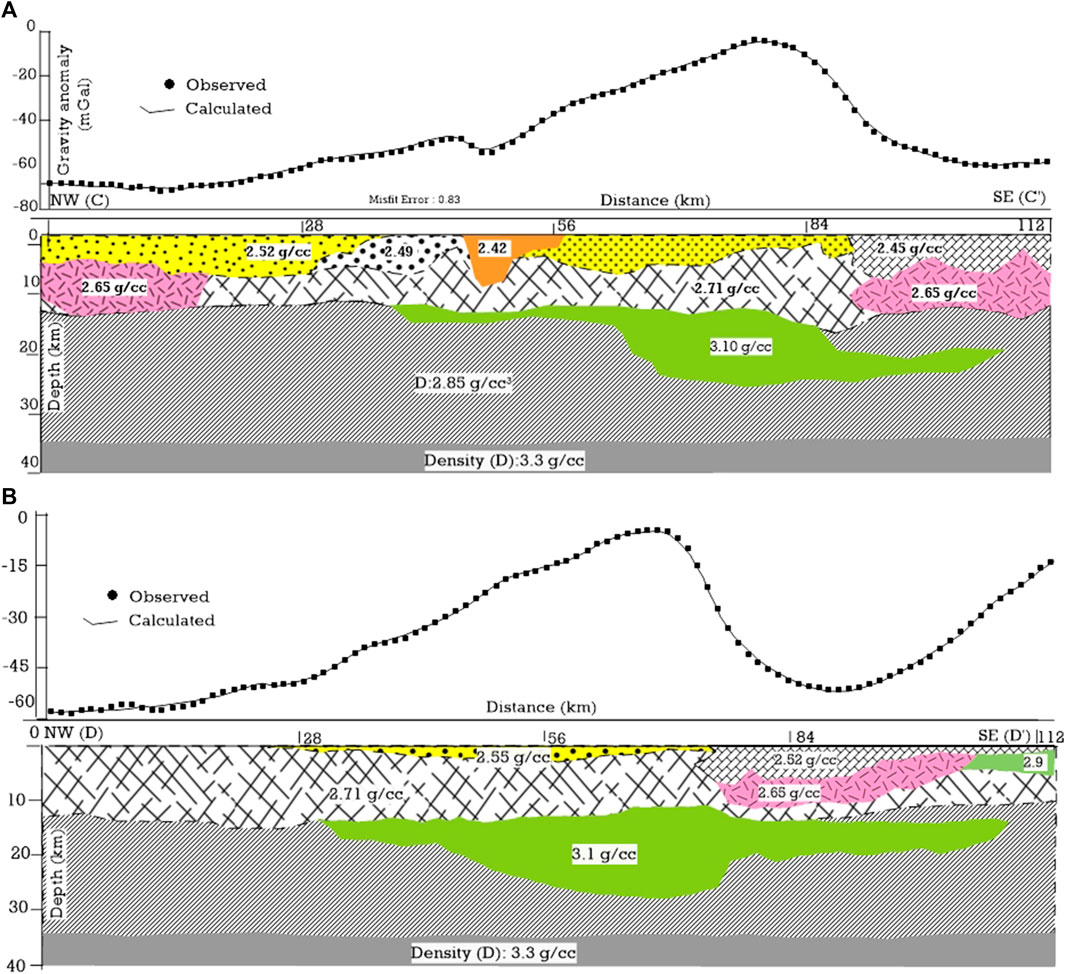
FIGURE 11. Gravity model along profiles C–C’ (A) and D–D’ (B).
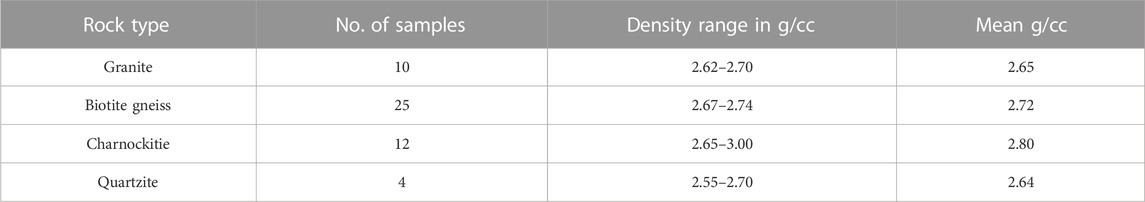
TABLE 2. Density values of the representative rock samples from the study area.
A northwest-southeast trending geological section (Figure 7) across the Ramnand basin shows that the basement depth varies from approximately 5.5 km–1.5 km (Chaudhuri et al., 2010). The basement of rock comprised Archean gneiss, granite, and other metamorphic rocks (Sastri et al., 1973); therefore, we have assumed a velocity of 6.2 km/s for the upper crust as it belongs to the Southern Granulite Terrane (SGT), and accordingly the basement density is considered as 2,720 kg m−3 (Sinha et al., 2015). The value was obtained from converting the reported seismic velocity (6.2 km/s) to density (Barton, 1986). The seismic velocity for the Cretaceous, Tertiary formations, and Quaternaries were not available. We have initially assumed a density of 2,450 kg m−3 (Lasitha et al., 2019) for the sedimentary formations, and this was increased or decreased systematically to match the observed and calculated gravity response.
The results from receiver function analysis enumerating the velocity structure of the crust are not available over the southern part of the ECMI or Cauvery Basin. The receiver function analysis over the Eastern Ghat Mobile Belt (EGMB) shows that crustal thickness varies from 38 to 36 km (Chaudhuri et al., 2016). An east-west trending seismic profile on the onshore region of the Cauvery basin shows a three-layer crustal segment (Sinha et al., 2016), with the upper and lower crust interface at 21 km. The upper crust dips towards the east with an average depth of 6 km underneath sediments. The mantle dips toward the west and the depth varies from 28 to 35 km from east to west. We have used the aforementioned information to set the initial crustal configurations. The velocity-depth relationship provided by Barton (1986) was used for the conversion of velocity to density. The seismic velocity in the upper mantle at the ECMI (Radhakrishna et al., 2012) for continental crust ranges from 8.1 to 8.2 km/s, and the density for the mantle is uniformly assigned as 3.3 g/cc. The reported lower crustal velocity over the southern part of the SGT is 7.1 km/s (Reddy et al., 2003); accordingly, the density value was assigned for the lower crust.
The central regional gravity high (Figure 6) bears a wavelength of approximately 70 km; at the same time from the spectral analysis, we have observed a density interface at 13.6 km, which argued for a deeper source, and accordingly, we have incorporated a high-density rock unit with an initial density value of 3,000 kg m−3, as we believe that the high-density body is sourced from the mantle. At the same time, isostatic studies suggest that the high gravity is not caused by an upward raised Moho in any way. Additionally, two low-density rock units were incorporated to account for regional gravity lows with an initial density value of 2,650 kg m−3.
We have calculated the gravity response of the model and compared it with the observed gravity profile; subsequently, the model was iteratively inverted until a satisfactory fit between the calculated response and the observed gravity was obtained (Figure 11A, B).
Discussion
The ECMI has a rifted passive margin that has evolved as a consequence of the separation of eastern Gondwanaland from Antarctica in the Early Cretaceous (Biswas et al., 1993; Figure 12). The present study shows the presence of the NE-SW elongated high-density rock at a depth of approximately 12 km, which extends to a depth of 23–24 km. The emplacement of high-density rock may be due to mafic underplating via mantle diapirism in a pull-apart rift system. The presence of a large volcanic province underlying the Bengal Basin, related to the exposed Rajmahal Trap volcanism at 118–110 Ma, is reported (Baksi, 1995, Figure 12.e) in ECMI India and corresponds to the breakup of greater India and Antarctica. The magmatic activities have been related to the Kerguelen hot spot, which was located under the India-Antarctica Sector for a long time (Behara et al., 2004, Figure 12). The emplacement high-density body may be related to magmatic activity at 118–110 Ma. Additionally, a similar kind of high-density high-velocity layer in the upper crust was reported in the Mahanadi Delta (Behara et al., 2004). The upwelling plume head of the Kerguelen hot spot had caused thermal perturbations and generated the extensional force. The high-density mafic material might have been transported to the shallow depth through weak zones/conduits and formed intrusively. The high-density rock may be alkaline in nature as the magnetic signature is not evident. The depth to the Curie-point isotherm is approximately 23 km in the Cauvery basin (Twinkle et al., 2016b).
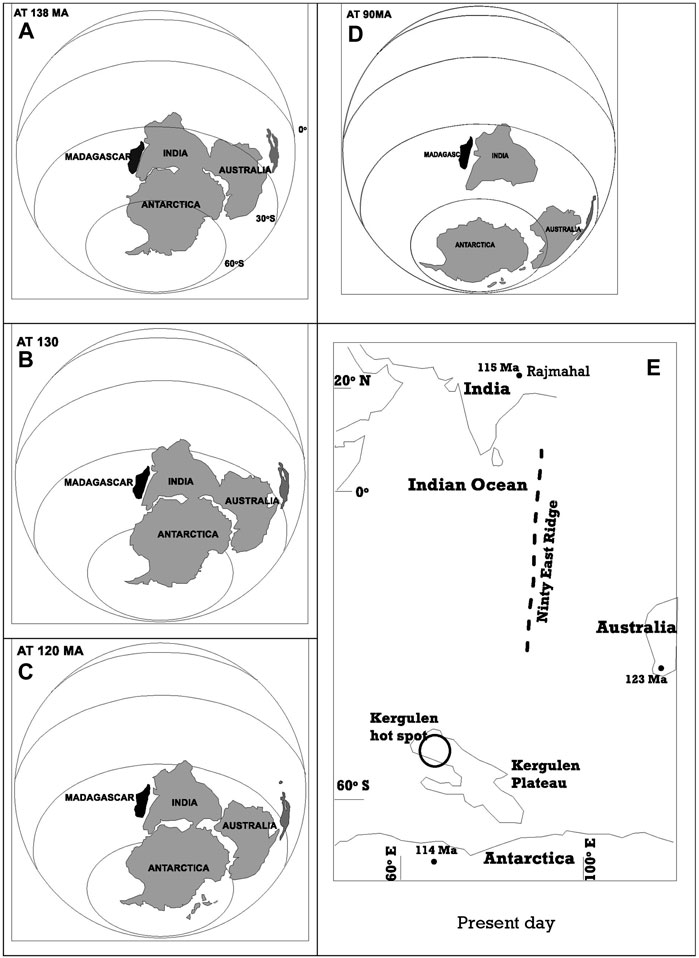
FIGURE 12. Present position of India, Antarctica, and Australia. Ages of dated basalts (in Ma). At ca. 120 Ma, the three continents were adjacent to the Kerguelen hot spot. From 115 to 40 Ma, India moved rapidly northward and the Ninety East Ridge marks the track of the hot spot on the Indian Plate. Inset: reconstruction of Greater India in Gondwana at 170 Ma based on the paleomagnetic studies (Figure modified from Frisch et al., 2011; van Hinsbergen et al., 2019).
A similar type of gravity anomaly has been observed over the Red Sea, which has evolved due to rift-related magmatic systems above a hotspot in the mantle (Almalki et al., 2015). A linear positive gravity anomaly extends along the crest of the Red Sea. The forward modeling of the gravity data shows the occurrence of a high-density body at the upper crust extending up to the lower crust (Izzeldin, 1987). The Aravalli-Delhi Mobile Belt (ADMB) in the northwestern part of India has evolved through rifting during the Proterozoic period. The gravity modeling shows the presence of a high-density domal-shaped body (3.04 g/cm3) extending from a depth of approximately 20–30 km (Mishra et al., 2000), which has been suggested to represent underplated mantle material at the lower crust emplaced due to upwelling in an extensional regime during the Proterozoic. The Cambay Basin is a marginal rift basin in the Western Continental Margin of India (WCMI) that has been affected by the Reunion plume–lithosphere interactions (Danda et al., 2020). A high-density (3.15 g/cm3) lower crustal rock unit, resulting from mantle upwarp and crustal thinning within the basin, was attributed for the observed gravity high over the basin (Tewari et al., 1991). The high-density bodies in the lower crust are generally found the world over in all periods (Baldridge et al., 1995). The “magmatic underplating” as suggested by the present study below Cauvery Basin is in agreement with similar observations along passive volcanic margins all over the world, many of them interpreted as “plume-induced” (Coffin and Eldholm, 1994).
The gravity studies also suggest the presence of low-density granitoid in the upper crust, which indicates bimodal volcanism (Figures 7–11). After the intrusion into the continental crust, the volcanic mantle melts generate acidic crustal melts, which can explain the bimodal distribution of magmatism. The low-density acidic magmas occur in graben regions of greater crustal extension and higher continuous magmatic activity (Frisch et al., 2011).
The SDR (Sea Dipping Reflector) is a common feature of volcanic passive margins worldwide (Mutter, 1985; Geoffroy, 2005; McDermott, 2019). The details of the signatures for identifying the SDR have been well described by Mutter (1985). We have analyzed a published reflection profile (Figure 13; Misra and Dasgupta, 2018) over the onshore area near to the study area. To the best of our knowledge, a published seismic profile over the offshore area of the Cauvery Basin is not available. In the seismic profile, we have identified the SDR and other features, such as the top of the continental crust and the top of the oceanic crust. Models of the origin of the SDR are widely debated but are associated with voluminous volcanic loading and predates, accompanies, or post dates continental break up (Mutter, 1985; Geoffroy, 2005). The presence of the SDR in the onshore area and the presence of high-density rock over the offshore area at the mid crust, as derived from the present level, strongly suggest a volcanic rifted margin.
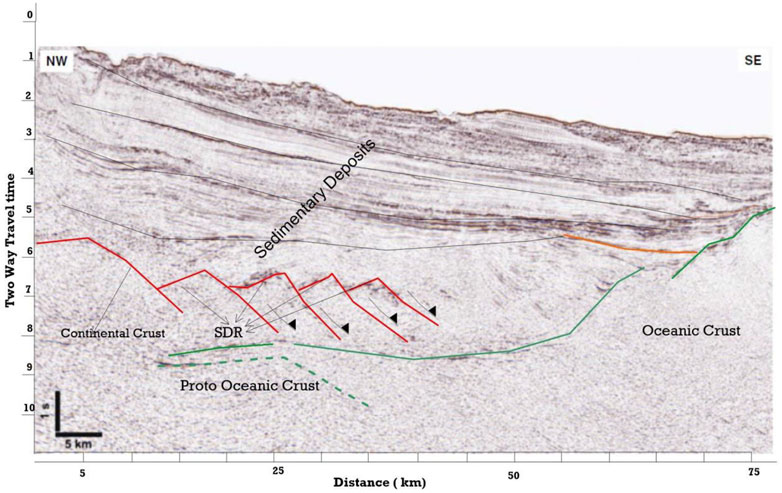
FIGURE 13. Seismic section along the seismic profile marked in Figure 1A.
The Grabens or rifts are narrow fault-bounded elongated structures developed in the continental lithosphere, where crust and lithospheric mantle is thinned. The present study shows an NE-SW trending ridge-depression structure (Figures 6–14) that might have formed due to stretching of the crust as a result of the emplacement of high-density rocks (Figure 11; Figure 14C). The gravity modeling (Figure 11) shows that the maximum depth to the Palk Strait depression is 3.8 km, which is bounded by another ridge-like structure to the east. Depression two in the western part of the Devakkottai-Mannargudi Ridge (DMR; Figure 6) may be the southern extension of the Thanjavur Depression (Figure 1B). The residual anomaly reveals the presence of at least another two ridges and depression structures in the west of the DMR and one of the depressions is very sharp, extending up to 5.8 km in depth, and might be a coal deposit. The concealed basement structural highs can act as an effective reservoir for hydrocarbons (Mazumder et al., 2019). The gravity map suggests the ridge depression structure extends approximately 80 km west from the shore. The NE-SW trending ridge depression structure divides the basin into a number of fault-bound ridges and sub-basin areas. The NE-SW trending structure that has shaped the morphology of the Cauvery Basin was associated with the separation of the India-Sri Lanka system from Antarctica and Australia during the Late Jurassic and Early Cretaceous (Mazumder et al., 2019).
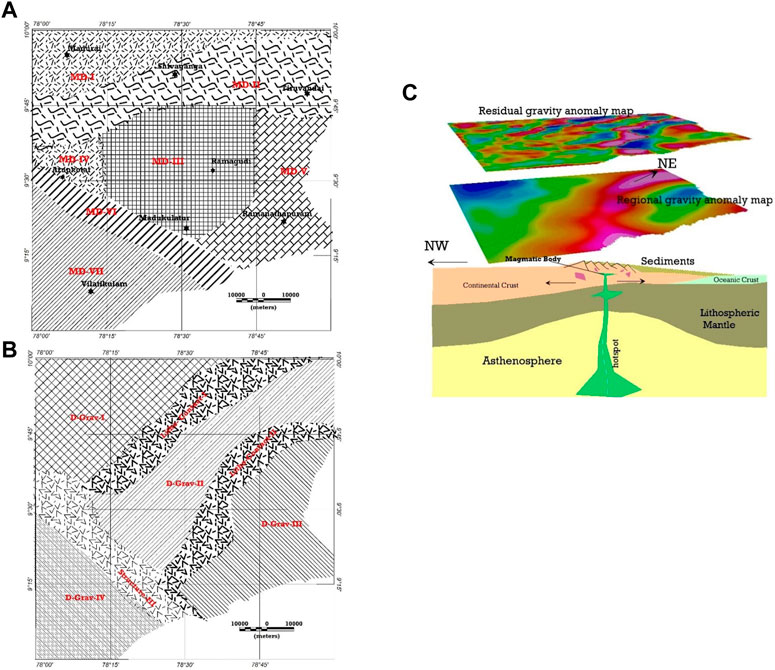
FIGURE 14. Interpreted shallow subsurface tectonic sketch of the southern part of the Cauvery Basin from magnetic (A) and gravity data (B, C) A cartoon illustration of the proposed evolution of the Cauvery Basin, indicating thick underplated material and the conjectural source marked by a plume head. The ridge-depression structure developed due to extensional forces.
The magnetic anomalies in the northern part exhibit two prominent E-W trending linear structures that are sympathetic to the trend of the Palghat Cauvery Shear Zone (PCSZ, Figures 1–4). The prominent linear structures may indicate the disposition of a shear zone underneath the Cauvery Basin, as the magnetic signature of the Palghat Cauvery Shear Zone is also similar. Additionally, the magnetic features may represent a dyke and the high-density lower crustal body may be the feeder unit. The E-W trending linear magnetic features indicate intense volcanism that has affected the entire crustal column. The ridge-depression structure is not reflected in the magnetic map. This suggests that the geological units that caused the ridge-depression structures do not exhibit appreciable lateral contrast in magnetic properties. The magnetic fabric in domains I, III, and V (Figure 4B) do not exhibit any predominant trend, suggesting that the basement is formed of granulitic rock. However, in magnetic domain IV, the N-S trending fabric is clear. This may indicate that the basement was affected by the episode’s N-S trending tectonism during the Late Carboniferous (Mazumder et al., 2019) and may also suggest the presence of N-S trending mafic supracrustal rock over the basement. A prominent NE-SW trending linear magnetic feature (F–F′, Figure 4A), which also corroborates the inferred structures from the residual gravity map (G–G′, Figure 6A), is a cross trending feature. The trend might have developed due to N-S strike-slip faulting and NE-SW rifting (Mazumder et al., 2019). The gravity and magnetic maps suggest NE-SW, N-S, and NW-SE are the major structural trends of the study area. Figure 4B; Figure 6B suggest that the Ramnathapuram Sub-Basin (domain IV, Figure 4B, and D-Grav-III, Figure 6B) can be easily identified in both maps. The NW-SE structural element (Figure 14A, B) is also well reflected in both maps, but the NE-SW trending gravity features are not well reflected in the magnetic map. The NE-SW trending features may indicate litho-contact, and magnetic properties may not vary laterally across the litho-contact.
A systematic magnetotelluric (MT) study and a seismological study integrated with the gravity-magnetic survey will bring out the comprehensive crustal architecture, fluid, thermal imprints, and magmatic processes at various depths.
Conclusion
This study reveals coast parallel ridge depression structures covered under Quaternary alluvium. The NE-SW trending structures are attributed to extensional tectonics or wrench faulting induced due to rifting of India and Antarctica during the Cretaceous. The depression structures have economic importance in terms of coal, and ridges can act as a reservoir of hydrocarbons. Based on the gravity magnetic anomalies, the study area is classified into several domains, which suggests the basement rock underneath the alluvium cover has different structural fabrics and each domain is bounded by faults/shear zones. The high-density plug that was emplaced at a mid-crustal level and the presence of SDRs in the onshore areas probably indicate a large-scale volcanic eruption that initiated the rift between India and Antarctica. The magnetic map reveals two prominent E-W trending linear structures that may indicate the disposition of a shear zone underneath sediments.
Data availability statement
The datasets presented in this article are not readily available because authors do not have the permission to share raw data. Requests to access the datasets should be directed to c2h1dmFnYW5ndWxpQGdtYWlsLmNvbQ==.
Author contributions
SG: Data acquisition, processing, interpretation, Software, Methodology, Writing–original draft. SP: Supervision, Writing–review and editing. All authors contributed to the article and approved the submitted version.
Acknowledgments
The authors wish to declare their appreciation of all the geophysicists of the GSI, SR who painstakingly collected the baseline geophysical data under the National Geophysical Mapping Programme (NGPM). We also gratefully acknowledge the kind permission from the Director General of the GSI to publish this work. Additionally, the authors express sincere thanks to Henglei Zhang, Editor, Frontiers in Earth Science, for the comprehensive review and suggested modifications that improved the initial draft.
Conflict of interest
The authors declare that the research was conducted in the absence of any commercial or financial relationships that could be construed as a potential conflict of interest.
Publisher’s note
All claims expressed in this article are solely those of the authors and do not necessarily represent those of their affiliated organizations, or those of the publisher, the editors and the reviewers. Any product that may be evaluated in this article, or claim that may be made by its manufacturer, is not guaranteed or endorsed by the publisher.
References
Almalki, K. A., Betts, P. G., and Ailleres, L. (2015). The Red Sea–50 years of geological and geophysical research. Earth-Sci. Rev. 147, 109–140. doi:10.1016/j.earscirev.2015.05.002
Baksi, A. K. (1995). Petrogenesis and timing of volcanism in the Rajmahal flood basalt province, north-eastern India. Chem. Geol. 21, 73–90. doi:10.1016/0009-2541(94)00124-q
Baldridge, M. S., Keller, G. R., and Braila, L. W. (1995). “Continental rifting a final perspective, continental rifts: Evolution, structure the tectonics,” in Development in geotectonics. Editor K. H. Olsen (Amsterdam, Netherlands: Elsevier), 453–459.
Barton, P. J. (1986). The relationship between seismic velocity and density in the continental crust—A useful constraint? Geophys. J. Int. 87 (1), 195–208. doi:10.1111/j.1365-246x.1986.tb04553.x
Bastia, R., Radhakrishna, M., Srinivas, T., Satyabrata, N., Nathaniel, D. M., and Biswal, T. K. (2010). Structural and tectonic interpretation of geophysical data along the Eastern Continental Margin of India with special reference to the deep water petroliferous basins. J. Asian Earth Sci. 39, 608–619. doi:10.1016/j.jseaes.2010.04.031
Behera, L., Sain, K., and Reddy, P. R. (2004). Evidence of underplating from seismic and gravity studies in the Mahanadi delta of eastern India and its tectonic significance. J. Geophys. Res. Solid Earth 109 (12), B12311. doi:10.1029/2003jb002764
Biswas, S. K., Bhasin, A. L., and Ram, Jokhan (1993). Classification of Indian sedimentary basins in the framework of plate tectonics. Proc. second seminar petroliferous basins India 1, 1–46.
Blakely, R. J. (1996b). Potential theory in gravity and magnetic applications. Cambridge, England: Cambridge University Press.
Blakely, R. J. (1996a). Potential theory in gravity and magnetic applications. Cambridge, England: Cambridge University Press.
Blundell, C. C., Armit, R., Ailleres, L., Micklethwaite, S., Martin, A., and Betts, P. (2019). Interpreting geology from geophysics in poly-deformed and mineralised terranes; the otago schist and the hyde-macraes shear zone. N. Z. J. Geol. Geophys. 62 (4), 550–572. doi:10.1080/00288306.2019.1579741
Chand, S., Radhakrishna, M., and Subrahmanyam, C. (2001). India–East Antarctica conjugate margins: Rift-shear tectonic setting inferred from gravity and bathymetry data. EPSL 185, 225–236. doi:10.1016/s0012-821x(00)00349-6
Chari, M. V. N., Sahu, J. N., Banerjee, B., Zutshi, P. L., and Chandra, K. (1995). Evolution of the Cauvery basin, India from subsidence modelling. Mar. Petrol. Geol. 12, 667–675. doi:10.1016/0264-8172(95)98091-i
Chaudhuri, A., Rao, M. V., Dobriyal, J. P., Saha, G. C., Chidambaram, L., Mehta, A. K., et al. “Prospectivity of Cauvery Basin in deep synrift sequences, SE India,” in Proceedings of the AAPG Search and Discovery Article, Denver, Colorado, USA, June2010.
Chaudhuri, K., Borah, K., and Gupta, S. (2016). Seismic evidence of crustal low velocity beneath eastern Ghat mobile Belt, India. Phys. Earth Planet. Inter 261, 207–216. doi:10.1016/j.pepi.2016.10.004
Coffin, M. F., and Eldholm, O. (1994). Large igneous provinces: Crustal structure, dimensions, and external consequences. Rev. Geophys. 32 (1), 1–36. doi:10.1029/93rg02508
Curto, J. B., Vidotti, R. M., Fuck, R. A., Blakely, R. J., Alvarenga, C. J., and Dantas, E. L. (2014). The tectonic evolution of the Transbrasiliano Lineament in northern Paraná Basin, Brazil, as inferred from aeromagnetic data. J. Geophys. Res. Solid Earth 119 (3), 1544–1562. doi:10.1002/2013jb010593
Danda, N., Rao, C. K., Kumar, A., Rao, P. R., and Rao, P. S. (2020). Implications for the lithospheric structure of Cambay rift zone, Western India: Inferences from a magnetotelluric study. Geosci. Front. 11 (5), 1743–1754. doi:10.1016/j.gsf.2020.01.014
de Castro, D. L., Fuck, R. A., Phillips, J. D., Vidotti, R. M., Bezerra, F. H., and Dantas, E. L. (2014). Crustal structure beneath the Paleozoic Parnaíba Basin revealed by airborne gravity and magnetic data, Brazil. Braz. Tectonophys. 614, 128–145. doi:10.1016/j.tecto.2013.12.009
Eldosouky, A. M., and Mohamed, H. (2021). Edge detection of aeromagnetic data as effective tools for structural imaging at Shilman area, South Eastern Desert, Egypt. Arabian J. Geosciences 14, 13–10. doi:10.1007/s12517-020-06251-4
Essa, K. S., Abo-Ezz, E. R., and Géraud, Y. (2021). Utilizing the analytical signal method in prospecting gravity anomaly profiles. Environ. Earth Sci. 80, 1–21.
Essa, K. S., Munschy, M., Youssef, M. A., and Khalaf, E. E. D. A. H. (2022). Aeromagnetic and radiometric data interpretation to delineate the structural elements and probable precambrian mineralization zones: A case study, Egypt. Min. Metallurgy Explor. 39 (6), 2461–2475. doi:10.1007/s42461-022-00675-0
Essa, K. S., Nady, A. G., Mostafa, M. S., and Elhussein, M. (2018). Implementation of potential field data to depict the structural lineaments of the Sinai Peninsula, Egypt. J. Afr. Earth Sci. 147, 43–53. doi:10.1016/j.jafrearsci.2018.06.013
Frisch, W., Meschede, M., and Blakey, R. (2011). “Continental graben structures,” in Plate tectonics (Berlin, Germany: Springer), 27–41.
Ganguli, S. S., Pal, S. K., Rao, J. V. R., and Raj, B. S. (2020). Gravity–magnetic appraisal at the interface of Cuddapah Basin and Nellore Schist Belt (NSB) for shallow crustal architecture and tectonic settings. J. Earth Syst. Sci. 129 (1), 1–17. doi:10.1007/s12040-020-1354-8
Ganguli, S. S., Pal, S. K., Singh, S. L., Rama Rao, J. V., and Balakrishna, B. (2021). Insights into crustal architecture and tectonics across Palghat Cauvery Shear Zone, India from combined analysis of gravity and magnetic data. Geol. J. 56 (4), 2041–2059. doi:10.1002/gj.4041
Ganguli, S. S., Mondal, S., Pal, S. K., Lakshamana, M., and Mahender, S. (2022). Combined analysis of remote sensing, gravity and magnetic data across moyar bhavani shear zone, southern granulite Terrane (SGT), India: Appraisals for crustal architecture and tectonics. Geocarto Int. 37, 13973–14004. doi:10.1080/10106049.2022.2086627
Geoffroy, L. (2005). Volcanic passive margins. Comptes Rendus Geosci. 337 (16), 1395–1408. doi:10.1016/j.crte.2005.10.006
Hamimi, Z., Eldosouky, A. M., Hagag, W., and Kamh, S. Z. (2023). Large-scale geological structures of the Egyptian nubian shield. Sci. Rep. 13 (1), 1923. doi:10.1038/s41598-023-29008-x
Izzeldin, A. Y. (1987). Seismic, gravity and magnetic surveys in the central part of the Red Sea: Their interpretation and implications for the structure and evolution of the Red Sea. Tectonophysics 143, 269–306. doi:10.1016/0040-1951(87)90214-9
Krishna, K. S., Laju, M., Bhattacharyya, R., and Majumdar, T. J. (2009). Geoid and gravity anomaly data of conjugate regions of Bay of Bengal and Ender by Basin, new constraints on breakup and early spreading history between India and Antarctica. J. Geophys. Res. 114 (B03102), 21. doi:10.1029/2008JB005808
Kumar, N., Singh, A. P., Rao, M. P., Chandrasekhar, D. V., and Singh, B. (2009). Gravity signatures, derived crustal structure and tectonics of Achankovil Shear Zone, southern India. Gondwana Res. 16 (1), 45–55. doi:10.1016/j.gr.2008.11.003
Kumar, N., Singh, A. P., and Singh, B. (2011). Insights into the crustal structure and geodynamic evolution of the southern granulite terrain, India, from isostatic considerations. Pure Appl. Geophys. 168, 1781–1798. doi:10.1007/s00024-010-0210-1
Laske, G., Masters, G., Ma, Z., and Pasyanos, M. E. (2012). CRUST1. 0: An updated global model of Earth’s crust. Geophys Res. Abs 14 (3), 743.
Lowrie, W., and Fichtner, A. (2020). Fundamentals of geophysics. Cambridge, England: Cambridge University Press.
Mazumder, S., Tep, B., Pangtey, K. K. S., and Mitra, D. S. (2019). Basement tectonics and shear zones in Cauvery Basin (India): Implications in hydrocarbon exploration. Tect. Struct. Geol. Indian context, 279–311. doi:10.1007/978-3-319-99341-6_9
McDermott, C., Collier, J. S., Lonergan, L., Fruehn, J., and Bellingham, P. (2019). Seismic velocity structure of seaward-dipping reflectors on the South American continental margin. Earth Planet. Sci. Lett. 521, 14–24. doi:10.1016/j.epsl.2019.05.049
Mishra, D. C., Singh, B., Tiwari, V. M., Gupta, S. B., and Rao, M. B. S. V. (2000). Two cases of continental collisions and related tectonics during the proterozoic period in India—Insights from gravity modelling constrained by seismic and magnetotelluric studies. Precambrian Res. 99 (3-4), 149–169. doi:10.1016/s0301-9268(99)00037-6
Misra, A. A., and Dasgupta, S. (2018). “Transform margin in the Cauvery Basin, Indian east coast passive margin,” in Atlas of structural geological interpretation from seismic images (Hoboken, New Jersey, United States: Wiley), 235–239.
Motaghi, K., Tatar, M., Priestley, K., Romanelli, F., Doglioni, C., and Panza, G. F. (2015). The deep structure of the Iranian Plateau. Gondwana Res. 28 (1), 407–418. doi:10.1016/j.gr.2014.04.009
Mutter, J. C. (1985). Seaward dipping reflectors and the continent-ocean boundary at passive continental margins. Tectonophysics 114 (1-4), 117–131. doi:10.1016/0040-1951(85)90009-5
Powell, C. M., Roots, S. R., and Veevers, J. J. (1988). Pre-breakup continental extension in East Gondwanaland and the early opening of the eastern Indian Ocean. Tectonophysics 155 (1-4), 261–283. doi:10.1016/0040-1951(88)90269-7
Qureshy, M. N. (1971). Relation of gravity to elevation and rejuvenation of blocks in India. J. Geophys. Res. 76 (2), 545–557. doi:10.1029/jb076i002p00545
Radhakrishna, M., Twinkle, D., Nayak, S., Bastia, R., and Rao, G. S. (2012). Crustal structure and rift architecture across the Krishna–Godavari basin in the central Eastern Continental Margin of India based on analysis of gravity and seismic data. Mar. Petroleum Geol. 37 (1), 129–146. doi:10.1016/j.marpetgeo.2012.05.005
Reddy, P. R., Rajendra Prasad, B., Vijay Rao, V., Sain, K., Prasad Rao, P., Prakash, K., et al. (2003). “Deep seismic reflection and refraction/wide angle reflection studies along Kuppam–Palani transect in the southern Granulite terrain of India,” in Tectonics of southern granulite terrain: Kuppam–palani geotransect. Editor M. Ramakrishnan (Kolkata, India: Geological Society of India Memoir), 79–106.
Saikia, U., Das, R., and Rai, S. S. (2017). Possible magmatic underplating beneath the west coast of India and adjoining Dharwar craton: Imprint from Archean crustal evolution to breakup of India and Madagascar. Earth Planet. Sci. Lett. 462, 1–14. doi:10.1016/j.epsl.2017.01.004
Sastri, V. V., Sinha, R. N., Singh, G., and Murti, K. V. S. (1973). Stratigraphy and tectonics of sedimentary basins on East Coast of peninsular India. AAPG Bull. 57 (4), 655–678.
Sastri, V. V., Venkatachala, B. S., and Narayanan, V. (1981). The evolution of the East Coast of India. Palaeogeogr. Palaeoclimatol. Palaeoecol. 36 (1-2), 23–54. doi:10.1016/0031-0182(81)90047-x
Singh, A., and Rao, G. S. (2021). Crustal structure and subsidence history of the Mannar basin through potential field modelling and backstripping analysis: Implications on basin evolution and hydrocarbon exploration. J. Petroleum Sci. Eng. 206, 109000. doi:10.1016/j.petrol.2021.109000
Singh, B., Rao, M. P., Prajapati, S. K., and Swarnapriya, C. (2014). Combined gravity and magnetic modeling over Pavagadh and Phenaimata igneous complexes, Gujarat, India: Inference on emplacement history of Deccan volcanism. J. Asian Earth Sci. 80, 119–133. doi:10.1016/j.jseaes.2013.11.005
Sinha, S. T., Nemčok, M., Choudhuri, M., Sinha, N., and Rao, D. P. (2016). The role of break-up localization in microcontinent separation along a strike-slip margin: the East India–elan bank case study. Geol. Soc. Lond. Spec. Publ. 431 (1), 95–123. doi:10.1144/sp431.5
Subrahmanyam, C., Thakur, N. K., Gangadhara Rao, T., Ramana, M. V., and Subrahmanyam, V. (1999). Tectonics of the bay of bengal: New insights from satellite-gravity and ship-borne geophysical data. Earth Planet. Sci. Lett. 171, 237–251. doi:10.1016/s0012-821x(99)00148-x
Telford, W. M., Telford, W. M., Geldart, L. P., and Sheriff, R. E. (1990). Applied geophysics. Cambridge, England: Cambridge University Press.
Teknik, V., Artemieva, I. M., and Thybo, H. (2023). Geodynamics of the central tethyan Belt revisited: Inferences from crustal magnetization in the anatolia-caucasus-black Sea region. Tectonics 42 (2), e2022TC007282. doi:10.1029/2022tc007282
Tewari, H. C., Dixit, M. M., Sarkar, D., and Kaila, K. L. (1991). A crustal density model across the Cambay basin, India, and its relationship with the Aravallis. Tectonophysics 194, 123–130. doi:10.1016/0040-1951(91)90276-x
Twinkle, D., Rao, G. S., Radhakrishna, M., and Murthy, K. S. R. (2016b). Crustal structure and rift tectonics across the Cauvery-Palar basin, Eastern Continental Margin of India based on seismic and potential field modelling. J. Earth Syst. Sci. 125 (2), 329–342. doi:10.1007/s12040-016-0669-y
Twinkle, D., Rao, G. S., Radhakrishna, M., and Murthy, K. S. R. (2016a). Crustal structure and rift tectonics across the Cauvery–Palar basin, Eastern Continental Margin of India based on seismic and potential field modelling. J. Earth Syst. Sci. 125 (2), 329–342. doi:10.1007/s12040-016-0669-y
Ussami, N., de Sá, N. C., and Molina, E. C. (1993). Gravity map of Brazil: 2. Regional and residual isostatic anomalies and their correlation with major tectonic provinces. J. Geophys. Res. Solid Earth 98 (B2), 2199–2208. doi:10.1029/92jb01398
van Hinsbergen, D. J., Lippert, P. C., Li, S., Huang, W., Advokaat, E. L., and Spakman, W. (2019). Reconstructing Greater India: Paleogeographic, kinematic, and geodynamic perspectives. Tectonophysics 760, 69–94. doi:10.1016/j.tecto.2018.04.006
Verma, R. K., and Mukhopadhyay, M. (1976). Tectonic significance of anomaly-elevation relationships in north-eastern India. Tectonophysics 34 (1-2), 117–133. doi:10.1016/0040-1951(76)90180-3
Keywords: gravity-magnetic, cauvery basin, eastern continental margin of India (ECMI), regional-residual analysis, gravity modeling
Citation: Ganguli SS and Pal SK (2023) Gravity-magnetic appraisal of the southern part of the Cauvery Basin, Eastern Continental Margin of India (ECMI): evidence of a volcanic rifted margin. Front. Earth Sci. 11:1190106. doi: 10.3389/feart.2023.1190106
Received: 20 March 2023; Accepted: 29 June 2023;
Published: 19 July 2023.
Edited by:
Henglei Zhang, China University of Geosciences Wuhan, ChinaCopyright © 2023 Ganguli and Pal. This is an open-access article distributed under the terms of the Creative Commons Attribution License (CC BY). The use, distribution or reproduction in other forums is permitted, provided the original author(s) and the copyright owner(s) are credited and that the original publication in this journal is cited, in accordance with accepted academic practice. No use, distribution or reproduction is permitted which does not comply with these terms.
*Correspondence: Shuva Shankha Ganguli, c2h1dmFnYW5ndWxpQGdtYWlsLmNvbQ==, c2h1dmEuZ2FuZ3VsaUBnc2kuZ292Lmlu